
Abstract
Photophobia (fear of light) occurs in a wide range of ophthalmic, neurological and behavioural conditions, the most common of which is migraine. The visual discomfort associated with migraine can occur not only in response to bright light but also flicker, spatial pattern and colour. The principles that underlie the discomfort are explored and methods to reduce it are proposed.
1. Principles of photophobia
Recent evidence suggests that visual discomfort occurs when the characteristics of the retinal image are unnatural and when sensory thresholds are low.
The human visual system has evolved to process scenes from nature. Scenes from nature have a particular statistical structure. For example, they have (1) little flicker, (2) an anisotropic orientation spectrum 1 (contours in some orientations are more frequent than in other orientations), (3) a modest chromatic contrast 2 and (4) their luminance has a Fourier amplitude spectrum that decreases with increasing spatial frequency according to the reciprocal of frequency.3–5 In all these four respects, images that have unnatural properties are generally uncomfortable to look at, as will be shown. Conversely, paintings with high aesthetic value tend to follow the amplitude spectrum of natural scenes. 6
1.1 Flicker
Individuals with migraine are particularly susceptible to flicker and generally exhibit a large cortical response. 7 As frequency is increased, there comes a point at which the temporal variation in light ceases to be visible, so-called flicker fusion. 8 Even though the temporal variation cannot then be seen as flicker, it can still be seen as spatial variation9,10 and it can evoke headaches. 11 A rapid change of gaze (saccade) can move the eyes at velocities of up to about 700 degrees/second. 12 When a small flickering light source is swept across the retina by such a saccade, the source appears as a succession of points known as the phantom array. 13 The temporal frequency limit at which the array is visible averages 6 kHz, 9 but can be as high as 11 kHz in observers who report eye strain in everyday life. 9 The upper frequency limit of susceptibility to the phantom array correlates with susceptibility to eye strain, which raises the possibility that very high-frequency flicker may have deleterious health effects. Such effects might arise because perception during a saccade is used by the brain to guide eye movements, 14 and the phantom array may interfere with this mechanism.
The advent of LED lighting has provoked a re-consideration of the problems posed by flicker, which had been reduced by the introduction of electronic control circuitry for gas discharge lighting. LEDs are fast devices and any unsuppressed ripple from the a.c. electricity supply appears in the light output. Sometimes the light flickers because of dimmers used to control the light output level. Sometimes the light is pulsed for information transmission. 15 Temporal variation in light can easily be suppressed with the appropriate design of LED driver, but only by the use of components that may shorten the lifespan of the circuitry. Various market surveys have shown that the retail price of lamps with no appreciable temporal variation is no greater than those with variation that resembles that from fluorescent lighting with a magnetic ballast – known to be a health hazard. Under these circumstances, it seems sensible to apply the precautionary principle and introduce legislation to reduce temporal variation to the minimum practicable. It is not appropriate to admit levels of variation that are just tolerable, only to find out later that they are in fact detrimental to health, as occurred with fluorescent lighting.
1.2 Orientation and amplitude spectra
There are now many studies showing that natural images have a Fourier spectrum in which the amplitude decreases with the reciprocal of spatial frequency, 1/f, (see Figure 1).
16
When images have an amplitude spectrum that departs from 1/f they are generally perceived as uncomfortable.17–19 Using band-pass filtered visual noise with variable orientation and spatial frequency, Ogawa and Motoyoshi
1
demonstrated that ratings of unpleasantness decreased with spatial frequency bandwidth. Modulations in the amplitude spectrum of 1/f noise along the dimension of spatial frequency increased unpleasantness. Both the decrease in bandwidth and the modulation increased the departure from 1/f and increased unpleasantness. Modulations along the dimension of orientation decreased unpleasantness, however. Natural scenes tend to have uneven spectra along the orientation dimension so the results all support the idea that image deviation from the spectral regularity of natural scenes gives discomfort. Moving a photometer along the white bar in the photograph in the upper panel gives the luminance profile shown in the inset. The profile is graphed in the top curve. The Fourier components numbered 1–4 sum together to give this luminance profile. Their amplitude and spatial frequency are shown in the lowest graph. A slope between −0.8 and −1.5 is typical of scenes from nature.
5

Striped patterns are extremely unnatural, have an unnatural Fourier amplitude spectrum and induce discomfort and perceptual distortions of colour, shape and motion. Individuals with migraine are particularly susceptible to the distortions, 20 which are thought to reflect the cortical hyperexcitability20,21 with which migraine is associated.
1.3 Colour contrast
With simple patterns of alternating coloured stripes, both the discomfort from the pattern and the size of the cortical response it evokes can be predicted. The discomfort is predictable not from the particular colours involved as much as from the difference between their CIE UCS 1976 chromaticities:22–25 the greater the difference, the greater the discomfort and the greater the cortical response.22,24
Penacchio et al. 2 have shown that the same considerations apply to more complex images such as contemporary non-representational works of art. They measured the differences in CIE UCS 1976 chromaticity between the pixels in the image, and averaged the local differences for all pixels. This simple index predicted judgements of discomfort. Natural scenes tend to have modest colour contrast. These results therefore add further support to the idea that deviation from the statistics of natural scenes gives unpleasant images.
1.4 Neural response
The visual system uses a sparse code such that few neurons fire at any given time, thereby conserving metabolic energy.26,27 Computational models of the visual system suggest that unnatural patterns such as stripes reduce the sparseness, increasing ‘neural’ activity. 28 Consistent with the behaviour of the computational models, images that are rated unpleasant, including monochromatic stripes,29,30 chromatic stripes22,24,31 and urban scenes 32 evoke a large cortical response. The response has been measured by functional magnetic resonance imaging, 29 near infrared spectroscopy22,31 and electroencephalogram (EEG), 24 reviewed here. 33
1.5 Sensory thresholds
The second important factor in discomfort is also related to the strength of the neurological response but from a different perspective. Visual attributes of natural scenes can be associated with low sensory thresholds,37,38 but in general, uncomfortable stimuli share characteristics of stimuli with low sensory thresholds. For example, (1) diffuse flicker is most unpleasant at 10–20 Hz, the temporal frequencies at which it can be seen most readily at low contrast (Figure 2),
39
and (2) a square-wave grating has a contrast threshold that is minimal at about 3 cycles/degree,
40
the same spatial frequency at which discomfort is maximal when the grating has high contrast.
20
Although stimuli become uncomfortable only when they are well above sensory threshold, the parameters of discomfort and sensory thresholds tend to co-vary (Figure 2). Presumably this reflects the spatial, chromatic and temporal tuning of the early visual system – it is easier to obtain a strong cortical response (and associated discomfort) when the parameters are such that the stimulus is most readily transduced. The larger the area of the retina stimulated the greater the cortical response, but the size of the response is determined by the cortical magnification factor: the centre of the visual field gives a larger response than the periphery.
20
Individuals with cortical hyperexcitability, such as those with migraine are likely to be particularly affected because of the hyperexcitability.
21
The proportion of patients with photosensitive epilepsy exhibiting a photoparoxysmal EEG response to flicker (continuous line)
35
; the proportion of trials in which illusions of colour are reported by healthy observers in response to flicker (broken line)
36
and the threshold contrast at which the flicker can just be perceived (dotted line),
37
all shown as a function of the frequency of the flicker. The illusions of colour are often accompanied by discomfort and aversion.
36

2. Treatment of photophobia
In the United States, photophobia is sometimes treated using the FL41 tinted lens: in one clinic, the FL41 tint was prescribed in almost half of photophobic patients, with two thirds of those who used it reporting benefit.
41
The FL41 lens was first designed as a means of reducing the flicker from fluorescent lighting in the days when lamps with a halophosphate phosphor were controlled by magnetic ballast.
42
The gas discharge in the lamp provided light at the short-wavelength end of the spectrum, and the remainder of the light spectrum was provided by the phosphor coating that fluoresced, converting the ultraviolet light from the gas discharge to longer wavelength visible light. The phosphor was persistent and retained much of the light from one gas discharge to the next.
43
The discharge occurred twice with each cycle of the a.c. 50 Hz electricity supply, so the resulting 100 Hz flicker consisted mainly of short-wavelength light. When it was discovered that the flicker was responsible for headaches,
11
the FL41 tint was developed to reduce the modulation depth of the flicker. The tint attenuated short-wavelength light, transmitting 10% between 400 and 500 nm and increasing to 90% at 700 nm
42
(Figure 3), thereby reducing the modulation depth of the flicker. At the time, it was effective at reducing headaches in childhood,
44
presumably because of the widespread use of magnetically ballasted classroom lighting.
45
Spectral transmission of the FL41 lens.
43

In the 30 years, since the design of the FL41 the halophosphate coating on fluorescent lamps has been superseded by more efficient television phosphors that exhibit comparatively little persistence, and the circuitry controlling the lamps has largely been replaced by electronic ballasts, greatly reducing the 100 Hz flicker. The FL41 should now have no part to play in reducing flicker, and yet it continues to be advocated in the treatment of photophobia.41,46 This appears to be partly because the tint attenuates light at that portion of the visible spectrum at which the intrinsically photosensitive retinal ganglion cells (ipRGCs) are most sensitive, 47 and in 2010, the ipRGCs were linked to photophobia. 48
Since 2010, there have been five reviews of photophobia,49–53 generally accepting the idea that the ipRGCs play a role, a seductive viewpoint given that the ipRGCs are the only photoreceptors that encode absolute light levels. 54 Yet the authors responsible for the original reports have changed their position, arguing that in migraine photophobia the cones 55 and the rods 56 are involved. Although the ipRGCs might play a role in sensitivity to bright light, 57 it is difficult to see how their activity can explain the sensitivity to flicker, 58 pattern 59 and colour 25 that occurs in migraine. Instead, it is parsimonious to attribute the sensitivity to the cortical hyperexcitability with which migraine is associated. 21 The hyperexcitability can explain the sensitivity to flicker, pattern and colour because of the relatively large haemodynamic response in migraine.21,29 The hyperexcitability can also explain the sensitivity to bright light. This is because Bargary et al. 60 have shown that individuals who are particularly susceptible to discomfort glare exhibit a large blood oxygen-dependent response in cortical areas, consistent with their discomfort. So it is currently uncertain as to whether the FL41 is useful in treating photophobia simply because it attenuates the short-wavelength light that excites the ipRGCs. 61
2.1 Stripes
As has been shown earlier, patterns of stripes can be uncomfortable, particularly when the spatial frequency is between 1 and 8 cycles/degree. Individuals with migraine are particularly susceptible to stripes – indeed their response to a striped pattern can be used to complement their diagnosis.
59
Stripes are pervasive in the modern urban environment, and they can lead to discomfort.
62
Figure 4 provides two examples of ceilings with unacceptable stripes. One way of treating photophobia is to reduce the use of stripes in architectural design. Most such stripes have sufficient contrast to be problematic, particularly when their spatial frequency is within one octave of 3 cycles/degree.
62
Two examples of ceilings with aggressive patterns
2.2 Lighting chromaticity
In accordance with Planck’s law, when a black body is heated it glows red, orange, yellow, white and eventually blue as its temperature increases, and the temperature therefore provides a means of specifying the colour of a light source, whether natural or artificial. Most natural and artificial sources of illumination lie close to the Planckian locus; the daylight locus differs marginally but only at high colour temperatures.
In two studies,63,64 participants were given the opportunity to select a colour of light comfortable for reading. The studies used the Intuitive Colorimeter,
65
a simple optical device that illuminates text with coloured light in such a way that the hue (huv) and saturation (suv) can be manipulated separately, keeping luminance approximately constant. The choice of colour (gamut) was wide-ranging, including strongly saturated colours of any hue. The most comfortable colour was selected using a method that allowed for colour adaptation. The saturation at a given hue was increased over a period of 5 seconds, and then after 5 seconds, decreased again, returning the colour to white over a further 5 seconds. This process was repeated at each of 12 hues evenly spaced around the hue circle in the CIE UCS diagram, so as to shortlist the hues that were preferred to white. The saturation was then optimised at each of the shortlisted hues and the resulting optima compared successively, identifying the best. Small increments and decrements in hue and saturation were then compared to ratify the final choice.
66
Despite the complexity involved in the process of selection, healthy controls tended to choose a chromaticity close to the Planckian locus, some choosing light of a yellow hue, some white and some bluish, but all close to the Planckian locus. In contrast, individuals who experienced migraine with aura tended to choose strongly saturated light, distant from the Planckian locus. This was the case in two studies with different examiners and different participants,63,64 (Figure 5).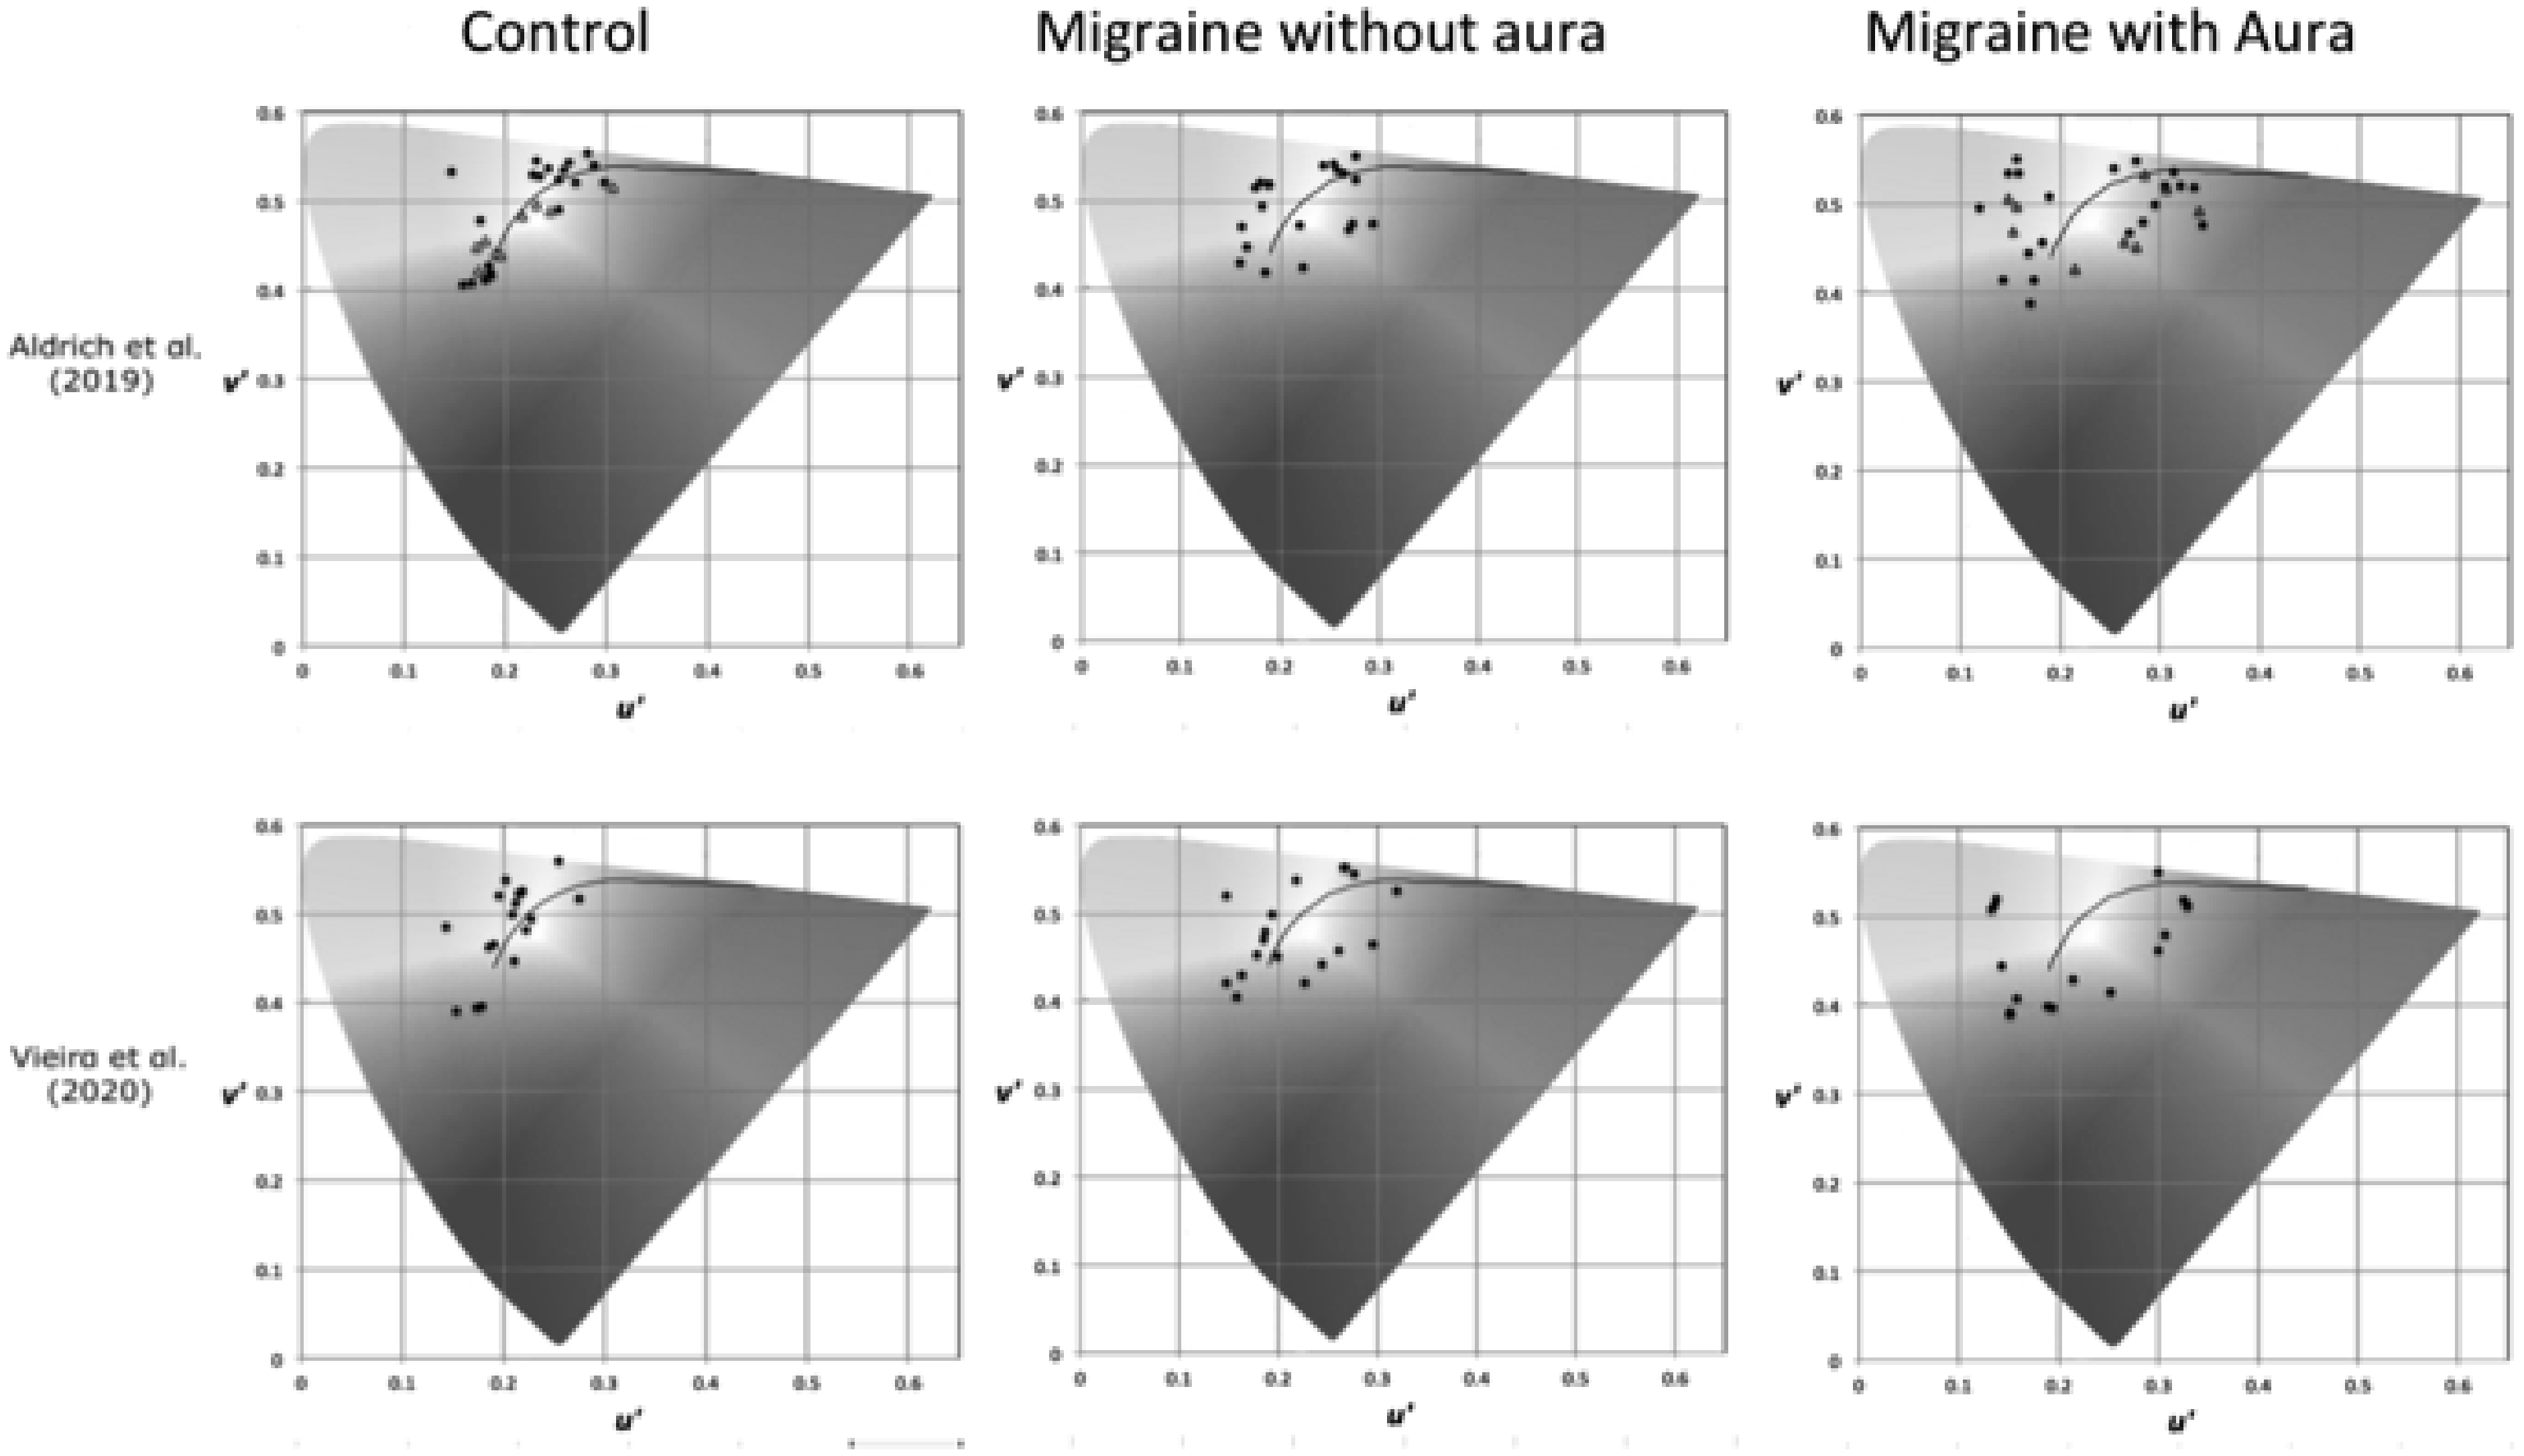
The implication of this finding is that individuals with migraine aura rarely experience lighting with a chromaticity they find comfortable, unlike their migraine-free counterparts for whom conventional lighting has an acceptable chromaticity. The spectral power of the chosen light did not show any relationship to the spectral sensitivity of the ipRGCs. 64 Nevertheless, the choice of strongly saturated coloured light helps to explain the continuing use of the FL41 tint: evidently, some people with migraine will prefer the strongly saturated colour and reduction in luminance it offers (although they would often find light with other hues even more comfortable).
The chromaticities chosen by the individuals with migraine aura were all distant from the Planckian locus, but they were all very different one from another. These individual differences appear to be stable, at least in symptomatic individuals. Aldrich et al. 67 measured the preferred chromaticity twice under conditions in which the examiners were masked and different versions of the Intuitive Colorimeter were used. The standard deviation of the selected CIE UCS 1976 chromaticities was 0.02. 67
Although the choice of chromaticity by individuals with migraine was highly un-natural, it may perhaps be explained by the reduction in average chromaticity differences that it affords, given that images with large differences tend to be uncomfortable, 2 and coloured light or coloured lenses will reduce the average difference. Perhaps this is why the FL41 continues to be used, although lenses with individually designed spectral transmission are likely to be clinically more effective.68,69
3. Conclusion
In this paper, photophobia has been conceived as an aversion to visual stimulation of various kinds. This aversion, when pronounced, can lead to a phobia in the more general sense of the term and result in isolation and even agoraphobia. 70 The visual stimulation from nature is generally comfortable on the eyes and brain, but electric light sources can be uncomfortable because they differ from daylight with respect to both their temporal and their spatial properties. The chromaticity of lighting can increase or decrease comfort but in ways that differ from one individual to another. The contemporary challenges for the lighting designer are (1) to select steady lighting from among the plethora of lamps and drivers that claim to be ‘flicker-free’ but are sometimes no more free of flicker than magnetically ballasted fluorescent lighting; (2) to find a way of illuminating rooms without banks of luminaires that form stripes, and without ceiling panels that are patterned; (3) to offer task lighting with selectable chromaticity for those that need it.
Footnotes
Declaration of conflicting interests
The author declared the following potential conflicts of interest with respect to the research, authorship, and/or publication of this article: The author invented the Intuitive Colorimeter when he was employed by the Medical Research Council. He has donated emoluments from sales of the latest model to the University of Essex.
Funding
The author received no financial support for the research, authorship, and/or publication of this article.