
Abstract
Chromatic properties of the effective light in a space are hard to predict, measure and visualise. This is due to complex interactions between materials and illuminants. Here, we describe, measure and visualise the effects of inter-reflections on the structure of the physical light field for diffusely scattering scenes. The spectral properties of inter-reflections vary as a function of the number of bounces they went through. Via a computational model, these spectral variations were found to be systematic and correspond with brightness, saturation and hue shifts. We extended our light-field methods to measure and understand these spectral effects on the first-order properties of light fields, the light density and light vector. We tested the model via a set of computer renderings and cubic spectral illuminance measurements in mock-up rooms under different furnishing scenarios for two types of illuminants. The predicted spectral variations were confirmed and indeed varied systematically within the resulting light field, spatially and directionally. Inter-reflections predominantly affect the light density spectrum and have less impact on the light vector spectrum. It is important to consider these differential effects for their consequences on the colour rendering of 3-dimensional objects and people.
1. Introduction
How can we completely describe the light in a space and understand its interactions with that space? The interaction between light and objects shapes the lighting distribution and determines scene appearance. Objects in common conditions are illuminated by both direct light sources and indirect light originating from secondary and higher-order sources, that is, light that is (inter-)reflected, scattered and refracted. Hence, the effective light in a space is usually complex, varying directionally, spatially and spectrally. In former work, our lab addressed how the spatial and directional structure of the light field can be described, measured and visualised in perceptually relevant ways.1–4 In the current study, we extend these methods to the spectral domain, and we model the effects of inter-reflections in coloured spaces to understand its basic mechanisms impacting the spectral light-field structure.
The effective light can be described as a light field; the spectral power distribution (SPD) (E) for a given wavelength λ, arriving from a direction (θ, φ) at a point (x, y, z) in the scene.5–9 This real-valued spherical function describes the entire distribution of spectral power within the volume of the space. This function thus captures all optic information available in the space, including both the angular, spatial and spectral power variations.
The light field can be described in a tractable, physically and perceptually meaningful manner via a spherical harmonics approximation,2,4,10–12 a Fourier-like decomposition for spherical functions. In this approach, the optical structure of the light field can be represented as a combination of components of different mathematical orders, which were found to represent physically and perceptually meaningful entities, that is, the light density, the light vector, the squash tensor, and statistical summary of the higher-order angular frequencies, plus their spatial variations. The light density, the zeroth-order light-field component, is a scalar property that can be measured by integrating the spectral power over all directions. The first-order light-field component, the light vector, indicates the direction of net transport of radiant energy. The spatial variation of the light vectors is referred to as light flow. The ratio between the light vector and light density provides an estimate of diffuseness. 1 The light density, light flow and light diffuseness form an integrated complete description of the lowest-order properties of the light field distribution in a three-dimensional space, 12 which are directly related to our perceptions of the average illuminance, light direction, diffuseness, flow and zones13–15 and indirectly to our perceptions of space, shape, materials and textures.16–22 The light squash and higher-order light-field statistics are directly related to scene cohesion and gist 23 and indirectly to, for instance, material perception.9,24,25
In natural scenes, the diffuse scattering mode forms a significant contribution to the bidirectional reflectance distribution function (BRDF) of most materials.26,27 (In a first-order approach, a BRDF can be approached as a linear combination of scattering modes). For matte or Lambertian materials, scattering diffusely, the BRDF acts as a low-pass filter on directional variations in the light field. Consequentially, in scenes primarily containing matte (Lambertian) materials, and scenes containing materials with a significant diffuse scattering mode (which applies to most natural scenes), the appearance is determined predominantly by the low-pass components (up to the second order: light density, light vector and squash tensor) of the incident light. 28 The second-order light field structure can be measured by a dodecahedron shaped plenopter. 12 However, the resulting light-squash data is currently still hard to interpret and use in practical lighting design. With a cubic illumination metre, we can measure up to the first-order light-field structure,1,29 and human observers can perceive and adjust the light density and light vector, both separately and simultaneously.3,13,30 Representation of the light field up to its first order (light density and vector) still explains 94% of the appearance variations for Lambertian surfaces.31,32 Therefore, we employed the first-order approach for its practicality and ease of implementation with the current state of the art.
Inter-reflection refers to reciprocally reflected light from non-luminous surfaces, creating secondary sources. It is a common optical phenomenon occurring in concavities in natural scenes, for instance, corners between walls, ceiling and floor, or between objects and the ground they are on. The SPD of inter-reflected light is dependent on the SPD of the light source and the spectral reflectance function (SRF) of the reciprocally reflecting surfaces. Undergoing many light reflections between mutual surfaces, the SPD undergoes a non-uniform and non-linear transformation except for perfectly neutral reflecting surfaces. Figure 1 shows an example of an ocre coloured room – which has high reflectivity in the long-wavelength part of the spectrum and low in the short- and middle-wavelength range. E2 was measured in the corner and showed the influence of the (inter-)reflections, compared to E1, which was measured in the centre, under the white source. Spectral power attenuation is exponential and relatively strong for wavelengths, where the surface displays low spectral reflectivity (Figure 1, E2, the left part). High spectral reflectivity, in contradistinction, results in insignificant attenuation (Figure 1, E2, the right part). Due to this non-uniform and non-linear spectral power attenuation in the presence of inter-reflections, the light field in non-neutrally coloured spaces will show spatial and directional spectral variations.33–37 An example of chromatic inter-reflection effects. (a) Photograph of a box space with a uni-chromatic ocre finish illuminated by white light. (b) Two of the illuminance spectra measured in the box space. E1 indicates the spectrum measured in the centre facing the back wall. E2 indicates the spectrum measured at the same height and in the same attitude, in the back left corner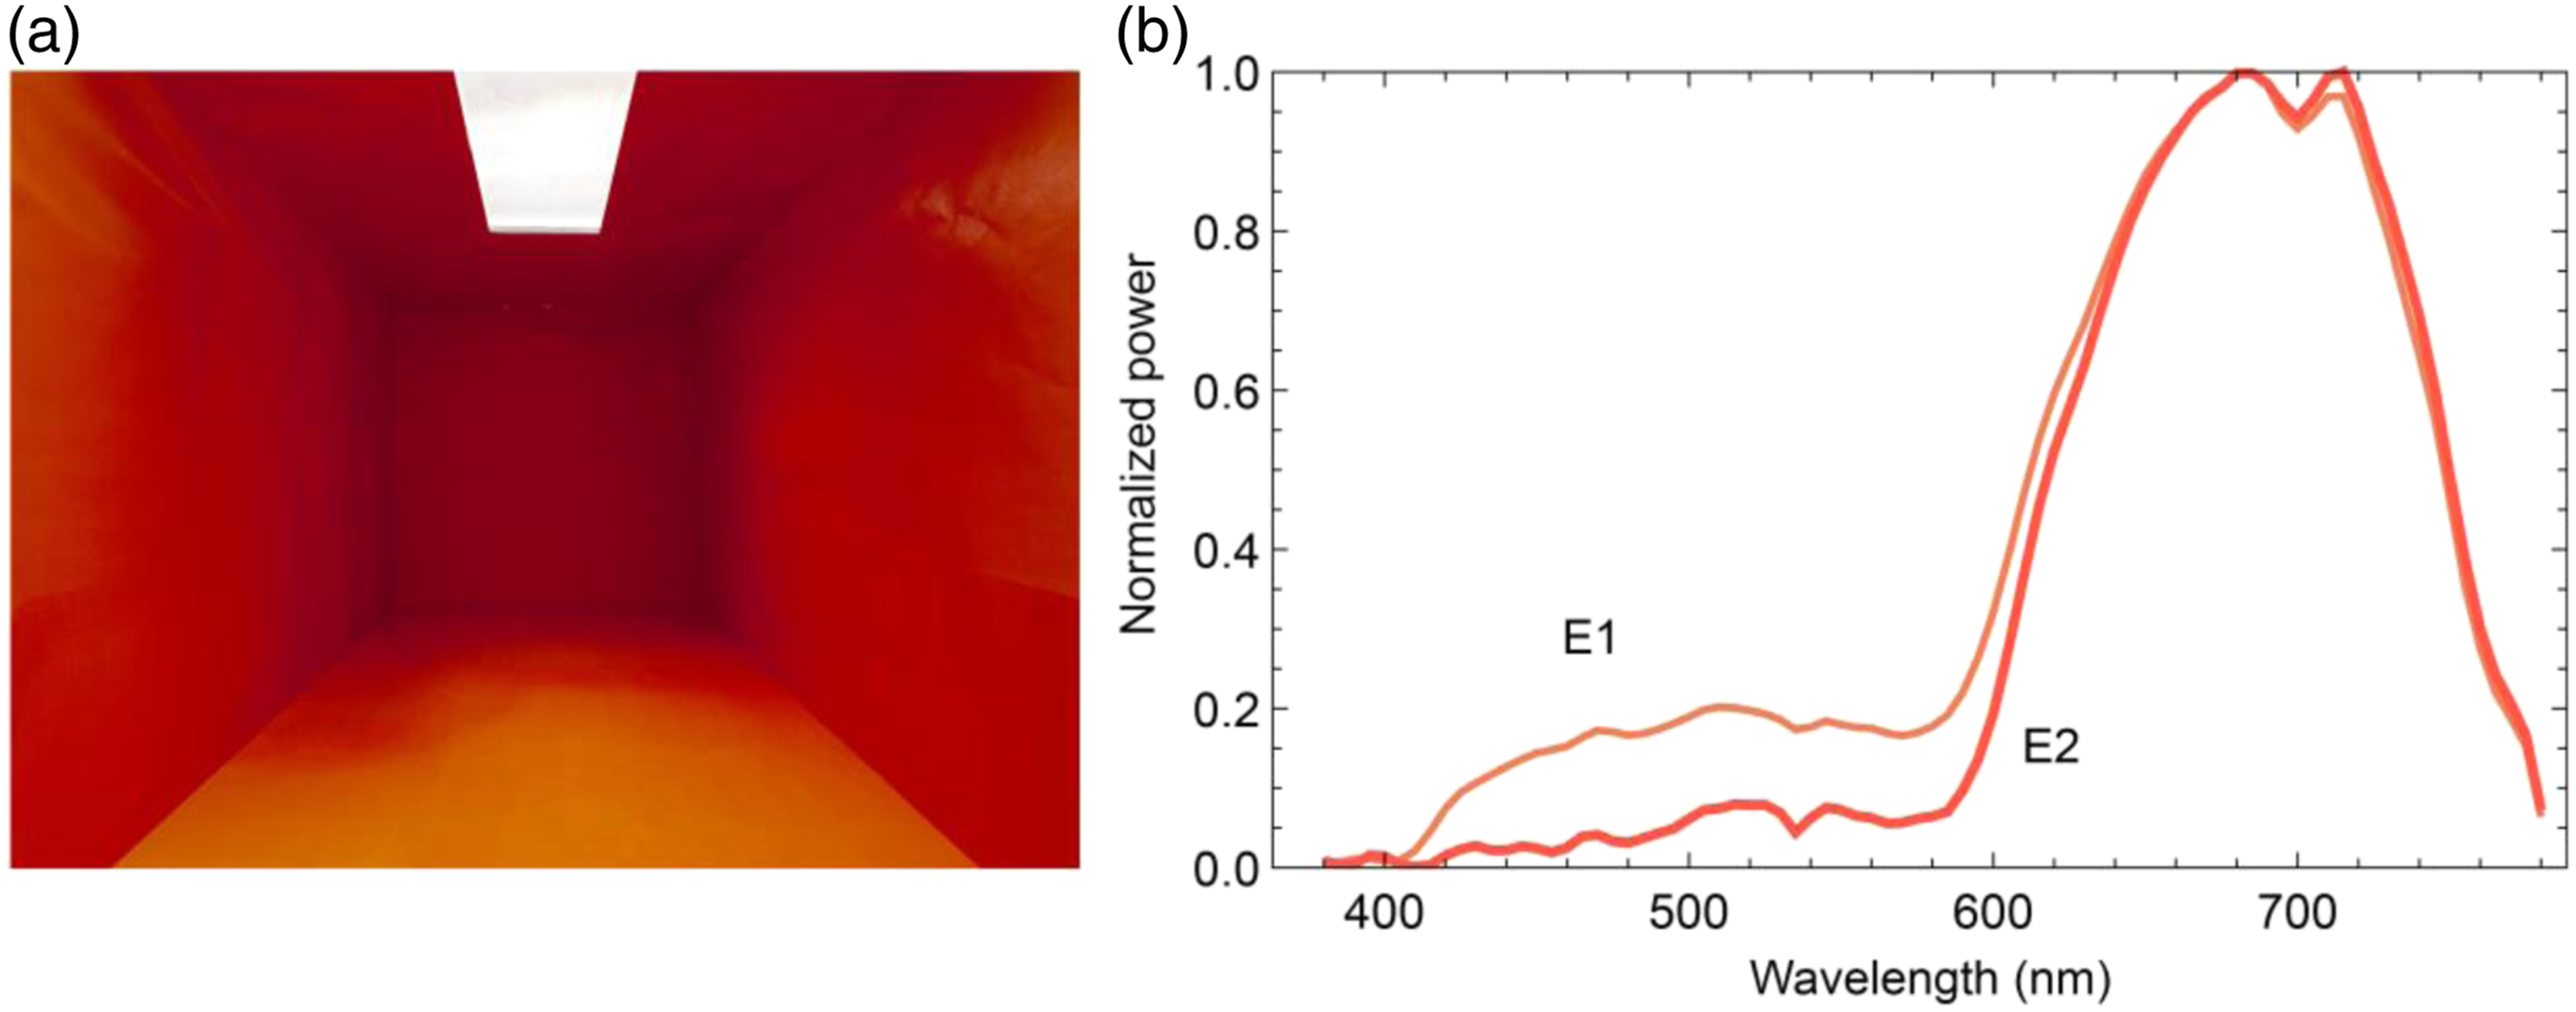
Acting as the major secondary sources of illumination in Lambertian scenes or any scene with materials having major diffuse reflectance modes (thus, almost any scene), inter-reflections influence the light field in a manner that depends on the geometry of space and sources, the spectral reflectances and the light spectrum. It has been intensely analysed how inter-reflections can affect the luminous properties of low-order light field components in the achromatic domain.3,38–42 A few studies have also shown the significance of inter-reflections in determining colour appearance.43–45 However, the impact of inter-reflections on the spectral properties of the light field has not yet been described in an integral manner with its spatial and directional properties.
The current study aims to understand the basic optical mechanisms behind chromatic effects of inter-reflections and their influence on the first-order physical structure of the light field, and to extend our light-field framework and methods to the spectral domain. To this aim, we present a theory for how the spectra of indirect light vary as a function of the number of inter-reflections or bounces they went through. We demonstrate these phenomena empirically in the second part of the paper via physically based computer simulations and optical measurements in mock-up spaces, including how the light density and light vector are affected spectrally and spatially by colours in the environment. We also show how the spectral light density and vector can be simultaneously measured using a cubic spectral illumination metre, quantifying spatial, angular and spectral variations of chromatic light fields.
2. Theory: Basic mechanisms underlying chromatic inter-reflections
For hyperspectral representations, it is impossible to study all possible spectra and estimate their inter-reflection effects. In order to study the basic mechanisms of chromatic inter-reflection effects, we instead took a coarse-grained spectral approach. This was shown to work well to describe the human ecology46,47 because most object colours have rather smooth spectra. 48 Such smooth spectra can in a coarse-grained approach be described by the energy in three bins, say, blue, green, and red (BGR). Once the fundamental mechanisms are understood, it is relatively easy to extrapolate the methods to hyperspectral data.
Now consider Lambertian material or, more generic and omnipresent, the diffuse scattering mode of material, and neutral white (equal energy) direct lighting, that is, an (EB, EG, ER) = (1, 1, 1) spectrum. This lighting illuminates the material of a certain (SB, SG, SR) spectral reflectance. The first bounce results in a spectrum of (E1B, E1G, E1R) = (SB, SG, SR). The second bounce by the same material has a spectrum of (E2B, E2G, E2R) = (S2B, S2G, S2R). The third bounce results in (S3B, S3G, S3R) and so forth. In summary, the spectrum of the n-th bounce is

Since the spectral power in each band is attenuated exponentially, this can cause relative differences between them depending on the number of bounces. The respective ratios of spectral power between each band change with each reflection and thus lead to a change of the spectrum’s shape. In effect, this results in shifts towards colours corresponding with the peak(s) of the material reflectance spectrum. If applied in the coarse-grained BGR approach, we find that homogeneously sampled reflectance spectra result in higher-order reflections with spectra that are very non-homogeneously clustered in this space (Figure 2). In other words, inter-reflections can cause strong spectral changes. (a) First, (b) second, (c) third, and (d) tenth (inter-)reflections of colours plotted in the BGR coordinates under equal energy white lighting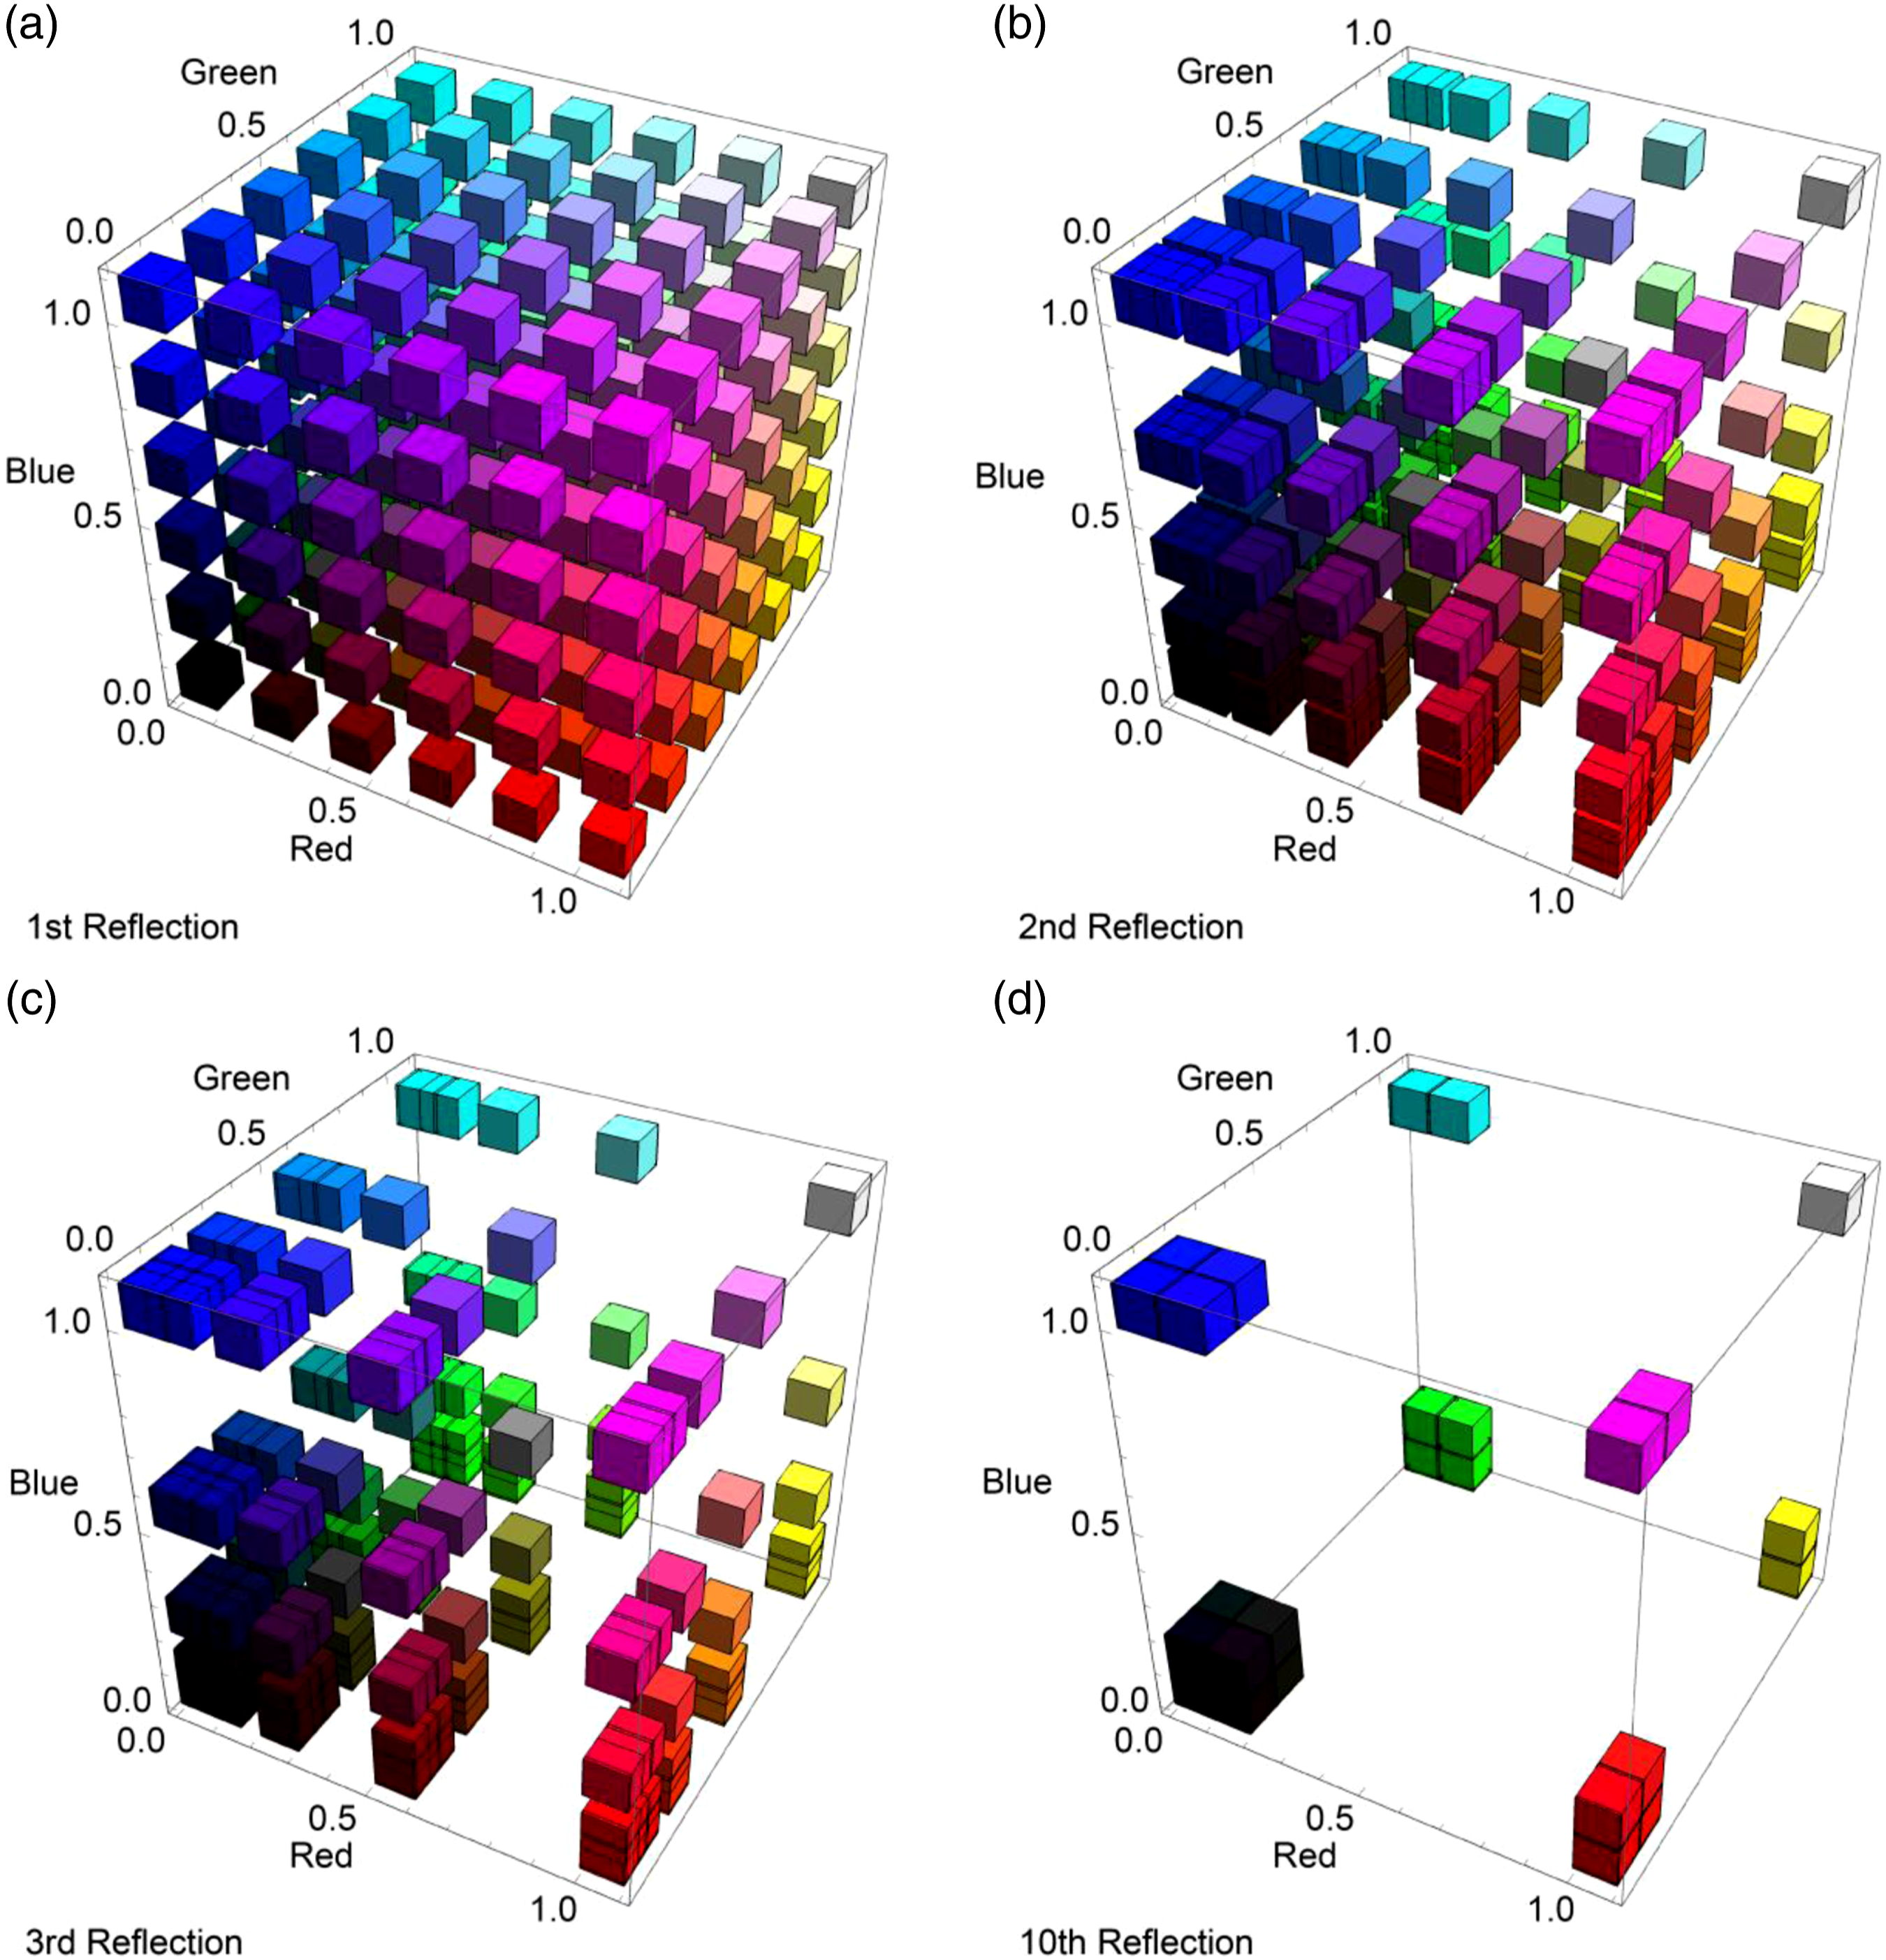
The spectral changes and associated colour shifts can be of various types, depending on the ratios of the spectral reflectance (SB, SG, SR). Spectra on straight lines between the vertex (0, 0, 0) and all other vertices show a power attenuation and associated brightness decrease with each inter-reflection until reaching (0, 0, 0) or black in the limit (see Figure 3(a)), while the peak position / band remains constant. Note that for these spectra the ratios of the spectral reflectance are either 0, 1 or infinite. The ratios remain despite the exponential attenuation of the individual bands. Thus, the associated hues stay the same, while the power will decrease for individual orders of inter-reflections. A schematic representation of the spectral effects of the (inter-)reflections in our coarse-grained model. It shows the categorised spectral effects in BGR space. The changes (in the directions of the arrows) can be associated with (a) brightness changes, (b) saturation effects, and (c) hue shifts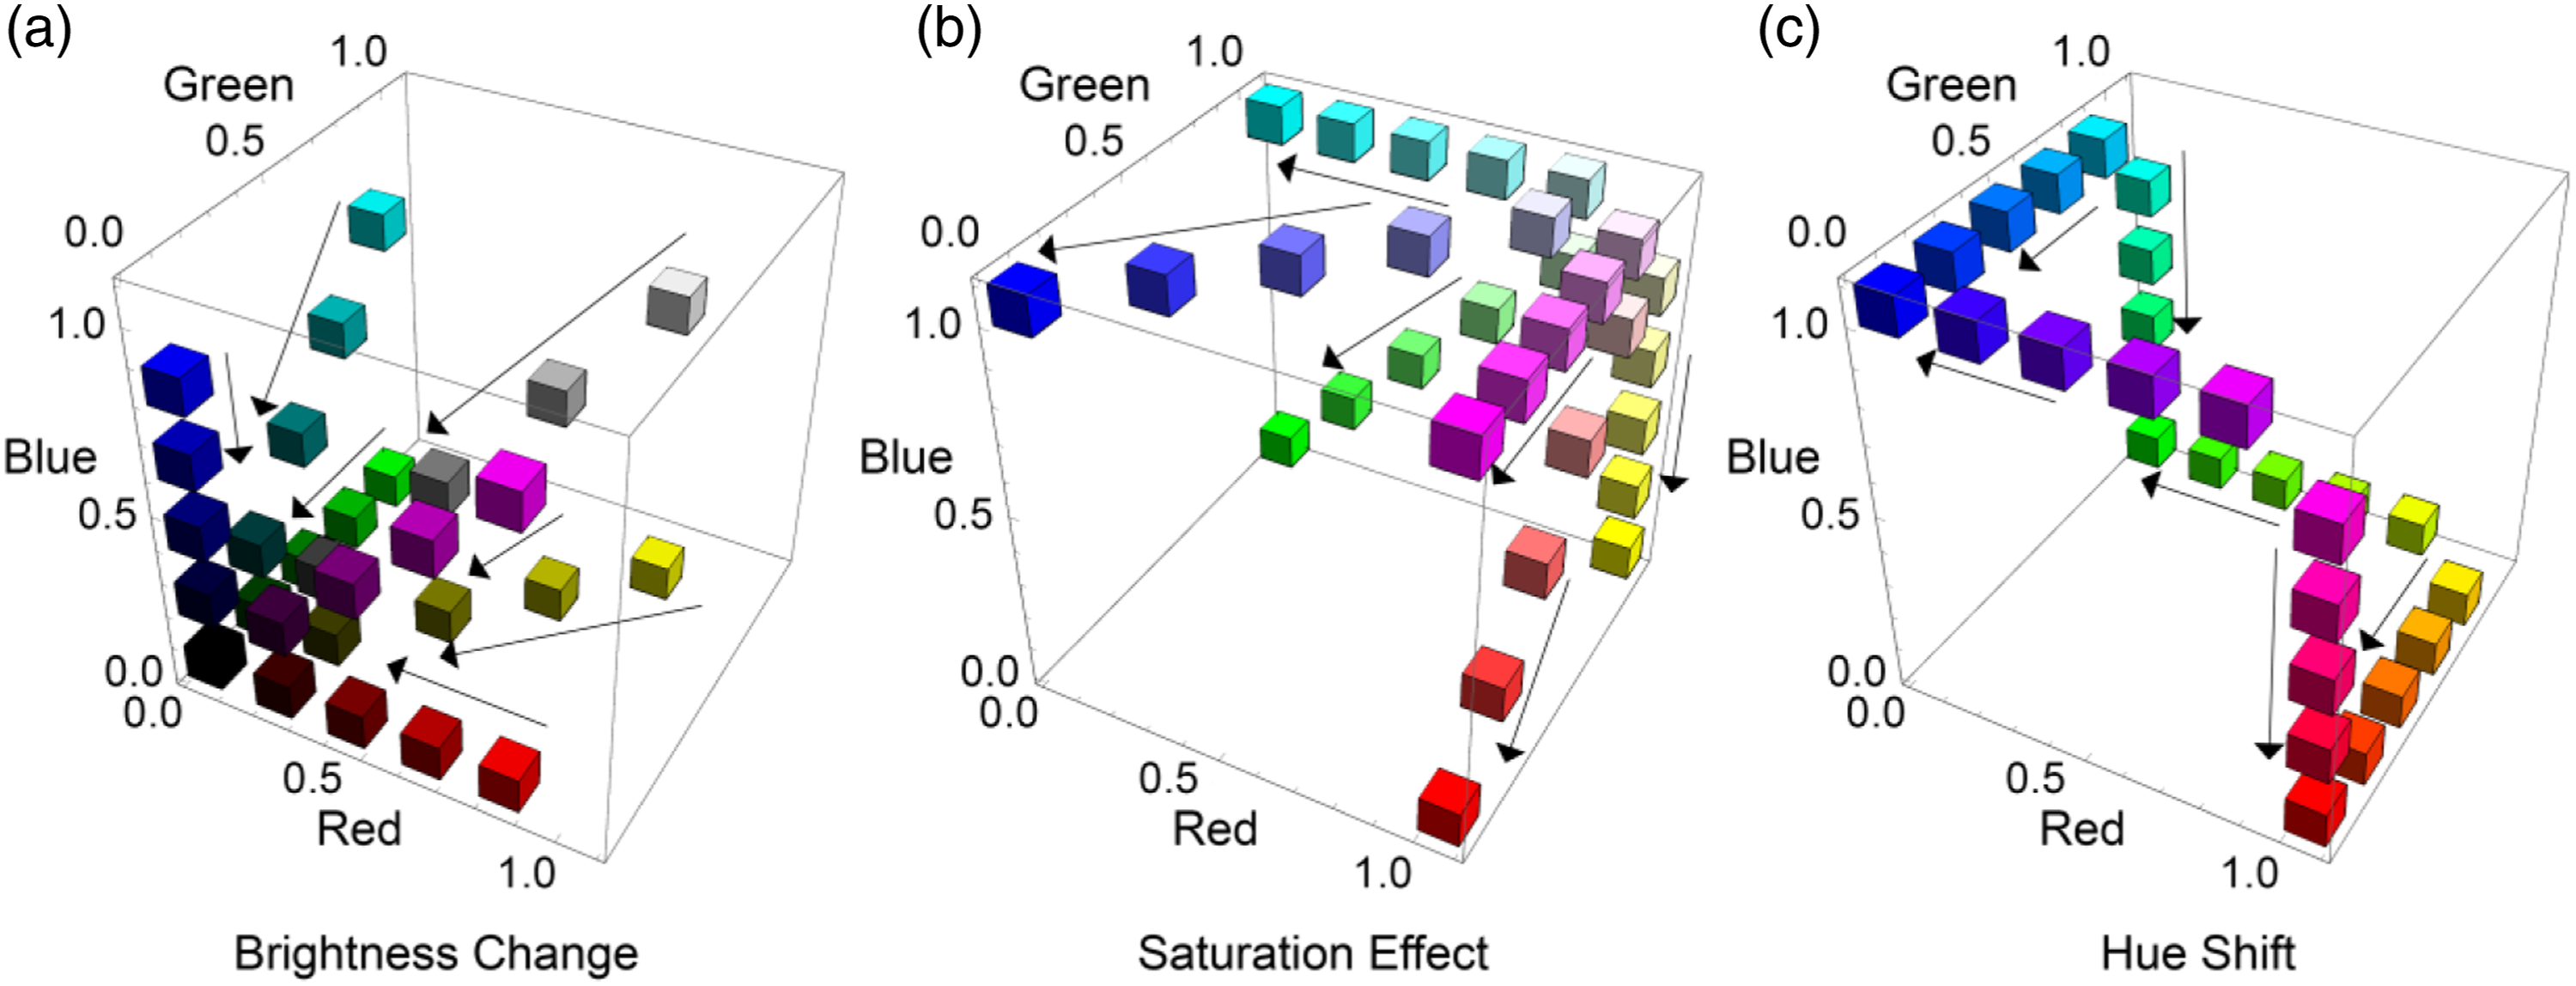
Spectra on straight lines between white (1, 1, 1) and the single-peaked or the double-peaked reflectance spectra become more peaked for higher orders. This can be associated with materials having pastel colours, which will show saturation increases in regions with many inter-reflections (see Figure 3(b)). For both types, for higher-order reflections, the power attenuations of the troughed band(s) are relatively stronger than the remaining band(s). The single-peaked type can be associated with a saturation increase towards the monochromatic colour corresponding with the peak, whereas the double-peaked type can be associated with a saturation increase towards mixing colour corresponding with the two peaks.
Spectra on straight lines between the single-peaked spectra and their adjacent double-peaked spectra show different levels of power attenuations and associated hue shifts, that is in our coarse-grained model, the reddish magentas and yellows shift to red, greenish cyans and yellows shift to green, and blueish cyans and magentas shift to blue. Those spectra have one band at peak value 1, another at 0, and the remaining band has a value between 0 and 1. The power attenuation of that remaining band leads to the dominance of the spectral peak and an associated hue shift towards the monochromatic colour represented by that peak (see Figure 3(c)).
Our simplified computational model using coarse-grained BGR spectra has outlined different categories of power attenuations and their associated colour effects that can happen as a consequence of inter-reflections. The associated brightness changes, saturation effects and hue shifts can happen simultaneously for other spectra which are not on the vertices, edges and diagonals. The model can easily be extended to hyperspectral cases with arbitrary illuminant spectra. If a material with spectral reflectance S
λ
is illuminated by a light source with the SPD to be E
λ
, the n-th bounce of the (inter-)reflections leads to

Thus, for white(-ish) light with a continuous spectrum, the phenomena will be perceptually similar to the coarse-grained simplifications: the troughs of the reflectance spectrum are attenuated much more than the peaks, so that brightness, saturation and hue shifts can occur. As those spectral effects are also subject to the SPD of the direct lighting, these associated chromatic effects can be boosted or counteracted by spectral tuning of the source. However, since natural SPDs are usually quite smooth, and since the power distributions of white light sources are tuned to the sensitivity of the human visual system, it is expected that the phenomena can still be predicted and explained on the basis of this fundamental mechanism. Please also note that here we modelled the spectrum of each individual order of inter-reflection, while in natural scenes, the final effect will be a sum of (infinitely) many of them weighted by geometry-dependent factors.38,43,45 In the following sections, we will first test the effect of that summation in computer simulations, and next test effects in real scenes with realistic hyperspectral conditions.
3. Empirical testing 1: Chromatic inter-reflection effects in a virtual box space
This experiment aims to empirically verify whether the three types of spectral effects indeed occur in simple scenes as predicted and test how accumulated orders of inter-reflections combined with direct lighting impact the final reflected spectra. We simulated a wide range of material spectral reflectance with homogeneous sampling over BGR space for a simple geometrical case and analysed the results in image space (Section 3.2). Next, we also analyse the effects on the first-order structure of the resulting light fields for two cases: a white room and an ocre room, for which we first explain how we extend our light field framework to the spectral domain (Section 3.3).
3.1 Method
A digital model of a simple box space was set up with the length, width and height to be 6000 mm × 3300 mm × 3300 mm. The space was illuminated by an 1884 mm × 773 mm uniform diffuse light panel recessed in the centre of the ceiling. Its luminous flux is 3500 lm with an equal energy flat spectrum. For the reflectance spectra, we evenly sampled the BGR space with values of 0.1, 0.5 and 0.9, leading to 3 × 3 × 3 = 27 BGR spectra. We intentionally avoided sampling spectra on the vertices and edges (having a reflectance of 100% or 0% in at least one band) for physical realism. All surfaces within the box space were Lambertian and one of the twenty-seven herefore selected reflectance spectra. The space was rendered for only direct illumination and total (direct + indirect) illumination separately. Since the direct lighting from the diffuse light panel has an equal-energy-white spectrum, the spectrum of each individual reflection is exactly in line with the described inter-reflection theory. The simulations then show how these add up to a final appearance, depending on the walls’ reflectance spectrum (and of course the scene geometry and the photometrical properties of the light source).
Based on the theory, we predicted what chromatic effects of inter-reflections would show in the total illumination images – especially for the corners, ceiling and deeper parts of the spaces, where inter-reflections have the biggest impact. Three types of chromatic effects of inter-reflections were expected to occur simultaneously, and the predominant types of spectral effects were predicted to be different depending on the walls’ reflectance spectra. We divided the spectra into four groups named according to those predominant types. The first control group contains reflectance spectra that are adjacent to the vertices in the coarse-grained BGR space. The brightness-change group consists of spectra that have one or more bands with 0.5 spectral reflectance and the rest of the bands, if any, of 0.1. The saturation-effect group consists of spectra between neutral (white) and the single-peaked or the double-peaked BGR spectra (associated with pastel colours). Those spectra have one or two bands with a reflectance of 0.9 and the rest of 0.5. The power attenuation of the band(s) that have 0.9 reflectance is comparatively smaller than that of the band(s) with 0.5 reflectance, resulting in saturation effects towards the peak reflectances. The spectra in the hue-shift group have one band with 0.9, one with 0.1 and the other one with 0.5 reflectance. These spectra are predicted to show hue shifts because higher-order reflections attenuate the bands with lower reflectance more. Consequently, shifts occur towards the peak reflectance.
We used the Autodesk Raytracer render engine (a physics-based renderer). The high dynamic range (HDR) output of the engine might include values beyond the display capability of a typical monitor. We used the tone-mapped Low Dynamic Range images for display purposes. The tone mapping operator (TMO) first linearises the pixel values without any clamping and then applies a standard 2.2 gamma correction. This TMO aims to map brightness differences in a perceptually uniform manner but exaggerates the colour effects of inter-reflections (which also follow a power law) (see Reinhard et al. 49 for details). For physical accuracy, raw HDR outputs were used for the numerical analysis.
3.2 Results in image space
The collection of tone mapped images is shown in Figure 4(a), in which the predicted inter-reflection effects can be seen. To analyse the spectral effects of the accumulated orders of inter-reflections, we measured the dominant reflected BGR spectra of the HDR direct illumination images and the HDR total illumination images, by applying a k-means clustering.
50
The dominant BGR spectra of the direct illumination images correspond to the first-bounce reflected spectra, whereas those of the total illumination images indicate the reflected spectra of accumulated bounces. The resulting spectra were plotted in the BGR space according to our grouping (Figure 4(b)). The perimeter of the hexagon indicates the coarse-grained spectral locus.46,51 The centre is the white point. The arrows indicate the shifts from the dominant spectra of the direct illumination images to those of the total illumination images, showing the chromatic effects of inter-reflections. Shifts between white point and spectral locus indicate saturation increases, whereas those in the directions along the spectral locus consider hue shifts. Box space renders and their associated spectral effects. (a) The collection of tone mapped total illumination images for the box spaces with different surface spectral reflectances. The selected spectra have been numbered for further reference. The renderings are divided into four groups based on the surface spectral reflectance and the corresponding predicted spectral effects of inter-reflections. (b) The power of the most dominant reflected BGR spectra within the direct and the total illumination renders plotted in the BGR space according to their grouping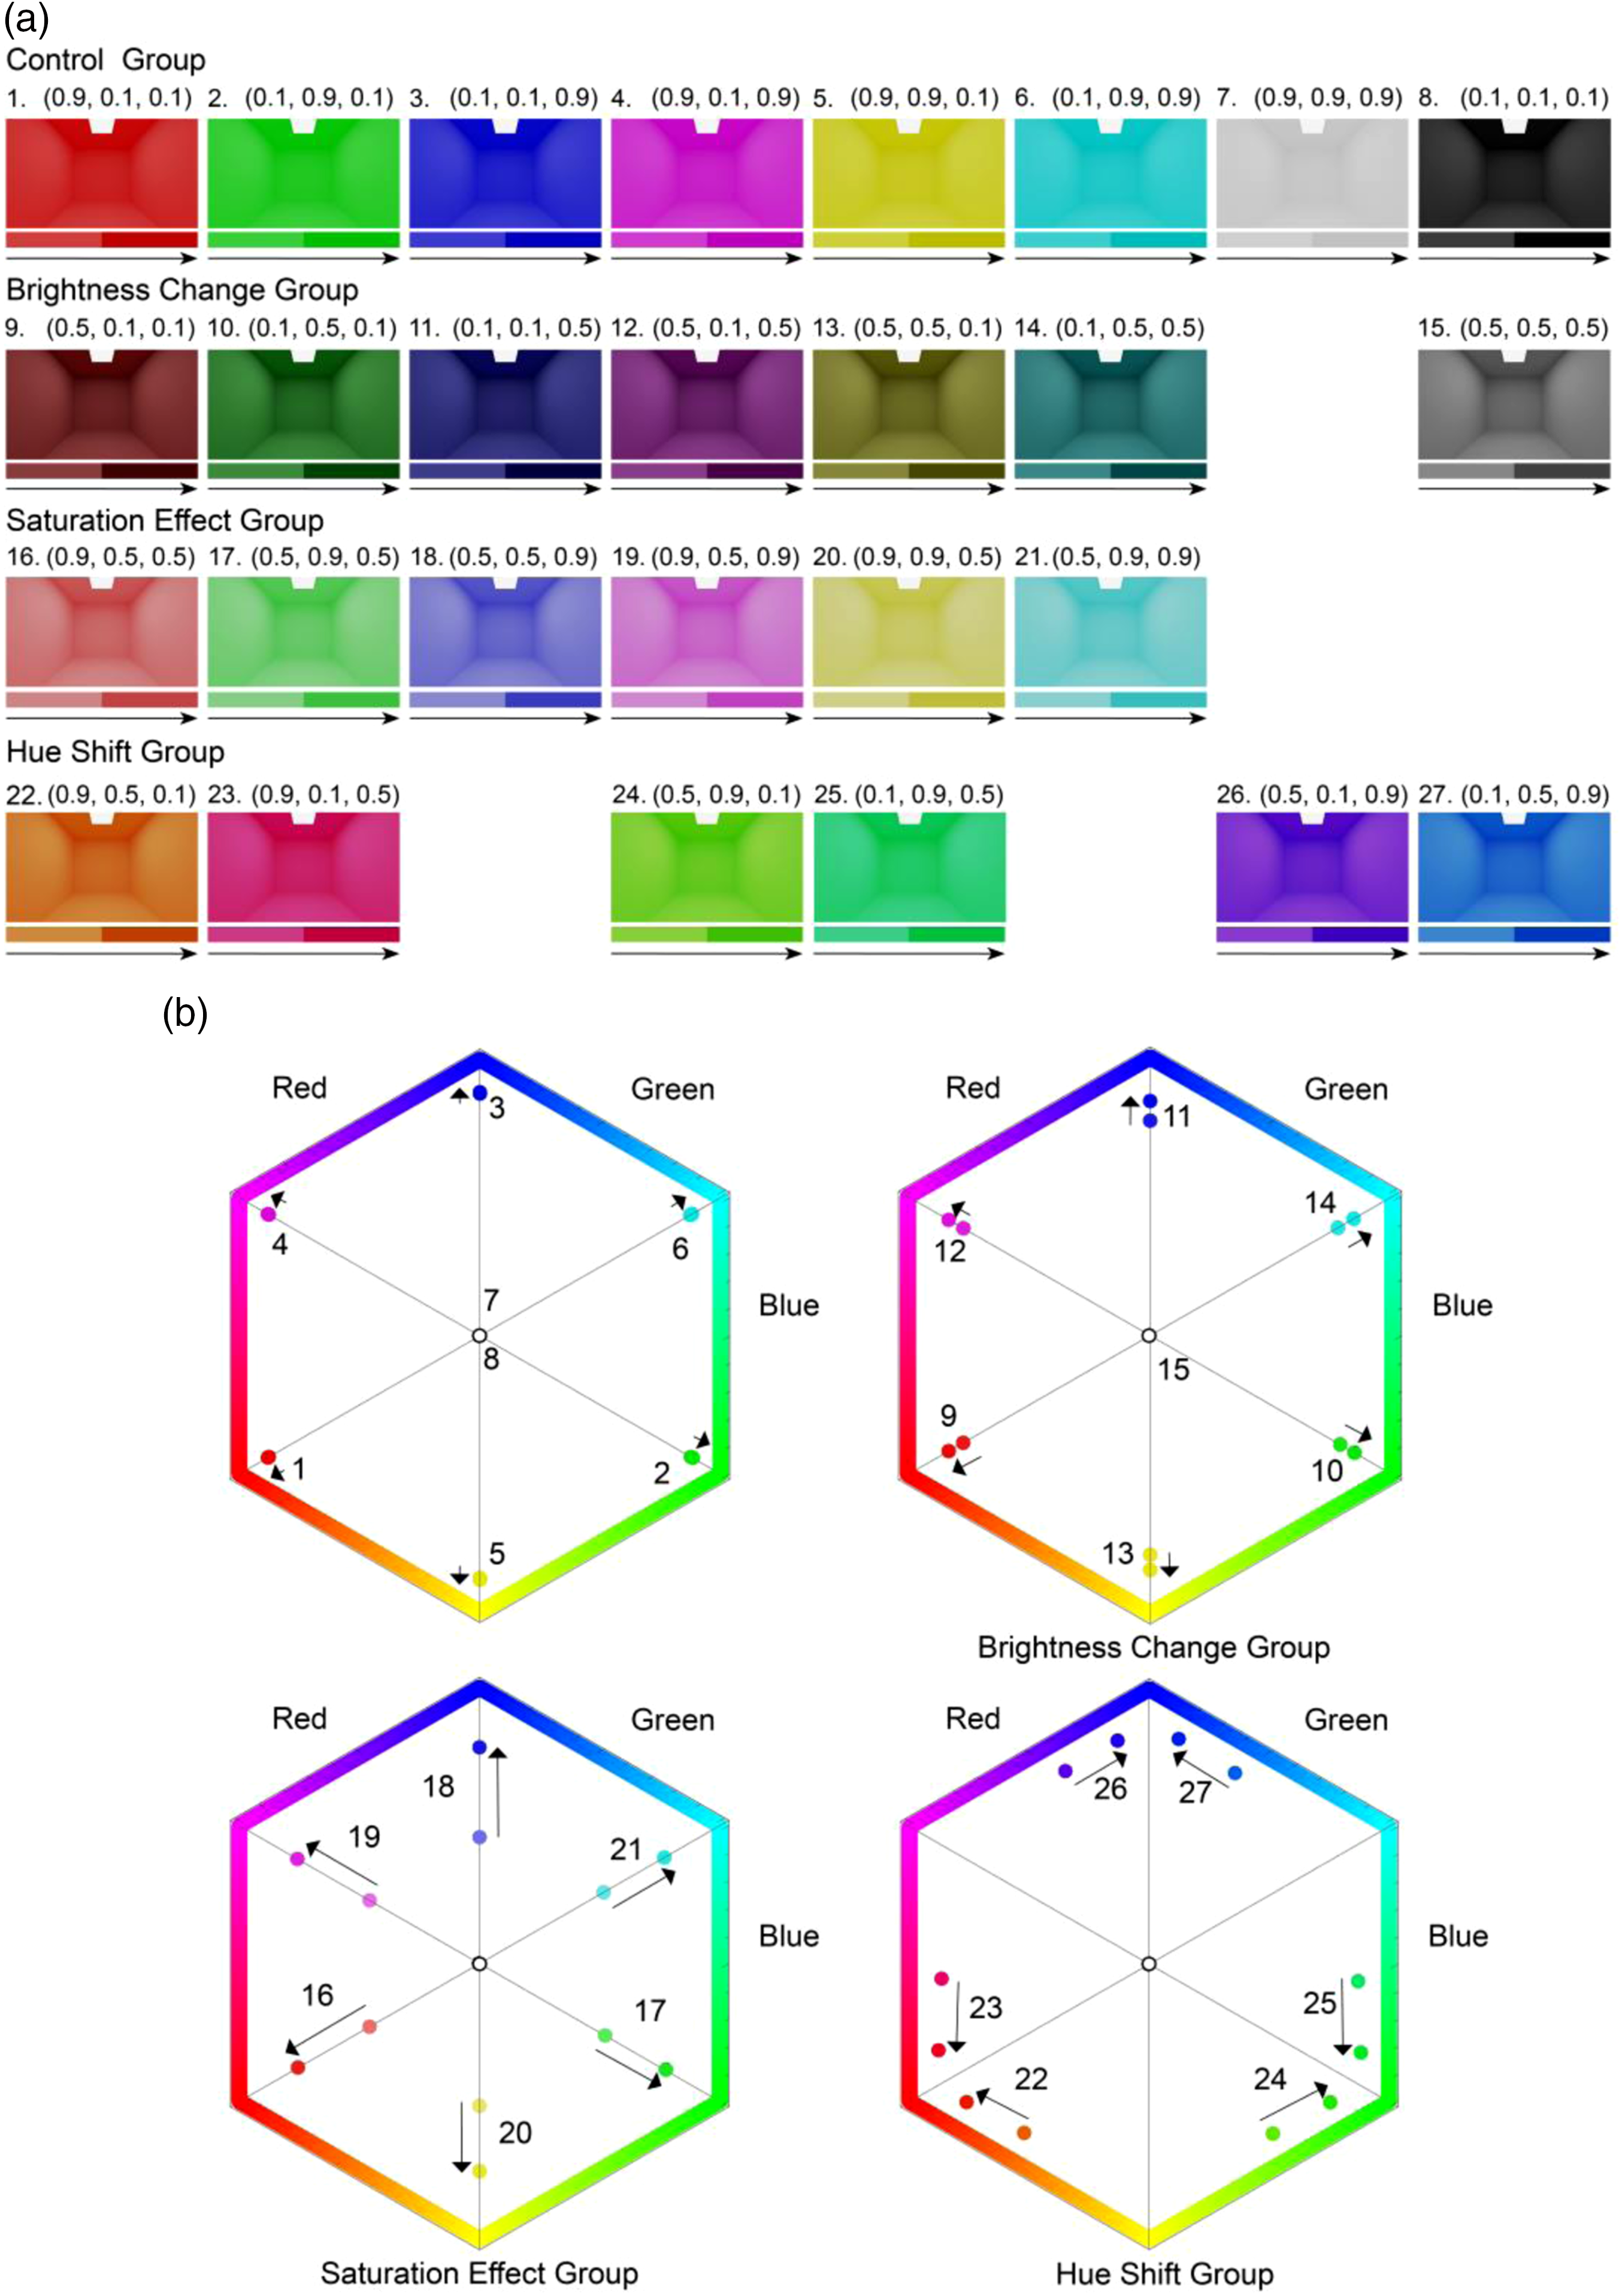
For the control group (spectra 1 to 8), higher-order inter-reflections indeed lead to minor spectral variations and associated colour shifts (see upper left BGR plot Figure 4(b)). The spectra in the brightness change group (spectra 9 to 15 and top right plot Figure 4(b)) mainly demonstrated brightness effects (not visible in these plots due to their nature) and small saturation effects, that is, minor shifts in the direction from white point to spectral locus. The spectra in the saturation effect group (16 to 21) shifted significantly towards the spectral locus and thus showed major saturation gains (bottom left plot Figure 4(b)). The spectra in the hue shift group (22 to 27) illustrated expected red, green and blue shifts depending on their spectral peaks (lower plots Figure 4(b)).
3.3 Results in 3D space: Measuring and visualising the chromatic light field
The former analysis tested how the effects of inter-reflections influence rendered appearance in image space. But how do these effects impact the light field in the box spaces? For this analysis, we use the Delft light field framework.
4
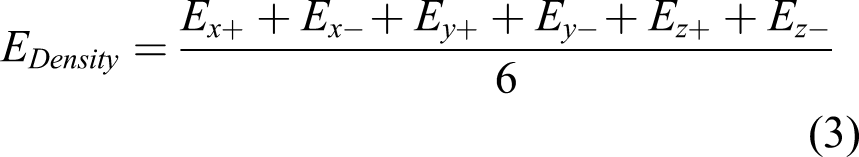
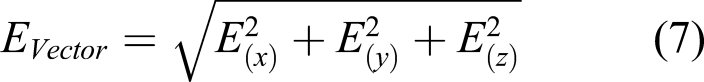
To this aim, the first-order structure of the light field at any given point was measured via the spectral illuminance on the six faces of a small cube (see Figure 5). The light density and light vector of the local light field were measured via the cubic spectral illuminance, with E(x+) and E(x−) the spectral illuminance measurements in the positive and negative directions along the X-axis, and analogous for the Y and Z directions. The light density was estimated via the mean SPD of the six cubic faces (3). The differences in three orthogonal directions together gave an estimate of the light vector, its direction (E(x), E(y), E(z)), magnitude EVector (4)–(7), as a function of wavelength λ, which is not included in the equations for simplicity Schematic presentation of the cubic method via illuminance measurements on six faces of a small cube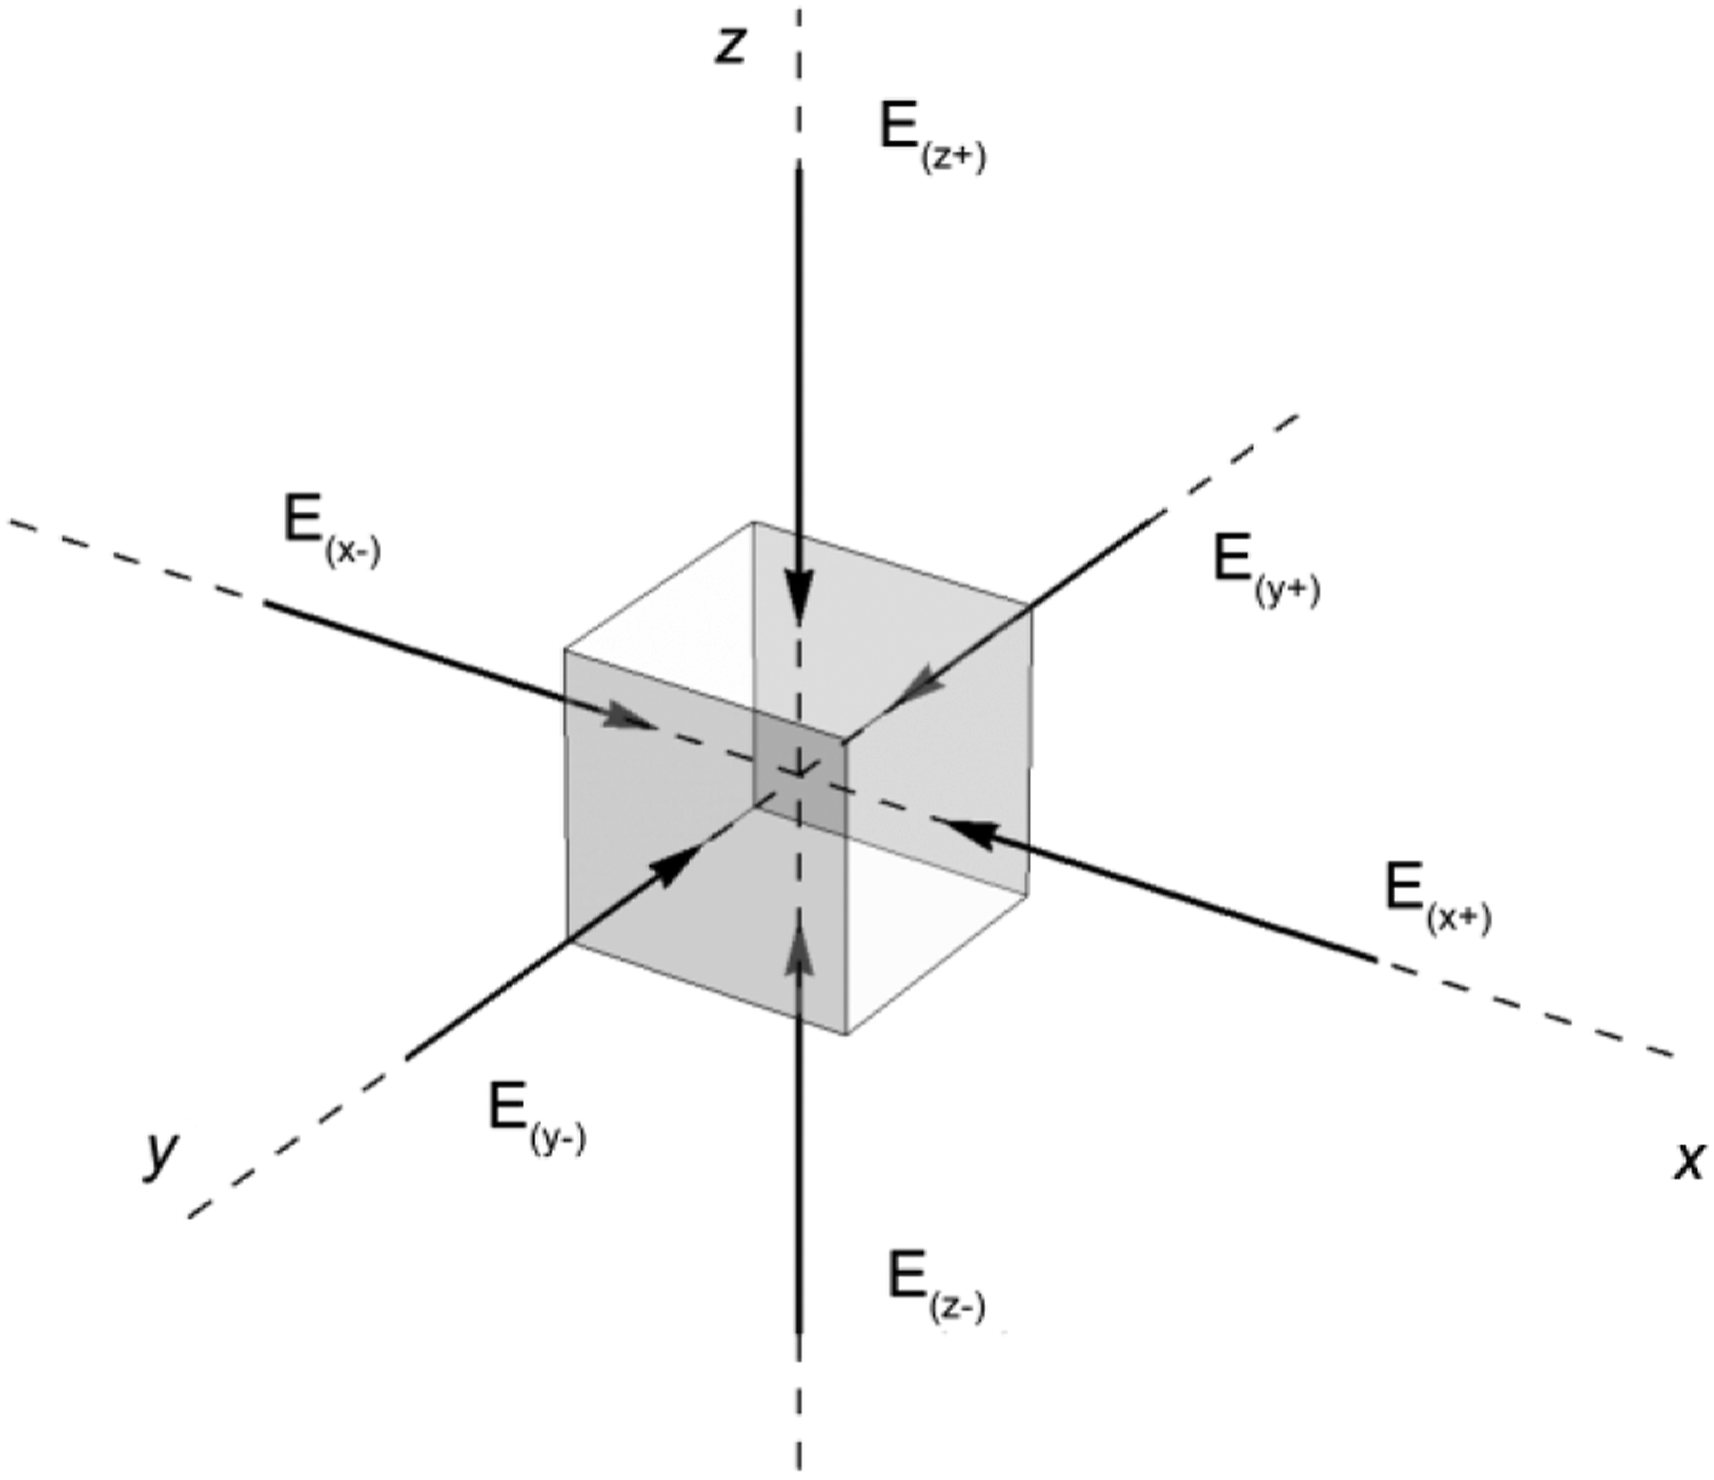


For the analysis of the spectral effects on the light-field components, we first simplified the hyperspectral approach as described above to a coarse-grained approach. To this aim, we integrated the spectral power for three bands representing the short-, middle- and long-wavelength parts, after this shortly called BGR bands. The zeroth- and the first-order coarse-grained BGR light densities and vectors were measured and visualised for a white (Figure 6(a)) and an ocre (Figure 6(b)) box space. These figures present cross sections of the room, with the light density in the upper rows and the vectors in the lower rows. The columns present the separate data for the three bands. The light density is mapped using a false colour scale (right of the plots) after scaling all data, and the light vectors are projected onto the 2D cross section. The distributions of the light densities and the light vectors for the three bands are identical in the white space, being strongest near the light source and diverging outwards, and aligned for the BGR light flows (i.e. the flow structure or pattern formed by the vectors). The integrating effects of the white Lambertian surfaces cause a quite diffuse light throughout the room, which is clear from the vectors being small except near the source, and the density is quite high and uniform throughout the room. For the ocre space, the distributions of the light densities and the light vectors vary as a function of the spectral band. The higher the spectral reflectance in a particular band, the larger the magnitudes of the light densities and the smaller the magnitudes of the light vectors, due to the integrating effects. Since the spectral reflectance of the ocre finish increases from B to G to R, this effect is smallest in the B band and largest in the R band. Thus, the BGR light flows no longer align. The light flow in the short wavelength B band diverges out from the source and ends / is absorbed on the B light absorbing surfaces. The light flow of the long-wavelength R band is, by contrast, heavily curved. The light flow in the B band is thus much more directional than in the R band, and the G band in between. The zeroth- and first-order structure of the chromatic light fields in a white and an ocre room. Light density (top rows) and light vector (bottom rows) plots for a cross-section of the box spaces furnished in (a) white and (b) ocre. The pseudo colours of the light density plots indicate their normalised value. The vectors represent the local light vectors projected onto the cross section. The columns represent the short, middle and long wavelength bands or B, G, R bands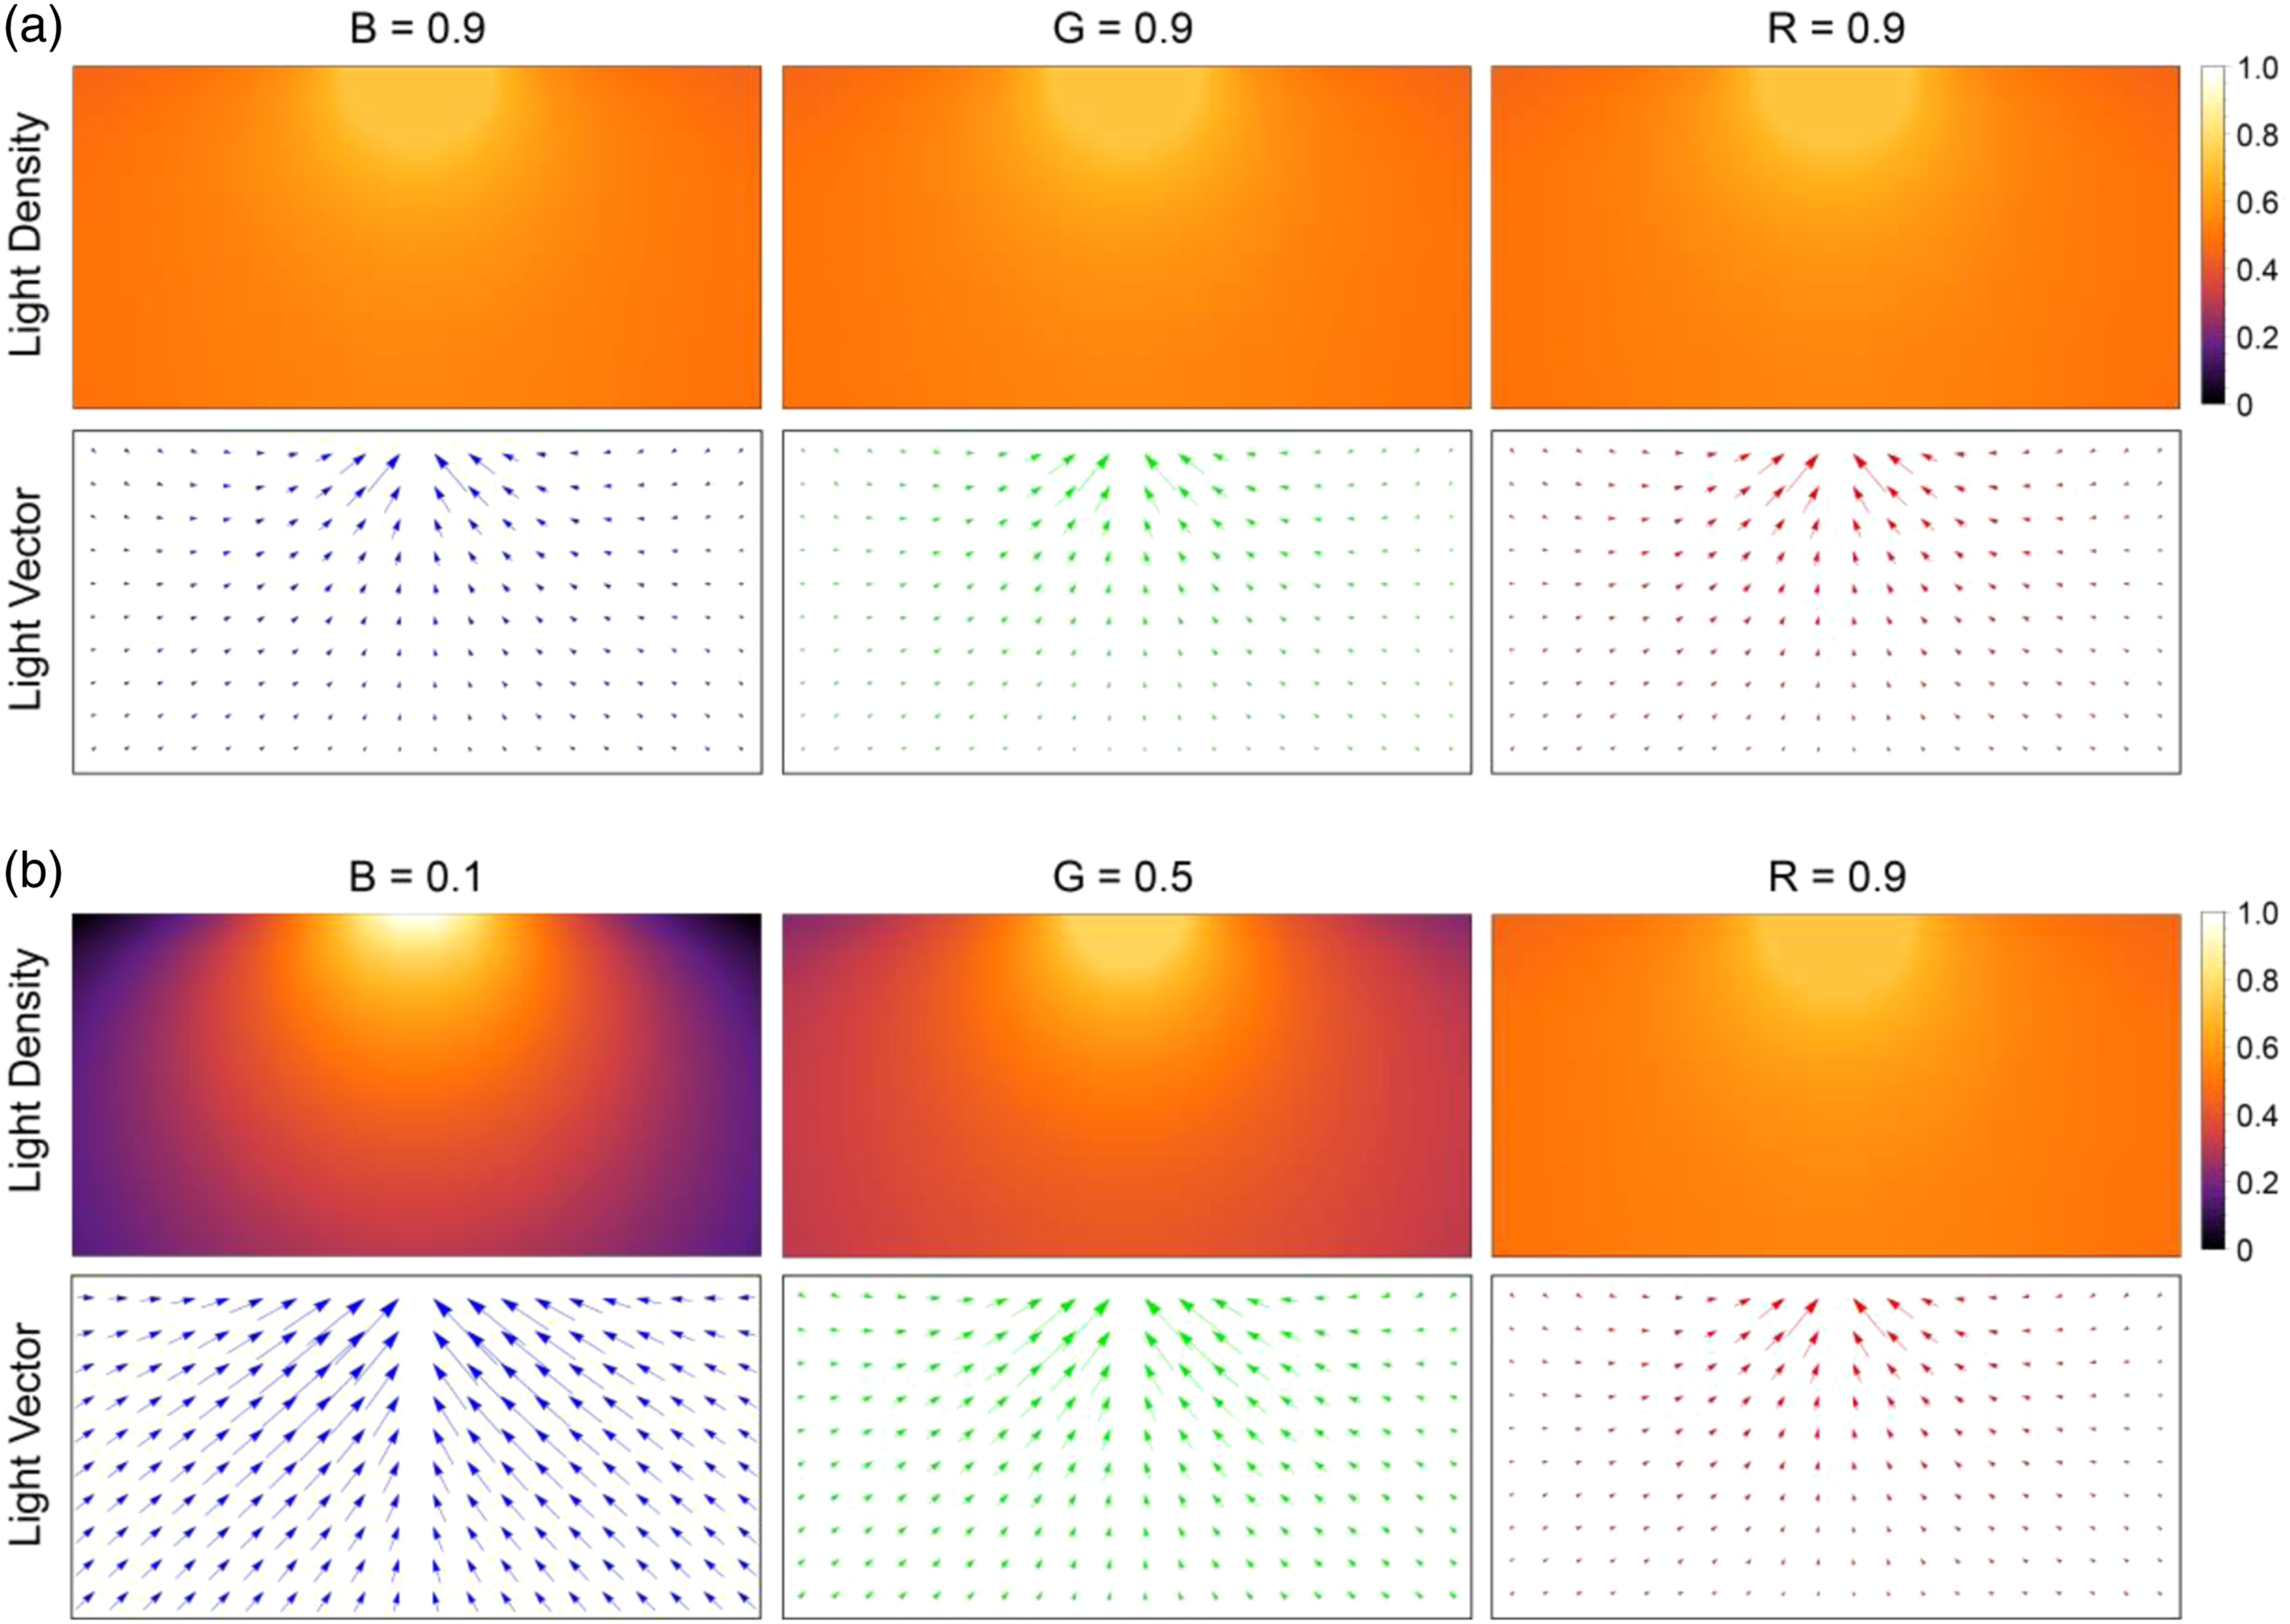
4. Empirical testing 2: Chromatic inter-reflection effects in a physical box space
4.1 Method
Here, we further explore and quantify chromatic light-field effects in real room settings under natural lighting with fine spectral resolution (1 nm interval). Inter-reflections on diffusely scattering materials, because of their diffuse nature, boost the light densities and attenuate the light vectors – and, as we have seen herefore, in a manner that depends on the wavelength (band). The objective is to (A) test whether the three categorised chromatic effects in the theory and computer simulations can be reproduced in a real setting with more articulated spectra and (B) test the differential effects on the light-field components.
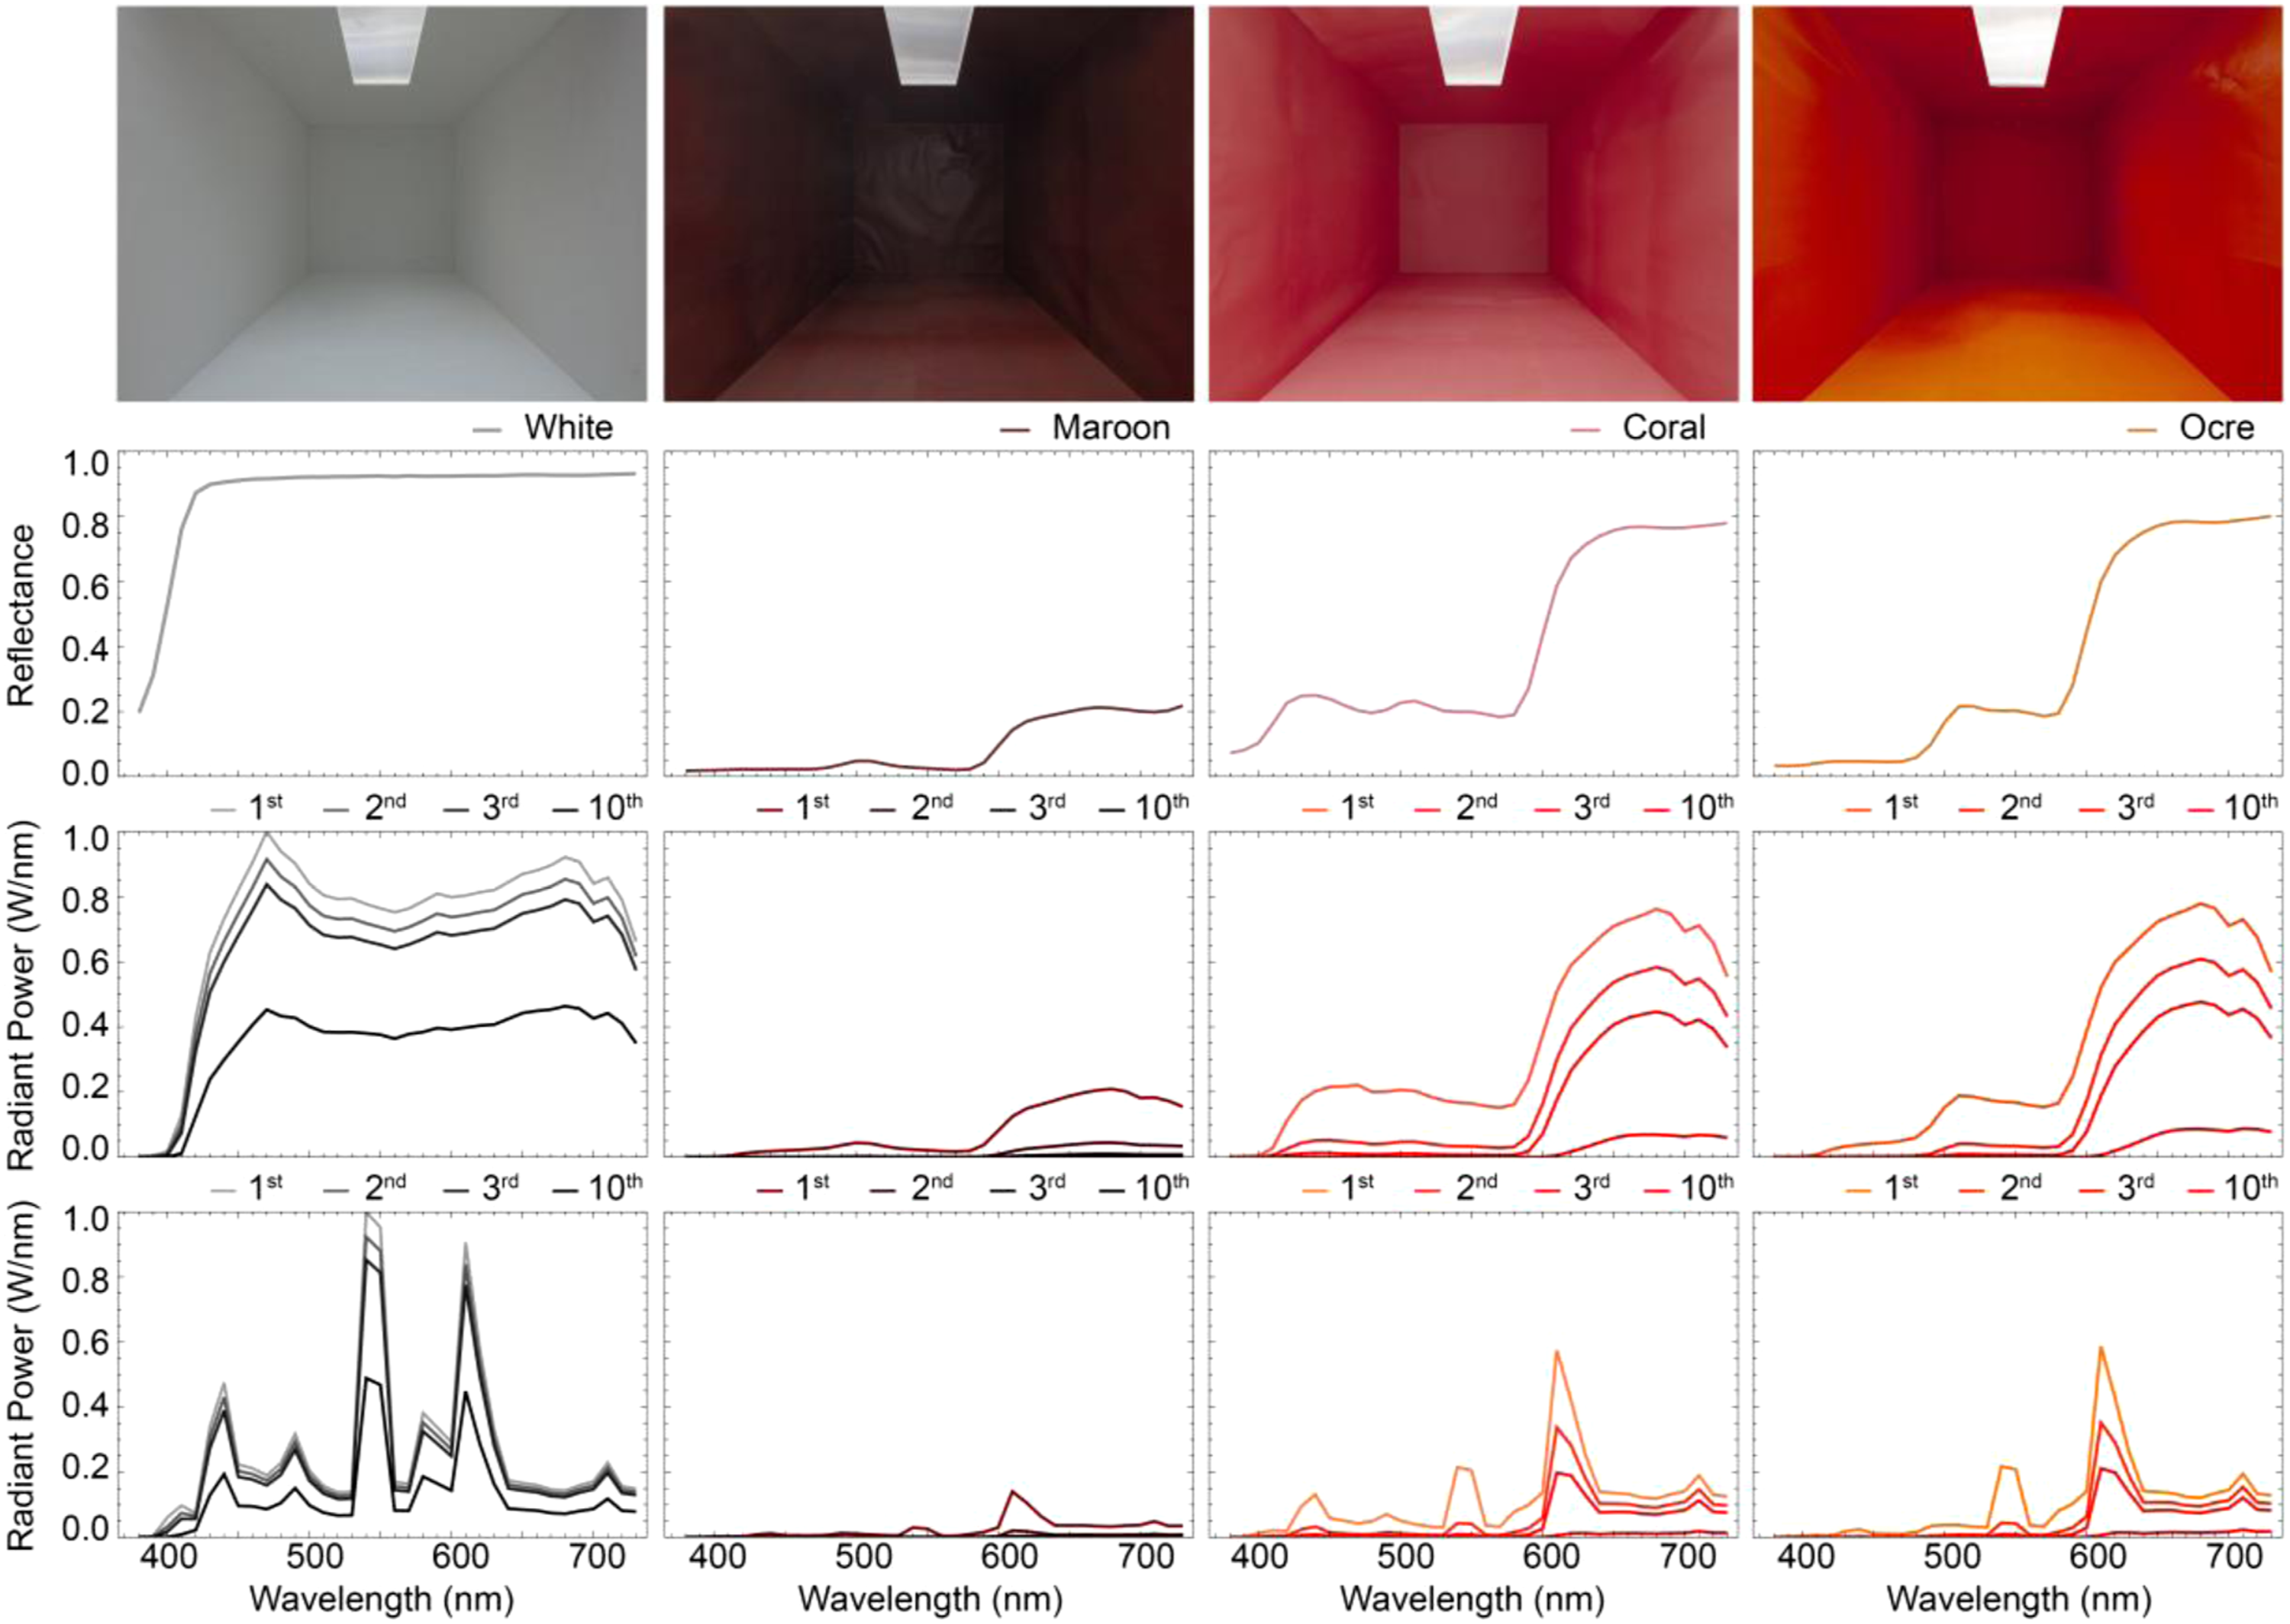
To these aims, a 1200 mm × 660 mm × 660 mm physical mock-up windowless box space (Figure 8 first row) was constructed. The space was illuminated by a planar diffuse luminaire (377 mm × 155 mm). The SPD of the luminaire was tuned by modifying the lamps used. The SPDs of the two chosen illuminants are shown in Figure 7. Lighting scenario one was established by using a xenon lamp (CRI Ra 91.4, CCT 5461K) only to backlight the planar diffuser, and scenario two by a fluorescent lamp (CRI Ra 84.2, CCT 4284K). We combined these two sources with four furnishing materials to keep it tractable, representing neutral, brightness, saturation and hue shift cases (white, maroon, coral and ocre, respectively). The furnishing materials were created by white paint, or printing A3 sheets of paper with uniformly coloured BGR colours (0.1, 0.1, 0.5), (0.5, 0.5, 0.9) and (0.1, 0.5, 0.9). The SRFs of those materials were measured with a spectrophotometer. With the measurements of the SRFs of the four finishes (Figure 8 second row) and the SPDs of the two lamps taken, we can predict the spectral effects for separate bounces in both lighting scenes based on (2). The spectral shape of the first, second, third and tenth bounces under both illuminants have been plotted by using the power functions presented in the theory section (Figure 8 third and fourth rows for first and second lamps, respectively). Please note that the weight of each bounce in the final resulting light field is dependent on space geometry and lighting. To quantify and analyse these effects, we measured the cubic spectral illuminance in the left-back corner and the centre of the mock-up space in all four different furnishing conditions and for the two sources. Normalised spectral power distributions of the two selected illuminants. Xenon lamp (solid line), a mixture of fluorescent and tungsten halogen (dashed line) Physical mock-up windowless box spaces and predictions of the spectral effects for separate bounces in both lighting scenes. The first row shows the photographs of the box spaces. The second row shows the measured SRFs of the four selected finishes. The third row shows the associated calculated spectra for the first, second, third and tenth bounces under the xenon lamp, and the fourth row under a mixture of compact fluorescent and tungsten halogen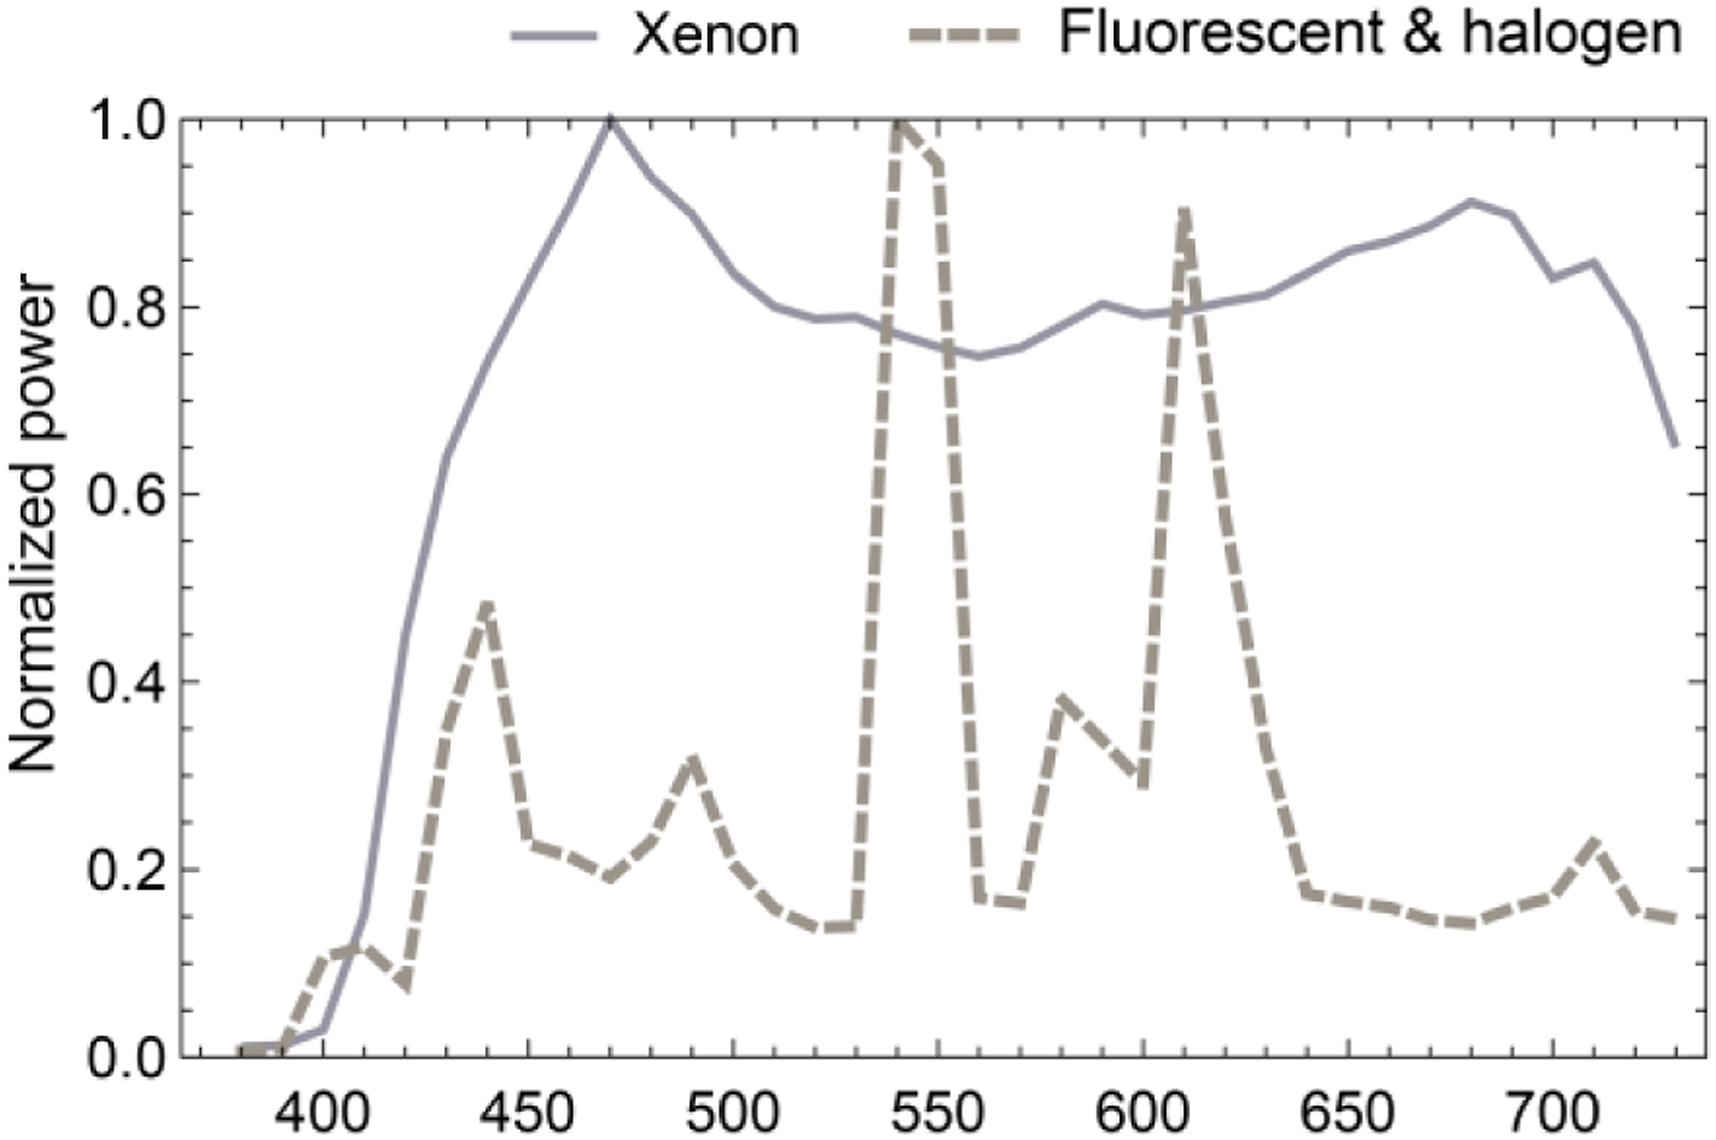
4.2 Results
We first estimated and compared the light density and light vector for the centre measurements (Figure 9(a) first row) and corner measurements (Figure 9(a) second row) for all four selected finishes under the xenon lamp. The third row shows their hue (angle) and saturation (length vector with 0 representing white and 1 fully saturated). The chromatic coordinates of the spectra were calculated based on CIE 1964 10° colour-matching function. Spectral measurement results. (a) Normalised plots of the light density (D) and light vector (V) spectra of both the centre (first row) and corner (second row) measurements for four different finishes (in the rows) illuminated by a xenon lamp. The hue and saturation of the light density and light vector spectra were plotted in the hue and saturation wheel (third row). The arrows point from the reference white point W to the light density and light vector colours for the centre and corner measurements. An accent denotes the corner condition. (b) as (A) for a fluorescent lamp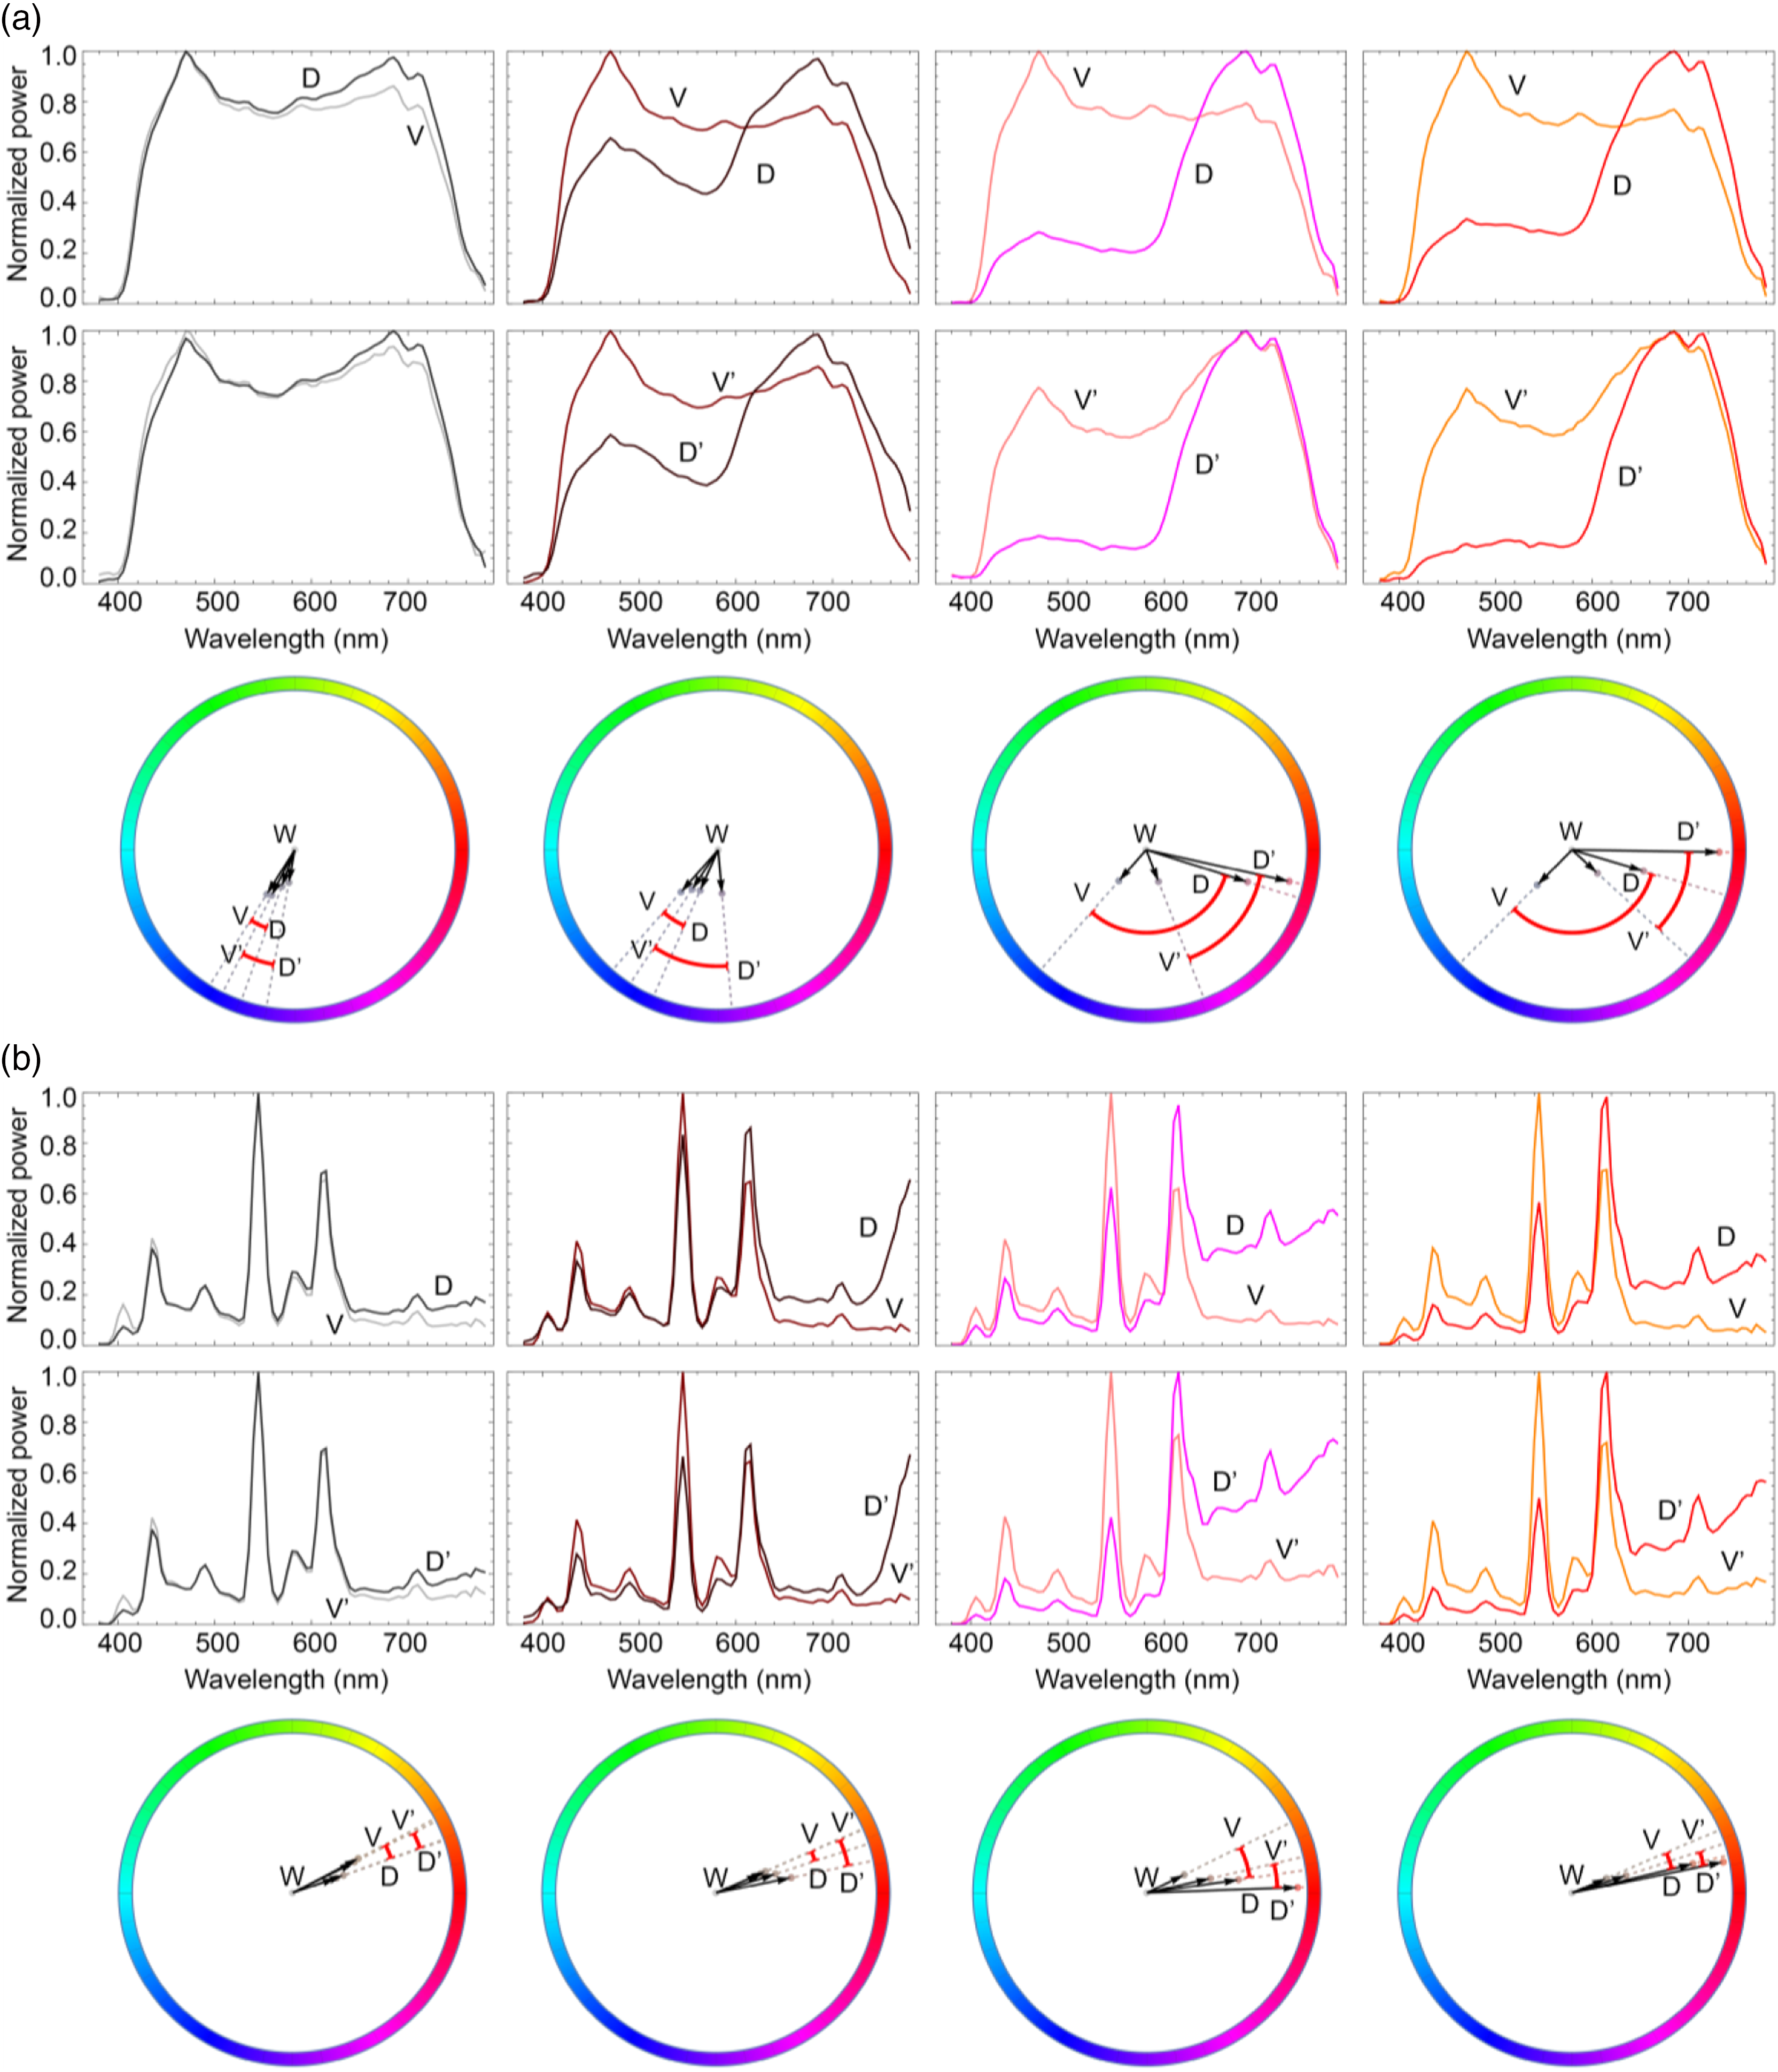
In the white space, the SPDs of the light density and light vector were similar, as expected for the relatively flat SRF of the material, causing the light density and light vector in the space to have a similar spectral shape as the illuminant (Figure 9(a) first column). The minor spectral variations might be due to the first author’s skin reflections since he had to hold the metre into the box space during the measurements.
The light densities’ SPDs in both the centre (D) and corner (D′) of the maroon room showed minor but similar attenuations of the short- and middle-wavelength part of the spectrum relative to the long-wavelength part, while the light vectors’ SPDs (V and V′) were close to the illuminant spectrum (Figure 9(a) second column). However, the intensity for both light density and light vector decreased (not visible in the plots due to normalisations) in the corner showing the brightness effect. The hue and saturation plot showed that the light densities and vectors in both locations had similar hue and saturation.
In the coral space (Figure 9(a) third column), the light densities’ SPDs in both the centre (D) and corner (D′) showed stronger attenuations of both the short- and middle-wavelength parts of the spectrum than the long-wavelength part, while the magnitude of attenuation was larger in the corner. The light vectors’ SPDs (V and V′) were closer to the illuminant spectrum in both locations, while that in the corner only showed minor attenuations of the short- and middle-wavelength part of the spectrum compared to that in the centre. The hue and saturation plot shows that the light densities were reddish and the light vectors were bluish in both locations. Meanwhile, the light density in the corner D′ was more saturated than that (D) in the centre, but shared a similar reddish hue. The light vector in the corner V′ was more reddish than that (V) in the centre.
The SPDs for the ocre room showed similar effects as for the coral room, that is, the spectral attenuation mainly showed up for the light densities (D and D′) relative to the light vectors (V and V′) (Figure 9(a) fourth column). However, the short-wavelength part of the light density’s SPD in the corner (D′) attenuated more than that in the centre (D), resulting in a change of the relative difference between the short-, middle- and long-wavelength part of the spectrum. The hue and saturation plot shows that the light densities were reddish and the light vectors were bluish in both locations. Meanwhile, the light density in the corner D′ was more reddish and saturated than that (D) in the centre. The light vector in the corner V′ was more reddish than that in the centre (V).
In general, we see the hue variations between the light densities and the light vectors changing more and more towards red from V to D to V′ to D′. The light density and light vector in the corner (D′ and V′) were also consistently more reddish than their corresponding light density (D) and light vector (V) in the centre. A closer look shows that the xenon source is quite blueish and so the hue plot shows that the effective spectra cover a wide range between blueish and reddish. The complex interactions between blueish direct light and reddish inter-reflections cause V′ to be less saturated than V.
The second source was deliberately chosen with its highest peak at the middle-wavelength part of the spectrum (about 545 nm) and relatively poorer colour rendering to counteract the reddish material reflectance spectra somewhat. Here, the hue angle variations for the coloured rooms are relatively smaller than for the xenon lighting scenario (Figure 9(b)), showing the dependency on the illuminant. The V-D and V′-D′ order however remained the same, as predicted before, going towards red and more saturated colours, corresponding with the expected order of impact of inter-reflections.
5. Discussion
Light fields (the actual light in a space) are a function of position, direction and wavelength. In earlier work, the position and direction dependency was already described, measured and visualised.1–3 Here, we made the first steps to extend this concept to the spectral domain, explaining how to compute and understand the light density and light vector spectrally. We further presented several examples, including real measurements.
These chromatic effects of inter-reflections are dependent on the spatial arrangement, location and spectrum of the light source(s) and room furnishing spectra. In a coarse-grained approach, we derived and explained what optical mechanisms underlay the colour shifts we observed ‘in the wild’, namely, brightness, saturation and hue shifts. Under neutral white illumination with good colour rendering properties, a coarse-grained approach will suffice to describe and understand the inter-reflection phenomena of human optical ecology. Moreover, common white sources are tuned for optimised luminous efficiency and colour rendering and have spectra with their power distributed over the visible range. Such relative short, middle and long wavelength ratios remain rather robust, as the main effects that we demonstrated. However, if light spectra do not overlap with the material spectral peaks, the chromatic effects could be weakened or even violated. Such lighting conditions apply to metameric white illumination with poor colour rendering (e.g. high-pressure sodium lamp) and non-neutral illumination (e.g. blue skylight or a low-pressure sodium lamp). It should also be noted that most materials have rather smooth reflectance spectra and inter-reflections will therefore show the predicted shifts toward the peak of the reflectance spectra, as demonstrated in the empirical studies. Inter-reflections and chromatic light field effects are also subject to the spatial distribution of the light sources and their positions. A light source that is more directional (e.g. a narrow-beam spotlight) might cause weaker effects than a more diffuse light source such as a luminous planar panel.
In empirical testing 1, we simulated the colour effects of accumulated orders of inter-reflections in a uni-chromatic space under typical planar white lighting. The theoretically predicted and simulated spectral shifts could indeed be reproduced in computer-rendered spaces. Results for surfaces of which the spectral reflectance is less than 0.5 were also found to be consistent with a previous study in which it was found that for such surfaces the inter-reflections have almost no effect on the chromatic appearance. 43 Results for surfaces with higher spectral reflectances showed the predicted effects. Moreover, we extended our light-field methods to show how these spectral effects on the first-order properties of light fields, the light density and light vector, can be measured, visualised and understood.
In empirical testing 2, fine spectral measurements were taken in real room settings under white lighting. The shape of the light density spectrum was shown to be primarily affected by accumulated orders of (inter-)reflected light. The spectral shape of the light vector was found to be close to that of the illuminant with a minor impact of the (inter-)reflected light. These differential effects on the different components of the resulting light field were predicted and demonstrated using the extended light field methods. The differential effects were also shown to be dependent on the lighting spectrum. These effects can be spectrally tuned via the lighting. In general, the relative spectral differences between troughs and peaks of reflected light can be increased (or decreased) by tuning the troughs and peaks of the illuminant to be similar (or inverted) to those of the material. In natural scenes, such differential effects will have an impact on the appearance of 3D objects: shadows will be filled in with mainly the light density and the lightest parts will be determined for a large part by the light vector. This will cause chromatic effects in addition to the well-known modelling effects due to luminance gradients. 52 This raises questions such as whether these effects will be noticeable, under which conditions, and when they can safely be ignored. Colour adaptation and constancy mechanisms might discount such effects, certainly if the chromatic effects are within the ballpark of natural variations, such as happen with a blue sky and direct sunlight or under a canopy. However, in artificial conditions such as an art gallery with sculptures or in chromatic architectural spaces, the effects described, measured and visualised in this paper will have significant effects on people and objects worth considering.
A tool can be used for coarse-grained predictions under typical white sources. Figure 10 shows variations of colours and their inter-reflection effects that one might judge to be more or less ‘harmonious’53–56 and thus of importance for lighting professionals working on 3D designs. The interface above the boxes shows the BGR spectral values of the finish, which in practice can be estimated with a smartphone. In this manner, it is possible to get a quick idea of the appearance of a space for a specific finish and lighting. It should be noted however that the display medium and viewing conditions have a major impact on colour perception. Computer simulations currently are much used to communicate design concepts and evaluate colour schemes. Our tool provides a coarse visual guesstimation of the impact of chromatic inter-reflections on spatial and chromatic articulation. Coarse-grained predictions of spectral effects by our tool. The first column shows three box-space visualisations under a warm (a) white light source. The second and third columns show the same finished box spaces illuminated by neutral (b) and cool (c) white light sources. The computer-generated renders were made using standard 2.2 gamma correction after combining the BGR spectral bins and optical mixing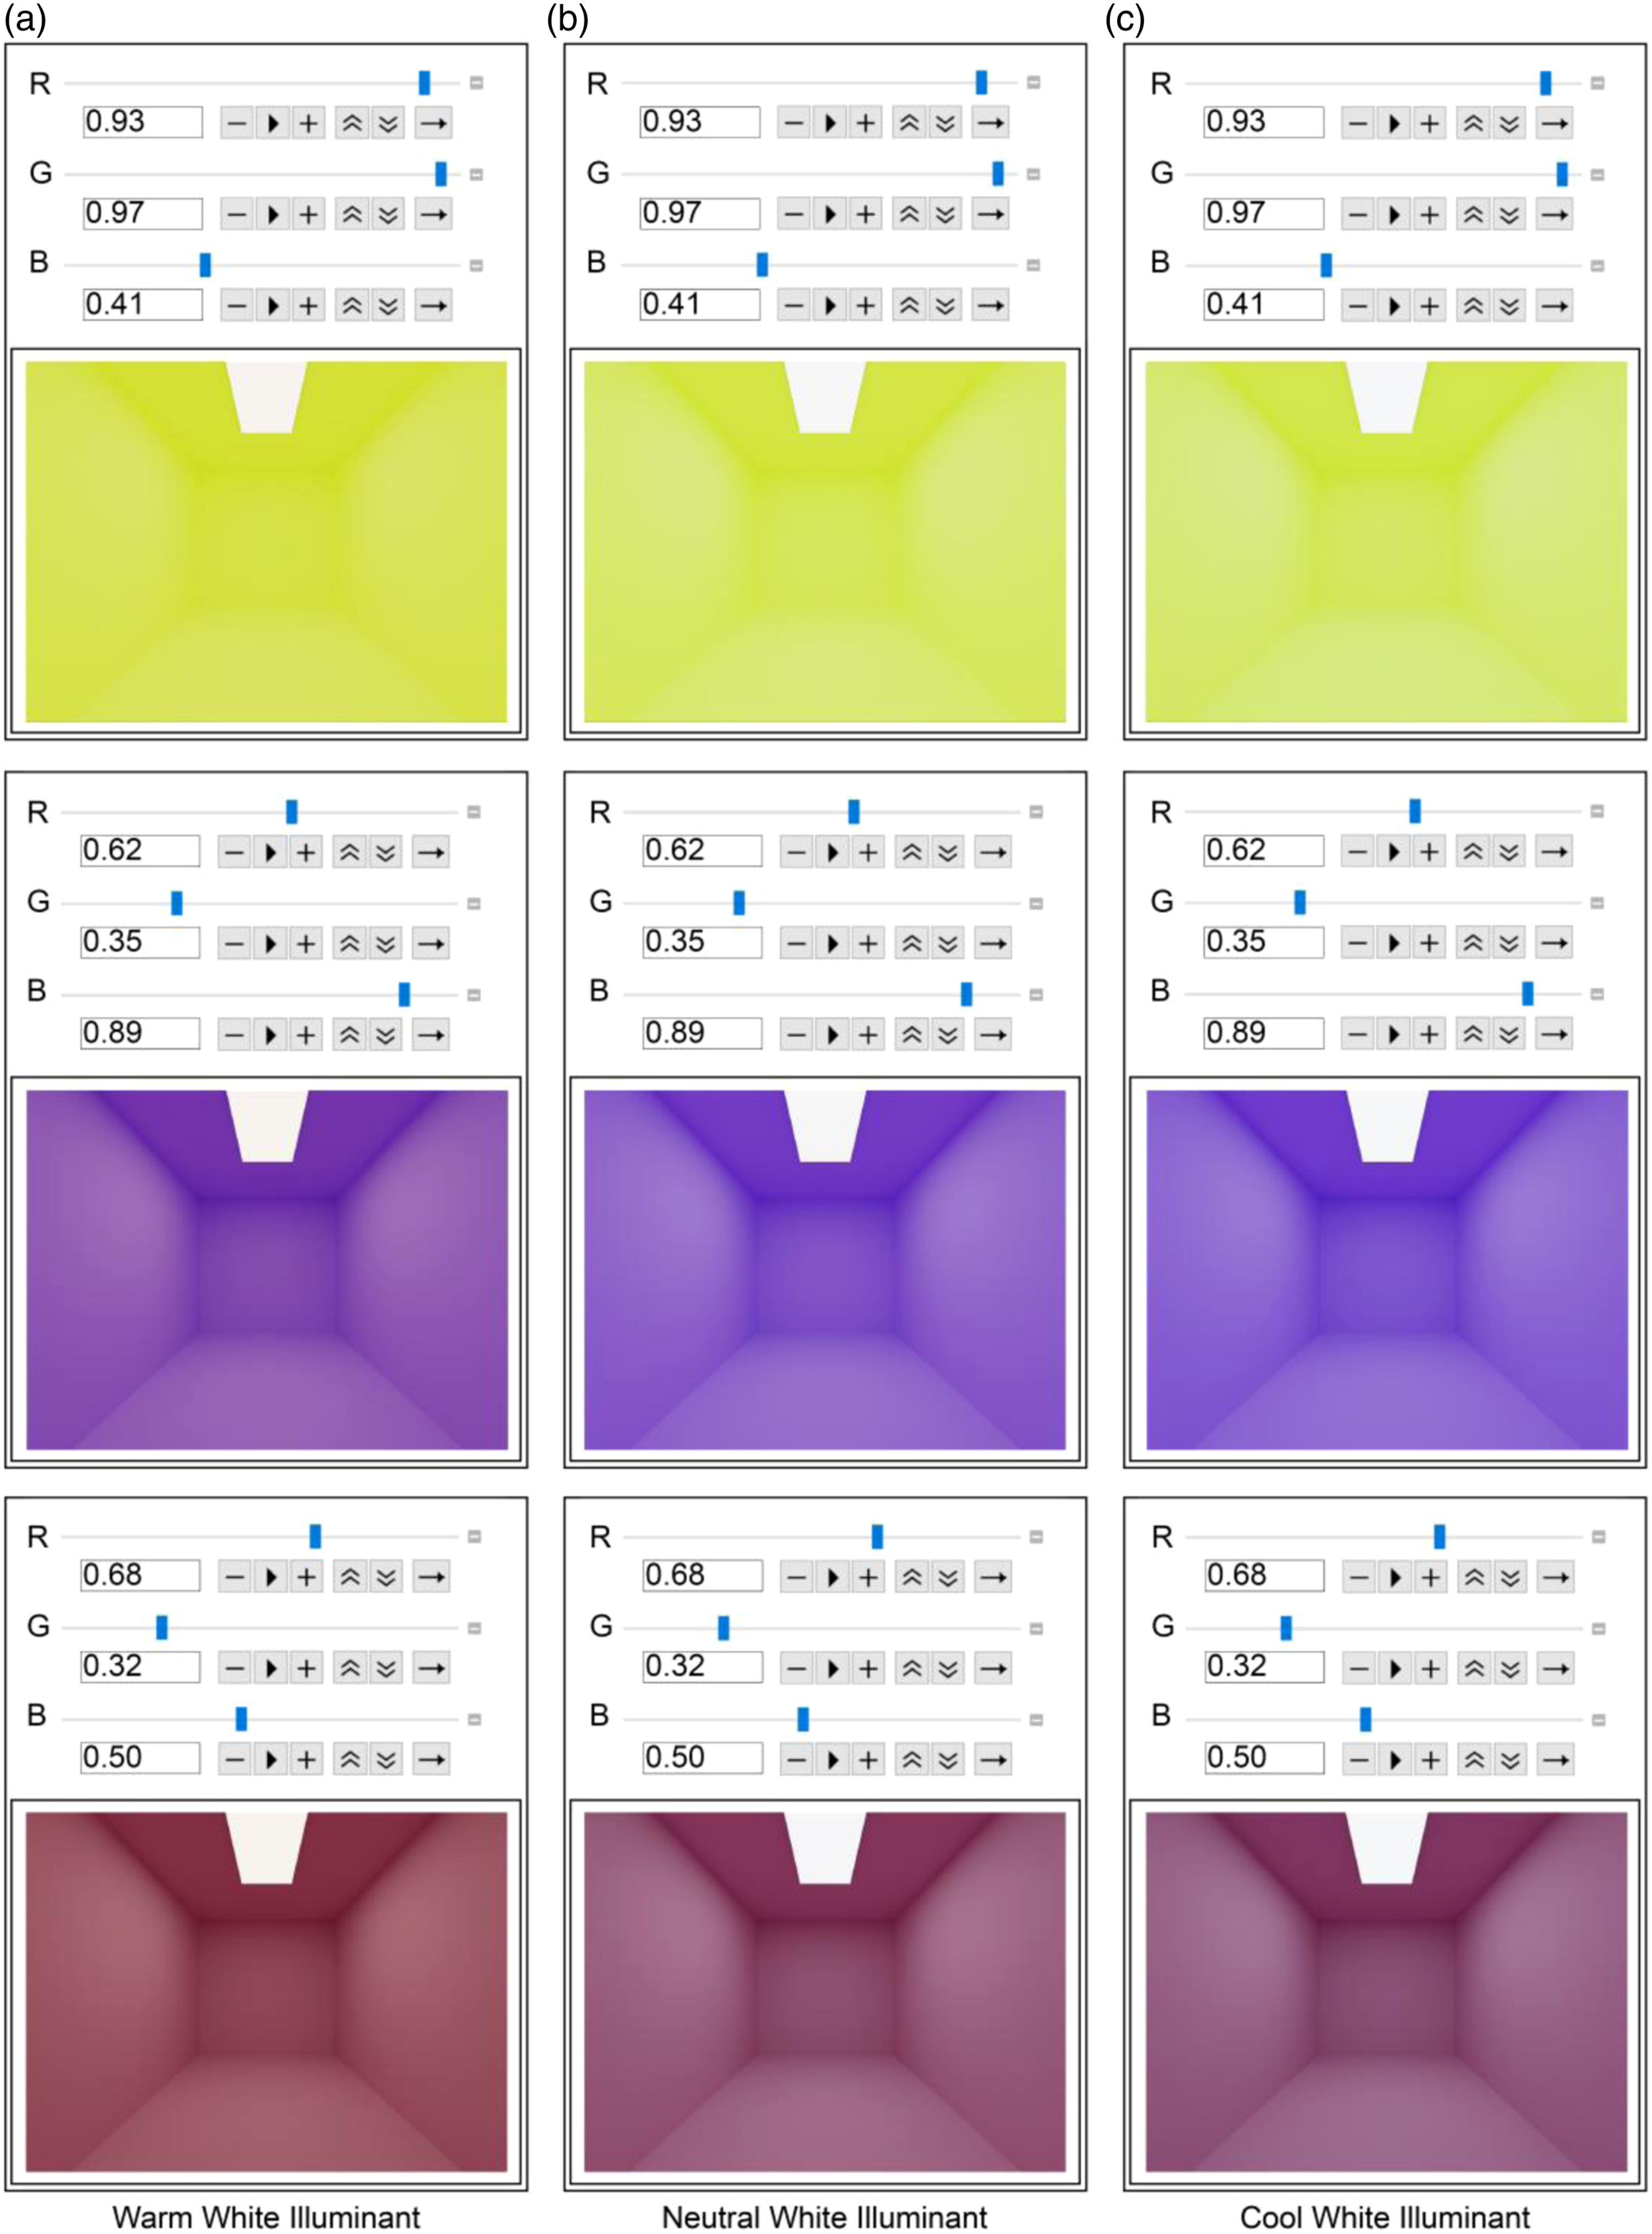
This study was limited to spaces furnished with diffusely scattering materials and uniformly coloured rooms. In most natural scenes, diffuse scattering dominates the reflectance modes. Therefore, our results apply to most scenes. Moreover, in empirical testing 2 the boxes were furnished with paper that actually was quite glossy. Such materials still have a very significant diffuse scattering mode – in combination with a forward scattering mode. Many (or perhaps even most) materials in our natural ecology have a diffuse scattering mode. Our findings thus describe phenomena that occur widely ‘in the wild’, not just in perfectly Lambertian scenes. They can be observed in many daily life scenes. More complex and exotic scenes composed of multiple coloured and non-diffusely scattering surfaces, such as mirror and transparent materials, might however show more complicated effects.
6. Conclusion
In conclusion, light in a space varies not just as a function of position in the space and the direction of observation but also of spectral power. Reflectance spectra have a prominent effect on the chromatic properties of the light field due to inter-reflections, via the indirect contribution, and can influence the apparent brightness, saturation and even hue. Here, we showed how these effects could be measured and visualised for the light density and light vector or flow in the room. The spectral properties of the light vector were indeed shown to be impacted only slightly, while the light density clearly showed the predicted effects, and both were impacted stronger in deep parts of the scene. Our findings show the importance to include 6D light field effects of light-material interactions in spatial designs.
Footnotes
Declaration of conflicting interests
The authors declared no potential conflicts of interest with respect to the research, authorship, and/or publication of this article.
Funding
The authors disclosed receipt of the following financial support for the research, authorship, and/or publication of this article: This work was supported by the Marie Skłodowska-Curie Action – Innovative Training Network (MSCA-ITN-ETN) DyViTo: ‘Dynamics in Vision and Touch – the look and feel of stuff’ under the European Union’s Horizon 2020 research and innovation programme [grant number 765121, 2017].