
Abstract
Mean room surface exitance (MRSE) is a metric proposed to assess lighting quantity within a new design methodology focused on ambient and target illumination. This research builds upon findings from previous research examining the suitability of MRSE as a metric for assessing ambient illumination brightness levels and illumination adequacy for offices. An experiment was conducted to investigate a finding from previous studies that a linear relationship existed between perceived adequacy of illumination (PAI) and MRSE. It was found that the relationship diverges from linear once the scale of MRSE values is extended above the 100 lm/m2. This study also suggests a relationship between spatial brightness and MRSE for an extended range of MRSE values up to 1400 lm/m2. The findings from this research provide insight into a tentative range of MRSE levels that may be suitable for an office environment.
1. Introduction
Traditional lighting codes and standards for workplaces have primarily aimed to provide adequate light on the task1–3 or on a horizontal plane. 4 The metric used most often is horizontal illuminance (Eh). The Society of Light and Lighting (SLL) Code for Lighting recognises that lighting recommendations only serve to eliminate bad lighting, 2 and there is a trend away from focussing on working planes alone. 5
Boyce et al.
6
argue that what is needed is in fact a paradigm shift, with new interior design methods that give priority to lighting the space rather than a horizontal working plane. They provide four reasons to support their view: The ubiquitous use of self-illuminated screens has changed visual needs in many work environments; Reduced number and difficulty of visual tasks, even when paper-based; Growing importance of human health and the visual and non-visual effects of lighting; Continuing to design lighting focused mainly on visual tasks–that often do not exist–means that we will miss an opportunity to ensure lighting will make a real contribution in buildings, and this would be wasteful of energy.
Cuttle first introduced the term perceived adequacy of illumination (PAI) in 2010. 7 PAI can be interpreted as the photometric correlation of how the users of a space might judge it to appear adequately illuminated. Cuttle considered PAI as a means to implement radical change in design towards ambient lighting. 8 He envisaged PAI evaluation being on a binary basis, adequate or inadequate. He introduced mean room surface exitance (MRSE), a measure of the overall density of reflected flux within the space, 7 to assess this. He expected that PAI levels would increase with MRSE increments up to a certain level, and following a sigmoid trend, would then peak and plateau. 8 He proposed that PAI would be used by legislators to achieve a minimum value of ambient illuminance.
Room brightness was classified by Cuttle as perceived brightness of illumination (PBI), 9 an assessment of how brightly lit the space appears. PBI is the same as spatial brightness, 10 the term used in the current study; however, mention is made to PBI in Cuttle’s work at times.
Cuttle has proposed a new interior lighting design procedure, the lighting design objectives (LiDOs),
9
which uses PAI, PBI, MRSE and target ambient illuminance ratio (TAIR) as shown in Figure 1. This study focuses on ambient illumination, investigating PAI, spatial brightness and MRSE in a small office. Cuttle’s lighting design objectives (LiDOs) procedure
9
* This area relates to the present research that focuses on ambient illumination, perceived adequacy of illumination (PAI), perceived brightness of illumination (PBI)–or spatial brightness–and mean room surface exitance (MRSE)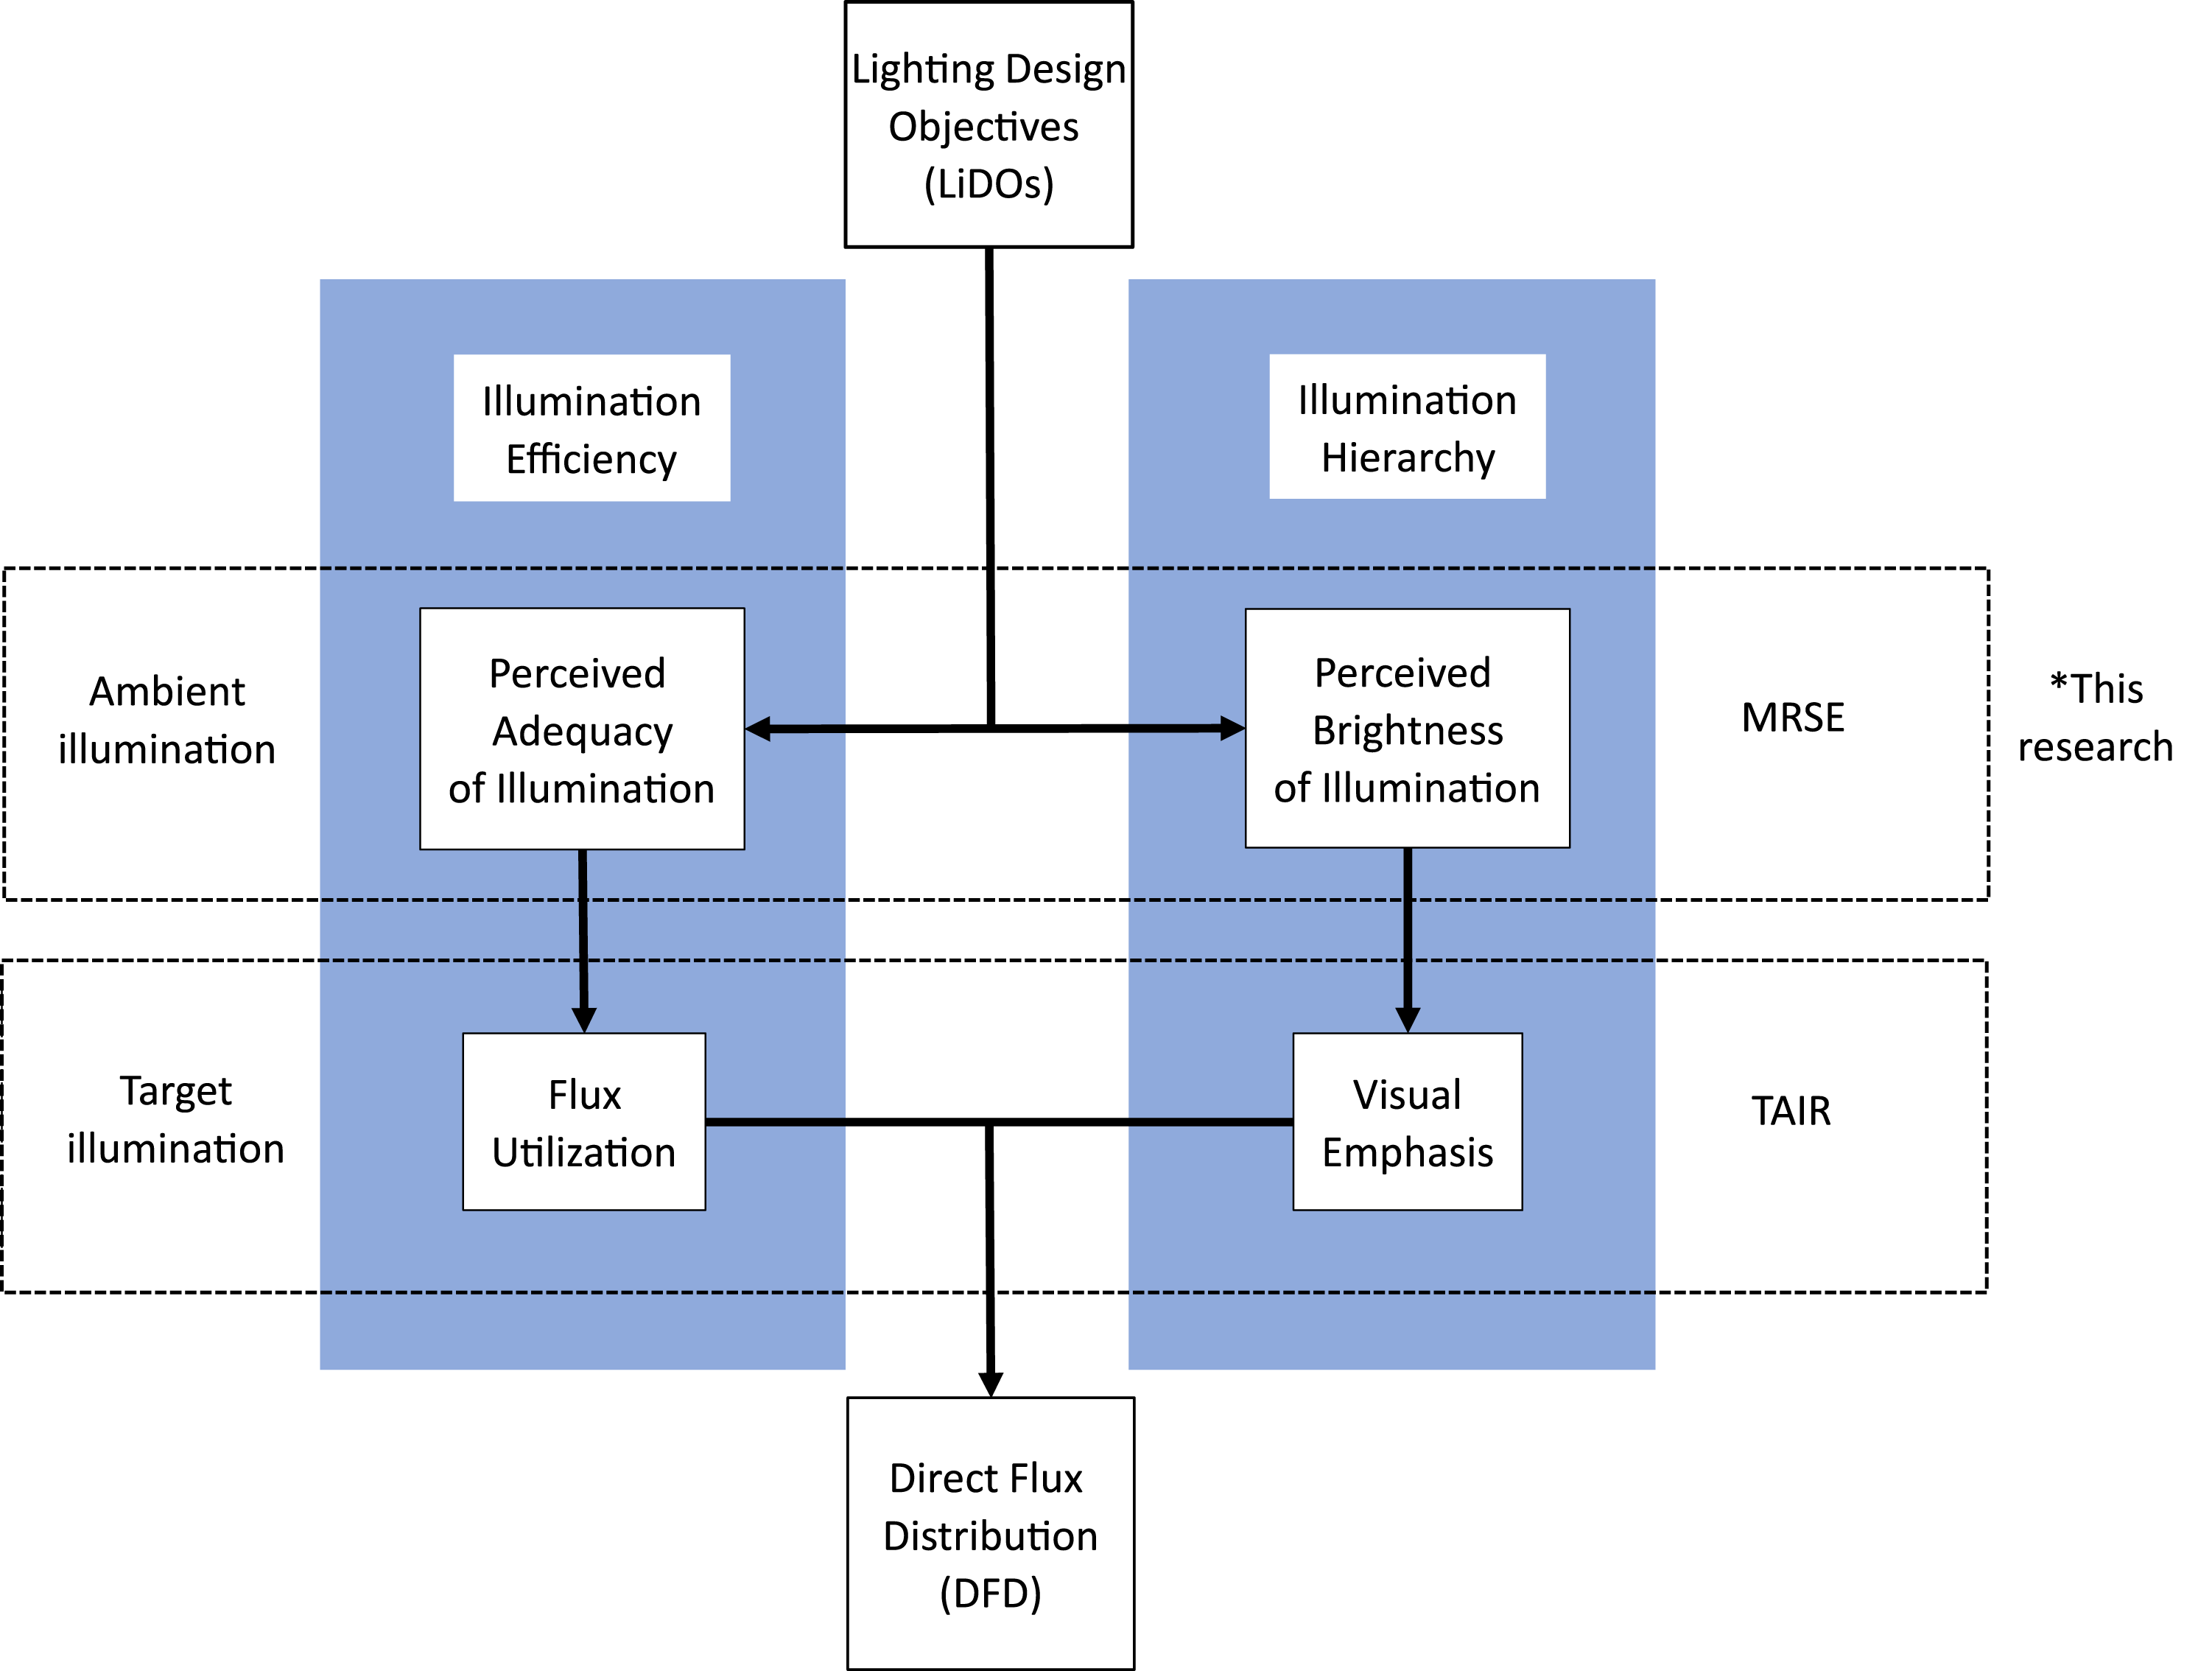
1.1 Investigations of MRSE
Previous research by Duff et al. 11 provided encouragement that Cuttle’s proposals7–9 for ambient lighting could provide an improvement on existing methods based around horizontal illuminance. The main obstacles towards MRSE/TAIR implementation were identified as the difficulty of measurement, the lack of experimental evidence that MRSE was related to peoples’ satisfaction and perception of the amount of light in a space, and uncertainty that MRSE was a better metric than illuminance on the horizontal working plane in this regard. 12
Duff et al. 13 developed procedures that facilitated MRSE measurement and calculation, applying a photographic measurement technique using high dynamic range (HDR) imaging to MRSE measurement in field 13 and developing an MRSE equation alternative to Cuttle’s. 14 Dai et al. 15 also tested the accuracy of Cuttle’s MRSE equation and this resulted in a tool for calculating MRSE in practical lighting design.
Duff et al.11,16,17 investigated ambient illumination and conducted a series of experiments on participants’ reactions when exposed to a range of MRSE conditions. These subjective brightness assessments were made in a viewing booth 16 and in a small office. 17 Duff et al.’s experiments exposed the participants to three variables: MRSE, light distribution and surface reflectance. In both experiments, spatial brightness was assessed on a seven-point categorical scale from very dim to very bright. In the small office experiment, participants also made PAI assessments of different viewing conditions generated from the combination of the three variables.
In the booth experiment, a simple linear relationship existed between spatial brightness and MRSE (R2 = 0.89). It was also shown that there was an unpredictable relationship between spatial brightness and Eh.11,16 In the office experiment, it was found that a simple linear relationship existed between PAI and MRSE (R2 = 0.82) as well as spatial brightness and MRSE (R2 = 0.79). Again, an unpredictable relationship was found between Eh and both PAI and spatial brightness. Finally, levels of spatial brightness were strongly correlated with levels of PAI (no R2 reported).11,17 Duff and colleagues also found that while the spatial brightness-MRSE correlations were strongly significant in both the experiments, the differences in luminaire distribution and room surface reflectance were not statistically significant. 11
Some caution needs to be applied to Duff et al.’s findings. The limited range of MRSE levels, 25–100 lm/m2, effectively restricted the spatial brightness responses to the range of 2 (dim) to 4 (neither dim nor bright). Duff et al. 11 acknowledged it was a distinct limitation that there were no responses that rated even slightly bright. In addition, in the office experiment, the PAI yes response only reached about 50% satisfaction levels at 100 lm/m2. This means there is a need for further experimentation at levels of MRSE above 100 lm/m2.
1.2 Aim and scope
The main aim of this research was to establish the human visual response to ambient illumination on a much-expanded range of MRSE than previously investigated.
The objectives were to: Provide an analysis of PAI over a wider range of MRSE levels than previously researched–up to 1400 lm/m2–and determine if Cuttle’s hypothesis that there is a sigmoid PAI–MRSE relationship that increases up to a value and then plateaus is true;
8
Establish the functional relationship between spatial brightness and MRSE over an extended range up to 1400 lm/m2; Explore appropriate ambient light levels for an experimental office and at least tentatively establish a possible range of MRSE values for offices more generally.
This research expanded upon previous work by Duff et al. and used a mixed-methods approach. A small test room furnished as an office and that excluded daylight was used throughout. Reflectances and lighting distribution were kept constant, and any small SPD variations were considered negligible. In this way, the number of variables was minimised.
PAI was evaluated using a dichotomous question and by collecting qualitative data to explain the reasons behind participants’ choices. Two methods were compared for spatial brightness evaluation: category rating judgments and sequential discrimination judgments.
2. Method
2.1 Apparatus
The experiment was conducted in a freshly painted laboratory 5.0 m long, 2.9 m wide and 2.85 m high. This work focused on electric light to minimise variables and tightly control the visual environment. One existing small window was completely shielded using a wooden panel to exclude all daylight from the room. The room was painted in high reflectance white paint for the ceiling and walls (RAL 9010) and a grey coloured carpet was installed (RAL 7015), achieving reflectances of nominally 90/90/15 for C/W/F, respectively, with estimated 5% variability. A single desk and chair (ρ = 0.2) furnished the room.
2.2 Lighting conditions
Lighting was provided by six dimmable twin luminaires; Thorn PopPack Pro batten down-lighters as shown in Figure 2. Two of them were ceiling mounted and four of them were wall mounted as up/down with a custom-made lighting pelmet attached. Luminaire type used and its photometric distribution for ceiling mounting (copyright was given by Thorn lighting for use of this image)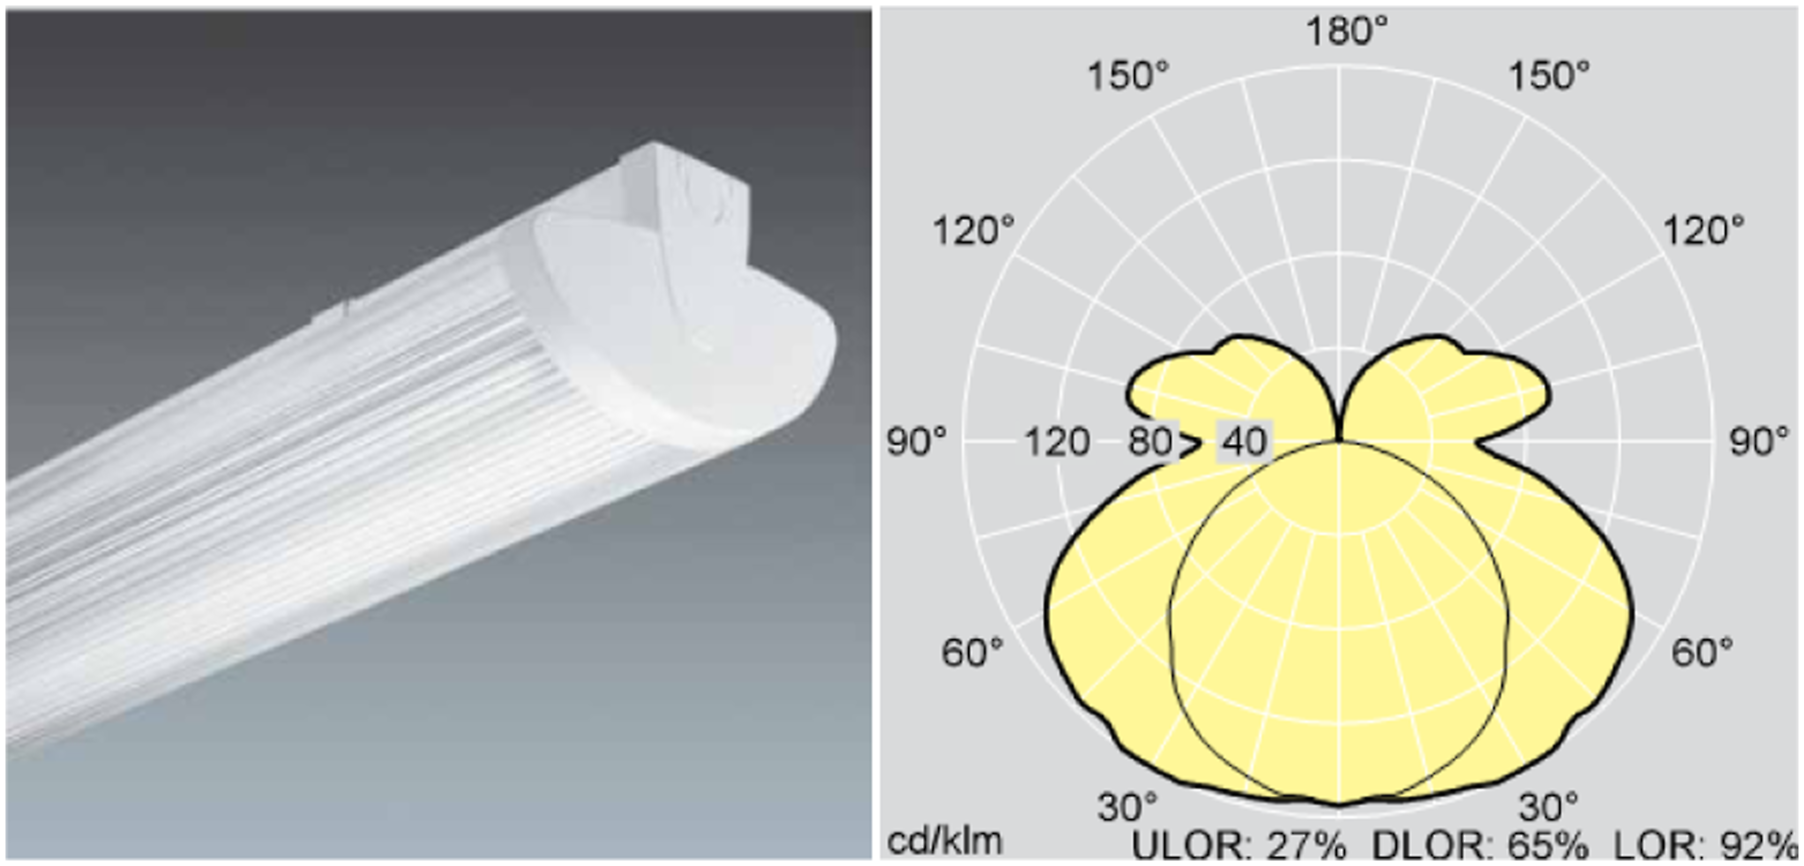
Philips 49 W T5 fluorescent lamps, with electronic ballasts, were used throughout. They had a correlated colour temperature (CCT) of 4000 K and general colour rendering index Ra > 80. Fluorescent lamps were used because of their reliability and affordability. Luminaires were symmetrically positioned to both longitudinal and transverse room axes, as shown in Figure 3. All the luminaires were circuited together and dimmed by a Helvar seven-step DALI dimmer. Before the experiment commenced, all lamps were run for a sufficient length of time so that output stabilised, as determined by reviewing continuous illuminance measurements. MRSE measurements taken prior to and in the middle of data collection showed no significant variation. Plan and elevation of the room lighting with: (1) Thorn fluorescents lighting, (2) fluorescents lighting with a lighting pelmet, (3) participant position, (4) researcher position and (5) lighting controls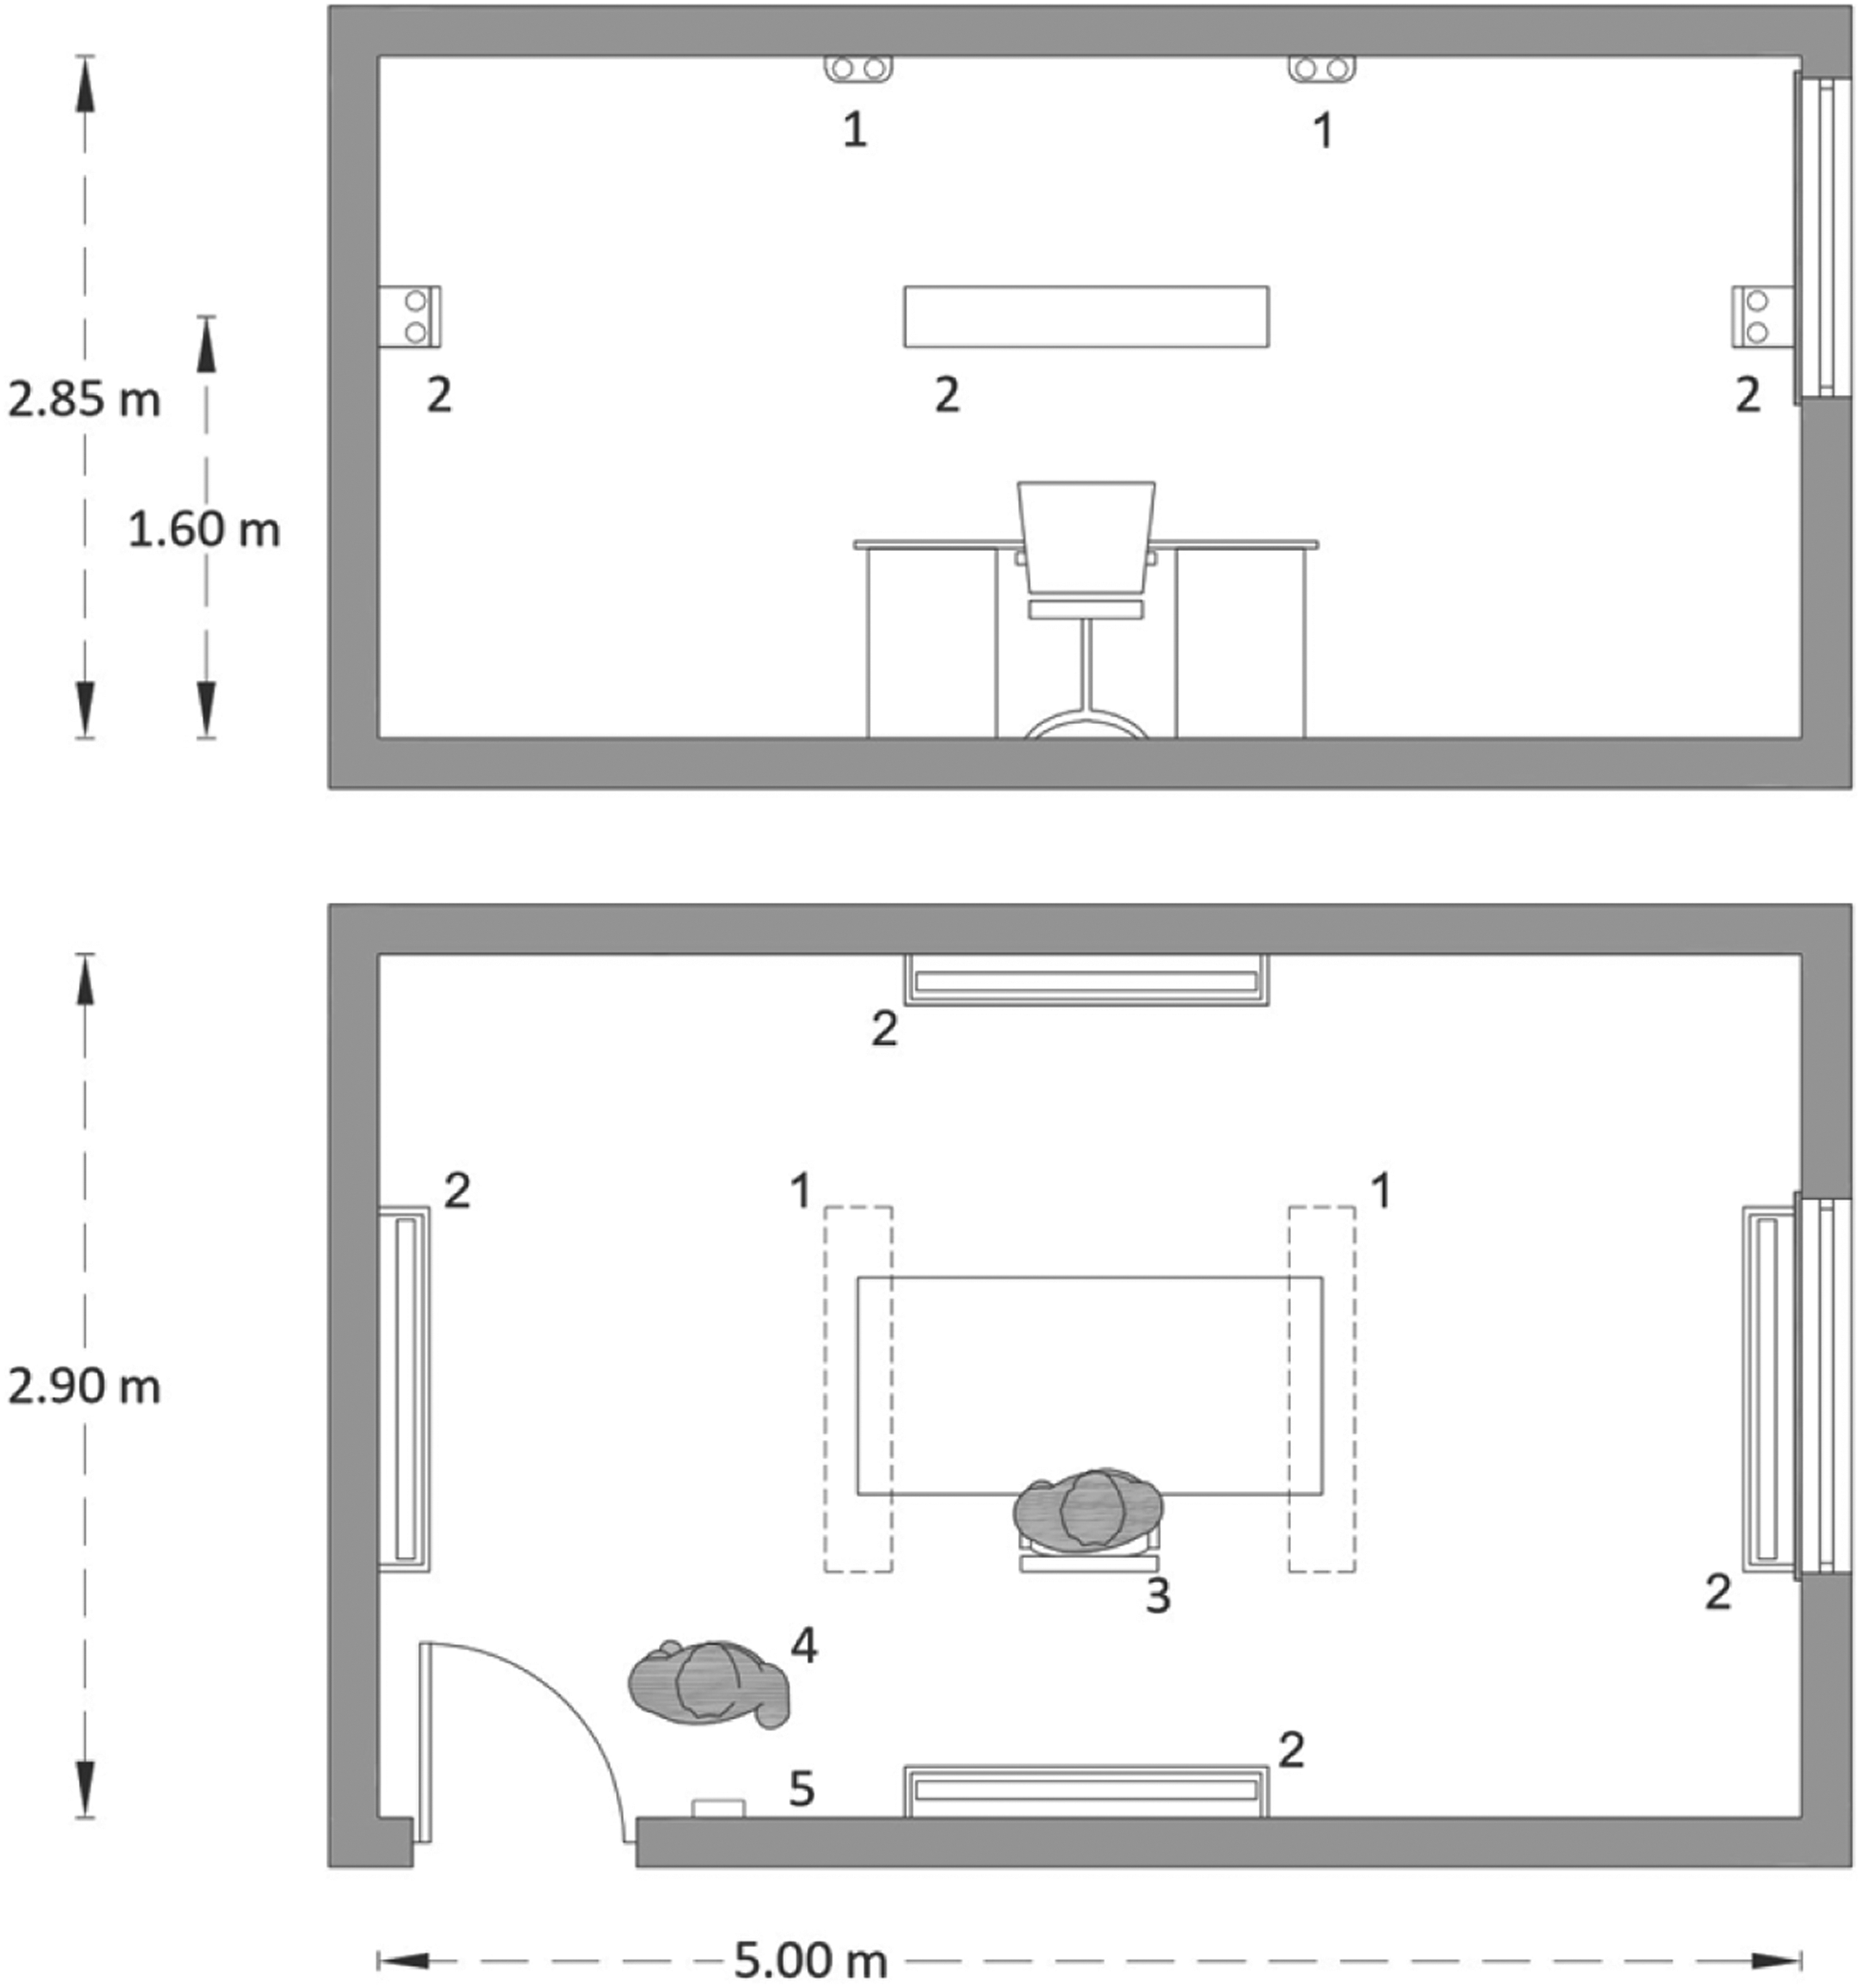
The MRSE in the room, for each planned lighting scene, was set starting from measurements using the HDR imaging technique that was documented by Duff. 13 The MRSE in the room was measured setting the luminaires at the full output. The measurement was taken using a tripod and a Canon EOS 1300D digital single-lens reflex (DSLR) camera at 1.35 m height. The camera was fitted with a wide-angle Canon EF-S 18–55 mm f/3.5–5.6 IS STM lens used at its maximum angle (64o). Two points of view were used to take the measurement. Images were processed using RADIANCE; an HDR image was generated for each point of view, direct flux was excluded, and the MRSE, which corresponds to the indirect illuminance value, was calculated.
Seven lighting scenes resulting from luminous flux variations of both ceiling and wall-mounted luminaires were then set. Each scene corresponded to a specific MRSE target level: 22, 44, 88, 175, 350, 700 and 1400 lm/m2. All of the lighting was dimmed proportionally to generate the scene output indicated, so the relative luminance distribution did not change. Once set, the level of MRSE for each scene was verified using the same HDR imaging technique described above.13,18 The illuminance on the horizontal plane was also recorded. Measured values are reported in Section 3.
Some studies19–21 have shown that stimulus range may affect quantitative experimental data like the outcome of category rating tasks 21 or discrimination tasks. 22 This research extended the MRSE range values compared to prior work, so it is important to recognise the potential for range bias when comparing the results.
2.3 Participants
An adequate sample size was determined based on an a priori evaluation through GPower software.23–25 Thirty-three was the minimum number of participants needed to ensure statistically significant results (α = 0.05) with an 80% probability (1-β = 0.80) assessing for a strong relationship between the variables (f2 = 0.2).
33 non–lighting-expert volunteers from students within the Technological University Dublin took part, consisting of 20 males and 13 females, having a mean age of 27.9 years with standard deviation of 6.6 years.
2.4 Dependent measures
PAI was assessed using a dichotomous choice question and by collecting qualitative data to explain the reasons behind the participants choice. The question was: Does this space appear adequately lit? Yes or no were the possible answers. PAI assessments for repeated scenes were made to check for consistent responses. Qualitative data were collected by means of written comments to explain the reasons for what participants were thinking and why they were choosing specific options. The qualitative data were used to better understand participants’ responses; it can provide a richer explanation and insight to the quantitative responses. 26
Two methods, category rating judgments and sequential discrimination judgments, 27 were used to measure spatial brightness in order to triangulate the findings and obtain more confidence in drawing conclusions. Each is subsequently described in detail. The order of spatial brightness assessment methods was randomised.
2.5 Method 1: Category rating
Participants used a seven-point categorical scale from very dimly lit to very brightly lit to evaluate how the space appeared under seven different MRSE levels. The seven different ambient illumination levels were randomly presented to participants and the polarity of scales was also randomised to reduce any possible order bias. 19 A randomisation application was used for determining a different randomised series for each participant. 28 Three scenes–44, 175 and 700 lm/m2–were chosen and randomly repeated among the others to check if responses were consistent. 19 The seven different lighting scenes/MRSE levels are coded as A = 22, B = 44, C = 88, D = 175, E = 350, F = 700 and G = 1400 lm/m2 in this manuscript. The three repeated scenes are denoted B1 = 44, D1 = 175 and F1 = 700 lm/m2. Test participants were exposed to each lighting condition for 2 min before answering questions.
When dealing with Likert-like scales, a tendency of selecting the central point of the scale has been reported in some research, thus rendering a response bias; to counter this, a scale with an even number of levels was suggested.19,29 However, in other research studies, evidence was provided that there were no significant differences in the information gained using, for example, six or nine values/categories, 30 or that having five, six, seven or eight values/categories did not lead to significant differences in central tendency when making brightness judgments. 20 In this study, a seven-category scale was used to be consistent with previous research by Duff et al. and allow for direct comparison of results.
2.6 Method 2: Sequential discrimination
For this method, 21 different pairs were identified among the possible combinations for the seven lighting scenes. Three null conditions pairs were presented, using the 44, 175, 700 lm/m2 MRSE levels, giving in total 24 pairs. The pairs were presented to each participant in a different randomised sequence, and the order of presentation within each pair was also randomised.
For each of the 24 pairs, participants were asked to make a forced choice and state which lighting scene was the brighter of the two. Each pair was alternated three times, with each stimulus shown for 5 s and a 30 millisecond dark interval in between. This procedure was based on Berman et al. 31
Written instructions were provided to participants at the beginning of the session. They were asked to view and judge the overall office space around them for the experiment. Participants took part in the experiment one at a time. They were seated at the desk for the duration of the study and the researcher was standing behind them and out of their eye line as shown in Figure 3. The total duration of participation in the experiment was about forty minutes, with short breaks in between assessments.
3. Results and analysis
The recorded data from both category rating and sequential discrimination questionnaires were analysed using IBM SPSS Statistics 26 software.
Stimuli data and responses data overview from both methods is presented
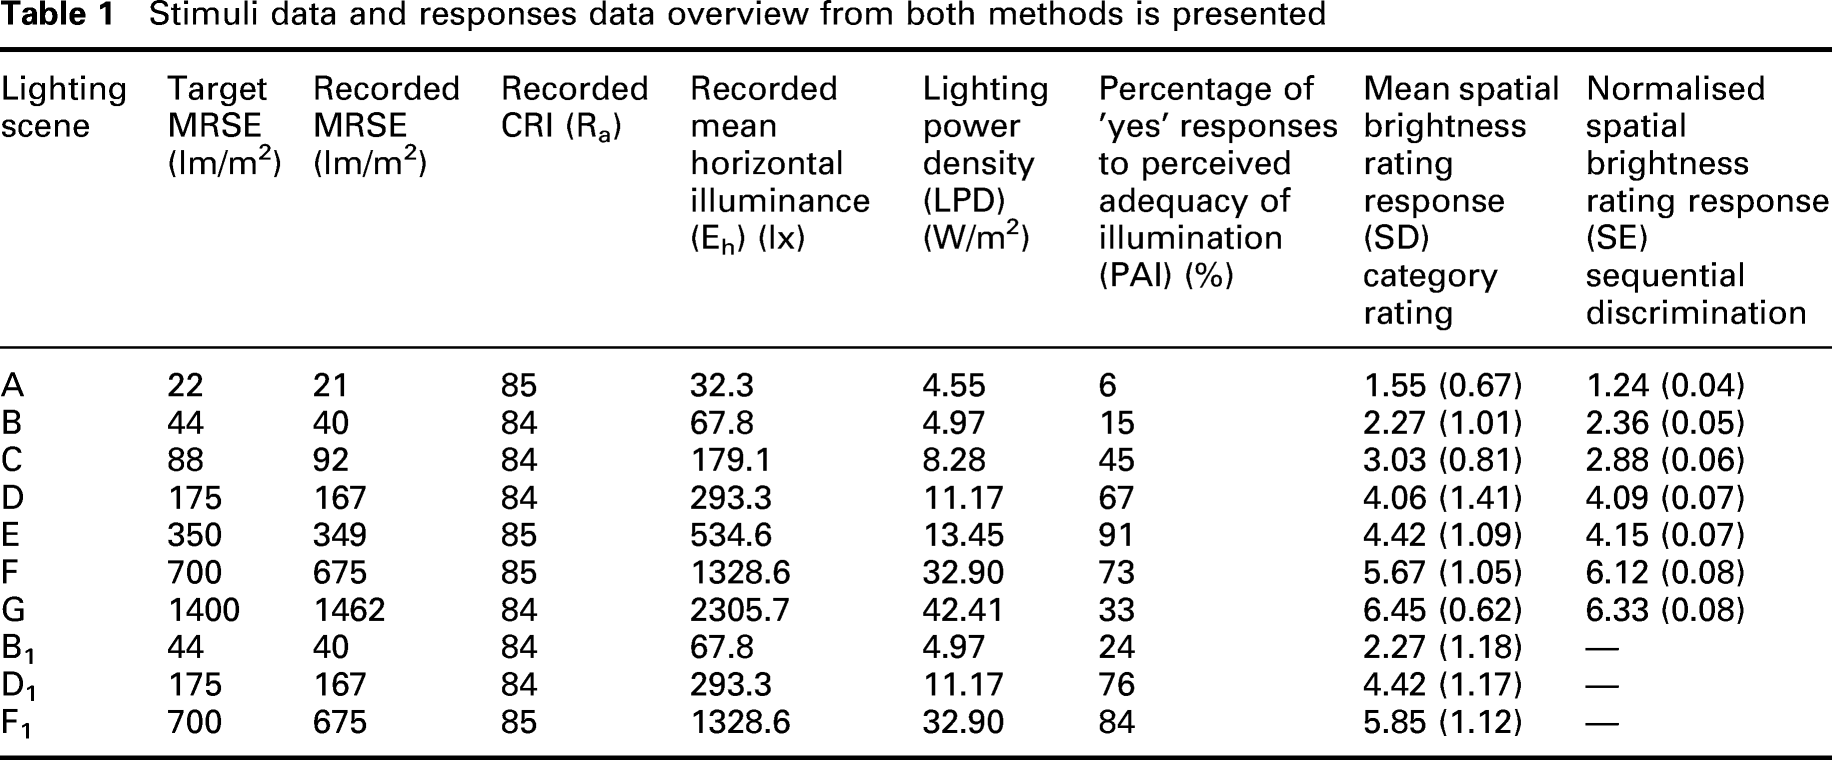
The difference between MRSE target and set values was between 0.2% and 10% due to the restrictions of the dimming system used. The CRI was measured using a calibrated portable device (AsenseTek Lighting Navigator) (±3.5% stated accuracy). It varied from 84 to 85. Eh and lighting power were measured, respectively, with AsenseTek Lighting Navigator illuminance metre (±5% stated accuracy) and Fluke 345 PQ clamp metre (±2.5% stated accuracy) at the desk level during the experiment but were not a focus of this research.
3.1 Influence of repeated scenes
A set of statistical tests was applied to evaluate if the differences in assessments of PAI and spatial brightness between the first and the repeated scenes were statistically significant.
A McNemar test was performed for the dichotomous choice question that assessed PAI. No statistically significant difference was found for the Scene B/B1 pair (X 2 = 0.44, N = 33, p = 0.505), Scene D/D1 pair (X 2 = 0.36, N = 33, p = 0.546) or Scene F/F1 pair (X 2 = 0.8, N = 33, p = 0.371).
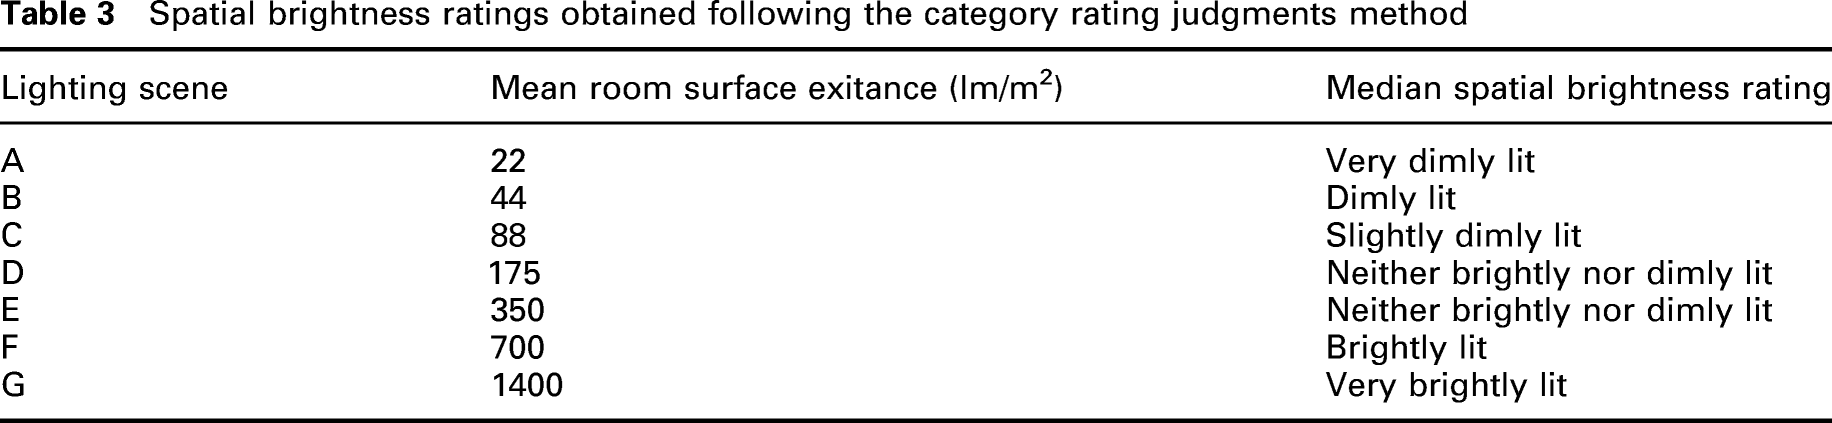
For spatial brightness, the three repeated scenes reported the same median rating: the B/B1 pair was rated as dimly lit, the D/D1 pair was rated as neither dimly lit nor brightly lit and the F/F1 pair was rated as brightly lit. The Wilcoxon signed-rank test was performed for the seven-point categorical scale that assessed spatial brightness for the category rating judgments method. Scene B/B1 (Z = −0.018; p = 0.985), Scene D/D1 (Z = −1.363; p = 0.173) and Scene F/F1 (Z = −1.209; p = 0.227) produced no statistically significant difference between participants’ first and second response.
It was concluded that the order of exposure had negligible impact on participants’ PAI or spatial brightness assessments for the three repeated scenes.
According to the Dunn Rankin variance stable rank sums, the difference between the two scenes for data gathered from the sequential discrimination judgments method was not significant for the average of the three null conditions. This suggests that the order of exposure can be considered negligible.
3.2 PAI–MRSE relationship
Figure 4 compares normalised PAI Yes responses against the corresponding MRSE levels. The responses for the first and second repetitions were averaged for the three repeated scenes, given the lack of statistically significant difference between them. Percentage of Yes responses to the question: Does this space appear adequately lit?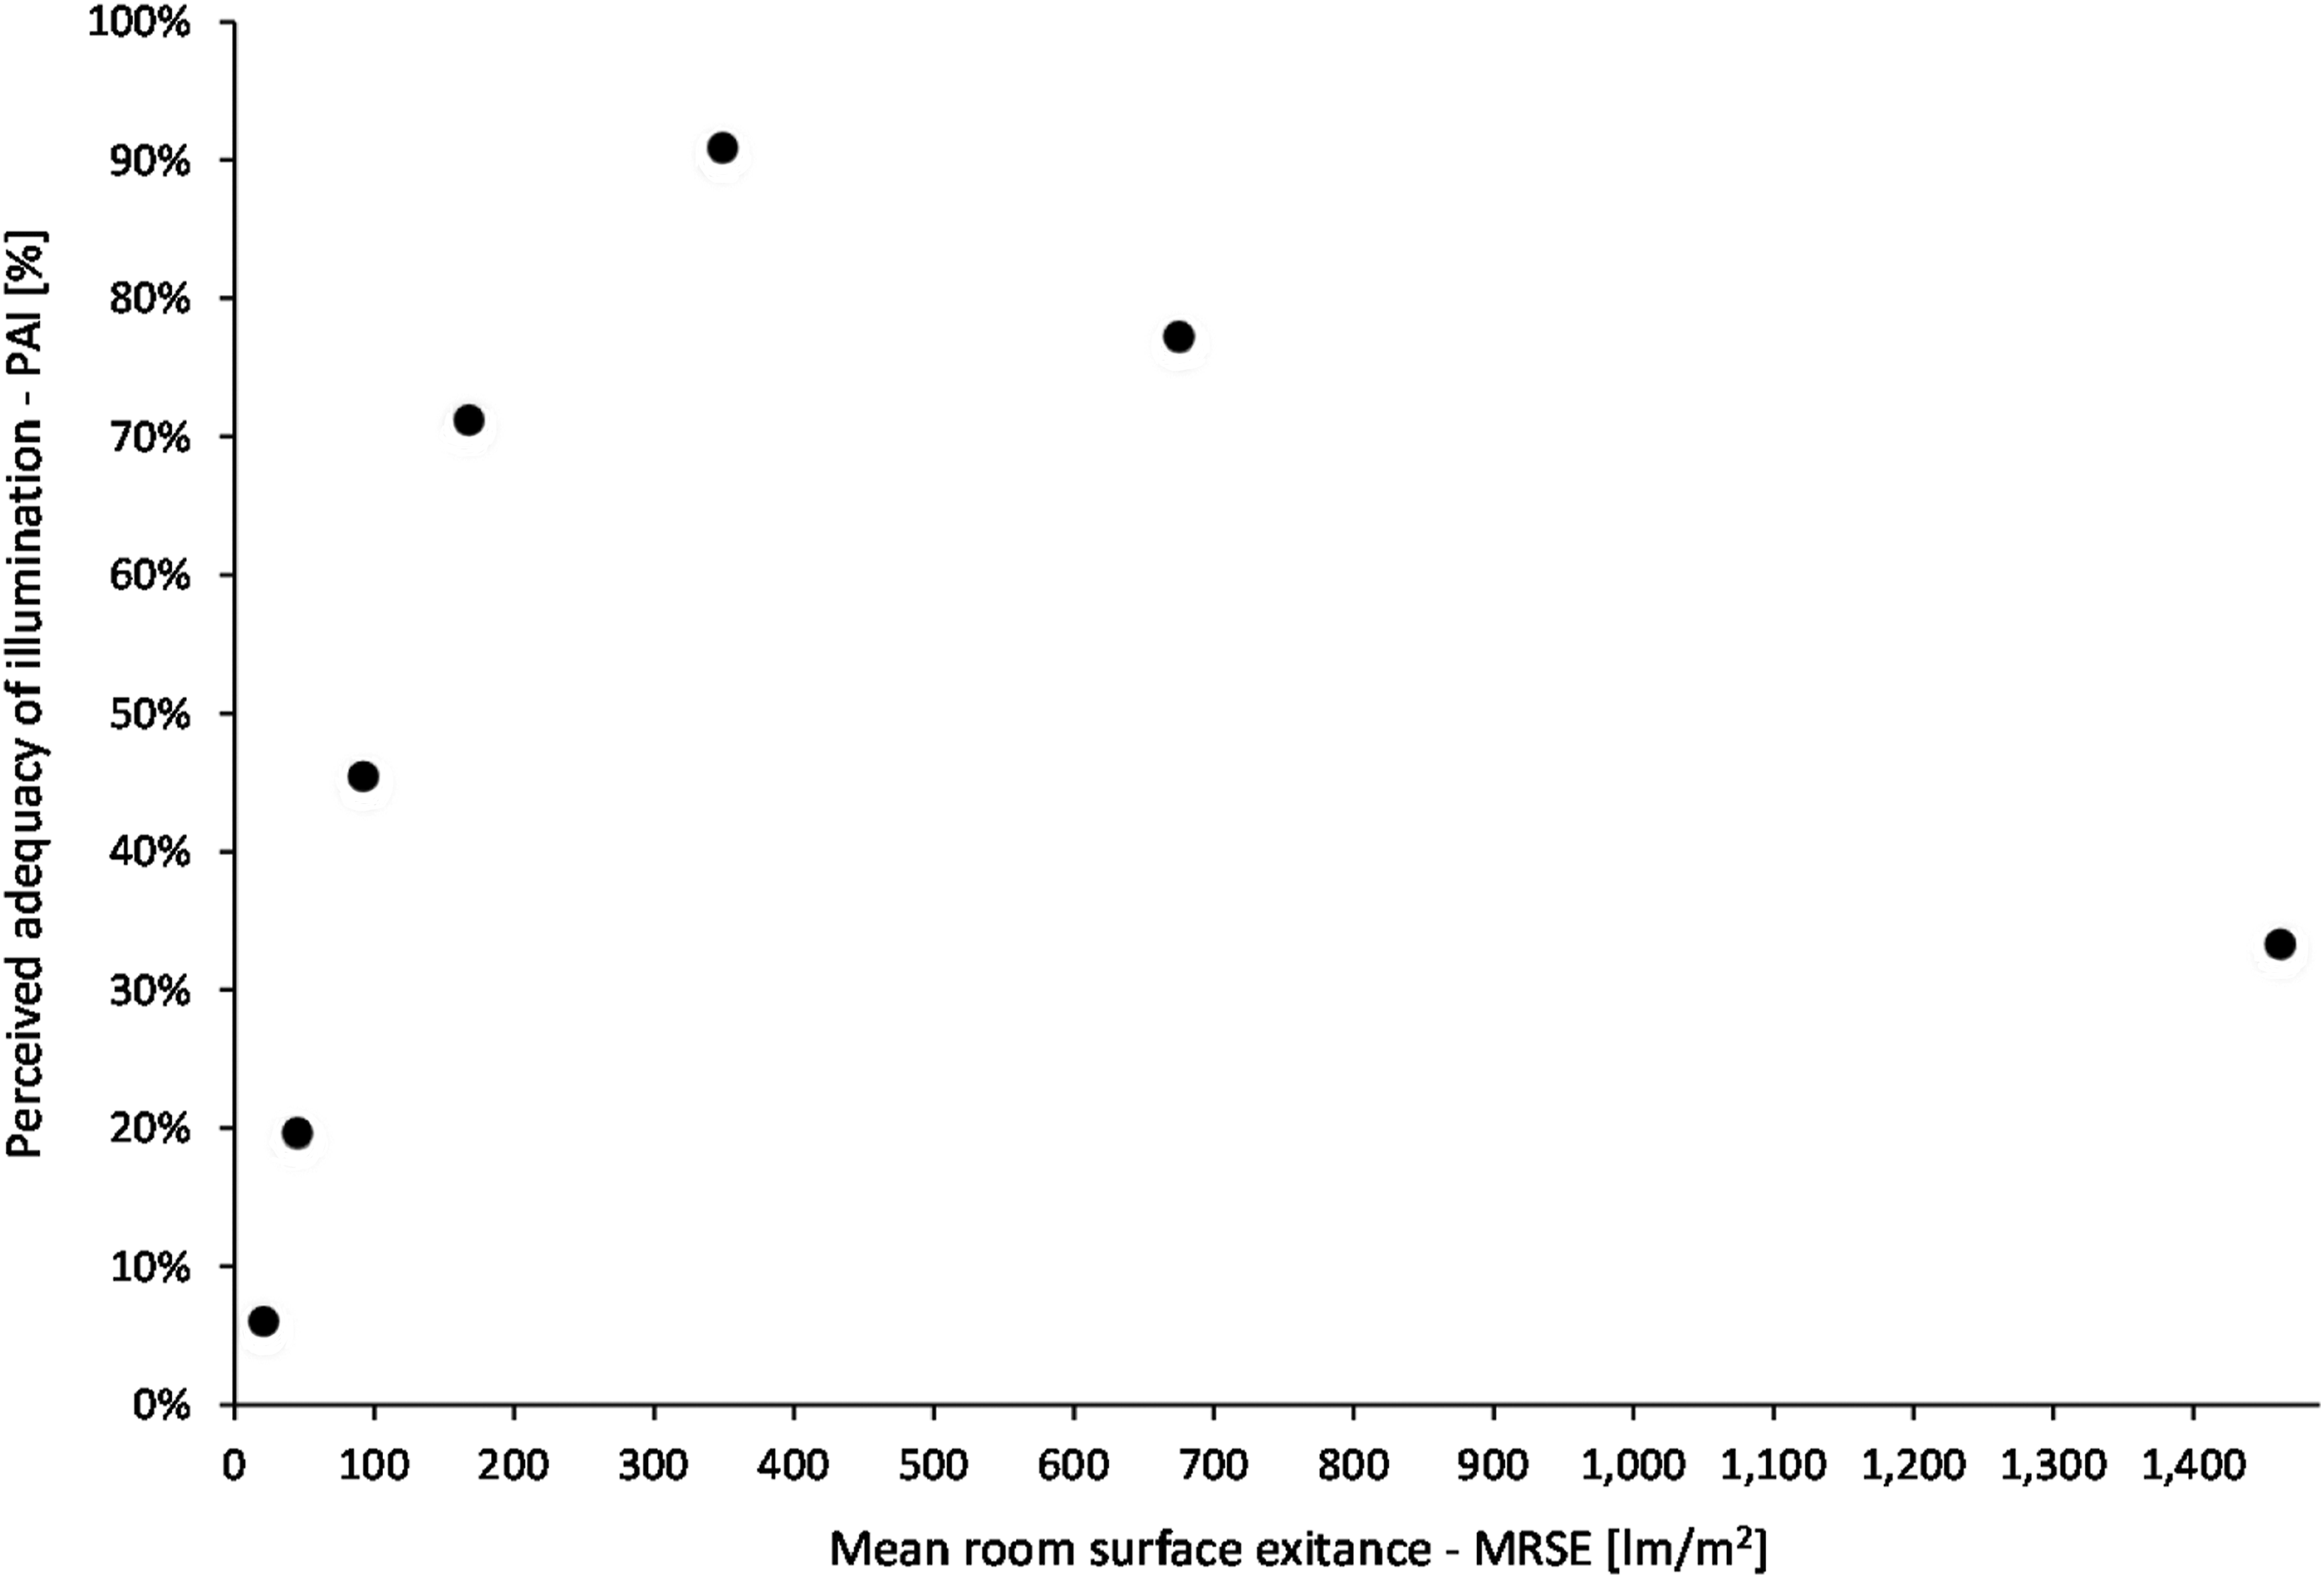
PAI increased almost linearly as MRSE increased up to about 167 lm/m2. There was a 70% adequacy rating at 167 lm/m2, and adequacy perception maximised at 90% at nominally 350 lm/m2. PAI decreased beyond MSRE of 350 lm/m2 and the reasons given by participants for this are provided in the qualitative data analysis.
Statistical checking of these data was performed using a combination of Cochran’s Q test and McNemar paired comparisons. Cochran’s Q was applied to establish whether an influence of MRSE on PAI assessments might exist. Statistical significance was reported between the proportions (X 2 = 78.316; p < 0.001), indicating that a significant relationship existed between PAI and MRSE values. Post hoc McNemar paired comparisons were performed for all 21 pairs to know which differed. A Bonferroni correction was applied, and the level of significance was reduced and set to p < 0.002. A significant association was reported for 10 of the 21 pairs.
Grouping of qualitative assessments for each mean room surface exitance level tested. Assessments were grouped into five categories during the analysis stage. In this way, similar assessments are sub-grouped, and their description reported along with counts of each occurrence in parentheses
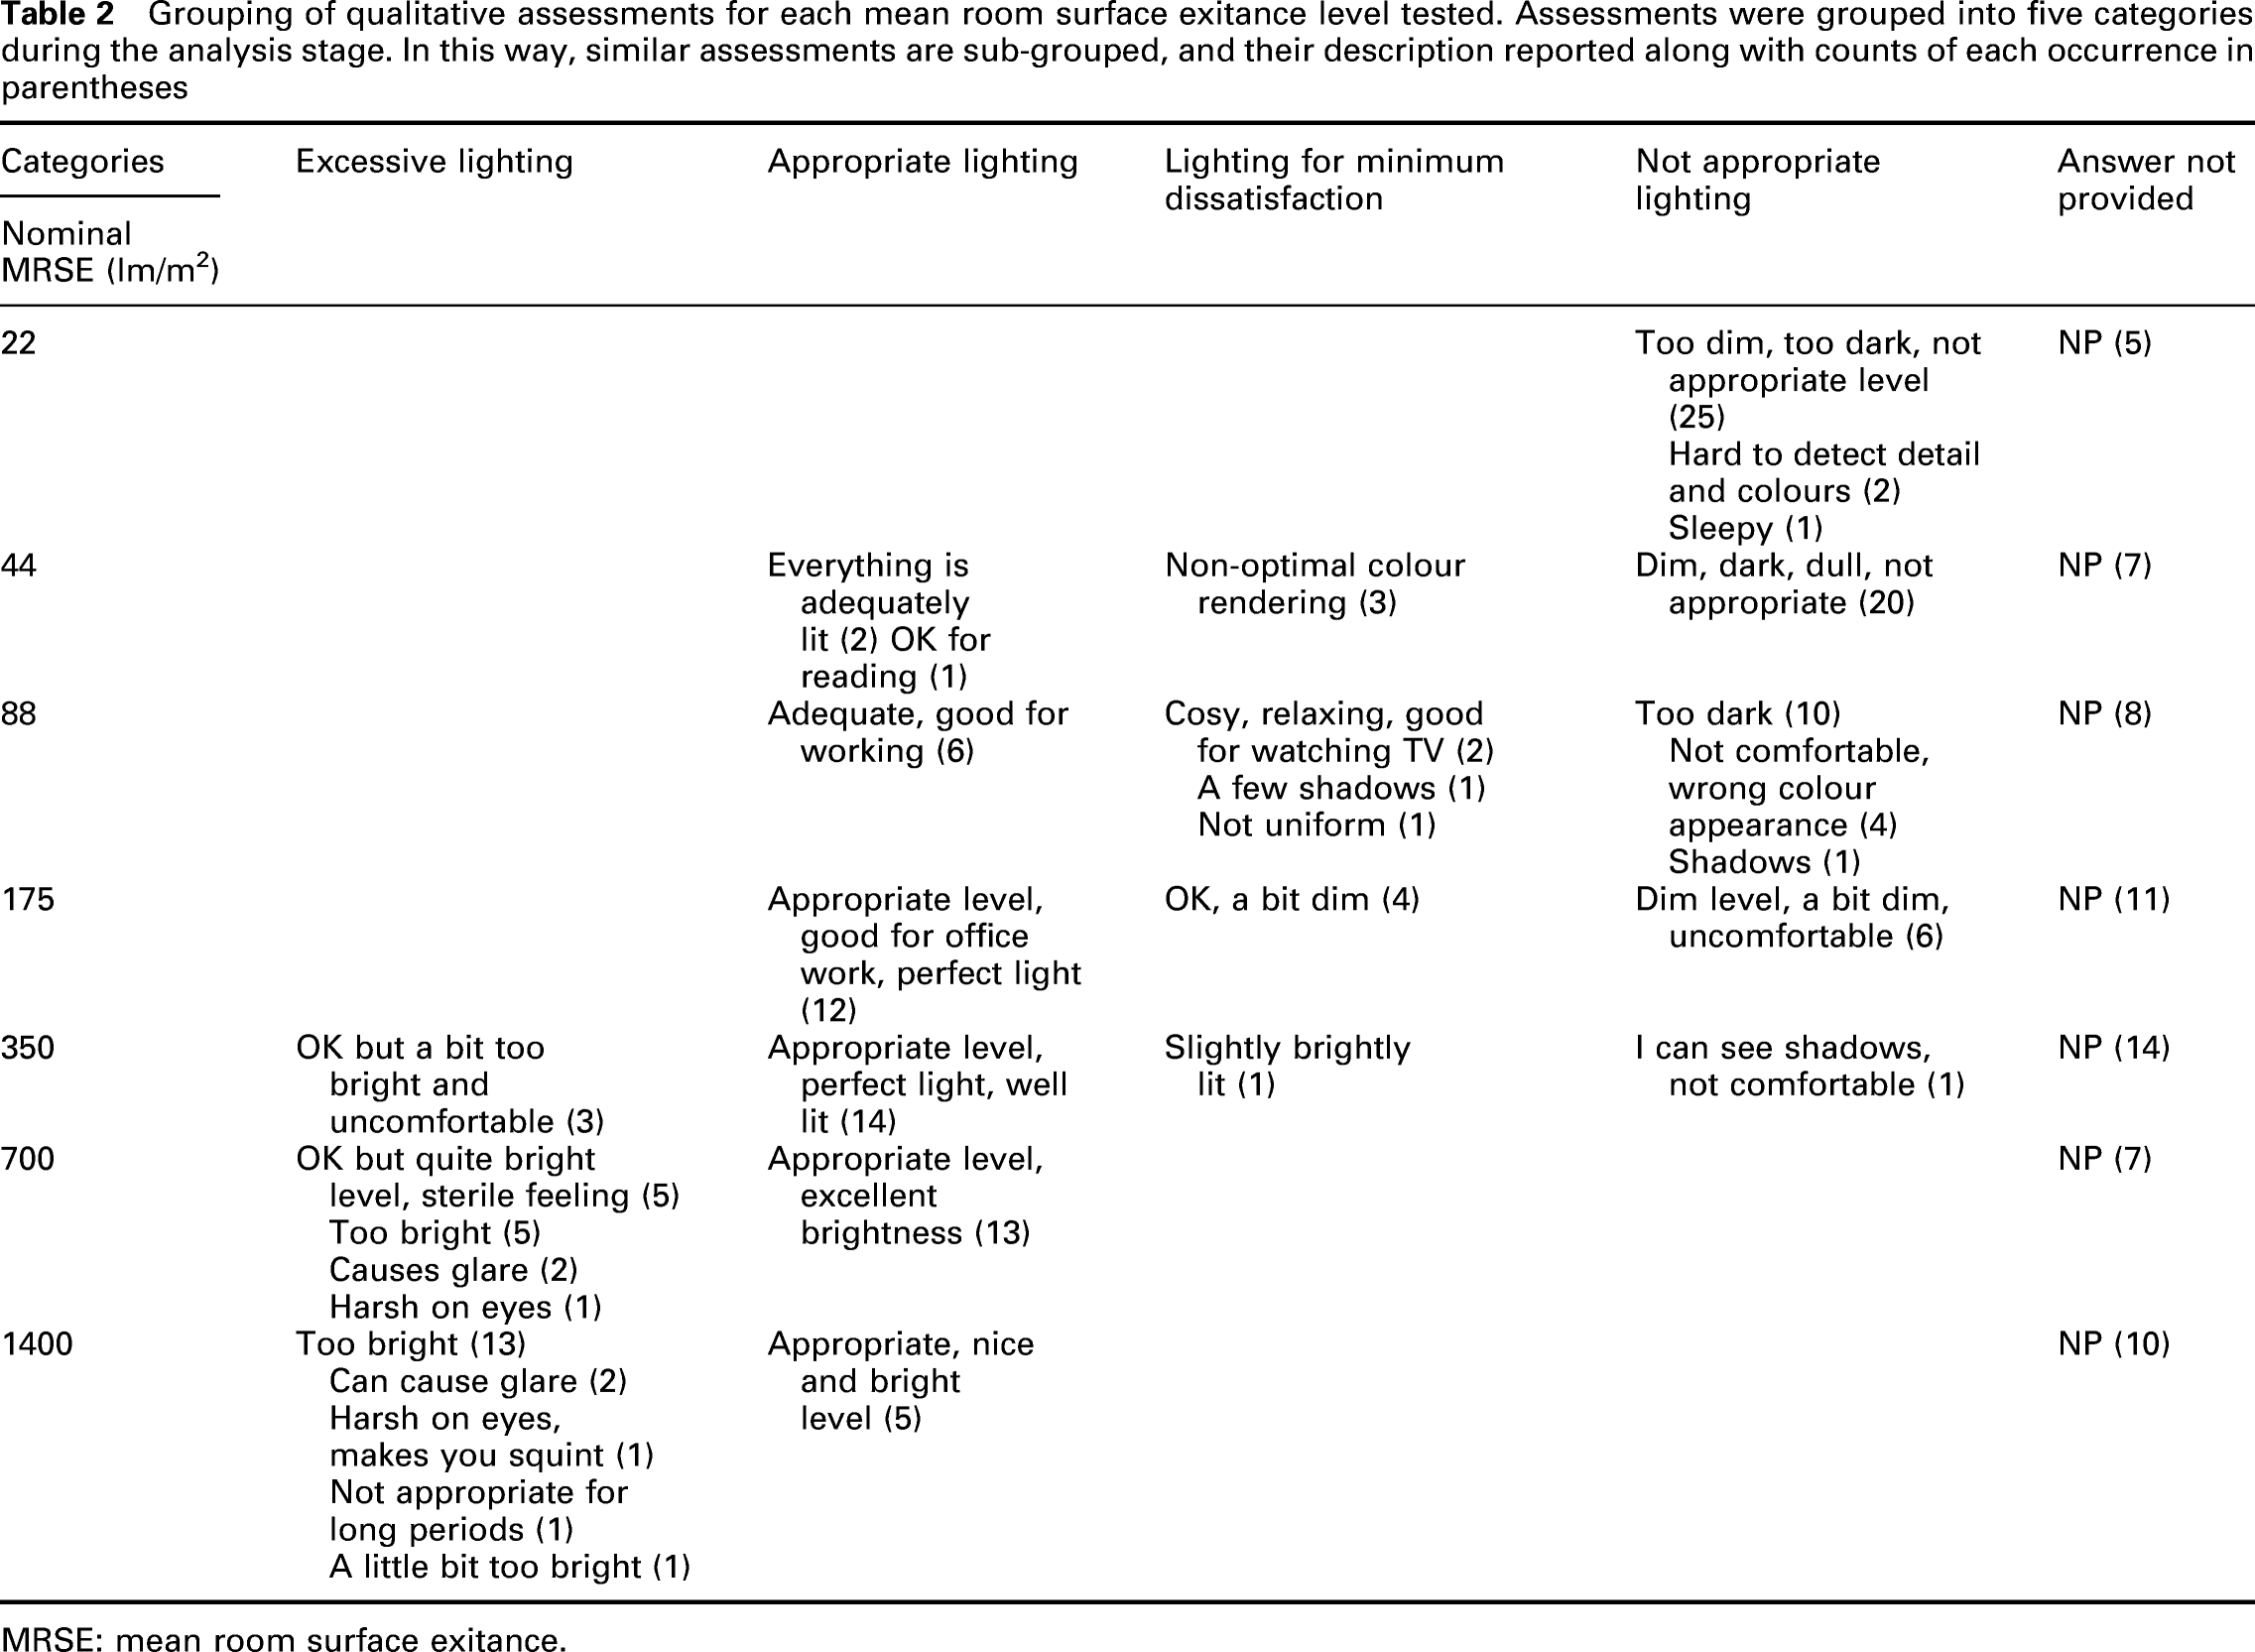
MRSE: mean room surface exitance.
This qualitative data is not considered conclusive by itself, but it helps explain the quantitative results. Levels below 88 lm/m2 were considered inadequate by the majority and above 350 lm/m2, some participants began to think that it was excessive/too bright.
3.3 Spatial brightness–MRSE relationship from the two methods
3.3.1 Category rating judgments
Spatial brightness ratings obtained following the category rating judgments
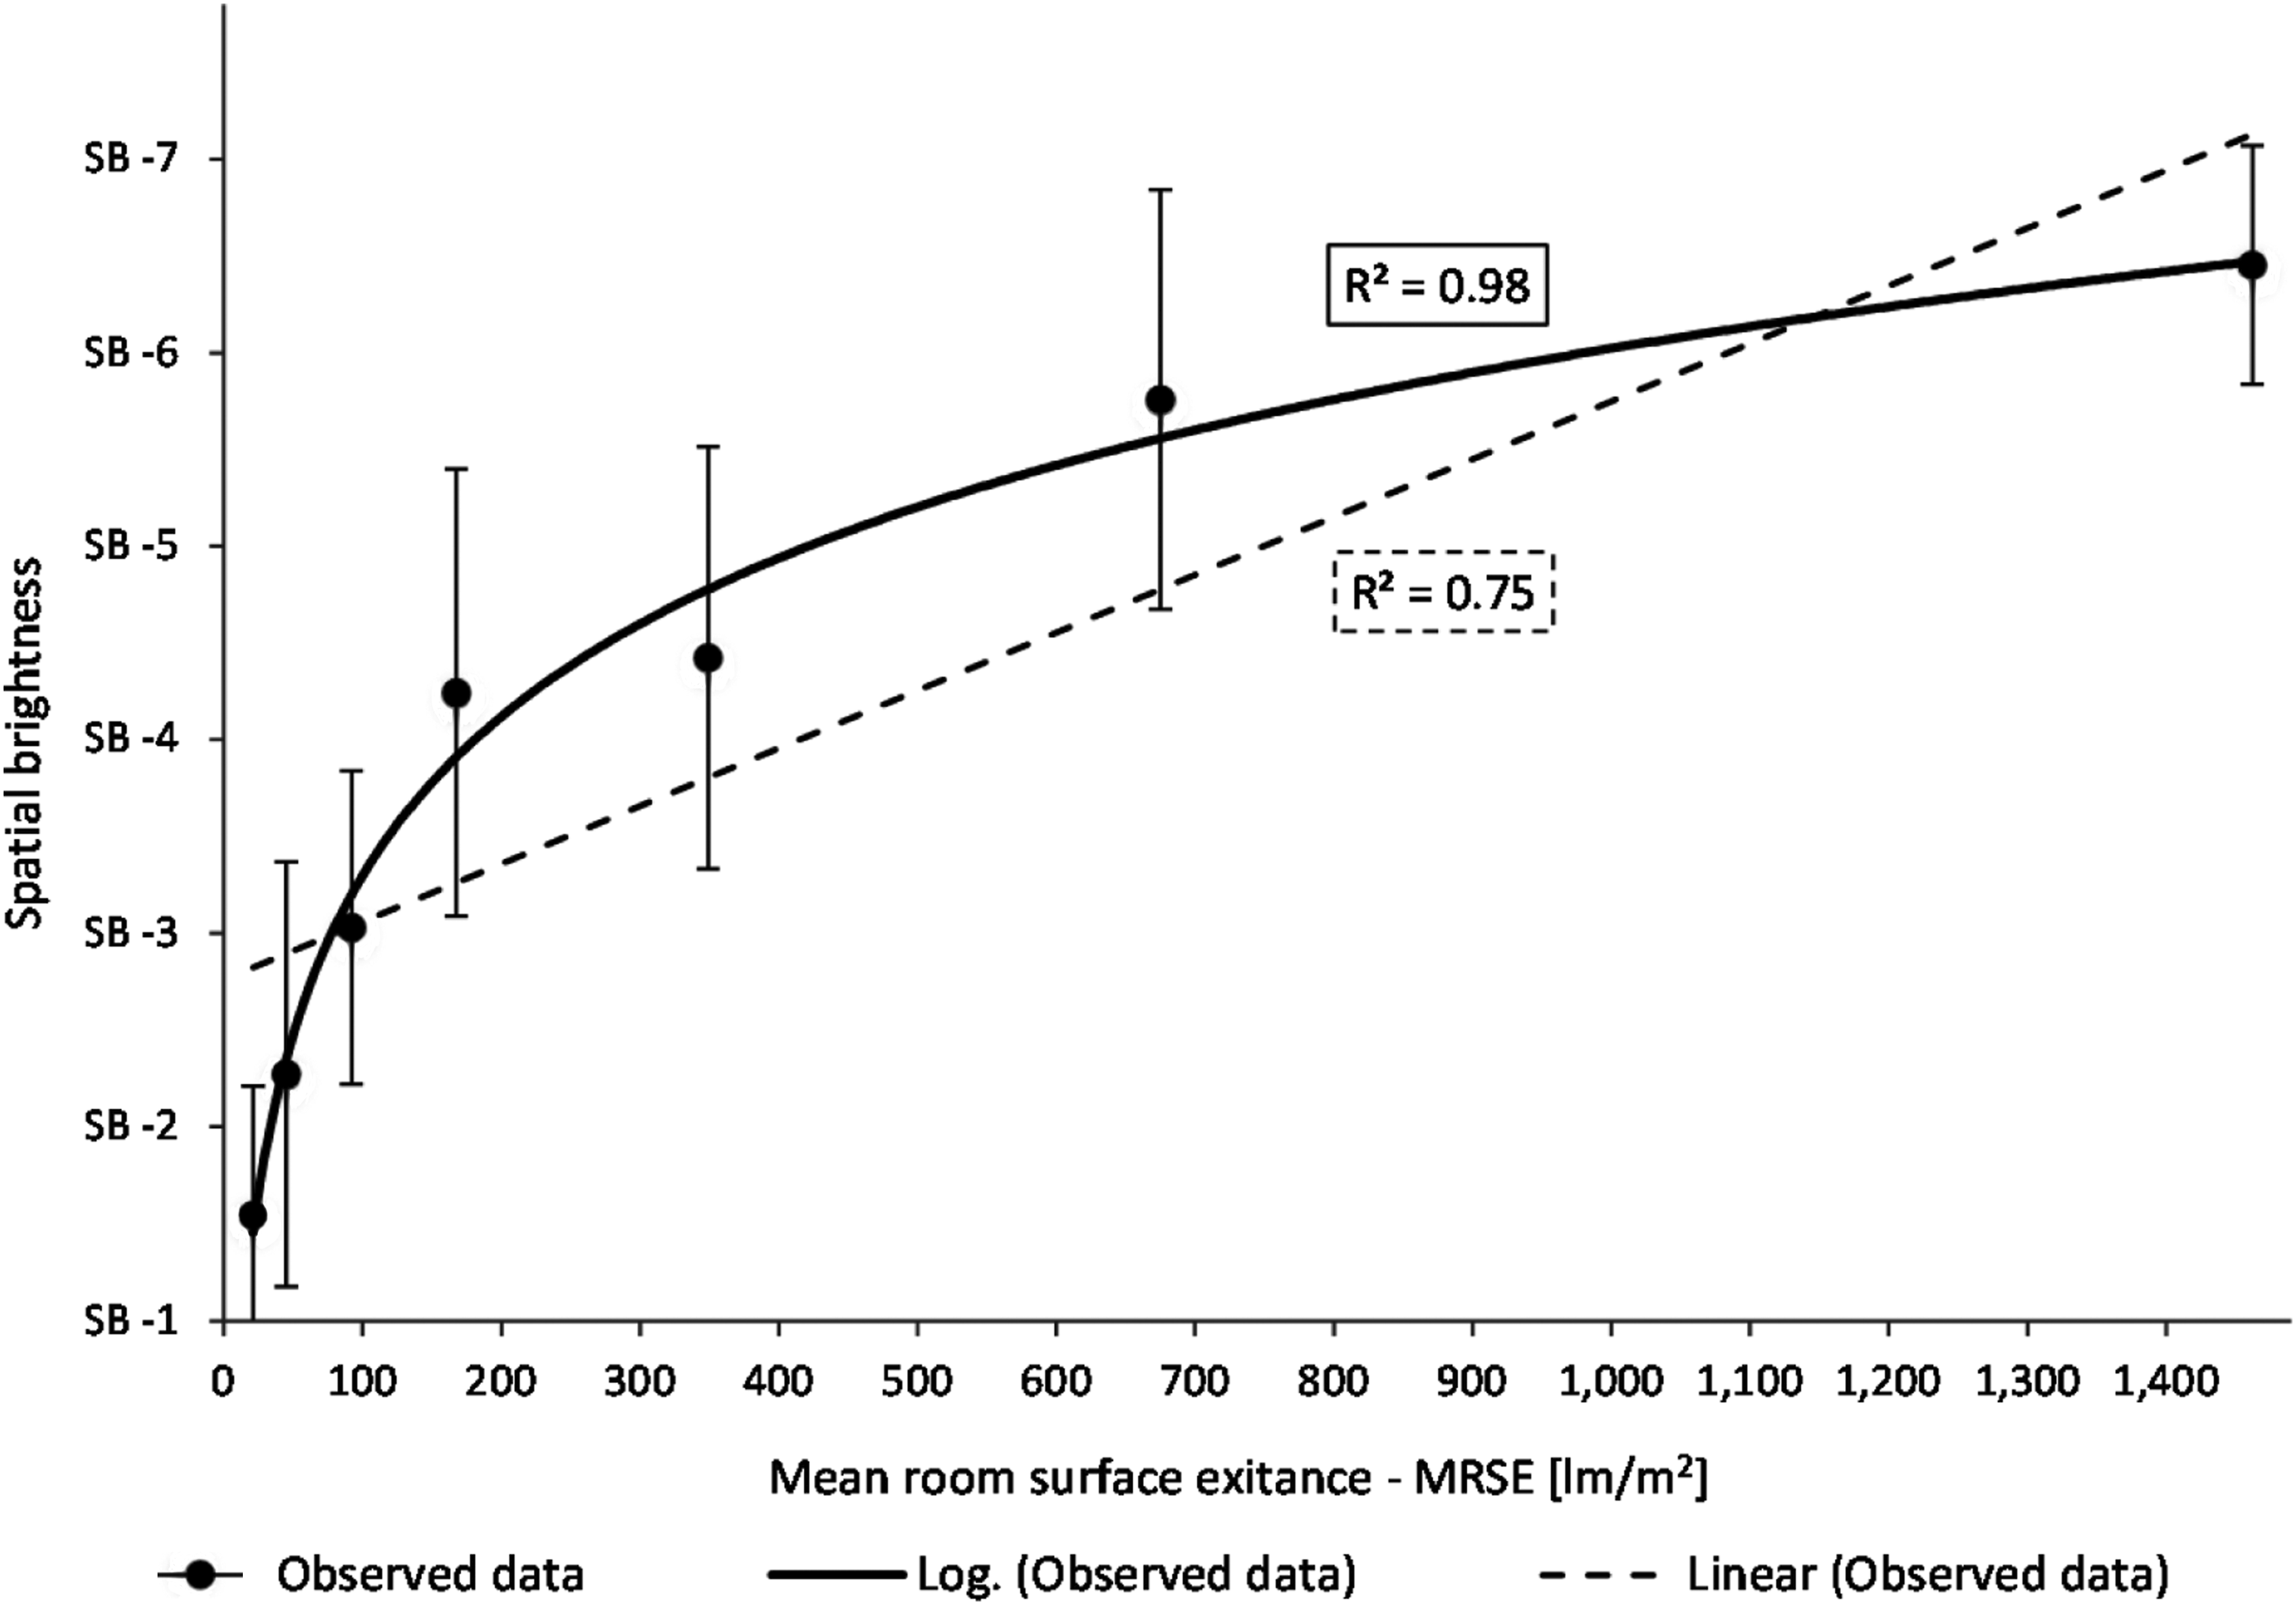
The influence of MRSE on spatial brightness was analysed by applying Kendall’s Tau-b correlation to spatial brightness’s rating score values and MRSE. It produced a strong correlation between the two items (t = 0.76, p < 0.01, N = 231). Spatial brightness assessments are ordinal data so the difference between the steps of the scale is not perceptually equal. Nevertheless, spatial brightness data were log-transformed and they graphically resulted in a rather normal distribution. For the latter reason and for drawing comparison with previous research, a regression model was applied. It can be seen from Figure 5 that spatial brightness and MRSE are related by a non-linear relationship. A logarithmic regression model was applied to the spatial brightness ratings and a higher R2 value was found (R2 = 0.98; p < 0.001) compared to linear regression (R2 = 0.75; p = 0.011). The MRSE function that was found is described by equation (1) Comparison between linear and logarithmic regression models for spatial brightness categorical ratings against mean room surface exitance (MRSE). The error bars show the standard deviation for each SB assessment
3.3.2 Sequential discrimination judgments
Spatial brightness tallies found using the sequential discrimination judgments
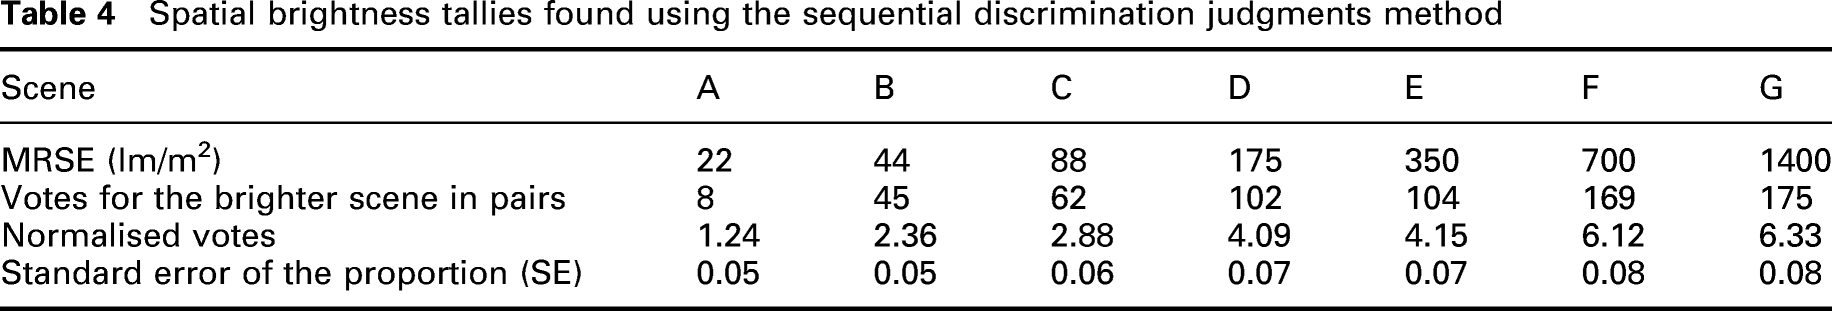
The total rank for each scene was divided by 198–the maximum number of possible votes of the 33 participants–then multiplied by six and summed by 1. This was necessary to normalise data to a seven-point scale (1–7) and enable comparison with results from the category rating judgments method. The votes cell in Table 4 represents the sum of all choices of a particular scene as brighter in each of the pairs. The calculated values were then normalised into a seven-point scale (e.g. for Scene C: 62 votes/198×6+1 = 2.88). Normalised values are plotted against the corresponding MRSE levels in Figure 6. A strong logarithmic relationship was found between MRSE and spatial brightness data gathered from the sequential discrimination judgment method (R2 = 0.96). Comparison of results from the category rating judgments method and sequential discrimination judgments for spatial brightness against mean room surface exitance (MRSE)–log-linear plot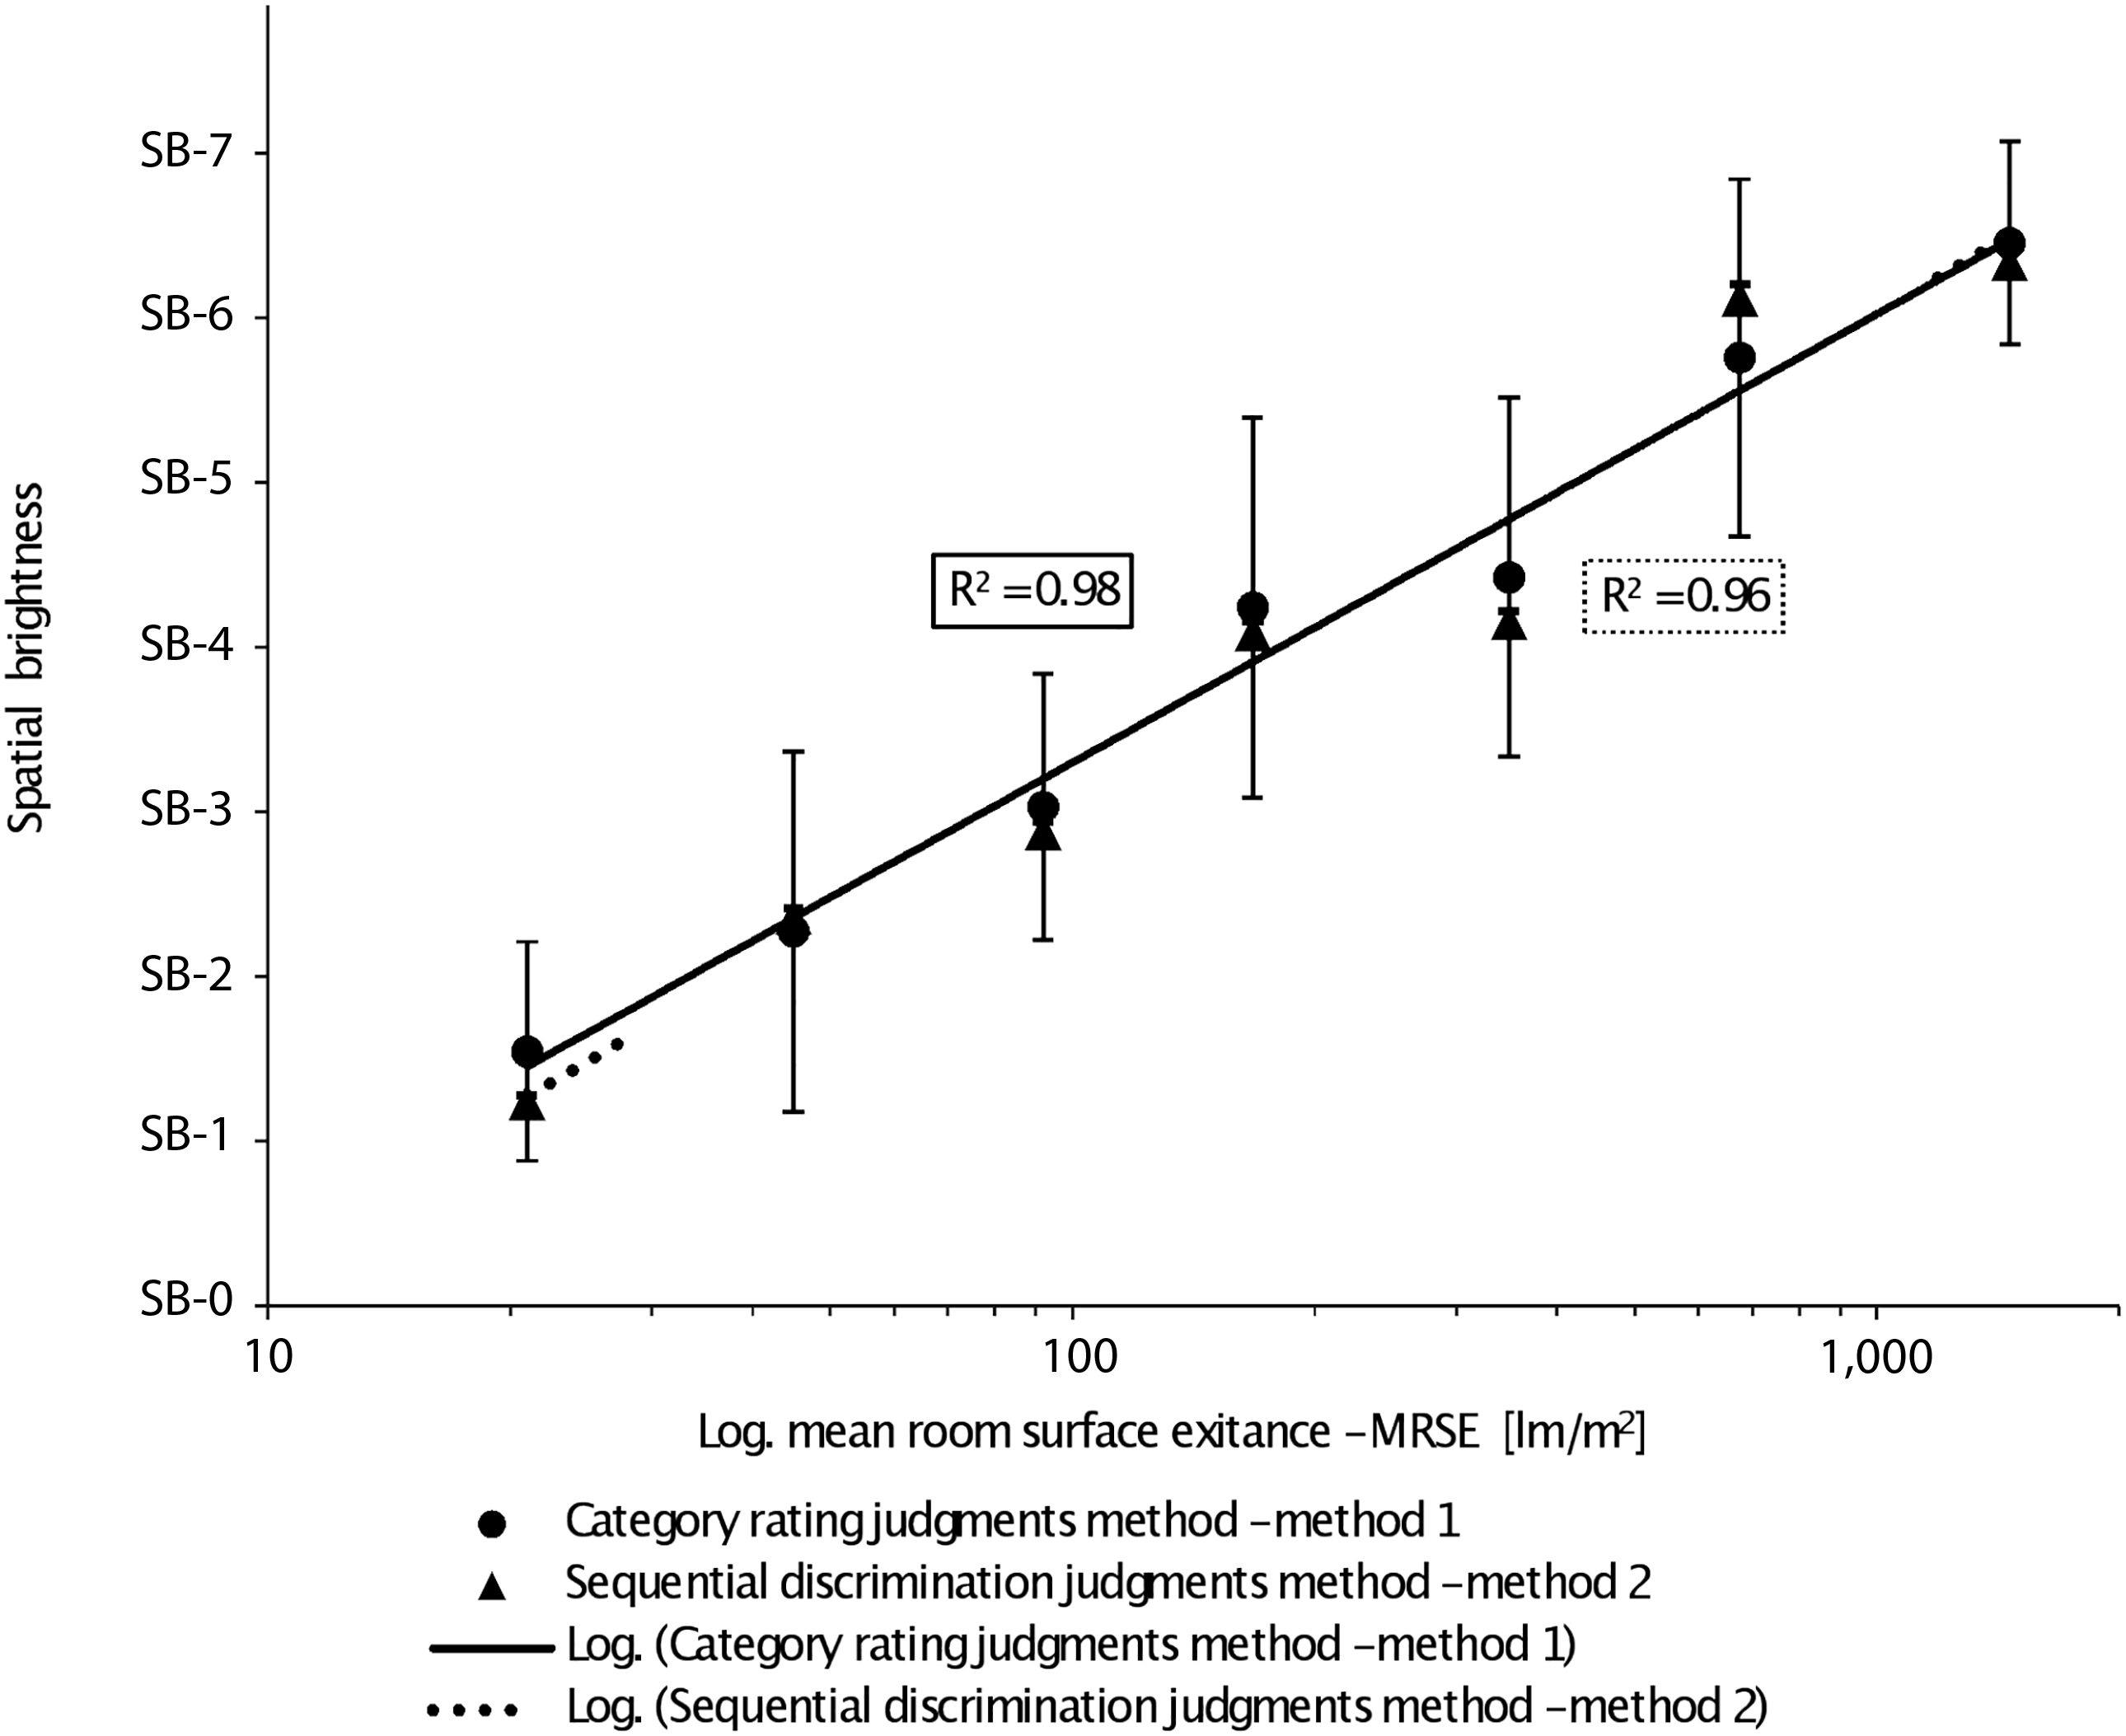
3.3.3 Comparison of spatial brightness assessment methods
The spatial brightness results from both methods are shown in Figure 6 using a log-linear plot. It can be seen from the results that both methods present similar trends. The sequential discrimination judgments method allowed rapid identification of the dimmest scenes within the pairs.
Kendall’s Tau-b correlation analysis was performed between the data from the two methods. A statistically significant correlation was found between the two sets of data relating to the rating judgments method and the sequential discrimination judgments method (τ > 0.99, n = 7, p < 0.01). This close correlation suggests cross-validation and that spatial brightness varies logarithmically to changes in MRSE.
3.4 Lighting power density
Standards and regulations1,2,4 were developed mostly relying upon fluorescent technology and it is, therefore, appropriate to briefly consider the energy performance of the system for this singular case study against current standards. Lighting power density (LPD) was calculated and analysed for each scene. Table 1 shows the measured LPD of the system at each MSRE level, which is also illustrated in Figure 7. Lighting power density (LPD) at each mean room surface exitance (MRSE) level for the experimental office room. The error bars show the ±2.5% instrumental stated accuracy for each measurement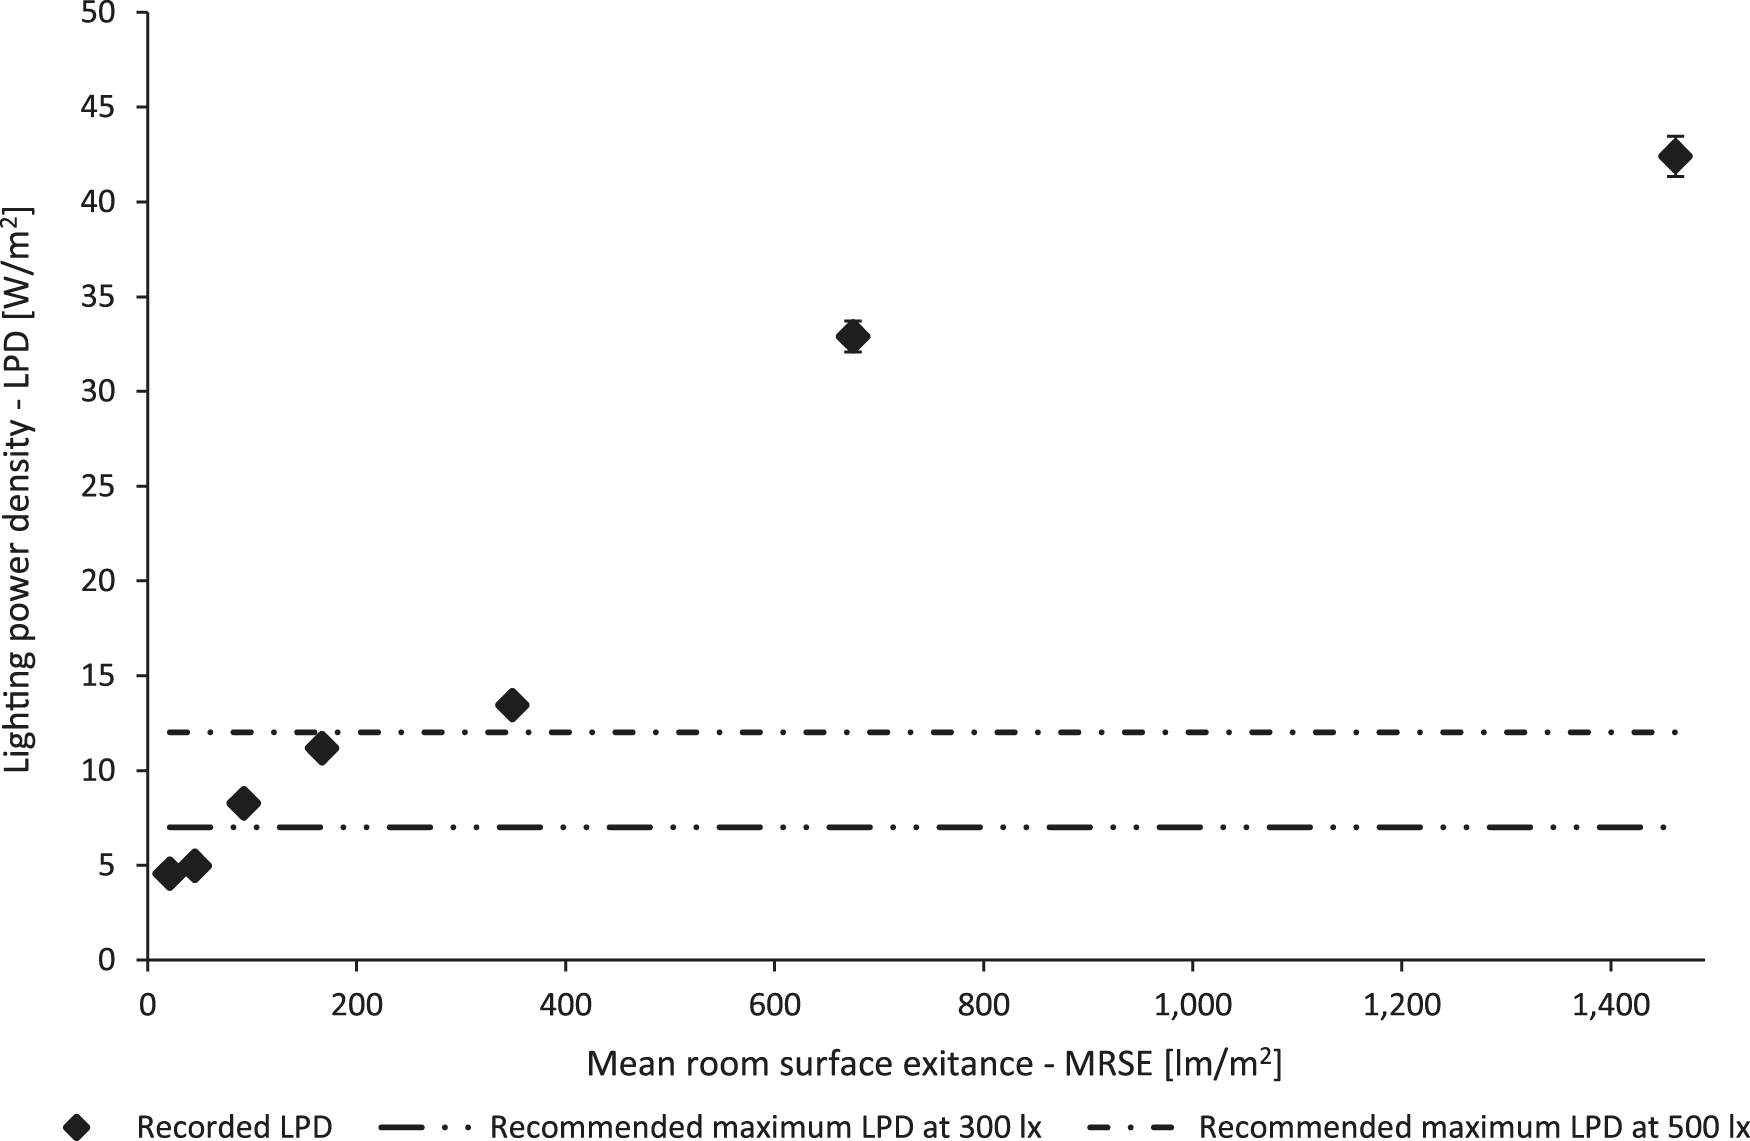
Recommended maximum LPD values 33 for fluorescent luminaires at 300 lx and 500 lx are shown with the horizontal lines in Figure 7. Lighting scene E = 350 lm/m2 had the highest PAI, 91%, among the seven lighting scenes presented to participants. This scene produced a horizontal illuminance of 534 lx with an LPD of 13 W/m2. This scene is in excess of the SLL Code (300–500 lx)2 and slightly in excess of CIBSE Guide F 33 that recommends a maximum LPD of 12 W/m2 for offices lit to 500 lx by fluorescent lighting.
Although these data were collected from only one case study, they do suggest that there will be neither significant energy savings nor significant energy increases by using design methods implementing MRSE as the main design metric to replace Eh. Further research in this area will be needed when there are more widespread MRSE designed installations.
4. Discussion
By expanding the range of MRSE values from a maximum of 100 lm/m2 achieved in previous research to 1400 lm/m2, which was expected to be well in excess of values needed for an office, this work built upon past research11,16,17 that examined the relationships between PAI, spatial brightness and MRSE. The methodology was similar to allow for direct comparison, although the past work by Duff et al. experienced response contraction, as previously noted.Where MRSE values were aligned with those of Duff et al., 11 PAI was very similar in the two experiments, increasing almost linearly up to an MSRE of 175 lm/m2. At 175 lm/m2, about 70% of participants thought the illumination adequate and that the space was neither brightly lit nor dimly lit. At 350 lm/m2, over 90% of participants considered the level of MRSE adequate, but the perception of spatial brightness remained neither brightly lit nor dimly lit, suggesting this increase in MRSE might offer poor value because energy consumption increased by 20% to go from 175 to 350 lm/m2. Nonetheless, 350 lm/m2 was the scene with the highest PAI among those tested in this research. Above this value of MRSE, and conversely to what Cuttle envisaged, PAI began to drop off. As can be seen from Table 2, participants typically considered scenes above 350 lm/m2 as ‘too bright’, ‘harsh on the eye’ or ‘leading to a sterile feeling’. Meanwhile, spatial brightness assessments for MRSE scenes above 350 lm/m2 went from brightly lit to very brightly lit.

Spatial brightness seven-category scale and corresponding mean room surface exitance values. MRSE values reported are rounded figures determined from equation (1)
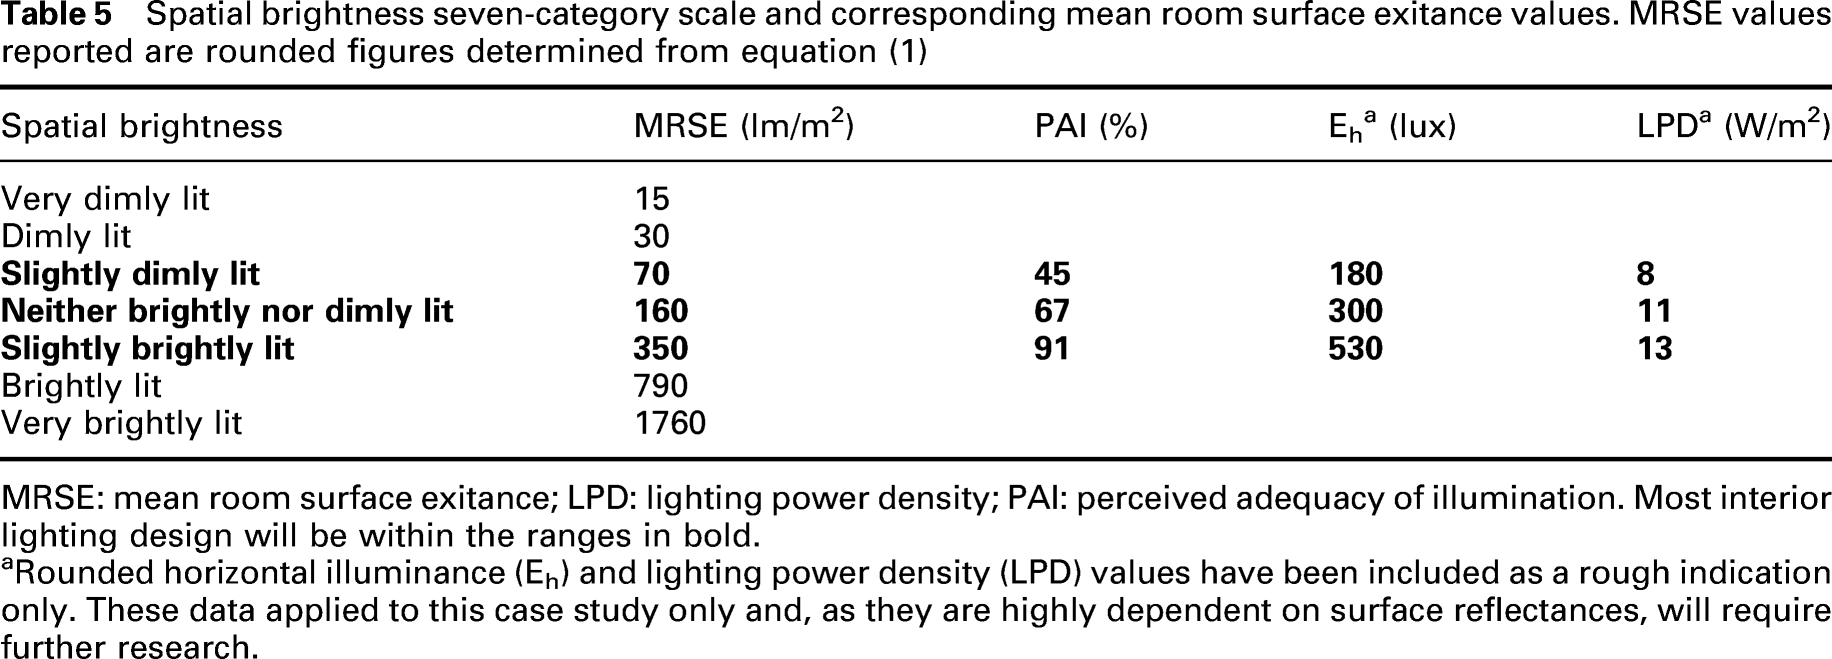
MRSE: mean room surface exitance; LPD: lighting power density; PAI: perceived adequacy of illumination. Most interior lighting design will be within the ranges in bold.
aRounded horizontal illuminance (Eh) and lighting power density (LPD) values have been included as a rough indication only. These data applied to this case study only and, as they are highly dependent on surface reflectances, will require further research.
Table 5 suggests that most interior lighting design will be within the range of 70–350 lm/m2, as shown in bold.
The results of this experiment can help to identify the level of adequacy or satisfaction (or at least avoidance of dissatisfaction) that should be used as a standard criterion. According to Rea and Ouellette,
34
who assessed illuminance levels for existing standards, the level of satisfaction normally applied for a standard should be 98–100% satisfaction
According to the PAI sigmoid trend envisaged by Cuttle, which was supposed to peak and plateau at a high level, 98–100% of satisfaction would rely on a level of MRSE between 350 and 700 lm/m2 if crosschecked with the current research data.
This sigmoid trend did not happen in this research, and an MRSE level of 350 lm/m2 is well above what Cuttle expected to be adequate. He hypothesised that a level of 100 lm/m2 would likely be adequate. Duff et al. concurred with this to a large extent.
This research suggests that MRSE levels somewhat higher than that envisaged by Cuttle and Duff et al. may be needed to achieve high levels of PAI; however, achieving 98% levels of satisfaction, or even levels above 90%, as per the RVP model 34 may not be achievable in practice. A moderate level of spatial brightness around neither brightly lit nor dimly lit and corresponding to an MRSE level of 167 lm/m2, received a satisfaction level (about 70%) while maintaining relatively low energy use; in this case it is about the same as that for design using 300 lux for the horizontal illuminance.
Levels around 160 lm/m2 are likely to be found satisfactory and energy wise reasonable as shown in Table 5 for office lighting, based on the findings in this case study; however, further field work in real life installations will be necessary to confirm this.
4.1 Limitations of research
A limitation of this research is that only two stimuli above 350 lm/m2 were presented, at 700 and 1400 lm/m2. Another is that daylight was excluded to minimise the number of variables. The presence of daylight would change MRSE levels and may change the expectations of subjects, so the results may not be applicable to daylit buildings.
During this research, there may have been a slightly misleading interpretation by participants of the word adequate during collection of data for the PAI concept with the dichotomous question. It is clear from the qualitative data that when participants declared inadequacy over 350 lm/m2, they meant dissatisfaction due to glare or the lighting being too bright. They did not intend the lighting was inadequate meaning not enough lighting. Future research should avoid this confusion.
It was decided not to use definitions of the scale ends used for spatial brightness assessments in order to avoid the scale compression experienced by Duff et al. There was concern that this might lead to participant confusion in rating because no reference was provided. Participants did not express confusion or ask for any definition, but this left them to set the scale rating themselves.
There is possibility of response bias for the category rating judgments method in this study because of the seven-point categorical scale that was used, for reasons explained in section 2.4.2.
4.2 Future research
Research findings highlighted in this work are drawn from a single test room furnished as an office that excluded daylight with limitations as indicated in the previous section. Future research should include daylight and with varied premises and lighting schemes in real life settings. Reflectance and lighting distribution were kept constant in this research and could also be varied as part of future research. Future research might focus on the evaluation of PAI and spatial brightness under multiple MRSE ranges, which could help address range bias.
5. Conclusion
This research work set out to examine suitable levels of MRSE for offices when used with a new interior design paradigm of ambient illumination. Ambient illumination uses two design metrics TAIR and MRSE and this research set out to investigate MRSE values for offices. In particular, it set out to address gaps identified in previous research by Duff et al.16,17 A comparable apparatus along with a broadly similar lighting scheme and similar research methodology was used to allow direct comparison of results.
Participants were exposed to lighting that varied MRSE between nominally 22 and 1400 lm/m2 in order to investigate relationships between PAI and MRSE and between spatial brightness and MRSE. It also set out to establish appropriate light levels for offices, at least tentatively.
Cuttle initially envisaged an MRSE of 100 lm/m2 as adequate for offices. This research reinforced the findings by Duff who found that at 100 lm/m2 only about 50% of participants found the lighting adequate. In this research, it was found that at 92 lm/m2, 45% of participants found the lighting adequate. Therefore, this suggests that a value higher than 100 lm/m2 is required for offices.
At 167 lm/m2, PAI was 67%. Participants found this MRSE level neither brightly nor dimly lit. This suggests that a value of around 167 lm/m2 may be a more acceptable value of MRSE for most office users than 100 lm/m2.
Beyond 350 lm/m2, levels of adequacy dropped off. Cuttle’s original hypothesis that a sigmoid PAI–MRSE relationship that increases up to a value at which PAI might plateau was not upheld by the data collected in this research. Instead, the PAI–MRSE relationship dropped off significantly after reaching its maximum at 350 lm/m2. The qualitative data revealed that this happened due to glare or other consequences of the excessively high values of MRSE.
Participants did not find brightly lit and very brightly lit, or for that matter dimly lit scenes suitable for the experimental office environment. Moderately lit scenes received the highest rated adequacy. It is expected interior lighting design will fall between slightly dimly lit (70 lm/m2) and slightly brightly lit (350 lm/m2) and that a neither dimly nor brightly lit rating (around 160 lm/m2) may offer a recommended figure for further research in real world settings.
The MRSE/spatial brightness function for these data was
Footnotes
Acknowledgements
The authors acknowledge with thanks the Technological University Dublin, Eurac Research, and Dr Michael Carr for his contribution to the statistical analysis.
Declaration of conflicting of interests
The authors declare no potential conflicts of interest with respect to the research, authorship and publication of this paper.
Funding
The authors received no financial support for the research, authorship, and publication of this article.