
Abstract
A novel high-dynamic range camera-based approach to measure the cumulative daylight dose in historic/conservation spaces has been devised and tested in a real-world setting under normal viewing conditions. The technique derives illuminance from the high-dynamic range-acquired luminance at numerous patches of the wall surfaces visible in the high-dynamic range image. These patches serve as proxy illuminance meters, thereby allowing the prevailing illumination field across the entire visible wall to be derived using a Kriging algorithm. The technique was validated under both controlled and in-situ conditions over periods of several months and shown to have comparable accuracy to the illuminance logging devices commonly used in historic/conservation settings. The set-up comprising a consumer digital camera and tethered computer proved remarkably resilient and allowed for continuous monitoring periods of six months or more. Application in a real-world setting revealed operational practicalities that would not have been found in a controlled environment.
1. Introduction
The display and conservation of light-sensitive objects present conflicting requirements: the viewers require sufficient illumination to see the object, whilst the conservator strives to manage the long-term light exposure according to sector guidance in order to prevent damage from fading etc. 1 Increasingly in historic spaces, curators and conservators are choosing, where practicable, to display rooms/objects under illumination conditions comparable to how those spaces were originally used. 2 For the overwhelming majority of historic showrooms that means under daylight illumination. All spaces that are predominantly illuminated by daylight will experience both significant fluctuations in illuminance at any one point over time, and also a large variation in illuminance across the space at any one instant. Many daylit spaces for the display of light-sensitive objects will employ some form of continuous light monitoring in order to determine cumulative measures of light exposure and assess whether light management is achieving recommended values. In widespread use since the 1970s, the oldest commonly used monitoring device is the Blue Wool Standard (BWS). This is a small, card-mounted patch of a standardised photosensitive material (the ‘blue wool’) that undergoes measurable changes in its reflectance spectrum in proportion to the cumulative light exposure. 3 Although relatively inexpensive and easy to administer the method has several limitations. Chief amongst these is that a single, cumulative dose value after several months of monitoring cannot guarantee that what remains of an annual light budget will not be exceeded. Because of the inherent limitations of the blue wool method there has been a gradual uptake since the 1980s of (electronic) continuous monitoring devices (i.e. data logging illuminance meters) which record light levels at hourly or shorter intervals. 4 These are either autonomous logging illuminance meters or networked devices that are connected to a wireless base-station which records the data.
The wide variation in monitored cumulative light doses experienced in conservation/museum spaces was recorded in an American study by Hoyo-Meléndez et al. who used up to 24 data loggers to record light levels at 10 minute intervals over extended periods. 5 That study highlighted the potential unreliability of estimating the illumination for the spaces between a relatively sparse set of measurement points. A more recent study to record the spatial variation in illumination across large display surfaces was carried out in the Great Hall of Hampton Court (UK) using up to 140 data loggers suspended by wires as a ‘mesh’ in front of the tapestries on various elevations in the Great Hall. 6 Notwithstanding the large number of data loggers in total, because of the expanse of the Great Hall, it seems there were just nine (in a three by three arrangement) across many of the large tapestries. Any monitoring installation that could noticeably interfere with the visual appreciation of the objects, as was arguably the case in Hampton Court, can only be carried out for a limited duration.
It is invariably the case in historic showrooms that direct sunlight illumination of sensitive objects is expressly avoided, either through permanent deployment of blinds and/or active use of the blinds by the staff. Depending on the nature of the space, sunlight is not necessarily excluded altogether, e.g. illumination of plain walls, stone/wooden floors, commonplace floor coverings, etc. may occur. Thus, when sunlight does enter such spaces, the largely diffuse components of reflected sunlight contribute to the daylight dose received by the sensitive objects. This is an important consideration for the technique described in this paper which aims to measure the gradually varying daylight illumination incident across wall surfaces, referred to here as the daylight illumination field. With regard to localised electric lighting, the dose from picture lighting is largely regulated by the choice of fixture and the hours of operation. Thus, whilst the technique is not well suited for measuring the dose from highly localised light sources such as direct sunlight and picture lighting, the former is invariably prevented and the latter regulated by design/operation.
The aim for this ambitious project was to design, build and in situ validate a camera-based technique to measure daylight illumination fields in a historic showroom under normal use. The goals required to achieve this were as follows:
Build a robust/resilient high-dynamic range (HDR) capture system that will function unattended and without network connection for extended periods, e.g. months. Devise and validate procedures to determine illuminance from HDR images using suitably characterised target surfaces. Apply and validate the technique in a historic space under normal display use.
This paper describes how these goals were achieved. Additionally, because the bulk of the work was in a real space under normal display use, the project uncovered many confounding factors for which innovative solutions were devised. Many of these would not have been encountered had the project been carried out in a controlled/laboratory environment. The authors believe that this is the first study to employ HDR imaging to measure the long-term cumulative light exposure in a historic/conservation setting.
1.1 Nomenclature
Data recorded at a particular time is referred to using the year-month-day-hour-minute format, e.g. 16-06-23-12h40 for an HDR capture taken at 12h40 on the 23rd June 2016, whereas the year-month-day identifier, e.g. 16-06-23 or 160623, refers to all the data recorded on that day.
2. Background
With a large number of properties where daylight is the principal source of illumination for visitors to see the interiors and contents, the National Trust (UK) routinely records daylight exposure alongside other environmental parameters (e.g. temperature and humidity) in many hundreds of rooms across the properties which the Trust opens to visitors. Daylight exposure can be measured directly by a logging light meter connected by wireless to a base station, e.g. a Hanwell device which is typically set to log at 5 to 15 minute intervals. Alternatively, ‘blue wool’ dosimeters cards are also used.
Whatever the device, these record the dose only at one point, and most spaces will have one or at most two locations where the light dose is measured. Daylit spaces however exhibit enormous variation in illumination – both spatially and temporally. 7 To account for the temporal variation (i.e. daily/seasonal patterns combined with random weather effects) monitoring has to be long-term, and the exposure determined in terms of annual dosage. Thus the restricted light-meter resources are necessarily tied to a limited number of fixed positions, and so the potentially huge spatial variations in daylight exposure away from any measurement point can only be guessed at.
2.1 HDR and daylight simulation
The first truly HDR images were those created using physically-accurate lighting simulation, e.g. the Radiance system.
8
The images in Figure 1 show early examples from the Radiance system circa 1992. The image on the left shows the appearance of the virtual model – a gallery space with horizontal strip rooflights, below which are horizontal obstructing surfaces. The various surfaces were assigned material properties based on realistic values, e.g. RGB diffuse reflectance values, specularity, roughness and, for the rooflights, glazing transmittance. The virtual model is illuminated only by daylight. The external environment was modelled as a CIE standard overcast sky. Each pixel of the original ‘appearance’ image contains an RGB radiance value. For display, this is converted to a low dynamic range RGB image, i.e. tone mapped. The image on the right shows the incident illuminance on the surfaces using false colour (red is high and blue is low). In order to simulate the ‘appearance’ image, Radiance has to first determine the light falling onto those surfaces. In other words, the ‘appearance’ and the illuminance images are, for the Radiance simulation, effectively synonymous. In practical terms this means that the computational resource (e.g. CPU cycles) required to produce both image types is essentially identical to that required to produce just one of them.
Simulated virtual gallery scene under overcast sky conditions with shaded rooflights and corresponding illuminance map (available in colour in online version)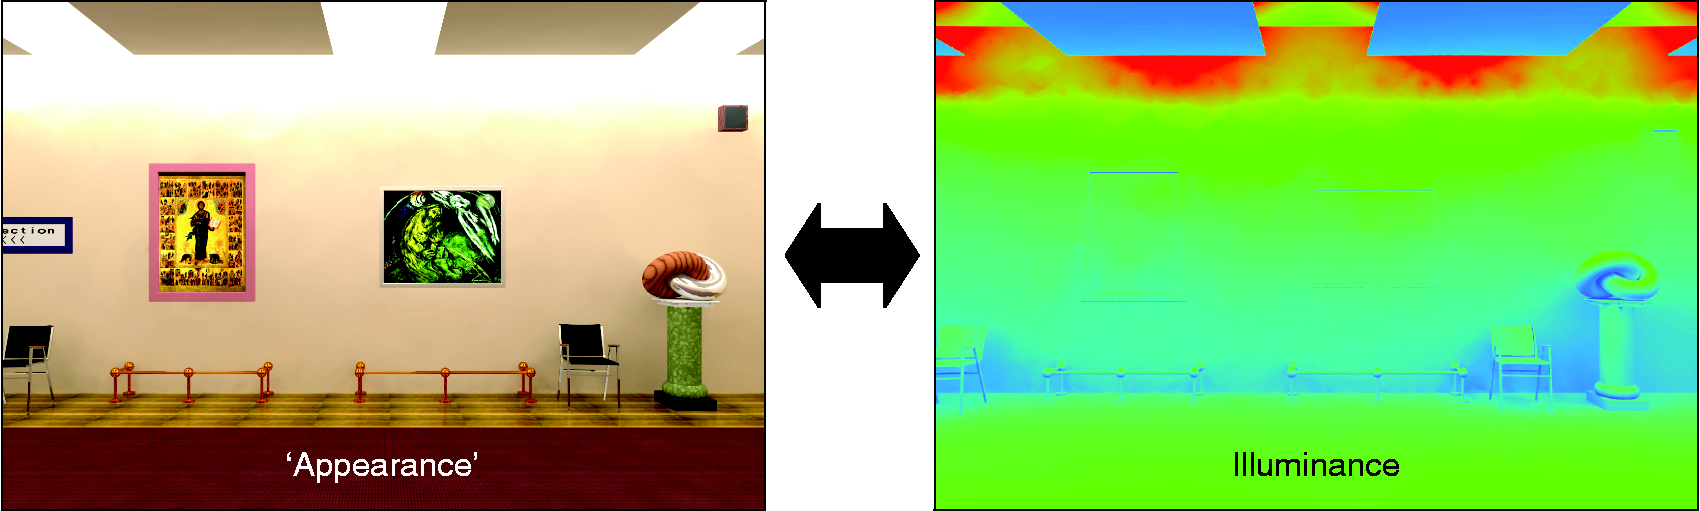
Following validation studies which demonstrated the potential high accuracy of the Radiance lighting simulation system, the tool quickly became the de facto standard used by researchers and practitioners worldwide to solve traditional and emerging daylight simulation problems.9–12 The technique of simulating daylight performance metrics using standardised weather files became known as climate based daylight modelling (CBDM). 12 CBDM is now widely perceived to be the method that will replace daylight factors: it is an option in LEED whereas in 2013 it became a mandatory requirement for certain UK school building programmes. 13
An example real-world application of CBDM is shown in Figure 2. Here CBDM was applied to protect one of the most important paintings in the National Trust collection from excessive daylight exposure. ‘Hambletonian, Rubbing Down’ (by George Stubbs RA, 1724–1806) hangs below the roof lantern on the main staircase at Mount Stewart, Northern Ireland. In one of the first applications in a UK historic building, the research employed CBDM to understand the fall of daylight on Hambletonian, its annual light exposure and the effect of proposed light control measures/interventions to reduce the long-term light exposure. The left hand image is a photograph of Hambletonian displayed on the Stone Staircase, and adjacent is a simulation showing the predicted annual daylight dose incident on the surfaces of the (virtual) model of the Stone Staircase using false colour and a logarithmic mapping. The approximate position of the painting is marked. Illuminance monitoring alongside Hambletonian indicated that it was most likely receiving significantly more than the recommended light dose for this type of painting. This was confirmed by the CBDM simulations, which were then applied to quantify the effectiveness of various interventions to reduce the light dose received by the painting, e.g. reduced reflectance by changing the colour of the cupola/walls, and reduced transmission for the rooflight glazing.
14
These interventions were then put in place, and the monitoring to date suggests that the annual light dose has indeed been reduced broadly in line with that predicted by the simulations.
Photograph showing Hambletonian displayed on the Stone Staircase at Mount Stewart (Belfast, Northern Ireland) alongside CBDM simulation of cumulative annual illuminance (available in colour in online version)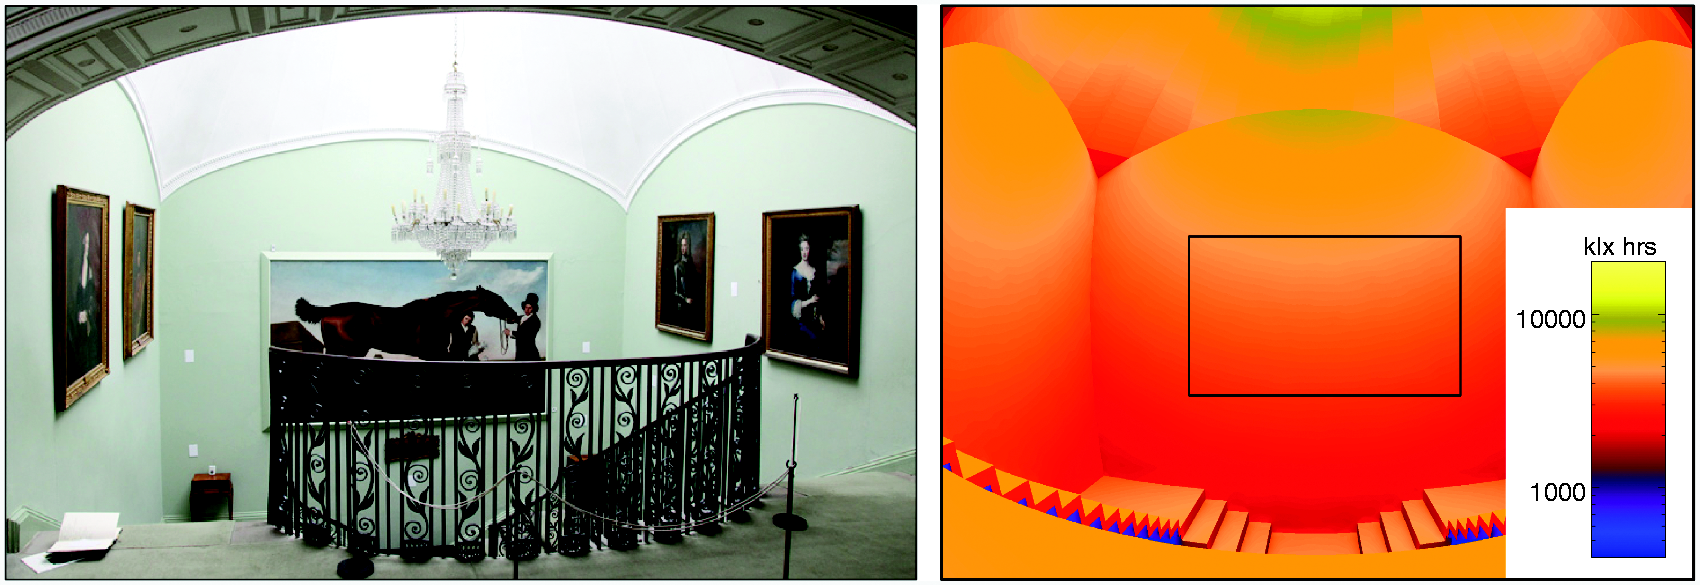
Although challenging to model accurately, the Stone Staircase at Mount Stewart nevertheless presented a rather more straightforward scenario than the majority of historic/conservation sidelit spaces. The daylight on the staircase where Hambletonian is displayed was no longer subject to the operation of blinds or shutters – a previous external louvre system had failed and was removed. In contrast, for any space that is subject to the operation of blinds or, as is the case with many historic buildings, a combination of shutters, blinds and curtains, the cumulative daylight exposure will be very sensitive to the precise schedule of their operation. Whilst the room-specific operational schedule in National Trust properties is adhered to, in the main, with enviable rigour, any mechanism dependent on human agency will invariably fall short of the ideal. Additionally, for the foreseeable future, it is not a practical prospect to reliably simulate the daylight dose in, say, every National Trust room where light meter readings are routinely recorded/logged.
The study described here is the first to quantify and make ‘visible’ the prevailing daylight illumination in spaces (i.e. the light that we can't see) via a procedure of direct measurement using a camera-based technique. Until now, that could only have been achieved indirectly using simulation. The setting for the study is the Smoking Room at Ickworth House (Bury St. Edmunds, UK) shown in Figure 3.
Smoking Room showing the HDR camera field of view with the Hanwell illuminance meter HAN1 circled in green. Tone-mapped HDR capture taken at 16-06-07-12h00 (available in colour in online version)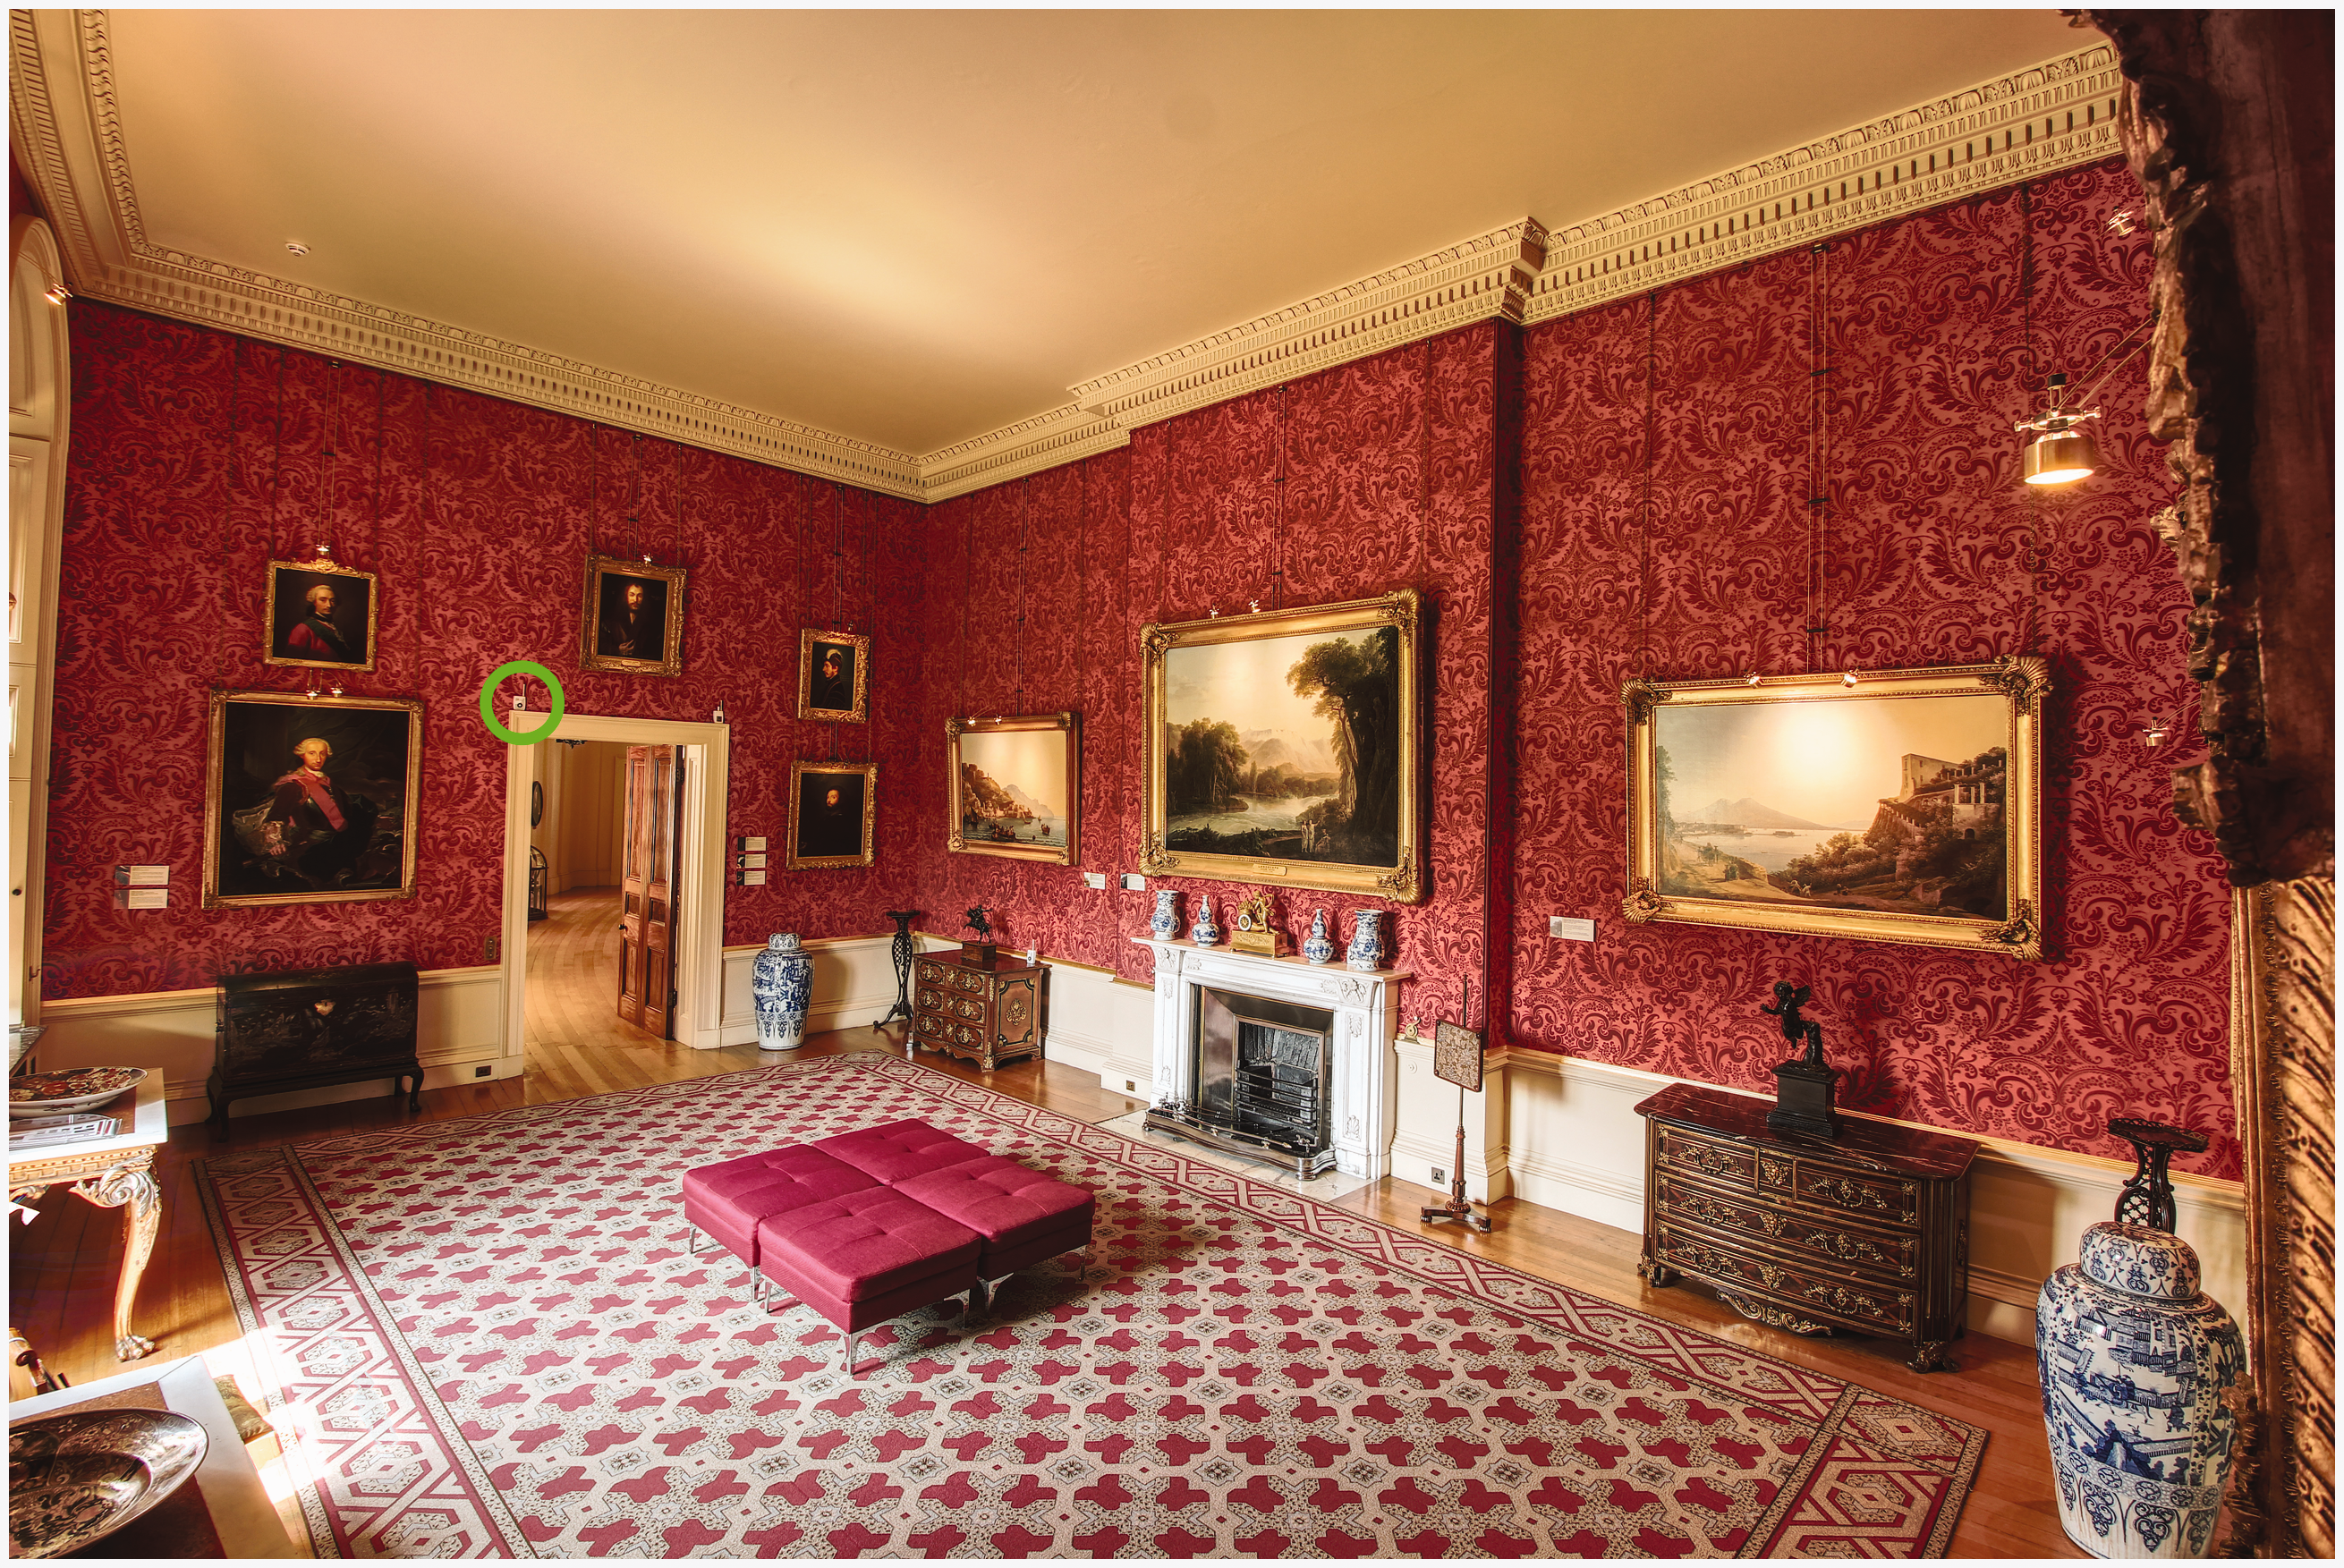
3. Theoretical basis
HDR imaging (or HDRI) is the generation of an HDR image using camera-based techniques. There is a considerable body of computer graphics research dedicated to the capture of object reflectance fields using HDRI. Often this is for the purpose of relighting a virtual ‘copy’ of the object under arbitrary illumination conditions. 15 The majority of these techniques are geared ultimately to generating realistic images for the film, gaming and advertising industries. The techniques invariably require complex and/or highly controlled lighting conditions. None of these appeared suitable for practical application in the setting described here.
In the field of building science, HDRI has been proven to be a potentially reliable technique for the measurement of luminance. 16 Perhaps the most active area of applied research in recent years has been for the study of glare.17,18 Usually this involves the generation of hemispherical fisheye views of potentially glare-inducing scenes, and then relating the physical measures of luminance in the HDR images to subjective assessments of glare. The derivation of incident illuminance using HDRI where the target surface is a uniform diffuse reflector which does not have strong colour saturation is fairly straightforward.19,20 In 2009 a novel technique devised by Mardaljevic was described whereby highly complex illumination fields (e.g. those emerging from a light-pipe) could be measured using HDRI in a transmission mode. 21 Other applications include the investigation of luminance-based metrics related to visual perception. 22
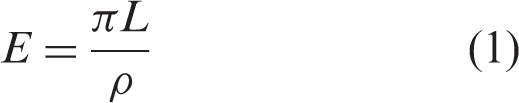
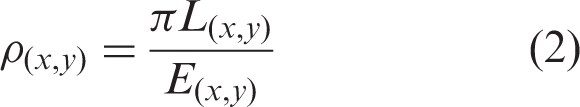
For the example shown in Figure 1, the simulation tool (i.e. Radiance) has to first compute all of the light falling onto the visible surfaces on a per pixel basis. Then, the interaction of that illumination with each visible surface, according to the orientation and photometric properties of the respective materials (at that pixel), results in the creation of the ‘appearance’ (HDR) image. Here, that procedure is effectively reversed – the illumination E is determined from the luminance L in a HDR image taken by a digital camera. For a Lambertian (i.e. purely diffusing) surface which has a diffuse reflectance ρ, the relation between E and L is straightforward
For a largely empty space with a limited number of diffusely reflecting surfaces (e.g. matt finish walls and ceiling), a HDR image of the simple scene could be readily converted to an illuminance map (similar to Figure 1) by creating a so-called albedo map of the same pixel dimensions as the HDR image, and assigning the appropriate reflectance value to each pixel, say: ρ1 for the ceiling; ρ2 for one wall; and, ρ3 for another wall (should it have a different reflectance). An idealised schematic illustrating how equation (1) would be used for such a scenario is shown in Figure 4. Note, the mathematical operations are applied on a per pixel basis.
Schematic illustrating derivation of illuminance map from HDR image and albedo map (available in colour in online version)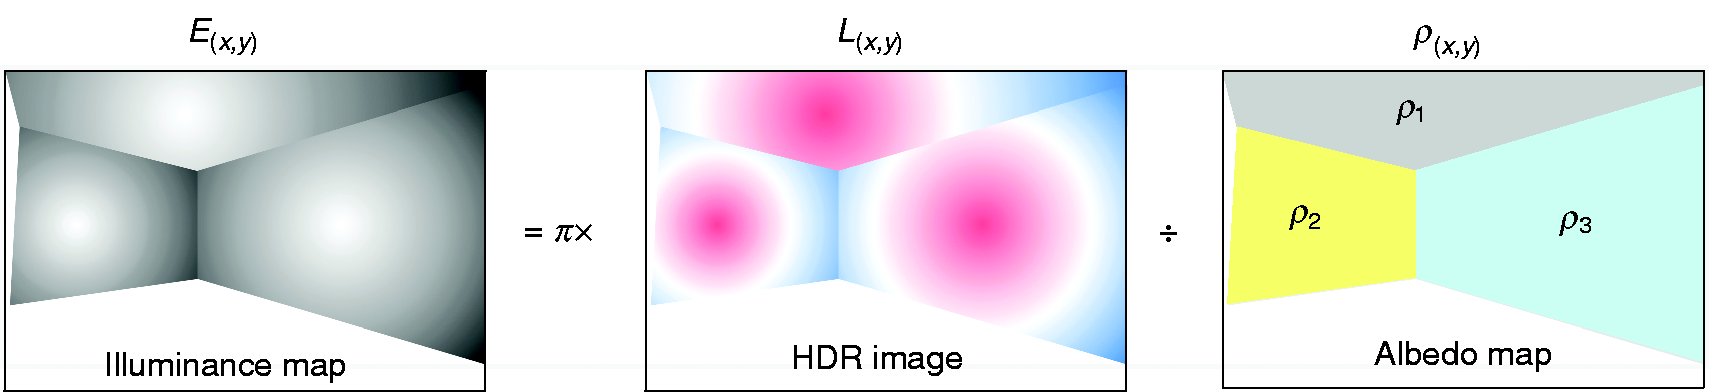
The illuminance map can be thought of as comprising three distinct illumination fields: one for the ceiling, and one each for the two walls. Notwithstanding the noted spatial variation in daylight distribution that is typical of naturally lit interiors, the prevailing daylight illumination across, say, a wall exhibits gradual rates of change in magnitude provided that direct sunlight is not incident on the surfaces considered – as will generally be the case in the Smoking Room. Thus, it should be possible to faithfully reconstruct the prevailing illumination field across a wall from incomplete (i.e. ‘patchy’) knowledge of the wall's albedo using a suitable surface interpolation algorithm.
As is evident from Figure 3, the walls of the Smoking Room present a reflectivity environment far more complex than the idealisation shown in Figure 4. Firstly, the surface finish of the paintings and their frames are specular (or ‘shiny’) to varying degrees, and so the relation given in equation (1) does not apply. Close examination of the wallpaper showed that it does behave essentially as a Lambertian (i.e. diffuse) reflector. The wallpaper however is patterned: a hand-printed dark motif over a largely homogenous base colour. Consequently, it would not be possible to create a simple albedo map of the type illustrated in the schematic (Figure 4).
Since the daylight dose falling onto the paintings was the principal concern, patches of known reflectance positioned around the paintings would probably suffice in order to reconstruct the prevailing daylight illumination field across the two main walls visible in Figure 3. Our first thought was to attach strips of grey card to the front of the picture chains, these would then act as patches of known albedo. Only eight paintings are present on the two walls imaged by the HDR camera (Figure 3), resulting in a maximum of 16 cardboard strips (i.e. patches of known albedo). A more numerous and widely distributed set of patches would have been preferred, however temporary attachment of these cards to the picture chains was the only such addition that would be allowed in a sensitive conservation setting. This approach was briefly attempted, but, notwithstanding the aesthetically detrimental visual impact, this pilot trial was terminated early due to changes in the picture hang of the Smoking Room. This gave pause to formulate and test an approach that would be much less intrusive but also offer better coverage of the two walls.
3.1 Basing an albedo map on the wallpaper
The wallpaper in the Smoking Room is of a hand-printed type, and so is subject to small inconsistencies in the definition and the density of the painted part. The aim of this preparatory part of the validation was twofold. The first was to measure the characteristic reflectance of the wallpaper. The second was to determine the approximate ‘safe’ minimum dimension for a square patch of wallpaper so that, when the square is randomly positioned over the wallpaper, the reflectance of that patch does not deviate significantly from the characteristic reflectance of the wallpaper.
The reflectivity histogram for a representative sample of Smoking Room wallpaper recorded under daylight illumination is shown in Figure 5. The reflectivity at each pixel point (x, y) in the image is
Wallpaper reflectivity histogram showing distribution for dark and light areas. Wallpaper image annotated with line showing 2 × the ‘safe’ minimum dimension for the sampling box (available in colour in online version)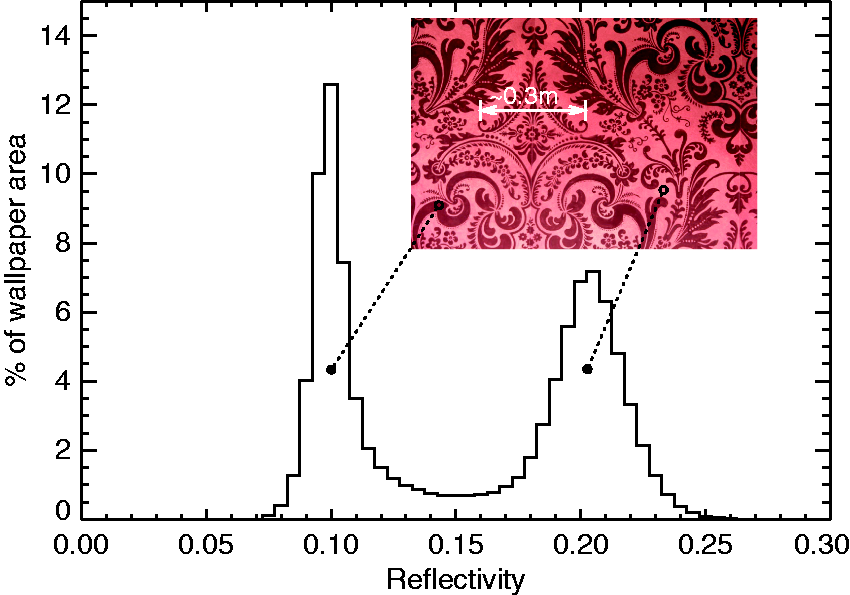
For the next stage of the analysis, the average reflectivity was determined for a square patch of wallpaper randomly positioned on the sample shown in Figure 5. The patch was progressively increased in size until, for each of the randomly positioned patches, the mean reflectivity was 0.16 and the standard deviation in the reflectivity was less than 0.005. The wallpaper sample shown in Figure 5 is annotated with a line showing 2 × the ‘safe’ minimum dimension for a square sample of wallpaper patch to ensure that it has the characteristic reflectance of 0.16. Illuminances derived from HDR images of the wallpaper were found to be in good agreement with measurements of illuminance recorded by a calibrated light meter, i.e. within ±10%. The validation of illuminances derived from HDR images of the wallpaper is described in Section 5.
Most commonplace materials that are perceived to be essentially diffusing are rarely if ever perfectly Lambertian, e.g. as the angle of incident light tends to grazing, the material will begin to exhibit some specular character. However, to have any significant effect on the outcome for the technique described here, the camera would need to be positioned to receive the grazing incidence reflection, i.e. to ‘see’ the wallpaper almost edge on – which is evidently not the case for the two main walls used for this study (Figure 3). Material finishes with a noticeable specular finish, however, are not suitable for the approach described here. The existing techniques to capture object reflectance fields using HDRI have the potential to separate out the diffuse and specular components of reflection. However, as noted at the start of this section, the procedures are complex – often requiring that the object is placed inside of a controlled illumination environment known as a ‘Light Stage’. 15 At present, the practicalities (including cost) are such that these film industry special effects techniques do not lend themselves for adaptation to the scenario described here.
3.2 ‘Patching’ the Smoking Room
The next step was to identify and catalogue (by pixel coordinates) a sufficient number of wallpaper squares which will serve as the albedo patches, and so the basis for the interpolation of the illuminance maps. This required a degree of judgement since, to function correctly, each patch of wallpaper had to be largely free from the effects of localised shading, e.g. from nearby ornaments, picture frames, etc. This necessitated also avoiding the lengths of picture chain hanging from just below the decorative plaster moulding. A total of 38 suitable patches were identified for the west wall (the smaller of the two) and 78 for the north wall. Giving a total of 116 patches – each one acting as a proxy for an illuminance meter. These are shown in Figure 6, which also has an outline of the two planes across which the illuminance map will be interpolated. The smallest of the patches shown are approximately the size of the safe minimum dimension, whilst the majority are comfortably larger than the minimum. It was apparent in the room that there is a marked vertical gradient in illumination around the height of the dado rail, and so a number of patches were positioned accordingly in order to attempt to capture this variation.
Image of the Smoking Room showing the wallpaper patches used for the interpolation of the illuminance map (available in colour in online version)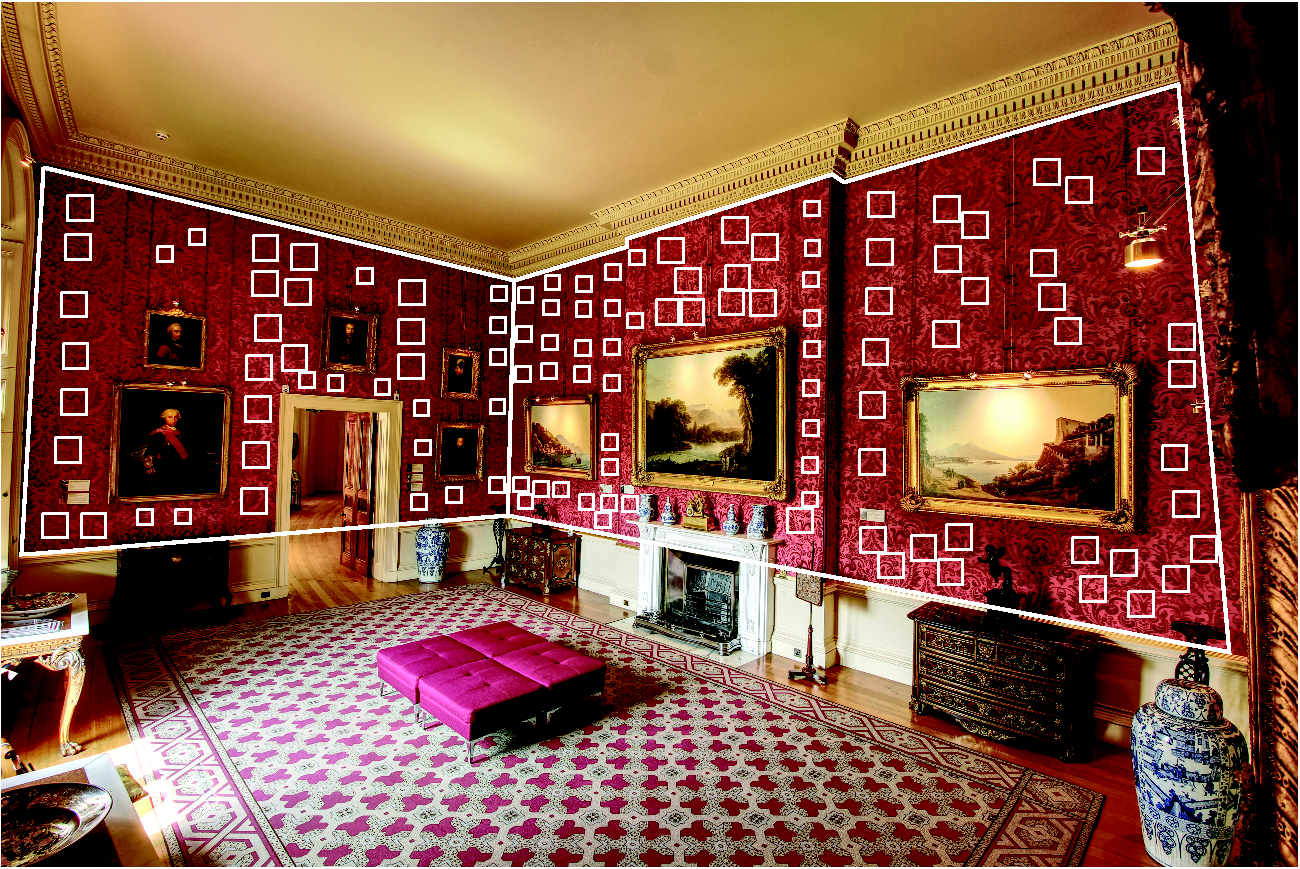
4. Methodology and practicalities
The 2016 monitoring campaign required that HDR capture in the Smoking Room took place over several months. The capture system had to operate completely autonomously and in the absence of any network connection. The Ickworth House wifi network could not be extended the distance required to include the Smoking Room, and there was not a sufficiently strong 3G/4G signal in the room to attempt an internet connection via telecommunication means. Thus it would not be possible to confirm remotely that the system was functioning, let alone to transfer the huge volumes of data that were expected (of the order of a Tb). So, in addition to autonomous operation, the system had to be resilient and have the capacity to recover from accidental interference (e.g. power loss) and potential system failures (e.g. the stalling of the HDR process due to a communication failure between the camera and the controlling computer).
4.1 Instrumentation
Prior experience led the authors to favour using a Mac Mini as the controlling computer, both for its UNIX-based operating system and the reliability of the hardware. Additionally, there was no necessity for a screen, mouse or keyboard to be attached to the computer. A 1Tb bus-powered portable backup drive was connected to the Mac Mini as a ‘failsafe’ to copy all the captured data as an assurance against total data loss should the primary hard drive in the Mac Mini fail. The camera used was a Canon 550D digital single-lens reflex (DSLR) APC camera with a Canon 10–18 mm zooms lens. The Canon DSLR was tethered to the Mac Mini using a 3 m USB to USB-micro cable, and the camera powered by an AC supply unit. The camera was attached to a custom-made bracket which was affixed to a window frame in the Smoking Room following the necessary approval, Figure 7. Both the Mac Mini and the camera AC supply unit were connected to an extension lead, the other end of which was plugged into an AC timer attached to a wall socket nearest to the camera. The Mac Mini was enclosed in a security housing and it, together with the ‘failsafe’ drive, were secreted inside a boxed-in radiator under the marble sill below the window.
Smoking Room HDR camera on custom bracket attached to window surround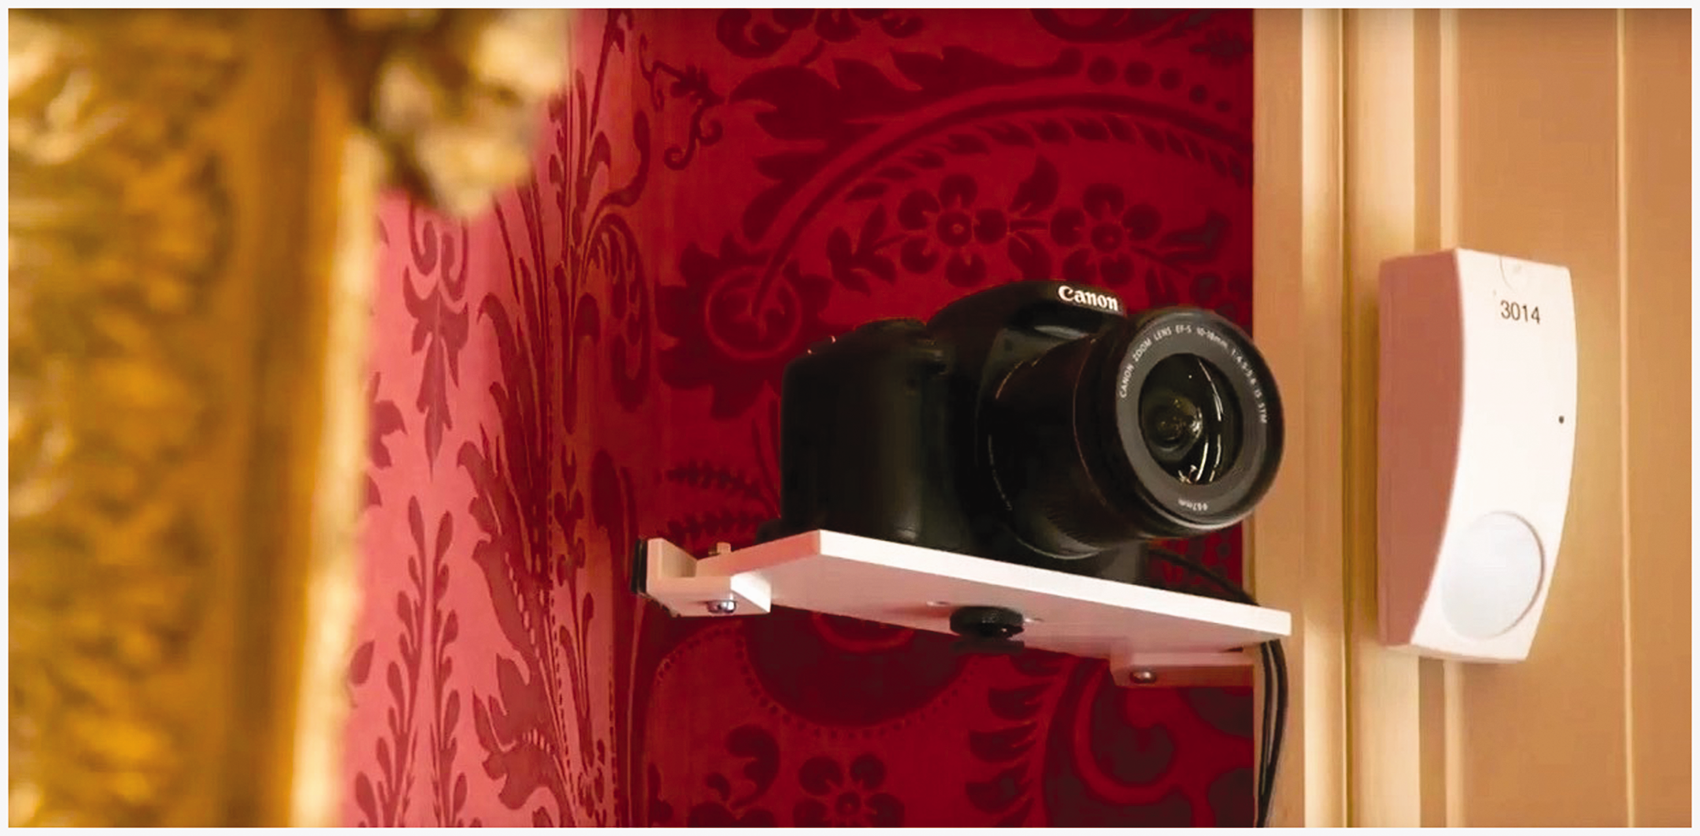
A pilot run in 2015 revealed that the capture system had stalled on several occasions. Provided it was noticed by one of the House staff, the HDR capture could be restarted by simply interrupting the power supply briefly, e.g. a switch-off then on at the mains. The capture failure however could easily go unnoticed for days if not weeks. Analysis of the times at which stalling occurred together with examination of the capture log files revealed the cause. When failure did happen it was nearly always at the scheduled time of use of the room, and the cause was a drop in the USB connection between the Mac Mini and the Canon DSLR such that the computer could no longer detect the (still physically) connected camera. It was discovered that a room heater had been plugged into the extension lead that was supplying the camera and computer. It seems highly likely that the switching on of the heater at the time that the room was opened for display caused sufficient noise in the mains supply to interrupt the equipment on the same lead. The Mac Mini has very good electrical protection, and so it seems likely that the (much less well protected) camera AC supply was sufficiently perturbed by the mains noise to cause the camera to drop the USB connection. Once dropped, the connection can only be regained by a restart of the system – there did not appear to be any way that this could be achieved through software. The fix achieved was a failsafe reboot each midnight when the AC timer would disconnect power to the computer and camera for 5 minutes. Thus, if the process had stalled, the most that would be lost would be data for part of one day. This proved to be a remarkably effective solution to deal with the practicalities of monitoring in real spaces under normal use – eventualities that would not have been encountered had the study been carried out under controlled/laboratory conditions.
4.2 HDR capture
The camera zoom lens was set to 10 mm giving the field of view shown in Figure 3. The aperture was set to f8, the sensitivity to ISO 100 and the white balance to ‘Daylight’. The focussing mode was set to manual and the focus checked/adjusted for sharpness once the camera was attached to the bracket. The HDR capture sequence was controlled by a timed script which was executed every 10 minutes using the UNIX
The HDR capture equipment was installed in the Smoking Room on the 5th June 2016 for the 2016 monitoring campaign. Full-day recording began the following day 6th June 2016. Until the end of the year there were 209 days, giving a total number of possible HDR captures equal to 30,096. The total number actually recorded was 24,627. Some were lost due to occasional failures of the HDR capture resulting from a break of communication between the camera and the computer – this occurred on at least 4 days. Any such ‘stalled’ process would recommence following the midnight reboot. The other ‘lost’ days were due to the equipment being switched off in later months (November/December) when the Smoking Room was not open to the public and the shutters closed. The monitored data were retrieved during a planned visit to Ickworth on the 19th January 2017. It was discovered that the camera shutter had failed just a few days before, though since the room has closed no useful data were lost. The HDR capture equipment had been operating autonomously for over 7 months until the failure occurred. The 24,627 HDR captures that were recoded during 2016 monitoring campaign required 172,389 mirror/shutter movements for all the LDR images taken. Of the 24,627 HDR captures recorded, 4,663 had sufficient average luminance to exceed the ‘dark’ condition.
Multiple Hanwell loggers were deployed in the Smoking Room for this monitoring campaign. Three of the four loggers deployed were placed in the camera field of view: above the door (HAN1); on a chest of drawers (HAN2); and, between the vases on the fireplace (HAN3). The Hanwell loggers recorded illuminance every 15 minutes. In the grounds at Ickworth, a BF5 (Delta-T Devices) instrument to record global and diffuse horizontal illuminance was deployed to record external illumination conditions during the period of internal monitoring, Figure 8. The BF5 Sunshine Sensor is a solid-state device with no moving parts. It uses an array of photodiodes together with a shading pattern to measure incident solar radiation from which it calculates the global and diffuse components of the radiation. These data were recorded at 1 minute intervals.
Delta-T BF5 sunshine sensor in the grounds at Ickworth House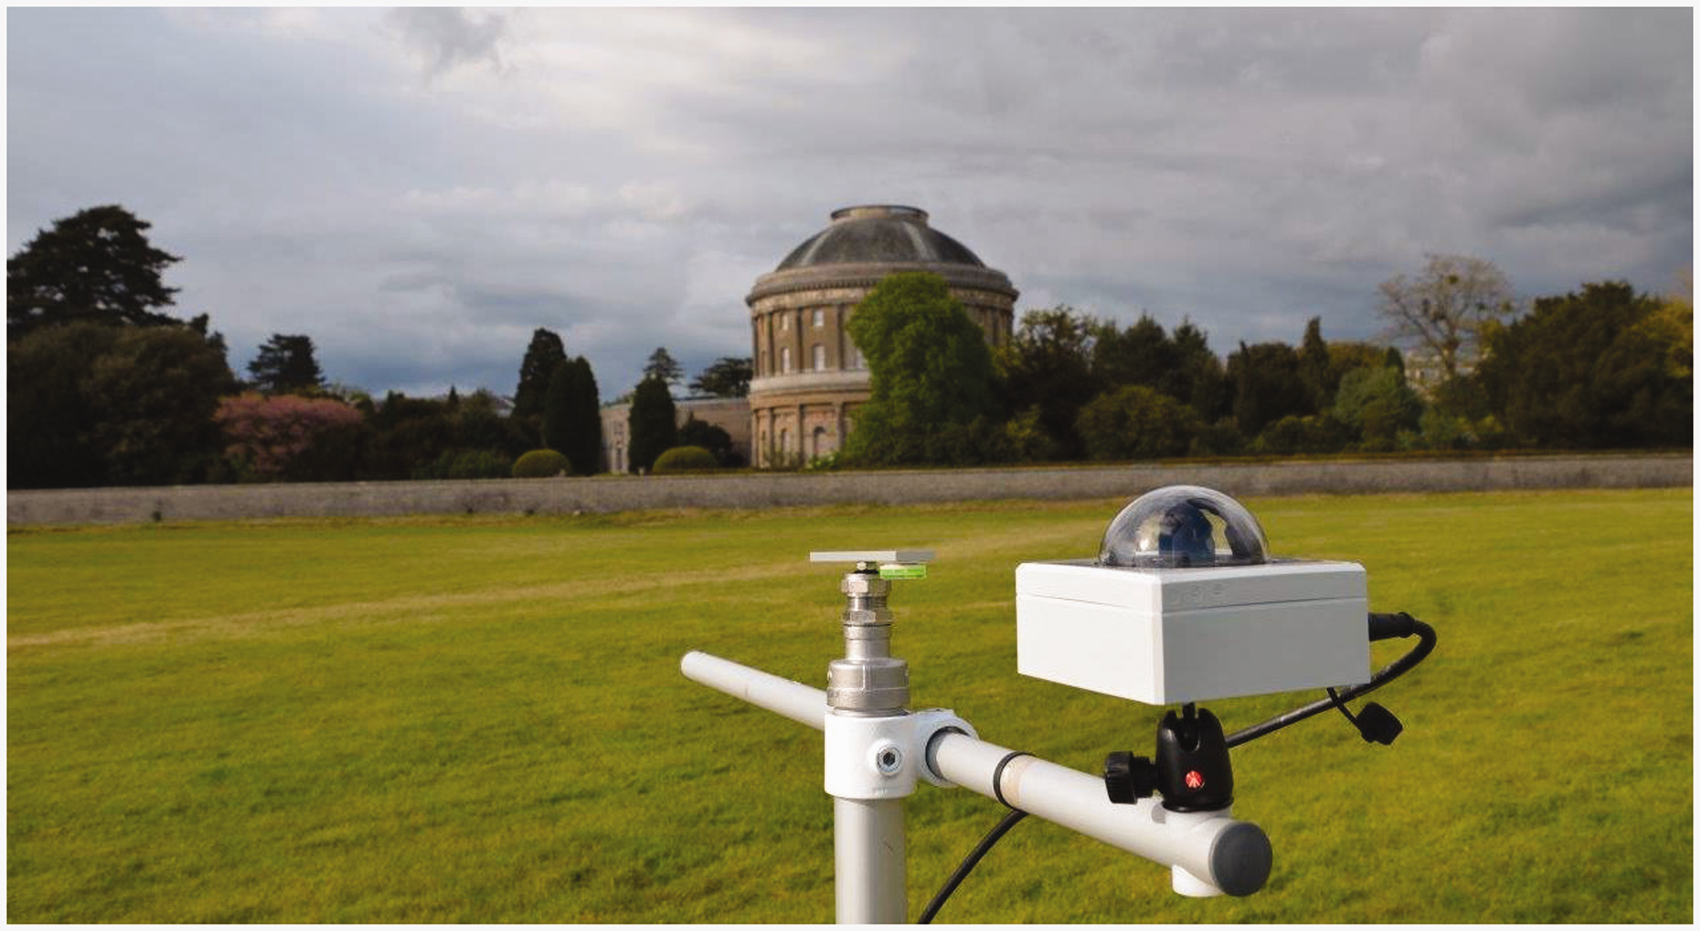
4.3 HDR image processing
The retrieved data were first processed to generate daily thumbnail-image sheets showing the luminance in falsecolour for each HDR capture. This served for quality assurance, but also to produce a visual record for the staff showing how the Smoking Room was used on each day of monitoring, e.g. to check for correct use of blinds during days with the potential for significant solar ingress.
Any electric light contribution to the HDR image first had to be subtracted since the small amounts impinging on the patches could nevertheless result in an over-estimation of the interpolated daylight illumination field. This required testing for the lights-on condition and, if detected, subtraction of the respective lights-on/no-daylight reference HDR. Next, for the west and north walls in turn, each wallpaper patch was tested for the presence of ‘ghosts’, i.e. line-of-site obstruction of the patch caused by one or more of the visitors in the room during the capture sequence. This was achieved with a correlation test whereby, for each patch in turn, pixel luminance values were compared with those from an empty room reference HDR image. A correlation coefficient threshold of 0.8 was deemed sufficient to identify the at risk patches. Any patch with a correlation coefficient less than this threshold was, for that time-step only, labelled and excluded from contributing to the interpolation.
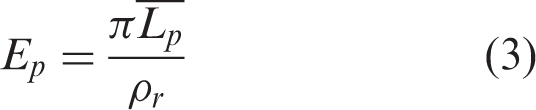
For all patches passing the correlation test, the (daylight) illuminance across the patch E
p
is calculated from the mean pixel luminance across the patch
For the interpolation, the patch illuminance E p is assigned to the patch centre. The IDL function GRIDDATA was used to interpolate the illuminance field across the west and north walls in turn using a Kriging algorithm. 23
5. Validation
Validation of the HDR derived illuminances comprised two parts. One employed a sample of Smoking Room wallpaper in a room with a small dormer window and compared against high-frequency measurements taken by a calibrated light meter (this was carried out in an undisturbed room in a residential property). The other validation took place in the Smoking Room during the HDR monitoring campaign and here the HDR derived illuminances were compared against measurements taken by a Hanwell device.
5.1 HDR-derived illuminance validation: Controlled environment
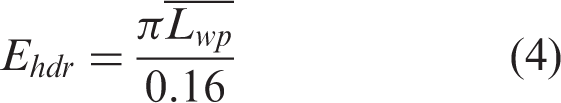
For this first part of the validation, HDR-derived illuminances were determined using a sample of Smoking Room wallpaper mounted on a board and located in an undisturbed room in a residential property. The room has a small dormer window with east-facing glazing. The sample of wallpaper was approximately 0.5 m across. Thus the overall sample dimension is approximately three times larger than the ‘safe’ minimum dimension required to ensure an overall reflectance of 0.16. Employing the same camera settings that were used later on in the Smoking Room, the view of the wallpaper sample that was used for the validation are shown in Figure 9 – the rest of the image (miscellaneous clutter in the room) is greyed out. The target area of the sample containing the pixels used for the derivation of illuminance is indicated by the two boxes drawn on the centre patch. The photocell head of a calibrated, logging lux meter was positioned approximately at the centre of the sample. The HDR-derived illuminance E
hdr
was determined from the mean luminance Centre and edge views of the wallpaper test patch installed in room with small dormer window (rest of the image has been grayed out). The centre patch is annotated with boxes showing the ‘target’ area of the sample used for the test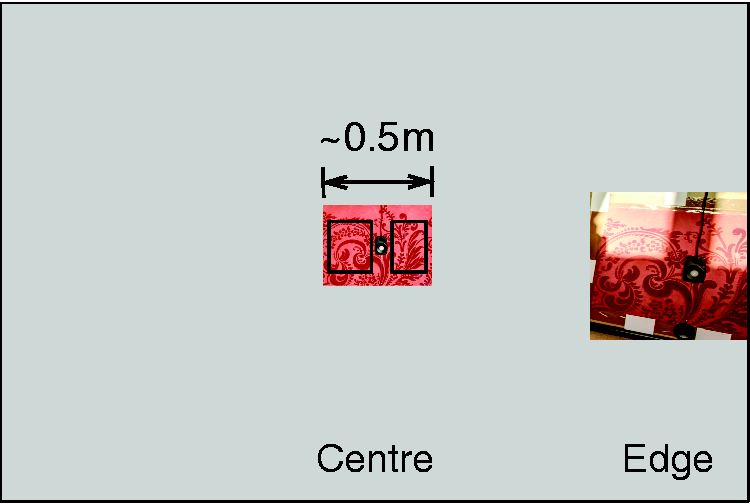
Thus E hdr was effectively the average illuminance across the pixels of two target area boxes.
HDR capture occurred every 10 minutes whereas illuminances were recorded every 5 seconds by the logging light meter. Continuous HDR capture and illuminance logging were recorded over 21 days with the wallpaper at the centre of the image 16-03-15 to 16-04-04 and 53 days with the wallpaper at the edge of the image (16-04-05 to 16-05-28). Findings with the wallpaper patch at the centre and the edge of the image were largely identical (vignetting correction had been applied). Thus for brevity, only the results for the centre are presented here. Occasions when sunlight directly illuminated the test wallpaper sample were eliminated from the evaluation shown below since (as noted previously) episodes of short-term/transient direct sun exposure on the actual walls/paintings of the Smoking Room are an extremely rare occurrence. There were 1000 HDR captures over the 21 day period which provided usable data for the comparison of HDR-derived illuminances with those from the calibrated light meter. HDR-derived illuminances (recorded at 10 minute intervals) were compared with the nearest instantaneous illuminance measurement taken at the timed commencement of the HDR capture sequence. A scatterplot of the 1000 HDR-derived illuminances E
hdr
versus those from the calibrated light meter E
cal
are shown in Figure 10. Overall, the light dose H
cal
calculated from the light meter data was 35.02 klx hours, whereas the light dose H
hdr
calculated from the HDR captures was 32.02 klx hours, i.e. 8.6% less than the calibrated meter. A least square fit to the data showed a good linear fit and correlation (Pearson correlation coefficient r = 0.988)
HDR derived illuminance versus calibrated lux meter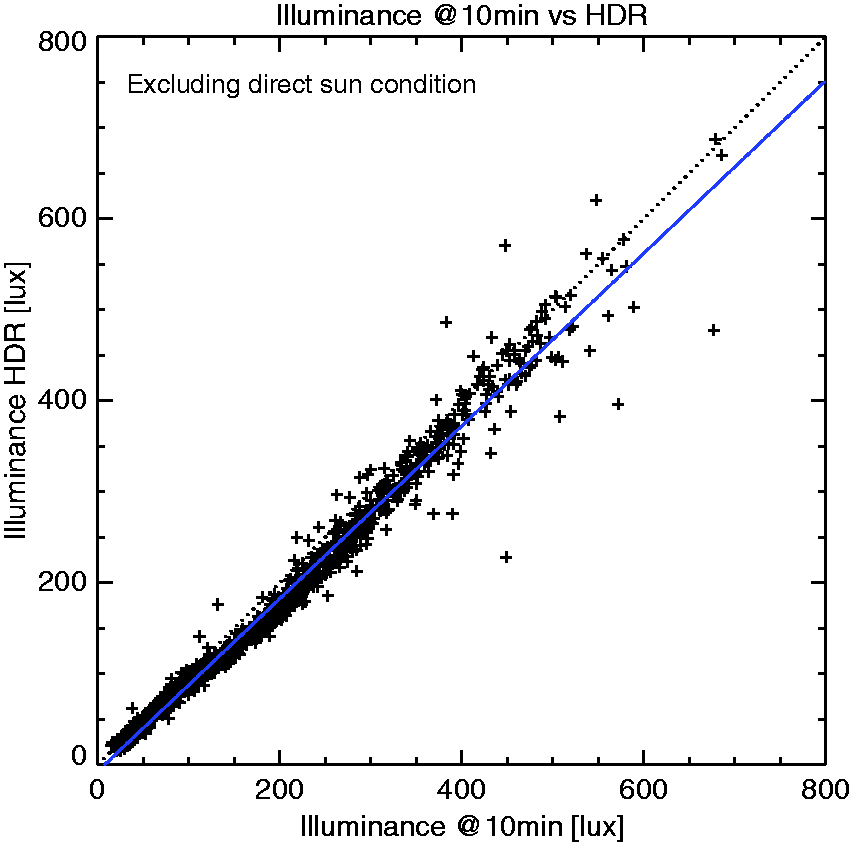

5.2 HDR-derived illuminance comparison: Smoking Room
Validation against in situ measurements taken in the Smoking Room used data from the Hanwell device located over the door and just visible in Figure 3. That area is shown in close-up in Figure 11. The Hanwell device is labelled HAN1 to distinguish it from others that were placed in the room at various times. The wallpaper target area on either side of HAN1 was used to derive the incident illuminance from the HDR capture. The illuminance variation across the area bounded by these two patches is expected to be small, and so the HDR derived illuminance at HAN1 is taken to be equal to the average of the pixel illuminances determined for both patches. Note, the electric light contribution to the HDR image was not subtracted since HAN1 was subject to both daylight and the electric light ‘spillage’ from the nearby painting luminaires. This spillage was typically recorded by HAN1 to be in the range 2 to 10 lx, however the apparent imprecision of the Hanwell at low light levels lends a degree of uncertainty to this value.
Target area around HAN1 for derivation of illuminance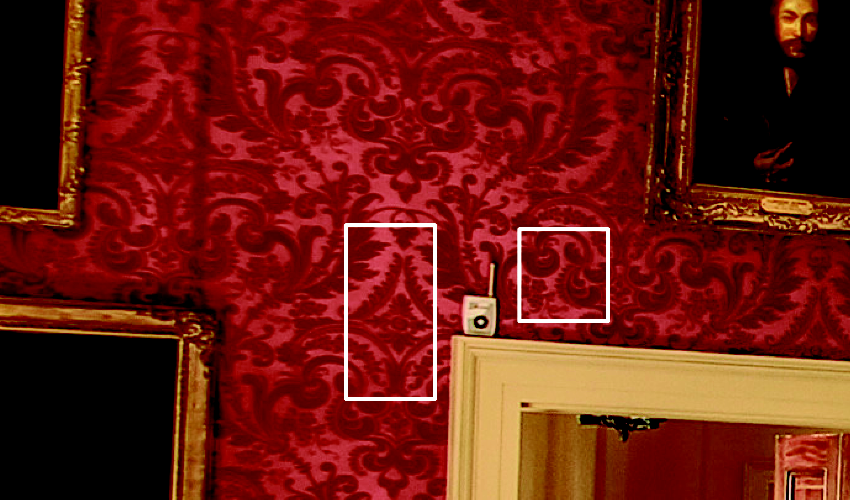
Between the period 16-06-06 and 16-11-30 there were 4,663 saved (i.e. above the dark threshold) HDR captures. Days where the total HDR-derived light dose (at the target area) was less than 2 lx hours were further eliminated from the evaluation. This left 144 days in the evaluation covering the period 16-06-06 to 16-11-19. The analysis revealed that on 4 of those days the HDR capture failed at some point resulting in incomplete coverage. The scheduled midnight ‘hard reboot’ successfully restarted the capture process on all four occasions. Data for two of the 144 days are shown in Figure 12. The HDR derived illuminance is shown as solid grey bars whilst the HAN1 illuminance values are plotted using blue squares. The upper left legend includes the calculated daily light doses H
hdr
and H
han
for HDR-derived and HAN1 logger. Also shown on the plots are curves for the externally recorded global horizontal illuminance (GH) and diffuse horizontal illuminance (DH) in, respectively, green and red – both scaled to the right side Y-axis. The first of these days (16-09-17) was overcast, the other (16-10-02) mixed cloudy and clear sky conditions showing rapid variation at short time intervals. The daily time-series plots reveal some subtle and interesting dynamics of illumination in the space. For example, between 14h00 and 16h00 on day 16-10-02 (Figure 12) when both HDR and HAN1 show a gradual rise as the global horizontal illuminance declines. This regular occurrence is caused by semi-specular reflections of afternoon sun from the varnished floor near the windows creating extended patches of enhanced daylight illumination on the upper part of the west wall. Such effects would be very challenging to reproduce accurately in a simulation.
Smoking Room illuminance plots for days 16-09-17 and 16-10-02 (available in colour in online version)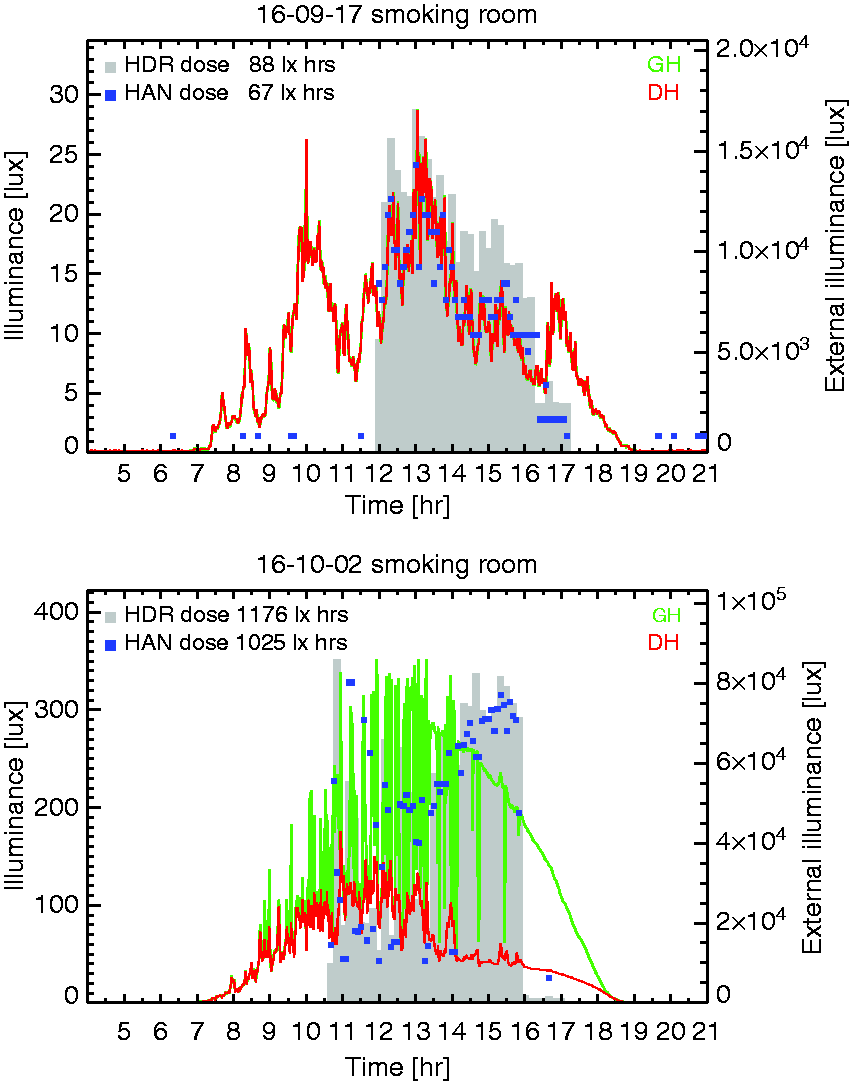
The HDR-derived illuminances were generally greater than those recorded by the Hanwell. Similarly, the calculated HDR daily light doses were greater than the respective Hanwell daily light doses. A scatter plot showing the daily light dose for all 144 days reveals this trend, Figure 13. A linear regression fit gives the following relation (Pearson correlation coefficient r = 0.990)
Daily dose HAN1 vs. HDR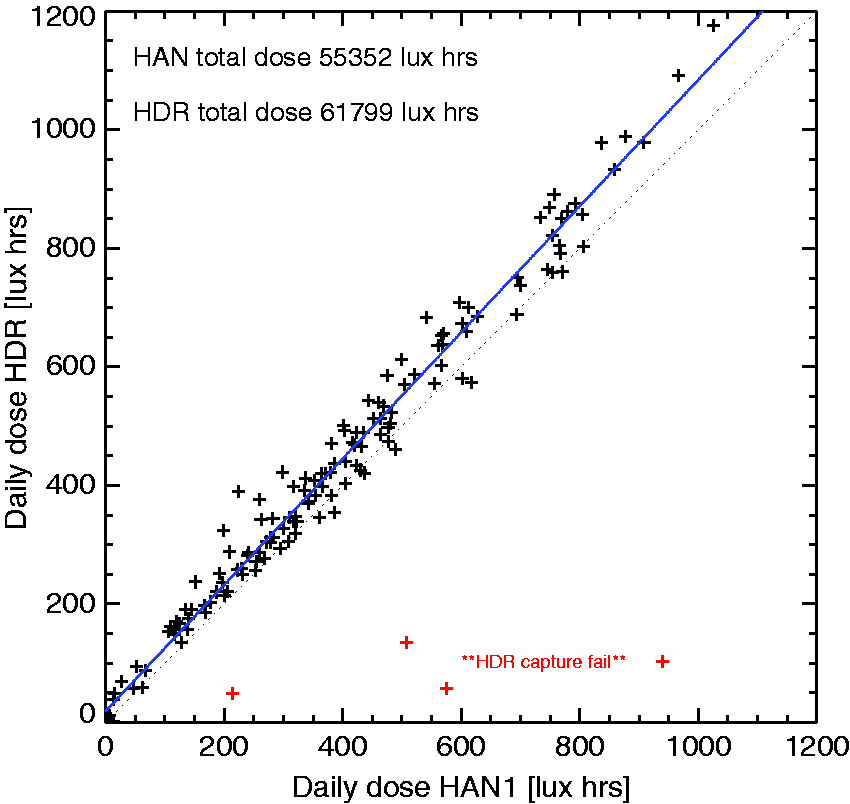

Overall, the cumulative light doses for all 144 days were 61,799 and 55,352 lx hours for the HDR and HAN1 respectively. Note, due to the difference in sampling frequencies (10 min for HDR and 15 min for HAN1) this comparison was based on daily light dose values rather than point-in-time illuminances.
Given that E hdr was consistently less than E cal , the authors are inclined, for this particular study, to consider that the HDR-derived illuminances are in fact more accurate than those recorded by HAN1. Notwithstanding that assertion, the overall agreements between: E hdr and E cal ; and, E hdr and E han are generally within the ±10% range which is considered good/acceptable for illuminance measurements. Recall also that the additional refinement of applying a correction factor to the HDR-derived illuminances based on the ‘controlled environment’ test was not applied.
The two other Hanwell devices visible in the HDR field-of-view were HAN2 (on a chest of drawers) and HAN3 (on the fireplace), Figure 14. In terms of the daylight illumination received by these two loggers, both were subject to a combination of localised obstruction and reflection. Thus, neither would be subject to the prevailing daylight illumination field as defined above, and so it is not possible to use the data from these loggers to compare with HDR-derived illuminances in the manner described above. For example, the supporting surface for HAN2 (chest of drawers) will both block below-horizon illumination and reflect above-horizon illumination back up to the photocell. Assuming a moderately homogeneous illumination field, the net effect overall will be a reduction in received illumination at HAN2 compared to the situation without the chest of drawers (with the photocell in the same position). This is because the degree of diffuse reflection off the surface (and back up to HAN2) will invariably be less than the reduction in illumination caused by the obstructing surface, especially for a dark surface such as the wooden top of the chest. However, it is evident from Figure 14 that both photocells will also be subject to specular reflections due to the shiny surface finish on both the chest and the fireplace – the reflection of the Hanwells is clearly visible in both cases. This could significantly add to the illumination received at the photocells, particularly if – from the photocells’ viewpoint – it happens to ‘see’ a reflected image of the opposing windows in the (shiny) finish of the surface it is resting on.
Hanwell meters HAN2 and HAN3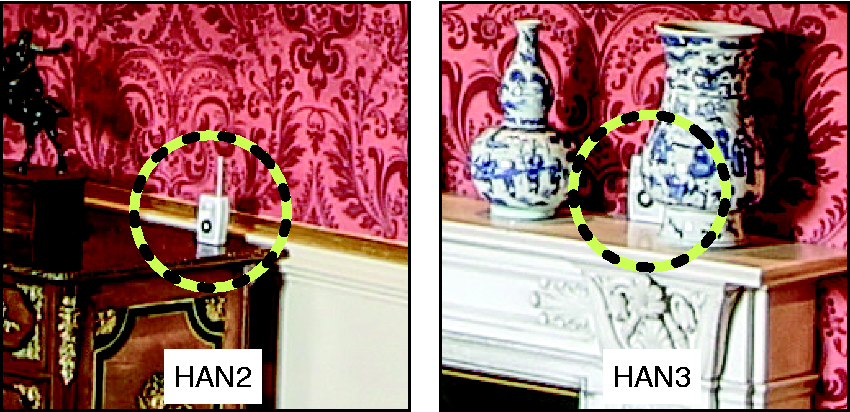
5.3 Additional possible sources of error
It is possible that there may be small deviations in the mean reflectance of the wallpaper across scales greater than a metre or more caused by inconstancies in the manufacturing process. A similar effect could result from inconsistencies in the way the wallpaper was applied and/or variations in the plaster base that could ‘show through’ as (most likely) gradual changes in reflectance. Because of the low mean reflectance of 0.16 determined for the sample, a difference in mean reflectance of just one percentage point in another patch would result in an error in the illuminance estimation for that patch of plus or minus 6% depending on the sense. Such small variations in reflectance would not be noticeable to any observers, but would result in a persistent bias in the interpolated illuminance field at and around all such affected patches. The overall effect would be spurious ‘lumpiness’ in the cumulative illumination fields. If not showing as a conspicuous ‘blob’ in an unlikely place, small variations would be difficult to separate from the underlying illuminance field which is inherently lumpy due to the particular nature of illumination in the Smoking Room. The only practical way to test for this is to illuminate each wall in turn with a known illumination field (e.g. produced by a studio LED panel) and examine the captured HDR images for spurious lumpiness in the interpolated albedo map for the wallpaper (essentially reversing the process described in Section 4.3).
6. Results
The interpolated illuminance field for HDR capture 16-06-10-13h30 is shown in Figure 15, the falsecolour illuminance field is shown superposed on an empty room reference image (Figure 3). Also shown is the patch scheme and the location of the Hanwell logger (HAN1) above the door frame (white + mark). As shown in the validation using the data from HAN1, the HDR derived illuminance at that point shows good agreement with the measurements. For the prevailing illuminance field however, a degree of judgement must be applied to assess the results of the interpolation since no other suitable datapoints are available. The fireplace (north wall) faces the French windows which are the main source of unattenuated daylight for the space. Additionally, at this time, entrant sunlight reflecting from floor/carpet resulted in the highest illuminances (∼300 lx) around the height of the dado rail. The interpolated field on the west wall at this time is more even, showing a gradual maximum around the door position. The sparseness of patches in certain areas lends a degree of uncertainty to the interpolated values in these regions, particularly when a stationary point is present, e.g. above the fireplace. Nevertheless, the overall patterns are in accord with both what was experienced in the space and also CBDM simulations carried out using a detailed 3D model of the Smoking Room.
Interpolated illuminance field from HDR capture 16-06-10-13h30 superposed onto reference greyscale image of the room when empty (available in colour in online version)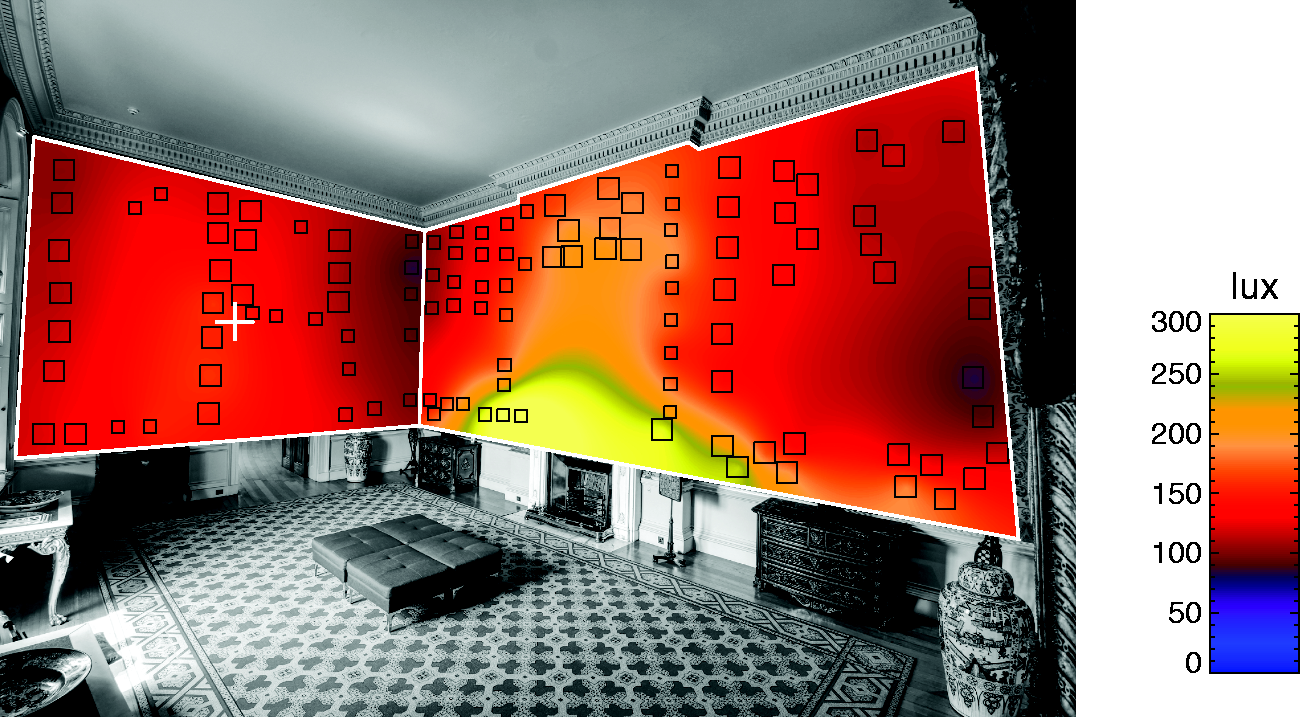
6.1 ‘Ghost’ removal
Application on the ‘ghost’ removal algorithm is illustrated in Figure 16. The wallpaper patches are shown in black and annotated with the correlation coefficient for the patch pixel luminance values against those for an empty room reference HDR image (Section 4.3). The patches where the correlation coefficient was less than the threshold of 0.8 are highlighted in green. The algorithm is sensitive enough to detect the presence of ‘ghosts’ that are barely visible in the HDR. These usually result from visitors in the room moving briskly during the HDR capture sequence, leaving only a faint ‘impression’ on the final HDR image. The algorithm also detects localised shadows on the wall produced by the visitors – these would also distort the interpolated illumination field if not removed. Both of these are present in Figure 16 and picked out with a green bar below the respective patch: localised shadow (one bar) and very faint ‘ghost’ (two bars).
Application of the ‘ghost’ removal algorithm for HDR capture 16-06-10-13h10 (available in colour in online version)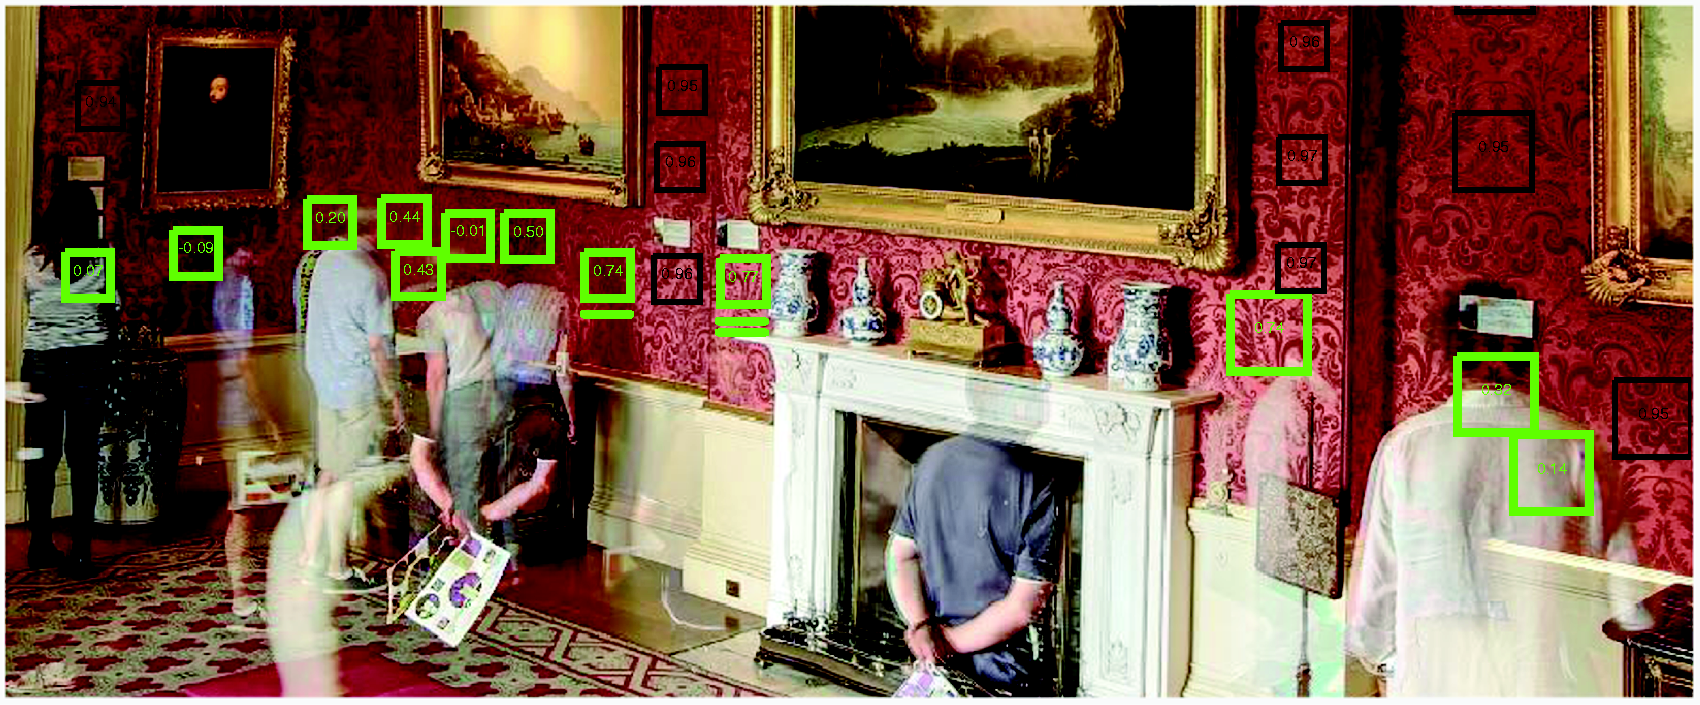
The potentially dramatic effect of ‘ghosts’ on the interpolated daylight field is shown in Figure 17. The occurrence of a ‘ghost’ in any of the patches will invariably result in an incorrect calculation of the incident daylight, often an overestimation since the obstruction is usually of a higher reflectance than the 0.16 average for the wallpaper, as is evident in the example. The correlation test proved very effective in eliminating ‘at risk’ patches from adding spurious peaks or troughs of illumination to the interpolated daylight fields. The Smoking Room wallpaper pattern – originally seen as adding yet another layer of complexity to the problem – became a key part of a more robust solution. Had the (initially) more straightforward approach of selecting a room with uniform painted walls been followed through, the problem would not have been encountered.
Ghost removal effect on interpolated illumination field (available in colour in online version)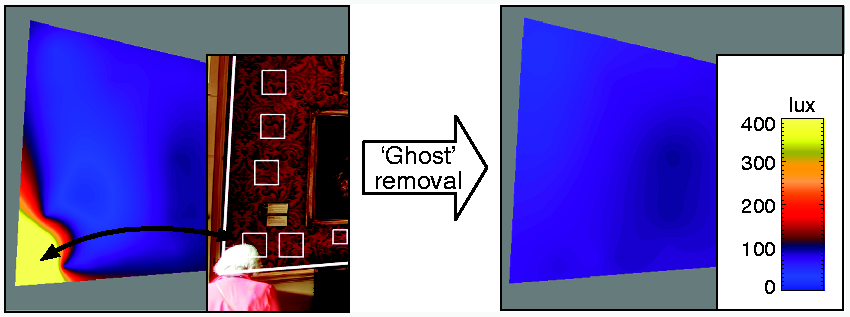
6.2 Cumulative totals
With a robust method for identifying and eliminating ‘at risk’ patches in place, it was then possible to proceed to determine the light dose over extended periods. The cumulative daylight illumination field in lux hours for any particular period is the numerical sum of the individual illuminance fields divided by the hourly HDR capture frequency, i.e. 6 for captures every 10 minutes. Example cumulative daylight illumination fields for days 16-06-10 to 16-06-13 are shown in Figure 18. Lastly, the cumulative monthly daylight dose for June 2016 is shown in Figure 19.
Daylight dose illumination fields for days 16-06-10 to 16-06-13 (available in colour in online version) Cumulative monthly daylight dose illumination fields for June 2016 superposed onto reference greyscale image of the room when empty (available in colour in online version)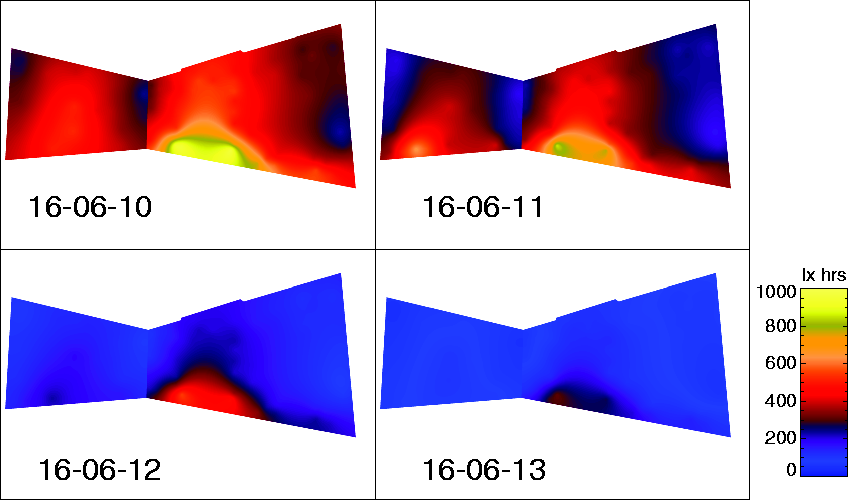
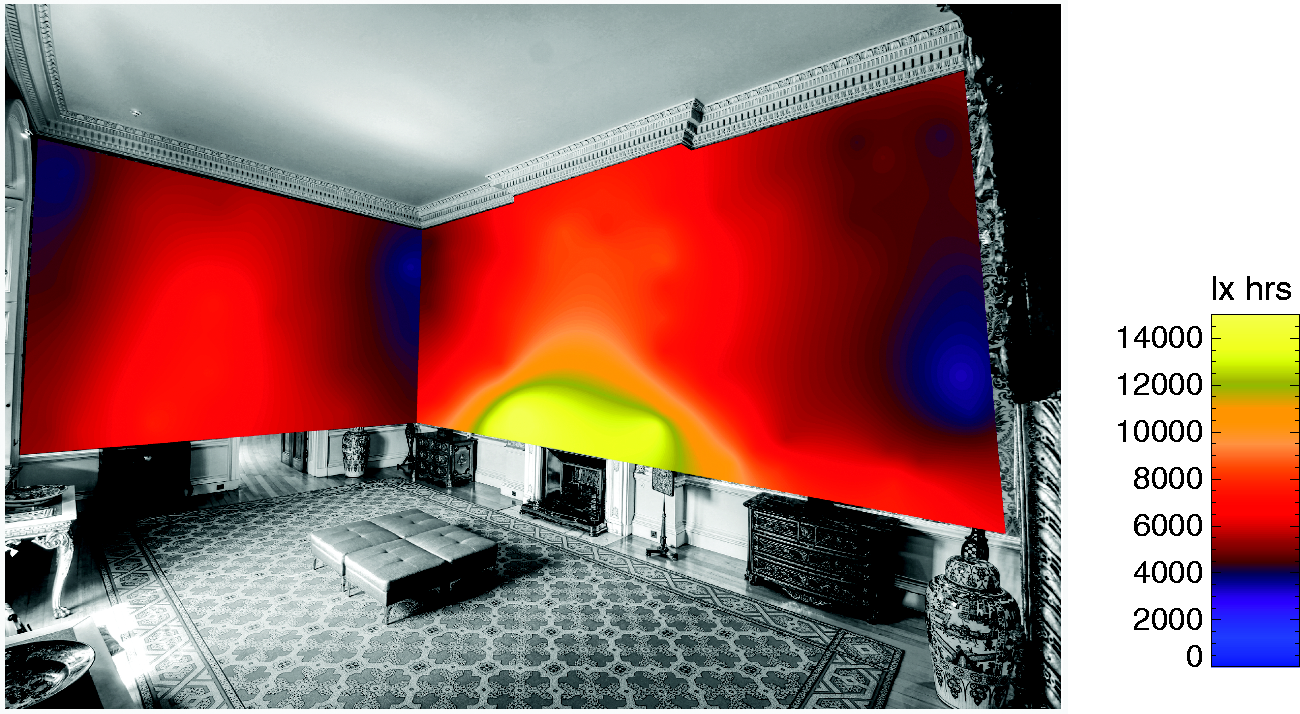
Figure 18 shows how the illuminance fields can be used to understand the daylight characteristics of the Smoking Room. 16-06-10 and 16-06-11 were days with continuous sunshine whereas 16-06-12 and 16-06-13 were completely overcast. The presence/absence of direct sun was determined from data collected by the external sunshine sensor. The contrast in illuminance and daily light dose between the two sets of days can be clearly seen, with the dull days typically accumulating 100–200 lx hours across most of the wall surfaces and the sunny days 400–500 lx hours. Figure 19 shows the cumulative daylight dose for the whole month of June 2016. Thus, the HDR data can be used to build up a picture of the daily and long-term light exposure patterns of the room and how these vary across the wall surfaces. Illuminance maps can also show minimum and maximum lux during open hours under different daylight conditions so we can assess how well visitors can see the room. The HDR-derived lux hour dose and open hours illuminances will be used to improve daylight management so that sufficient daylight is admitted for viewing whilst keeping within conservation standards.
7. Discussion
A novel HDR camera-based approach to measure the cumulative daylight dose in historic/conservation spaces has been described and application demonstrated in a real-world setting. The new approach has been validated and shown to have good agreement with traditional, spot measurements. The use of wallpaper patches as proxy illuminance meters is both accurate and, importantly for visitors, non-intrusive. Additionally, the monitoring equipment offers a capital cost saving against, say, 100 Hanwell meters of greater than an order of magnitude. The ‘ghost’ removal algorithm worked effectively to identify and eliminate at risk patches where the visibility of the wallpaper was fully/partially obscured by one or more of the visitors.
The HDR approach employed off-the-shelf consumer technology which proved remarkably robust and reliable – notwithstanding the expected shutter failure after more than six months continuous use (shutter mechanisms are relatively inexpensive to replace). With improvements in both smart phone imaging chips (now exceeding 12 Mp) and compatible high-quality third-party lenses, it should be possible to configure a functionally equivalent HDR capture apparatus based on the Raspberry Pi micro PC for less than $200(US). 24 An entirely solid-state HDR camera with no moving parts will improve reliability, and so will be a worthy successor to the kit described here provided that the HDR captures can demonstrate comparable accuracy, and, ideally, without requiring expensive calibration equipment. 24
The approach described here depends on having a sufficient number of patches of known mean reflectance visible in the HDR image. Provided there are no particularly steep illumination gradients across any of the objects (e.g. paintings), interpolating the illuminance from surrounding patches is likely to suffice. However, for large expanse artefacts, such as the tapestries at Hampton Court, that approach may not offer adequate reliability. In a follow-on study carried out in the Volury Room at Ham House (Richmond, UK) the authors have adapted the approach so that the artefacts themselves – two large tapestries – serve as the ‘target’ from which the incident illuminance is derived. That study will be reported in due course.
Footnotes
Declaration of conflicting interests
The authors declared no potential conflicts of interest with respect to the research, authorship, and/or publication of this article.
Funding
The authors disclosed receipt of the following financial support for the research, authorship and/or publication of this article: The research described in this paper was funded in part by the National Trust (UK). Professor Mardaljevic acknowledges the support of Loughborough University.