
Abstract
Design criteria for lighting in subsidiary roads usually include a minimum average horizontal illuminance, widely assumed to be the arithmetic mean illuminance. Analyses of the illuminance distributions over thirty road sections shows that the distributions are not normal and hence the median is more appropriate than the arithmetic mean as a measure of central tendency: the medians are significantly lower than the arithmetic means but the two are highly correlated. Design recommendations should state whether it is the arithmetic mean or median and not just the ‘average’ that is required.
1. Design recommendations
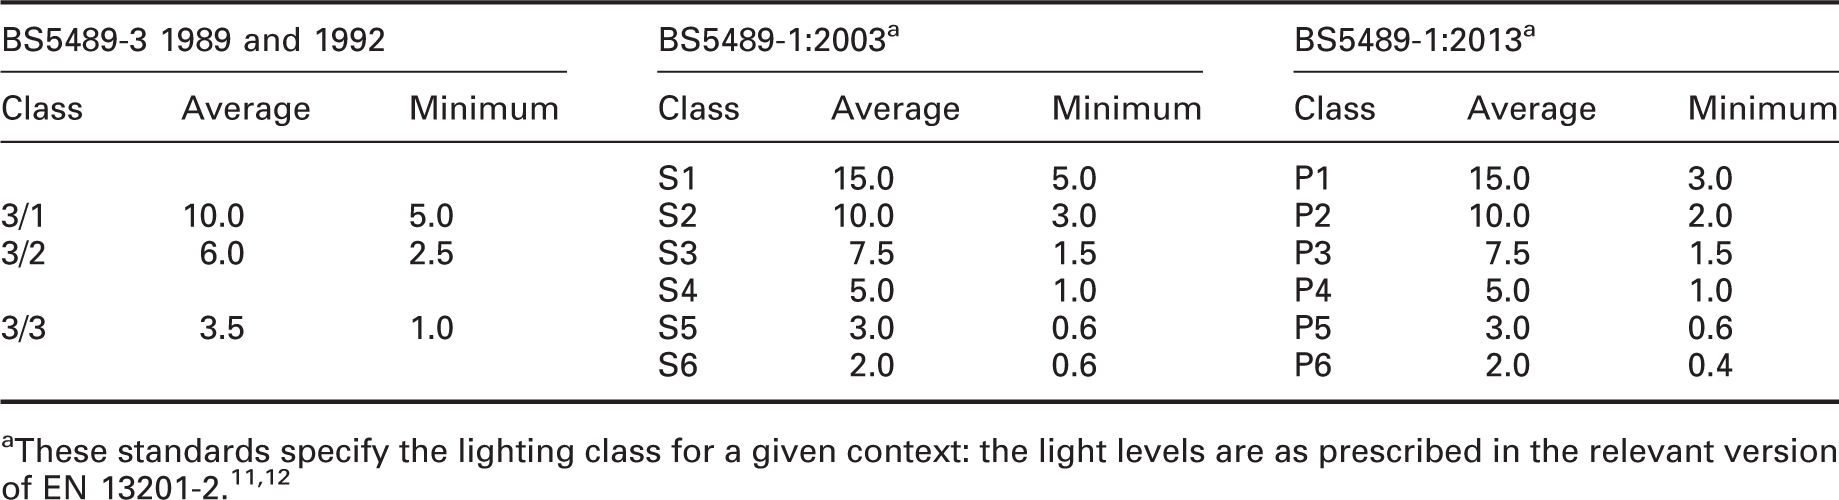
Within the UK, the approach to specification of road lighting has changed over the past 100 years. The first national standard, British Standard Specification 307:1927, 1 specified eight classes of lighting, and for each class specified a minimum illuminance, a minimum mounting height and maximum space-to-height ratio. This minimum illuminance was measured at the ‘test point’, defined as ‘that point on the ground within the area to be illuminated which is equidistant and as far as possible from the light sources which form one complete unit of the system’. This specification remained in the 1931 revision of the standard. 2
In the later 1930s the guidance changed, specifying the height and positions at which lanterns were to be mounted (and, within fairly wide limits, their power) rather than the result to be obtained. 3 This became known as the recipe method. At the same time, the number of lighting classes was reduced from eight to two, one for traffic routes and one for ‘other roads requiring lighting’, with mounting height being a clear distinction between the two. The recipe method was used in subsidiary roads for the next five decades. BS5489-3:1977 4 presented two lighting groups, B8 and B5/6, where ‘B’ indicated subsidiary roads and the numeral indicated mounting height. B8 was applied to district roads and B5/6 to residential roads. For each mounting height there was a specified minimum luminous flux for the lower hemisphere of the lantern. For each group there was a target spacing. For group B5/6 this was 34 m ± 10%. For group B8, the spacing varied according to road width. (See van Bommel and de Boer 5 for an example of the recipe method from British Standards Code of Practice 1004:1974 part 2.)
Average and minimum horizontal illuminances (lx) for subsidiary roads as recommended in British Standard 5489
This research note discusses the expression of ‘average’ illuminance.
2. Average illuminance
The need to determine an average illuminance requires assessment of illuminances across the lit surface. This is done by establishing the illuminance at each point in a regular grid across the lit surface. Illuminances at each point may be determined by calculation (for a proposed installation) or by measurement (for an existing installation): this research note concerns the calculation of average from the array of points and is applicable to calculated and measured values.
In BS 5489-3:1989 and BS 5489-3:1992 the grid extended lengthways from underneath one lamp post to under the next lamp post, with eleven equally spaced points. Across the width of the road the grid extended between the outer edges of carriageway or footpath on each side with a spacing between points of ‘not greater than 1 m’. Currently, EN 13201-3:2015 specifies (see Figure 14 in that document) a grid in which the boundary points are placed just within the illuminated area, by a half-unit of the spacing between points in the relevant direction. 13 Along the length of the road, there are 10 uniformly spaced points for lamp posts spaced at a distance of up to 30 m; for lamp posts spaced at more than 30 m, the number of calculation points is increased so that the spacing between points is ≤3 m. Across the width of the road, the spacing is determined as the smallest number of points which achieves a spacing between points of ≤1.5 m, with a requirement that there are at least three points.
In statistics, the average (or, central tendency) is defined as ‘a single value … that summarizes or represents the general significance of a set of unequal values’.
14
There are three types of average – mean, median and mode. They are determined using different methods, they are applicable to different types of data, and they may yield different estimates of the average. For a grid of n values, the determination methods are:
Arithmetic mean: the n individual values are summated and divided by n. Median: the n individual values are sorted into ascending order and the median is the middle value in this order (or, the mean of the two middle values where there are an even number of values). Mode: the most frequently appearing of the n individual values. The mode is usually applied to nominal variables and is not appropriate for road lighting illuminance.
The arithmetic mean is the most popular and well-known measure of central tendency and can be used with both discrete and continuous data. The arithmetic mean, however, has a disadvantage: it is susceptible to the influence of outliers. Outliers are values that are unusual compared to the rest of those in the data set, being especially small or large in magnitude. In contrast, the median is less affected by outliers. 15
Road lighting guidance documents tend to state only ‘average illuminance’ but not which type of average. It is probably widely considered that ‘average’ and ‘arithmetic mean’ are synonyms. The authors are aware of only two examples of the specific type of average being stated: ‘The average luminance shall be calculated as the
Average illuminances in thirty locations
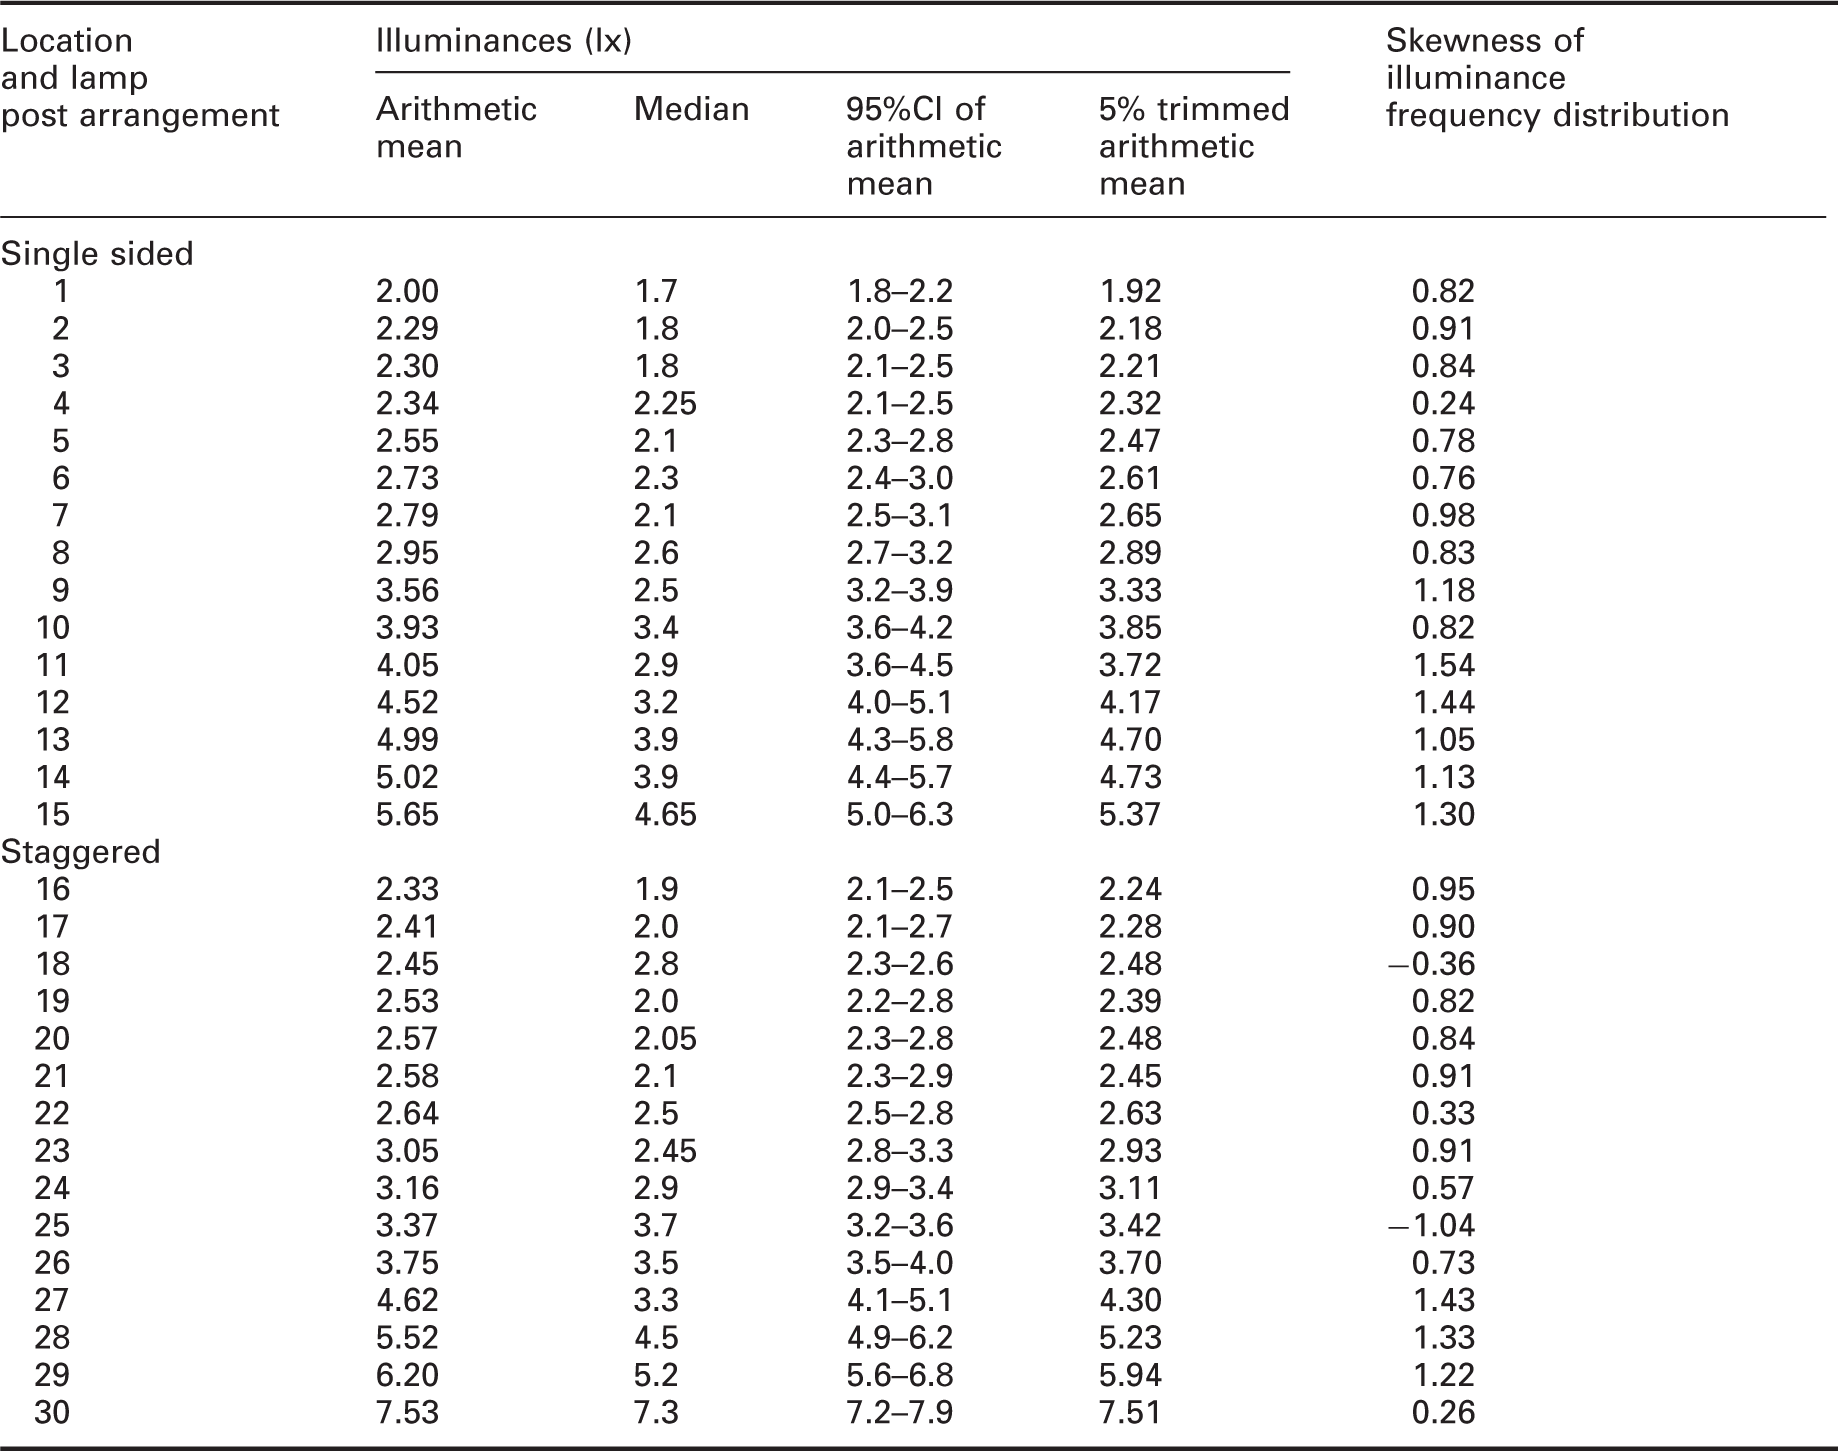
By strict definition, the arithmetic mean would be the appropriate measure of average illuminance if values in the array of illuminances were normally distributed. Normality was assessed using graphical (inspection of the frequency histogram and the box and whisker plot) and statistical methods (the Kolmogorov–Smirnov and Shapiro–Wilk tests). The frequency histograms of these data are uploaded as supplementary data: the skewness of each distribution is shown in Table 2. In most cases the histograms exhibit asymmetry, a clear positive skew: the skewness values in Table 2 exceed the rule of thumb18,19 for moderate skew (±0.5) in 25 of the 30 cases. In a normal distribution, the arithmetic mean and median coincide. We assessed this by checking whether the median illuminance fell within the 95% confidence interval (95% CI) of the arithmetic mean: the two averages coincide for only 5 of the 30 cases. It was concluded that the arrays of illuminance values were not drawn from normally distributed populations. Median illuminance is, therefore, the more appropriate measure of average.
As can be seen in Table 2, the median illuminance at a location is lower than the arithmetic mean illuminance in all but two cases (locations 18 and 25). The median illuminance tends to be lower than the mean illuminance by on average 16% (arithmetic mean; 18% median). The Wilcoxon signed-rank test suggests that the arithmetic mean and median illuminances are significantly different (Wilcoxon, n = 30, p < 0.001).
One reason why the arithmetic means are higher than the medians is the influence of outliers. The effect of outliers on the mean can be reduced by using instead the trimmed (or, truncated) mean. The 5% trimmed mean is that calculated after disregarding the lowest 5% and highest 5% of values in the distribution. Table 2 shows also the 5% trimmed arithmetic mean for each of the 30 locations. These tend to lie between the mean and median values – the 5% trimmed arithmetic mean is usually lower than the arithmetic mean. The Wilcoxon signed-ranks test suggests that the 5% trimmed arithmetic mean is significantly different to both the arithmetic mean (n = 30, p < 0.001) and the median illuminances (n = 30, p < 0.001).
Locations #18 and #25 are those for which the medians and trimmed mean values are higher than the arithmetic means. As expected, these are the (only) two locations with a negative skew (see Table 2) which suggests that in these locations the outlying values are extremely low rather than extremely high. In all locations the light sources were LED. Three types of lantern were used, with approximately equal frequency. Compared to the 10 other locations using the same lantern as #18 and #25, they differ only in luminous flux of the light source, with the LEDs at these two locations giving 800 lumens while the other sites had LEDs giving 1200 or 1600 lumens.
While these analyses suggest that the median is a more appropriate measure of average illuminance than is the arithmetic mean, there is a high degree of correlation (Spearman’s ρ = 0.93 n = 30, p < 0.001) between the mean and median illuminances (Figure 1). The relevance of this finding depends on the purpose of reporting the average and hence also the purpose of design guidance. If it is to indicate whether one location has more or less light than another location, in effect a rank order of light magnitude, then Figure 1 suggests that the arithmetic mean and median would lead to similar conclusions. If, instead, the purpose of guidance is to ensure there is enough light for the pedestrian on a subsidiary road to see what he or she needs to see, then it is the absolute values that matter. One approach is that, as the median is less than the arithmetic mean the use of the arithmetic mean should be avoided. An alternative approach is that the absolute values being recommended should use the same form of average as the data upon which ‘enough light for pedestrians to see’ was established.
Arithmetic mean illuminance plotted against median illuminance for the 30 locations of Table 2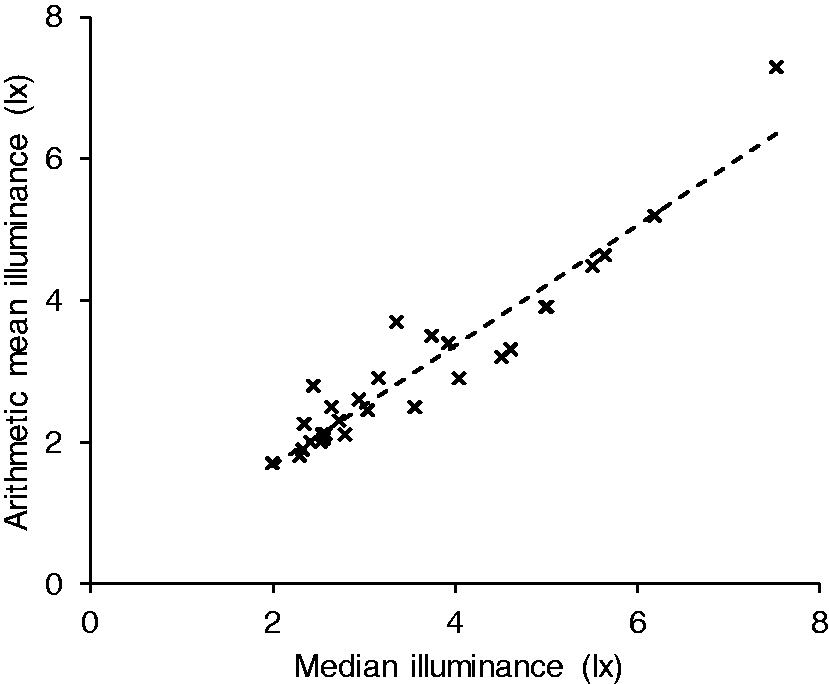
A problem might be found, therefore, if data behind recommendations were based on a study where average was defined by the median, with the subsequent recommendations stating only ‘average’ and end users assuming this to be the arithmetic mean. If design criteria are to continue using arithmetic mean then two requirements should be met. First, guidance should explicitly state that the average is the arithmetic mean so that calculations are consistent. Second, data upon which the recommended values are based should also report the arithmetic mean, so that evidence and recommendations are consistent.
3. Conclusion
The type of design criteria specified in the UK for P-class lighting has changed with successive revisions to guidance documents. Current documents specify average illuminance, but do not tend to state whether this should be the arithmetic mean, median, or some other type of average. An analysis of illuminances at thirty subsidiary road locations suggests the median would be more appropriate because the illuminances in the array are not normally distributed. However, the arithmetic mean and median are highly correlated which suggests the arithmetic mean is generally satisfactory if the aim is to rank roads by magnitude of illuminance. If recommendations are to continue assuming that the arithmetic mean is appropriate, then guidance should state “arithmetic mean” and not just “average”.
One caveat to this analysis is the limited representation of P-classes. Of the 30 locations in Table 2, when classified only according to the arithmetic mean illuminance, 15 are from P1, 10 from P2, four from P3 and one from P4. None of these locations represent classes P5 or P6 which recommend higher average illuminances (10 and 15 lux, respectively). While it is not expected that normality of the illuminance frequency distributions would vary for different P-classes it would be useful to confirm this expectation.
Supplemental Material
LRT911193 Supplemental Material - Supplemental material for Research Note: Describing average illuminance for P-class roads
Supplemental material, LRT911193 Supplemental Material for Research Note: Describing average illuminance for P-class roads by S Fotios PhD C Robbins PhD in Lighting Research & Technology
Footnotes
Acknowledgement
The sample installations used in this analysis were provided by Nick Smith Associates Ltd.
Declaration of conflicting interests
The authors declared no potential conflicts of interest with respect to the research, authorship, and/or publication of this article.
Funding
The authors disclosed receipt of the following financial support for the research, authorship, and/or publication of this article: This work was supported by the Engineering and Physical Sciences Research Council (EPSRC) grant reference EP/S004009/1.
Supplemental material
Supplemental material for this article is available online.
References
Supplementary Material
Please find the following supplemental material available below.
For Open Access articles published under a Creative Commons License, all supplemental material carries the same license as the article it is associated with.
For non-Open Access articles published, all supplemental material carries a non-exclusive license, and permission requests for re-use of supplemental material or any part of supplemental material shall be sent directly to the copyright owner as specified in the copyright notice associated with the article.