
Abstract
This study assesses the lighting requirements for operating theatres and the lighting conditions in a specific test case and proposes alternate ways of achieving a favourable visual environment. The hypothesis was that an increased illuminance level from general lighting and lower luminance contrasts between the essential task areas affect perceived lighting quality, visual ability and performance, as well as tiredness of medical staff performing surgical work. The investigation consisted of three parts: a laboratory study, followed by a field study and concluding with a retrospective study. In the laboratory study, each medical staff subject was exposed to four lighting scenarios with three illuminances from the operating light (12 lighting conditions), with no patients present. In the field and the retrospective study, the existing lighting scenario was compared to the highest-rated test lighting scenario (with illuminances more than double). The field study and the retrospective study took place with medical staff working under either the test general lighting condition or the existing general lighting condition. Increased illuminance from the general lighting and a higher correlated colour temperature did not improve the operating staff’s visual ability. However, medical staff rated the change in lighting quality resulting from the increased general illuminance as an improvement in the work environment, both in the laboratory study and in the field study. Medical staff subjects using the operating theatre rated both perceived visual ability and lighting quality higher under the test lighting scenario. Tiredness was also rated lower under that test scenario. Based on the results from this study, general lighting levels of 2000 lx in the periphery of the operating room, 4000 lx surrounding the operating table and 5500 lx on the operating table are recommended by the authors. With reference to the selections made by the surgeons for the illuminance in the operating cavity, it is suggested that the central beam illuminance from the surgical luminaires be between 50,000 lx and 100,000 lx.
1. Introduction
The visual conditions in an operating theatre/operating room/surgical suite are essential for adequate work performance of clinical staff and absolutely critical for patient safety. It is common that the illuminance level varies greatly across the operating theatre space, causing large luminance contrasts between the centre beam of the surgical luminaire, the lighting in the operating area and the general lighting of the operating theatre. The surgical luminaire provides very high levels of illuminance, likely causing adaptation problems when looking at a point outside the operating luminaire area, where light levels will typically be much lower. 1 A high luminance ratio can cause visual problems and affect the visual ability and performance 2 of operating staff, increasing the chance of making mistakes during surgical procedures.
This study assesses the lighting requirements for operating theatres and the lighting conditions in a specific test case and proposes alternative ways of achieving a favourable visual environment. To the authors’ knowledge, this is the first study that examines the visual environment for open surgery in operating theatres.
1.1 Standards and recommendations
International and national standards include recommendations that general lighting in operating theatres should be at least 1000 lx.3–6 Higher illuminance levels are required around the operating table. According to SS-EN 60601-2-41, 7 the operating lights or surgical luminaires should provide a minimum central beam illuminance of 40,000 lx and a maximum of 160,000 lx at a 1-metre distance between the surgical luminaire and the operating cavity. However, when the surgeon needs to look at X-rays, for example, the general lighting must be dimmed to 50 lx. 5
According to the Illuminating Engineering Society of North America’s (IESNA) lighting recommendations for hospitals and healthcare facilities, 4 the luminance ratios should not be greater than 3:1 between the operating cavity and the surrounding operating field, and no greater than 5:1 between the operating cavity and the instrument table. The light output from the surgical luminaire should provide at least 25,000 lx directed as a light beam, in a 0.20 m diameter circular pattern on the operating table (operating light area – OLA). The surgical luminaire should have a correlated colour temperature (CCT) between 3500 K and 6700 K, and the general lighting should be kept as close as possible to the selected CCT. The Lighting Handbook 3 provides lighting recommendations for different age groups. The general lighting in an operating theatre should be 1000 lx for an individual under 25 years, 2000 lx for an individual between 25 years and 65 years, and 4000 lx for an individual over 65 years. The operating table lighting should be 1500 lx for an individual younger than 25 years, 3000 lx for an individual between 25 and 65 years, and 6000 lx for an individual over 65 years. A German standard 6 states that the lighting in the areas surrounding the operating table, 3 m × 3 m, should be higher than the general lighting. No references to any studies that investigate operating room lighting have been found to support these recommendations.
The illumination recommendations in the European lighting standards 5 for an operating theatre do not fulfil the recommendations for a low luminance ratio, and can therefore contribute to causing adaptation problems or glare and affect visual ability. Even though the luminance ratio is discussed in some recommendations, such as the North American standards, 4 anecdotal evidence suggests that it is seldom implemented in real environments.
1.2 Surgical work
The work of surgeons and scrub nurses is visually demanding when working at the operating cavity. Surgeons mainly look into the bright operating cavity and their eyes are adapted to that luminance, but scrub nurses have to adjust between the high luminance in the operating cavity and the lower luminances at the instrument tray and other areas in the operating theatre. This means that their vision needs to adjust to very different levels of luminance throughout the surgical procedure. Surgeons and assistants who have visual problems can make serious mistakes. 8 The main work tasks of the anaesthetist nurse are to look at the monitors for information, check the patient’s vital signs (such as cyanosis), and administer medications. The circulating nurse assists the other personnel, which sometimes involves very visually demanding work tasks. Operating theatres often have no windows and thus no daylight. People working there may experience tiredness and reduced cognitive performance due to the lack of daylight, especially during long surgical procedures. 9
The illuminance needed in the operating cavity for different types of surgical procedures depends on the procedure as well as the illuminance in the surrounding areas of the room and the operator’s subjective requirements. When the lighting is perceived to be inadequate, the first reaction is usually to increase the illuminance levels: ‘the more – the better’. 10 Typically, in an operating theatre, there is a great difference between the luminances found at the operating cavity and those resulting from the general lighting. Surgery requires a high level of intellectual preparation, an efficient and controlled workspace, fine motor skills, physical endurance, problem-solving skills and emergency response skills. 8
The surgical luminaire should have a light beam that provides parallel light with a high luminous intensity (cd) to produce sharp shadows and facilitate depth perception. 11 Surgical luminaires usually provide very high amounts of illuminance and high luminance ratios between the operating field and the immediate surrounding areas and the periphery of the room. Luminance ratios that are too high will likely result in discomfort or disability glare and cause visual fatigue due to the continuous re-adaptation of the eyes, and this can result in lower productivity.5,12 In one study, the average diameter of the operating light beam was 0.15 m, 13 resulting in a small, highly illuminated circle of light with sharp borders to the surrounding areas with lower illuminance levels. The mean illuminance level from the operating luminaires was 100,000 lx. The luminance ratio within the visual field was 140:9:1 (operating luminaire: immediate surrounding areas: periphery of the room). 13 No study has been found that presents data concerning the amount of illuminance from the surgical luminaires that are actually used during open surgery.
1.3 Glare and eyestrain
According to Veitch, 14 an increase in illuminance within relevant ranges to fulfil recommendations from standards will often result in improved visual performance. It is desirable to have a uniform illuminance over the entire working area. A luminance ratio that is too high will generate discomfort or disability glare and cause visual fatigue due to the continuous re-adaptation of the eyes. 3 Glare causes eye fatigue that affects visual ability and productivity. 12 There is a correlation between eyestrain and wellbeing; when eyestrain is reported, wellbeing is reported to be lower. 15
Disability or discomfort glare experienced during surgical procedures will likely reduce a person’s contrast visual acuity when adapting to lower or higher luminances, 16 but it takes longer to adapt to a lower surrounding luminance. The exact mechanisms behind retinal adaptation to luminance and contrast are still uncertain. 17 The adaptation to contrast seems to go through the photoreceptor inputs and the ganglion cells.18,19 Laming 20 states that the fast onset of contrast adaptation is mainly observed in the ganglion cells, which have a higher sensitivity to cooler light. With higher illuminances, the rhodopsin of the rod photoreceptors in the retina will be bleached. When they are saturated, the neural response decreases and through differential coupling, the signals will still go through but with a decreased sensitivity (i.e. an adaptation to that luminance). 20 With age comes an increased need for light and a higher sensitivity to glare. Due to a decreased ability to adjust quickly to lower luminances, an ageing surgeon may be negatively affected by a too high luminance ratio. However, such effects may be offset by increased competence and operative skills that can positively affect patient outcomes. 21 Surgeons often use headlamps to enhance the illuminance in the visual field. 13 However, this can lead to an increased risk for musculoskeletal strain (due to the extra weight of the headlamp) and deterioration of the visual scenario for the assistants when the surgeons move their heads.
Individuals that report eyestrain usually report two to three times more musculoskeletal strain. 15 If the visual environment is well-designed, the eyestrain and musculoskeletal strain are reduced.15,22,23
1.4 Correlated colour temperature and alertness
It has been established that humans can experience altered alertness when exposed to light via the photosensitive retinal ganglion cells. 24 Daylight or other light with shorter wavelengths (blue, cool light) can affect human alertness. 16 Cooler light in the morning can positively affect our alertness and performance. 25 Depending on the time of day, we are affected by the different wavelengths of the light. 26 Red light is a stronger alerting stimulus in the afternoon than blue light. 27 Higher illuminance levels can also positively affect alertness during daytime hours. 28 Our alertness during the day and ability to sleep at night are affected by the amount of circadian stimulus that each individual receives during the day. 27 According to Hartstein et al., 29 people improve their ability to maintain attention and transition between tasks (more positively so for females) when exposed to a higher CCT. Even though we may experience an increased alertness at higher CCT, the cooler light at more than 5000 K is often rated less positively. A cooler light, on the other hand, may facilitate the ability of the anaesthesia personnel to identify the blueness of the patient’s face and lips present in cyanosis.
1.5 Aim of study
The first aim of this three-part study was to investigate if an altered general lighting with a higher illuminance and lower luminance ratio had a positive effect on visual ability, perceived lighting quality and perceived tiredness in operating theatres, compared to the general lighting that currently complies with European recommendations.
A secondary aim was to analyse the effects of adaptation to three different illuminance levels from the surgical luminaire (35,000 lx, 65,000 lx, 100,000 lx) in different general lighting scenarios.
In addition, the study should bring clarity with respect to the actual levels of illuminance used by surgeons during surgical procedures. As discussed previously, the standards state that the operating luminaires should result in illuminance levels between 40,000 lx and 160,000 lx in the OLA. It is suspected that the upper limit provided by the standards might be too high for producing favourable lighting conditions for surgical procedures.
The hypotheses for the study were:
An increase in illuminance on the operating table, i.e. outside of the OLA, reduces luminance ratios on the operating table and increases visibility. An increase in illuminance for the general lighting in the operating room increases alertness levels. The adaptation process when shifting view from the high illuminance levels of the OLA to other areas of the operating theatre outside the operating field affects visual ability negatively.
Laboratory study: The illuminance values presented below are rounded to the nearest 50 lx or 100 lx
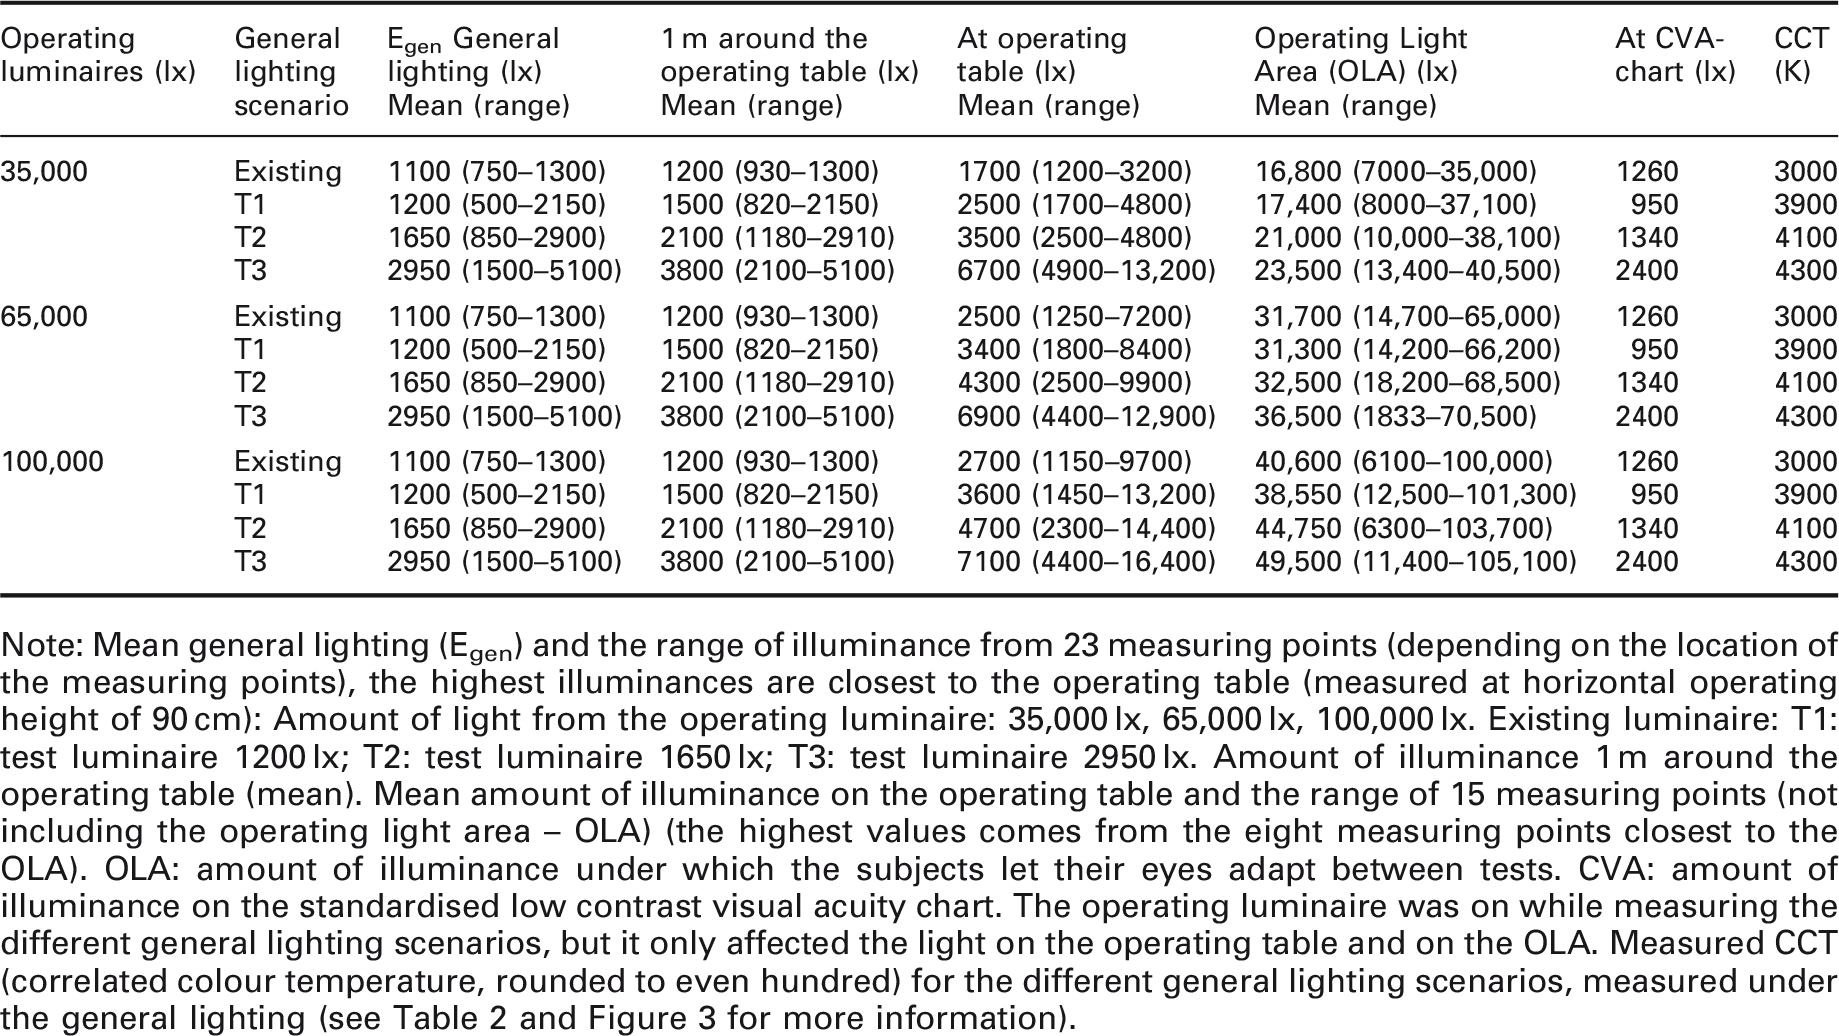
Note: Mean general lighting (Egen) and the range of illuminance from 23 measuring points (depending on the location of the measuring points), the highest illuminances are closest to the operating table (measured at horizontal operating height of 90 cm): Amount of light from the operating luminaire: 35,000 lx, 65,000 lx, 100,000 lx. Existing luminaire: T1: test luminaire 1200 lx; T2: test luminaire 1650 lx; T3: test luminaire 2950 lx. Amount of illuminance 1 m around the operating table (mean). Mean amount of illuminance on the operating table and the range of 15 measuring points (not including the operating light area – OLA) (the highest values comes from the eight measuring points closest to the OLA). OLA: amount of illuminance under which the subjects let their eyes adapt between tests. CVA: amount of illuminance on the standardised low contrast visual acuity chart. The operating luminaire was on while measuring the different general lighting scenarios, but it only affected the light on the operating table and on the OLA. Measured CCT (correlated colour temperature, rounded to even hundred) for the different general lighting scenarios, measured under the general lighting (see Table 2 and Figure 3 for more information).
2. Method
2.1 Overview
This study was divided into three parts: a laboratory study, a field study and a retrospective study (see Figure 1). All parts were performed in the same operating theatre at a hospital in southern Sweden. The lighting scenarios studied were the pre-existing lighting and different test lighting. The pre-existing lighting scenario will be referred to as ‘existing’ lighting scenario. The operating theatre had no access to daylight.
Flow chart of the main factors in the three included studies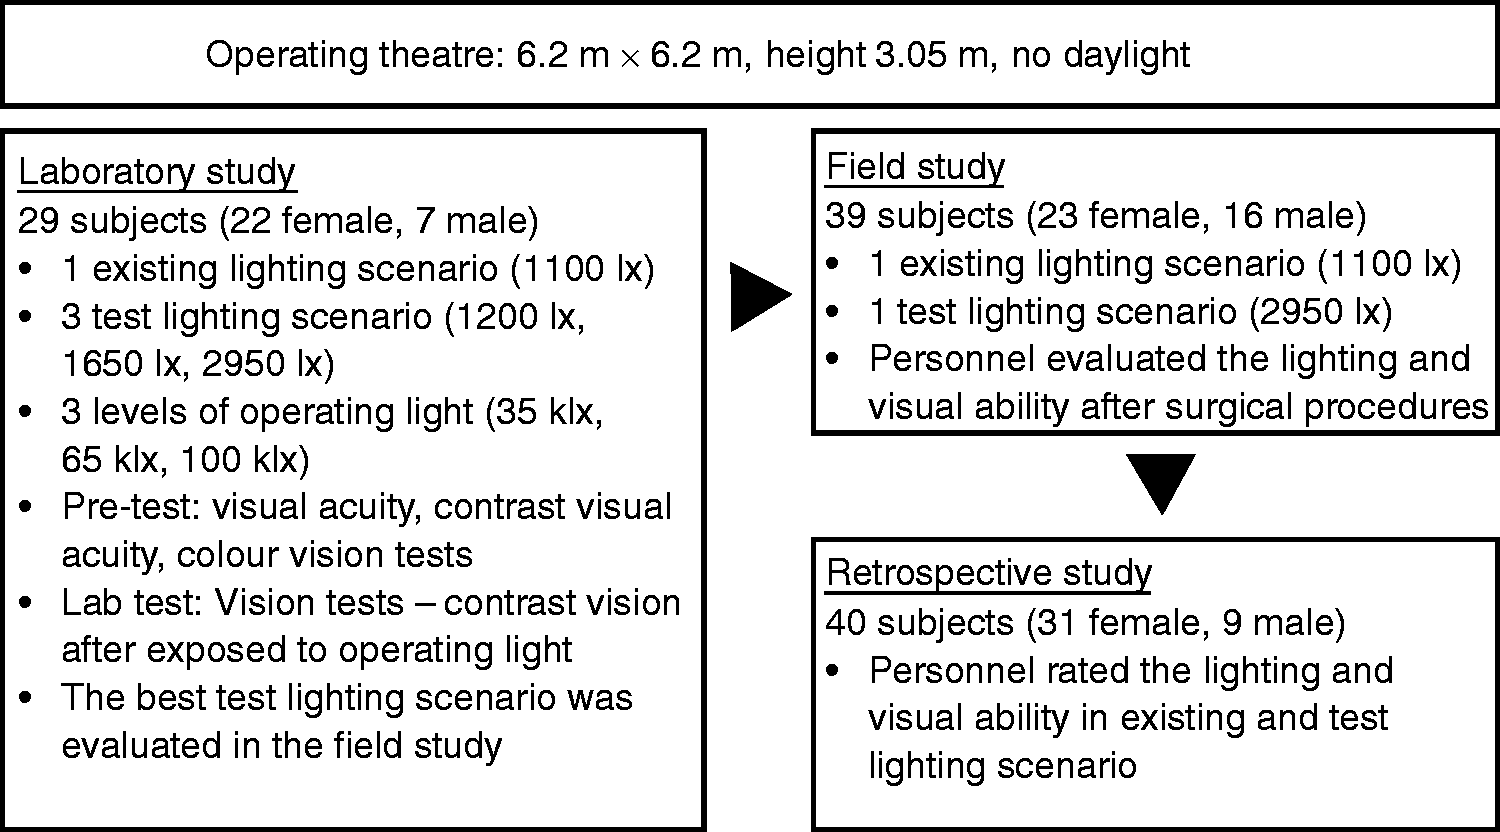
Prior to the actual studies, all subjects in the laboratory study were tested for visual acuity, contrast visual acuity and colour vision. The subjects’ task in the laboratory study was to compare the existing general lighting scenario (which is typical, representative and in line with standards) with three general lighting test scenarios at three different operating luminaire illuminance levels (low, medium, high) without patients. The subjects carried out visual ability, i.e. visual contrast acuity tests, in the 12 different lighting scenarios presented to them in random order. They were also asked to rate the perceived lighting quality for each of the 12 lighting scenarios. The purpose was to come up with the best of the three general lighting test scenarios that could then be compared to the existing one in a field study in the operating theatre with patients.
In the field study, the general lighting was altered so that only two lighting scenarios could be used: the existing general lighting and the best-test general lighting. The subjects rated their experience of the lighting quality, their visual ability and tiredness in open surgical procedures over five months using both the existing and the test lighting scenarios.
In the retrospective study, performed during a morning operating staff meeting, subjects rated their experience of the two different lighting scenarios.
The study was conducted in accordance with the Declaration of Helsinki and approved by the Regional Ethical Review Board in Lund, Sweden (2013/2).
2.2 General lighting in operating theatre: Existing and test scenarios
This study was performed in an operating theatre with no access to daylight. The operating theatre had a floor plan of 6.2 m × 6.2 m and a room height of 3.05 m and was used for general surgery, urology and gynaecology procedures, on weekdays as well as emergency surgical procedures.
The general lighting consisted of two different sets of luminaires: existing and test (Figure 2). The existing general lighting consisted of 12 fluorescent luminaires mounted directly onto the ceiling and fitted with two T5 fluorescent lighting tubes (28 W 830 [CCT 3000 K]) with high frequency electronic ballasts.
Luminaire placements for the laboratory and field study. The approximate placement of the general lighting: Existing – figure to the left (luminaires shown in black), Test – figure to the right (luminaires shown in grey with black edges). Other surgical equipment: operating luminaires (round circle), operating table (light grey rectangle), and anaesthesia equipment (chequered rectangle). The measuring points for illuminance and luminance are shown with an ‘x’ in the illustration. For additional measuring points at the operating table see Figure 3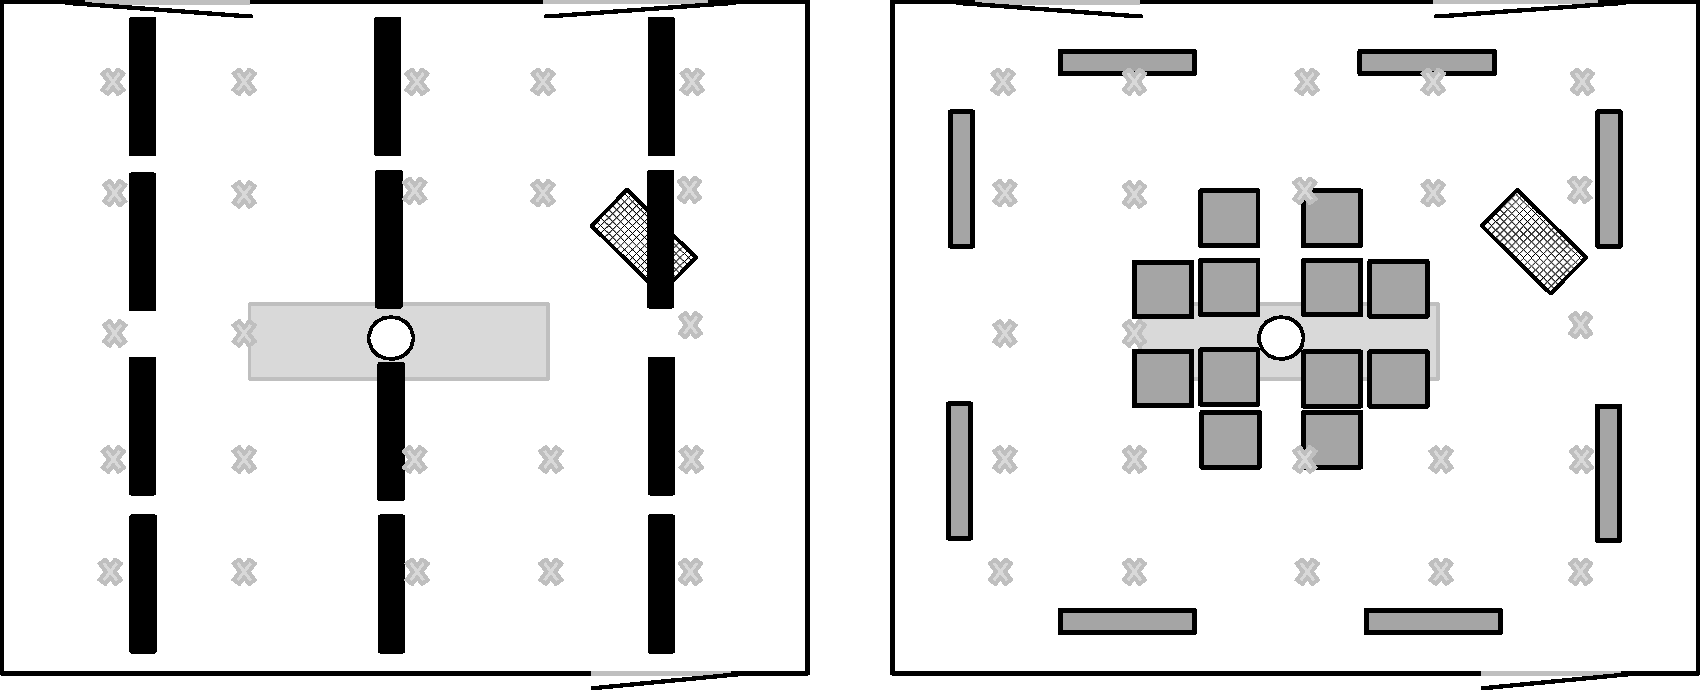
The test general lighting mounted in the operating theatre consisted of 12 square luminaire panels (0.6 m × 0.6 m) with 96 W 940 (CCT 4000 K) and 965 (CCT 6500 K) T5 fluorescent tubes (3910 lm) each around the centre of the operating table, and eight luminaires with two 112 W 840 (CCT 4000 K) T5 fluorescent tubes (8850 lm) each along the walls. All test luminaires could be dimmed and programmed to specified illuminance levels, and the eight luminaires along the walls could also be programmed to a CCT between 4000 K and 6500 K. The two operating luminaires were X6 marLux from KLS Martin Group fitted with halogen and xenon light sources, providing a maximum of 150,000 lx and having a CCT of 4300 K. They were mounted in the ceiling in the middle of the room (Figure 3).
Laboratory study setup in the operating theatre. The subjects stand next to the operating table.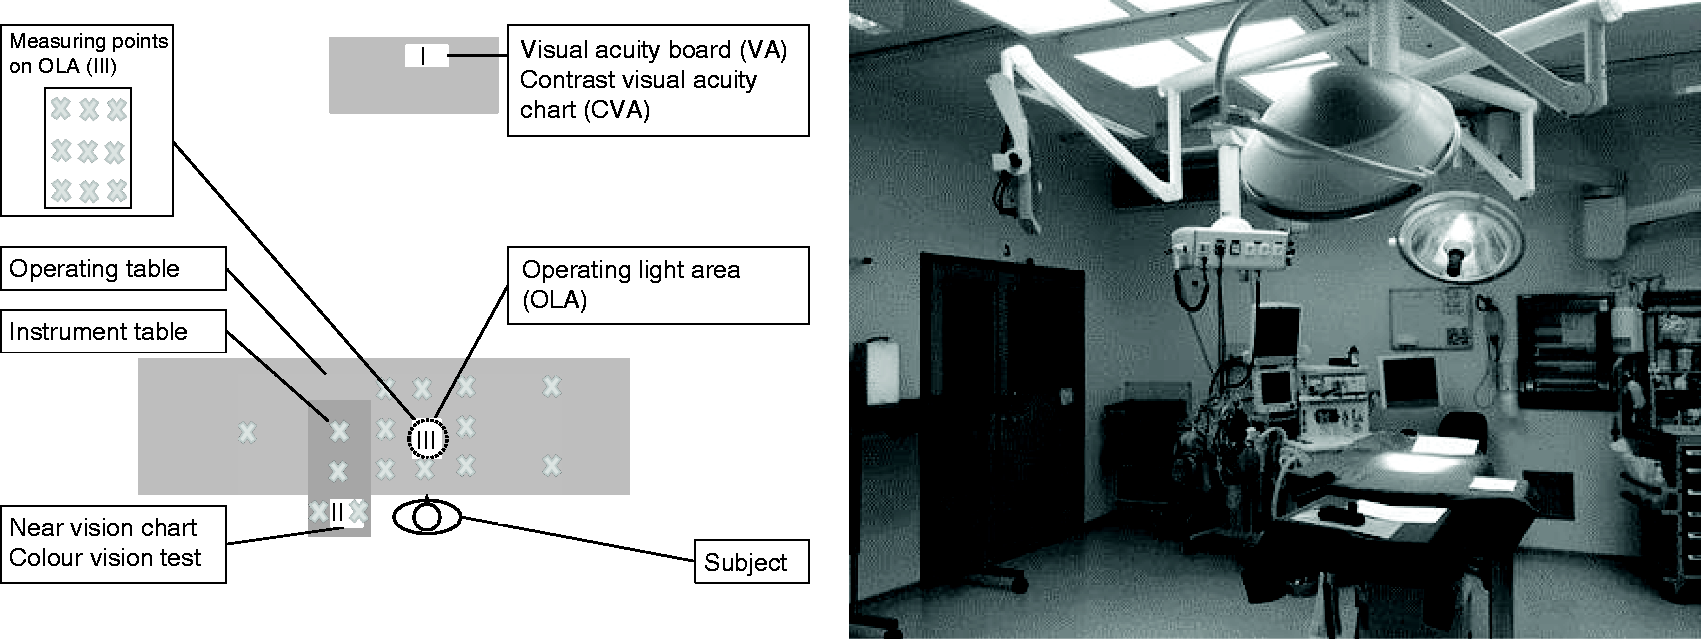
Laboratory study
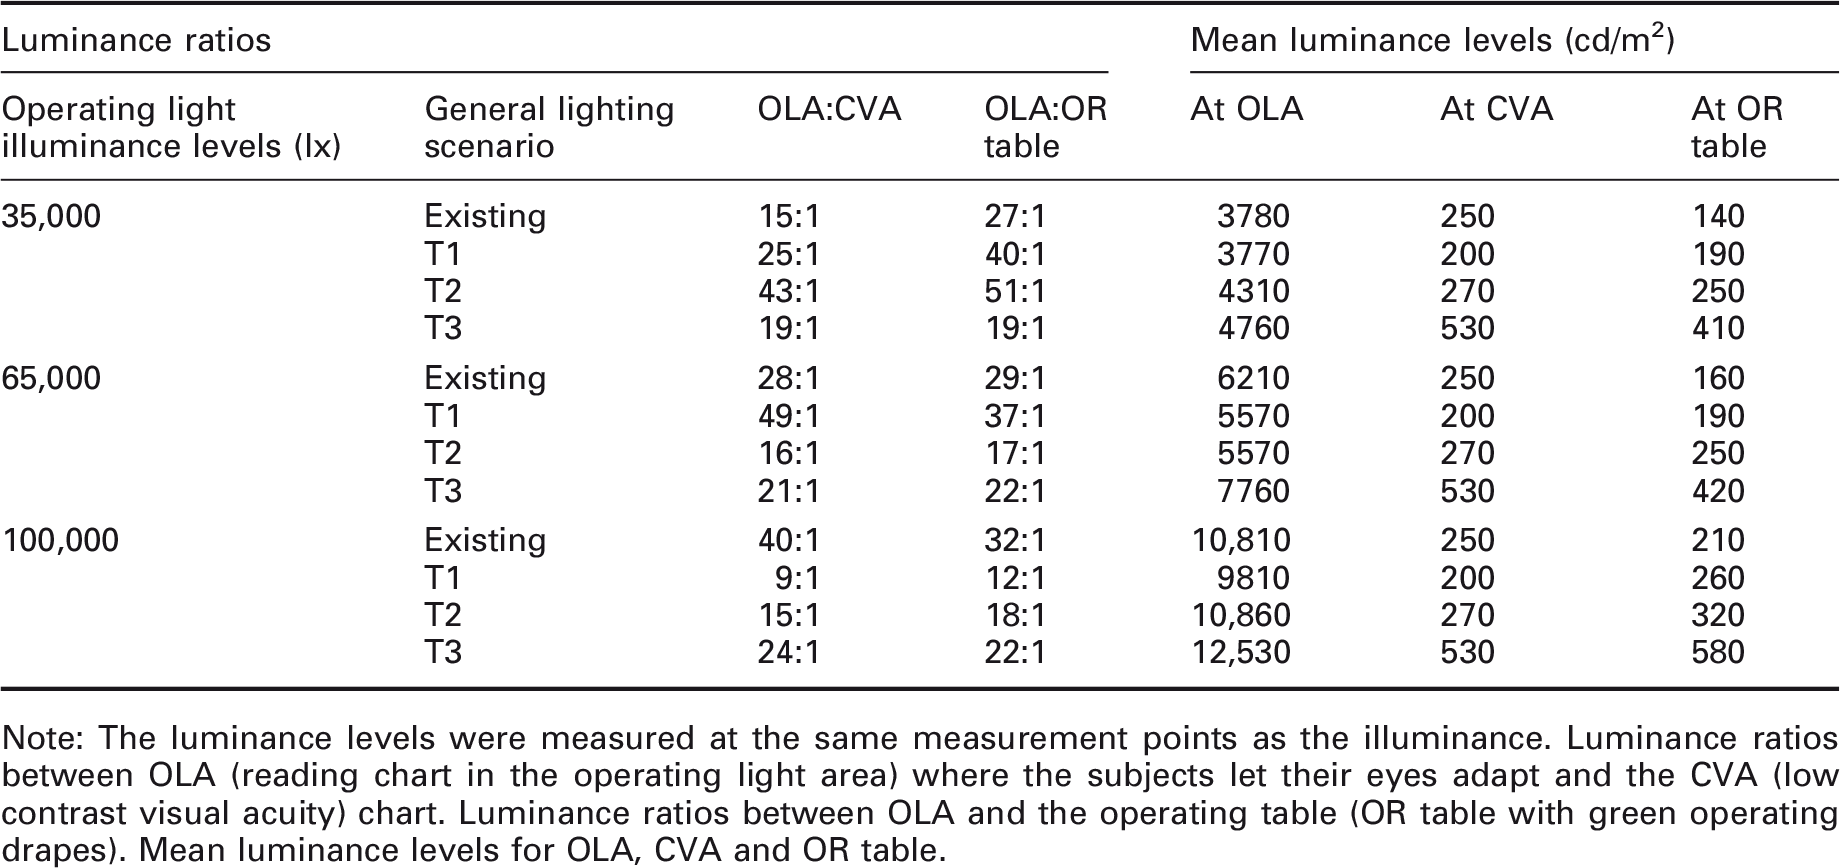
Note: The luminance levels were measured at the same measurement points as the illuminance. Luminance ratios between OLA (reading chart in the operating light area) where the subjects let their eyes adapt and the CVA (low contrast visual acuity) chart. Luminance ratios between OLA and the operating table (OR table with green operating drapes). Mean luminance levels for OLA, CVA and OR table.
2.3 Subjects
2.3.1 Laboratory subjects
Due to the specific environment in the operating department, the subjects were recruited from personnel at the department or medical students who were accustomed to the atmosphere in an operating room. Fifteen subjects were students. There were a total of 29 subjects: 22 females and 7 males. The mean age was 39 years (23–65) for the entire group, 52 years (36–65) for the operating staff, and 25 years (23–32) for the medical students.
All subjects had a minimum binocular visual acuity of 1.0 (1.0–1.6), with correction if needed, and could read the smallest text on the reading chart (J1-2, 5 p), with correction if needed. Only one of the male students had problems with the colour vision test due to a colour deficiency. One subject originally recruited for the study could not read anything on the contrast visual acuity test and was therefore excluded from the study, resulting in the previously mentioned total of 29 subjects.
A visual ergonomics questionnaire that was modified to match the operating personnel’s work was administered to all participants. It was similar to the questionnaire used in a now validated Visual Ergonomics Risk Assessment Method, named VERAM,30,31 including eyestrain symptoms such as tired eyes, light sensitivity and pain from the eyes.
2.3.2 Field study subjects
A total of 303 questionnaires was completed after a surgical procedure by 114 participants (some answered the questionnaires more than once after different surgical procedures. Of these participants, 39 answered questionnaires in both lighting scenarios. Since each participant served as his/her own control, the remaining participants were excluded from the study. The final total number of respondents consisted of: 12 surgeons (mean age 39 years (29–40); 3 female, 9 male); 11 anaesthetist nurses (mean age 41 years, SD 28–66; 4 female, 7 male); 11 scrub nurses (mean age 47 years (40–55); 11 female); and 5 circulating nurses (mean age 51 (43–64); 5 female). If a participant answered the questionnaire more than once, a mean was calculated for the answers to these questions.
Tasks in laboratory study: Order of the setting was counter-balanced according to a pre-set schedule. The experimental setting refers to different levels of the operating light, (a) 35,000 lx, (b) 65,000 lx, (c) 100,000 lx, and (d) was the same setting as the first experiment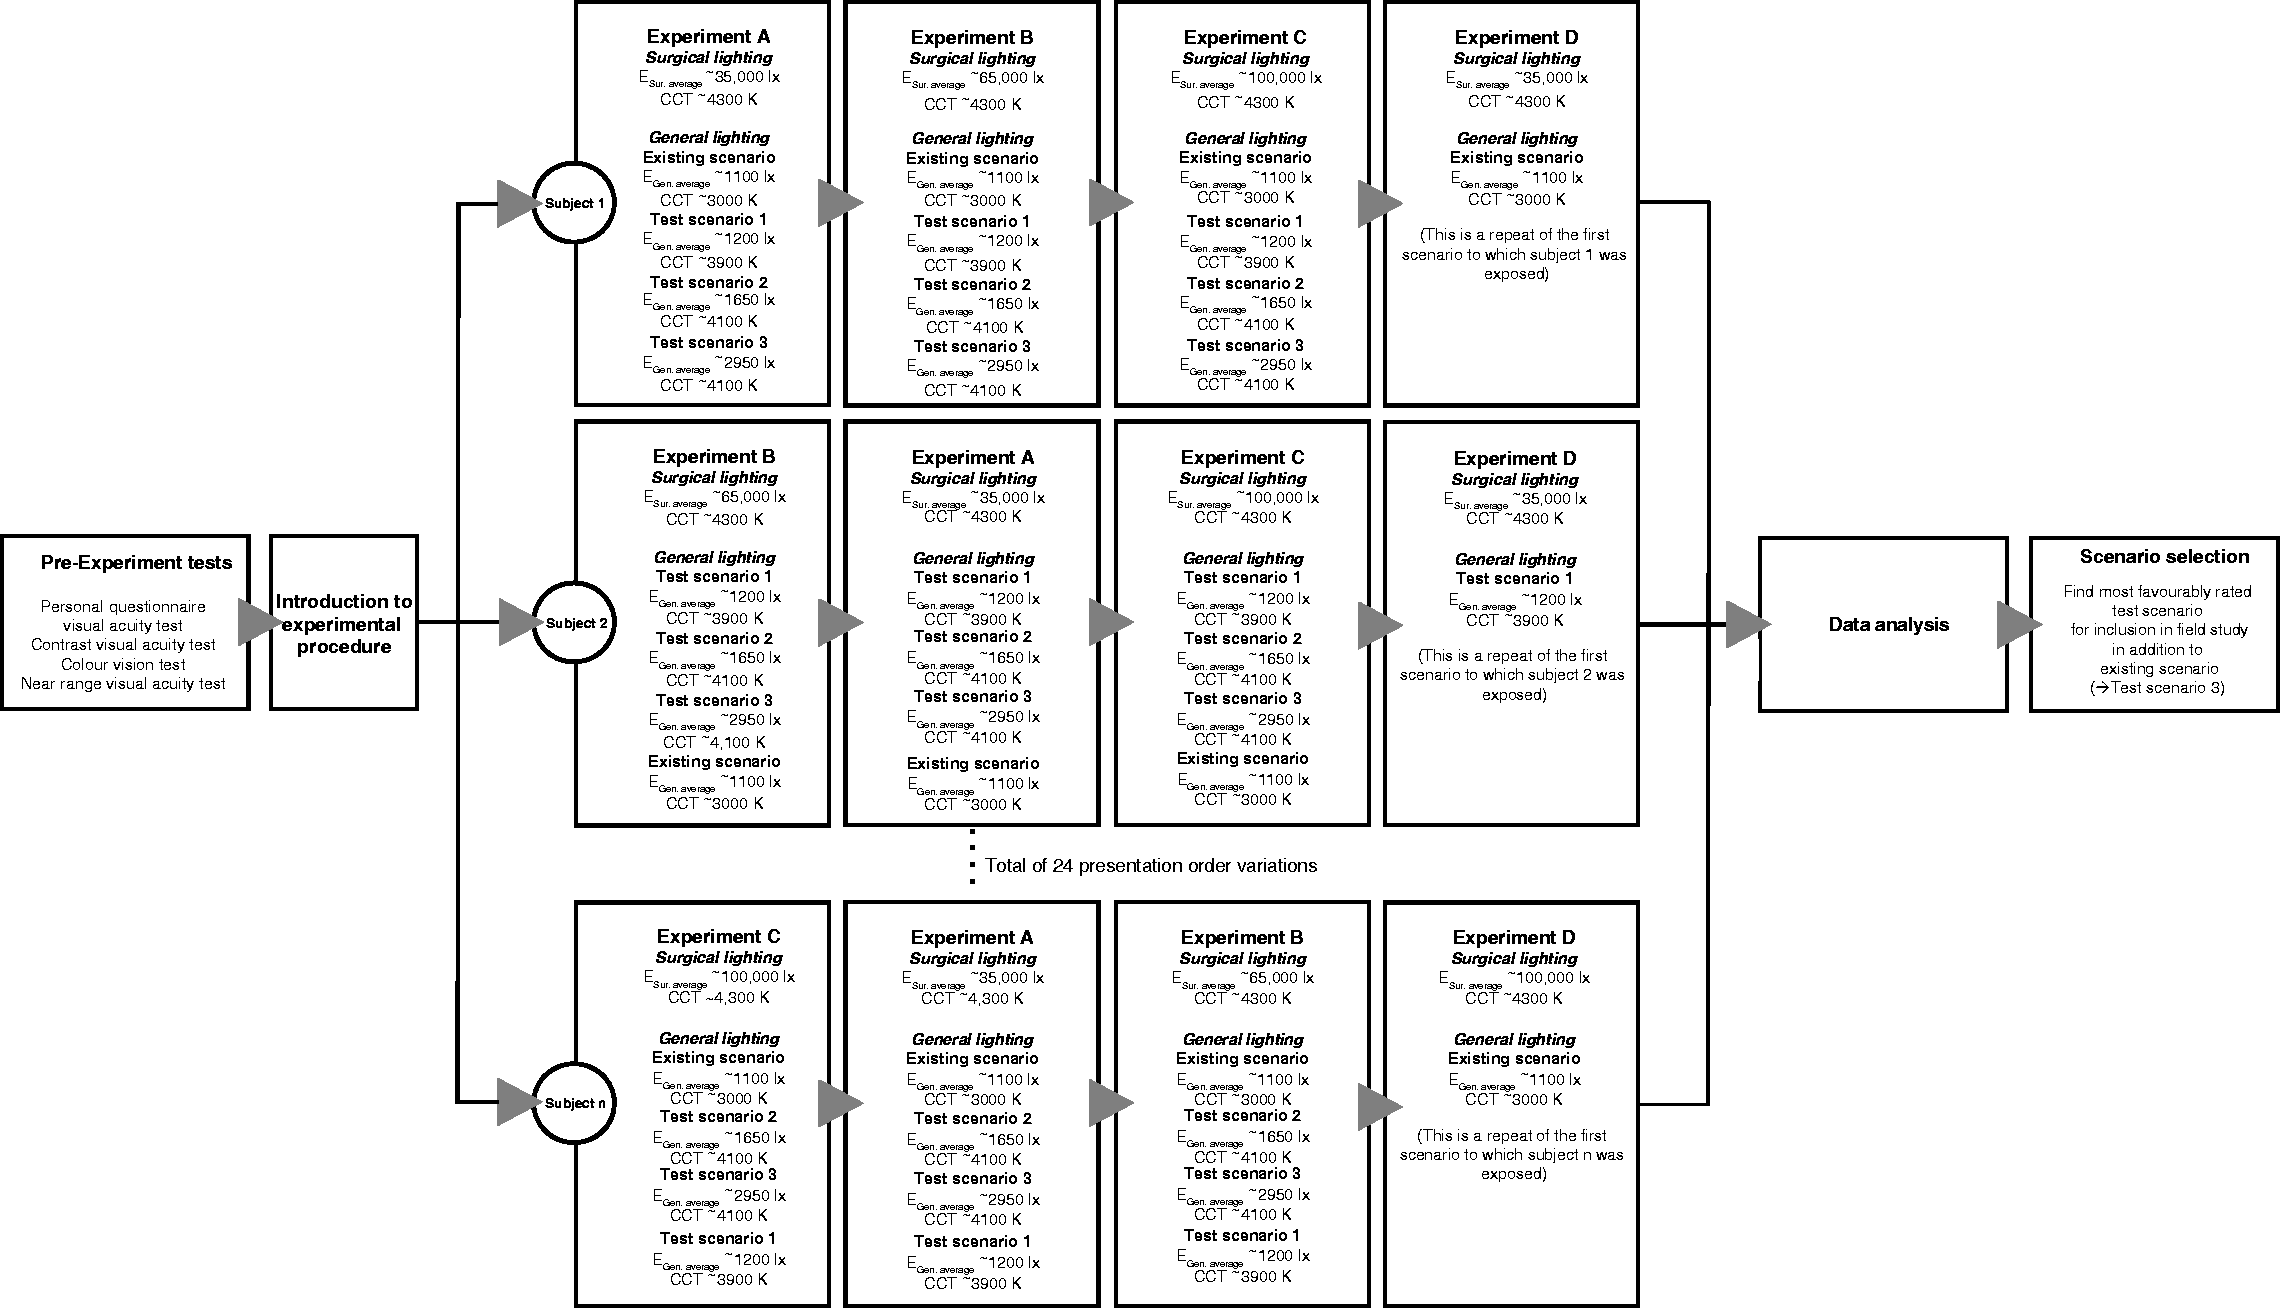
2.3.3 Retrospective study subjects
In the retrospective study, a questionnaire similar to the one used for the field study was distributed at a morning meeting with all personnel present that day for a retrospective session (n = 40) as a supplement to the field study. The personnel that had worked in both the existing and the test lighting scenarios at some time during the five months field study answered the questionnaire. Forty individuals (mean age 47 (28–64); 31 female, 9 male) rated their experience from both the existing and the test lighting scenarios. They rated the perceived quality of the general lighting and their perceived visual ability on VASs ranging from very bad to very good. They also rated the perceived colour temperature of the light from very warm to very cold (Figure 8).
2.4 Laboratory study
2.4.1 Laboratory study set-up
The test luminaires were programmed to three different illuminance levels. Together with the existing luminaires in the operating room, this resulted in four different types of general lighting scenarios: three test scenarios and one existing scenario. Each of these was combined with three different illuminance levels from the operating luminaires: 35,000 lx, 65,000 lx and 100,000 lx. This resulted in 12 different lighting scenarios (Table 1).
The illuminance level for the general lighting in the operating theatre in the laboratory study was calculated as the mean illuminance of the 23 measuring points. The illuminance level for 1 m around the operating table was calculated as the mean illuminance of the eight measuring points surrounding the operating table (out of the 23). The illuminance level for the operating table was the mean illuminance level for the 15 measuring points on the operating table (2 m × 0.5 m), out of which eight were around the operating luminaire area (OLA, see Figure 3), four on the instrument table and the last two on each end of the operating table. There were an additional nine measuring points on the OLA reading chart (0.15 m × 0.24 m). The mean illuminance is shown in Table 1.
The luminance for the different lighting scenarios was measured on a white paper or directed at the laboratory setup (green operating drapes, the reading test in the OLA and the Contrast Visual Acuity chart (CVA). The diameter of the surgical light beam in the OLA was adjusted so that it more or less covered the width of a standardised reading test to which the subjects were adapting their eyes (about 15–20 cm in diameter depending on the illuminance: the higher the illuminance, the smaller the diameter). The surgical luminaire was adjusted to three different illuminance levels of 35,000 lx, 65,000 lx and 100,000 lx (see Tables 1 and 2 for more information), measured in the centre of the OLA.
2.4.2 Laboratory experiment
The experiment procedure took about 2 hours to perform with each subject and was video-recorded as a backup. The operating table and the instrument table were covered with green operating drapes with a reflectance of 0.39 (measured with a NCS colour meter, X-rite model RM200) that corresponds to about a luminous reflectance factor of about 19 according to NCS Lightness meter. An instrument table was positioned across the operating table to the left of the participant who was standing at the operating table (Figures 2 and 3).
The operating table height and distance to the surgical lamp were standardised by setting the operating table at elbow height and then placing the operating luminaire at approximately the same distance to the operating table (circa 1 m). The reading distance was also measured and averaged to 57 cm.
A pre-test was performed to ensure that the subjects’ visual ability was sufficient for participation in the study (visual acuity 1.0 and contrast visual acuity 0.4), and all of the subjects performed a pre-test with a visual screening in the existing lighting scenario (see Figures 3 to 5):
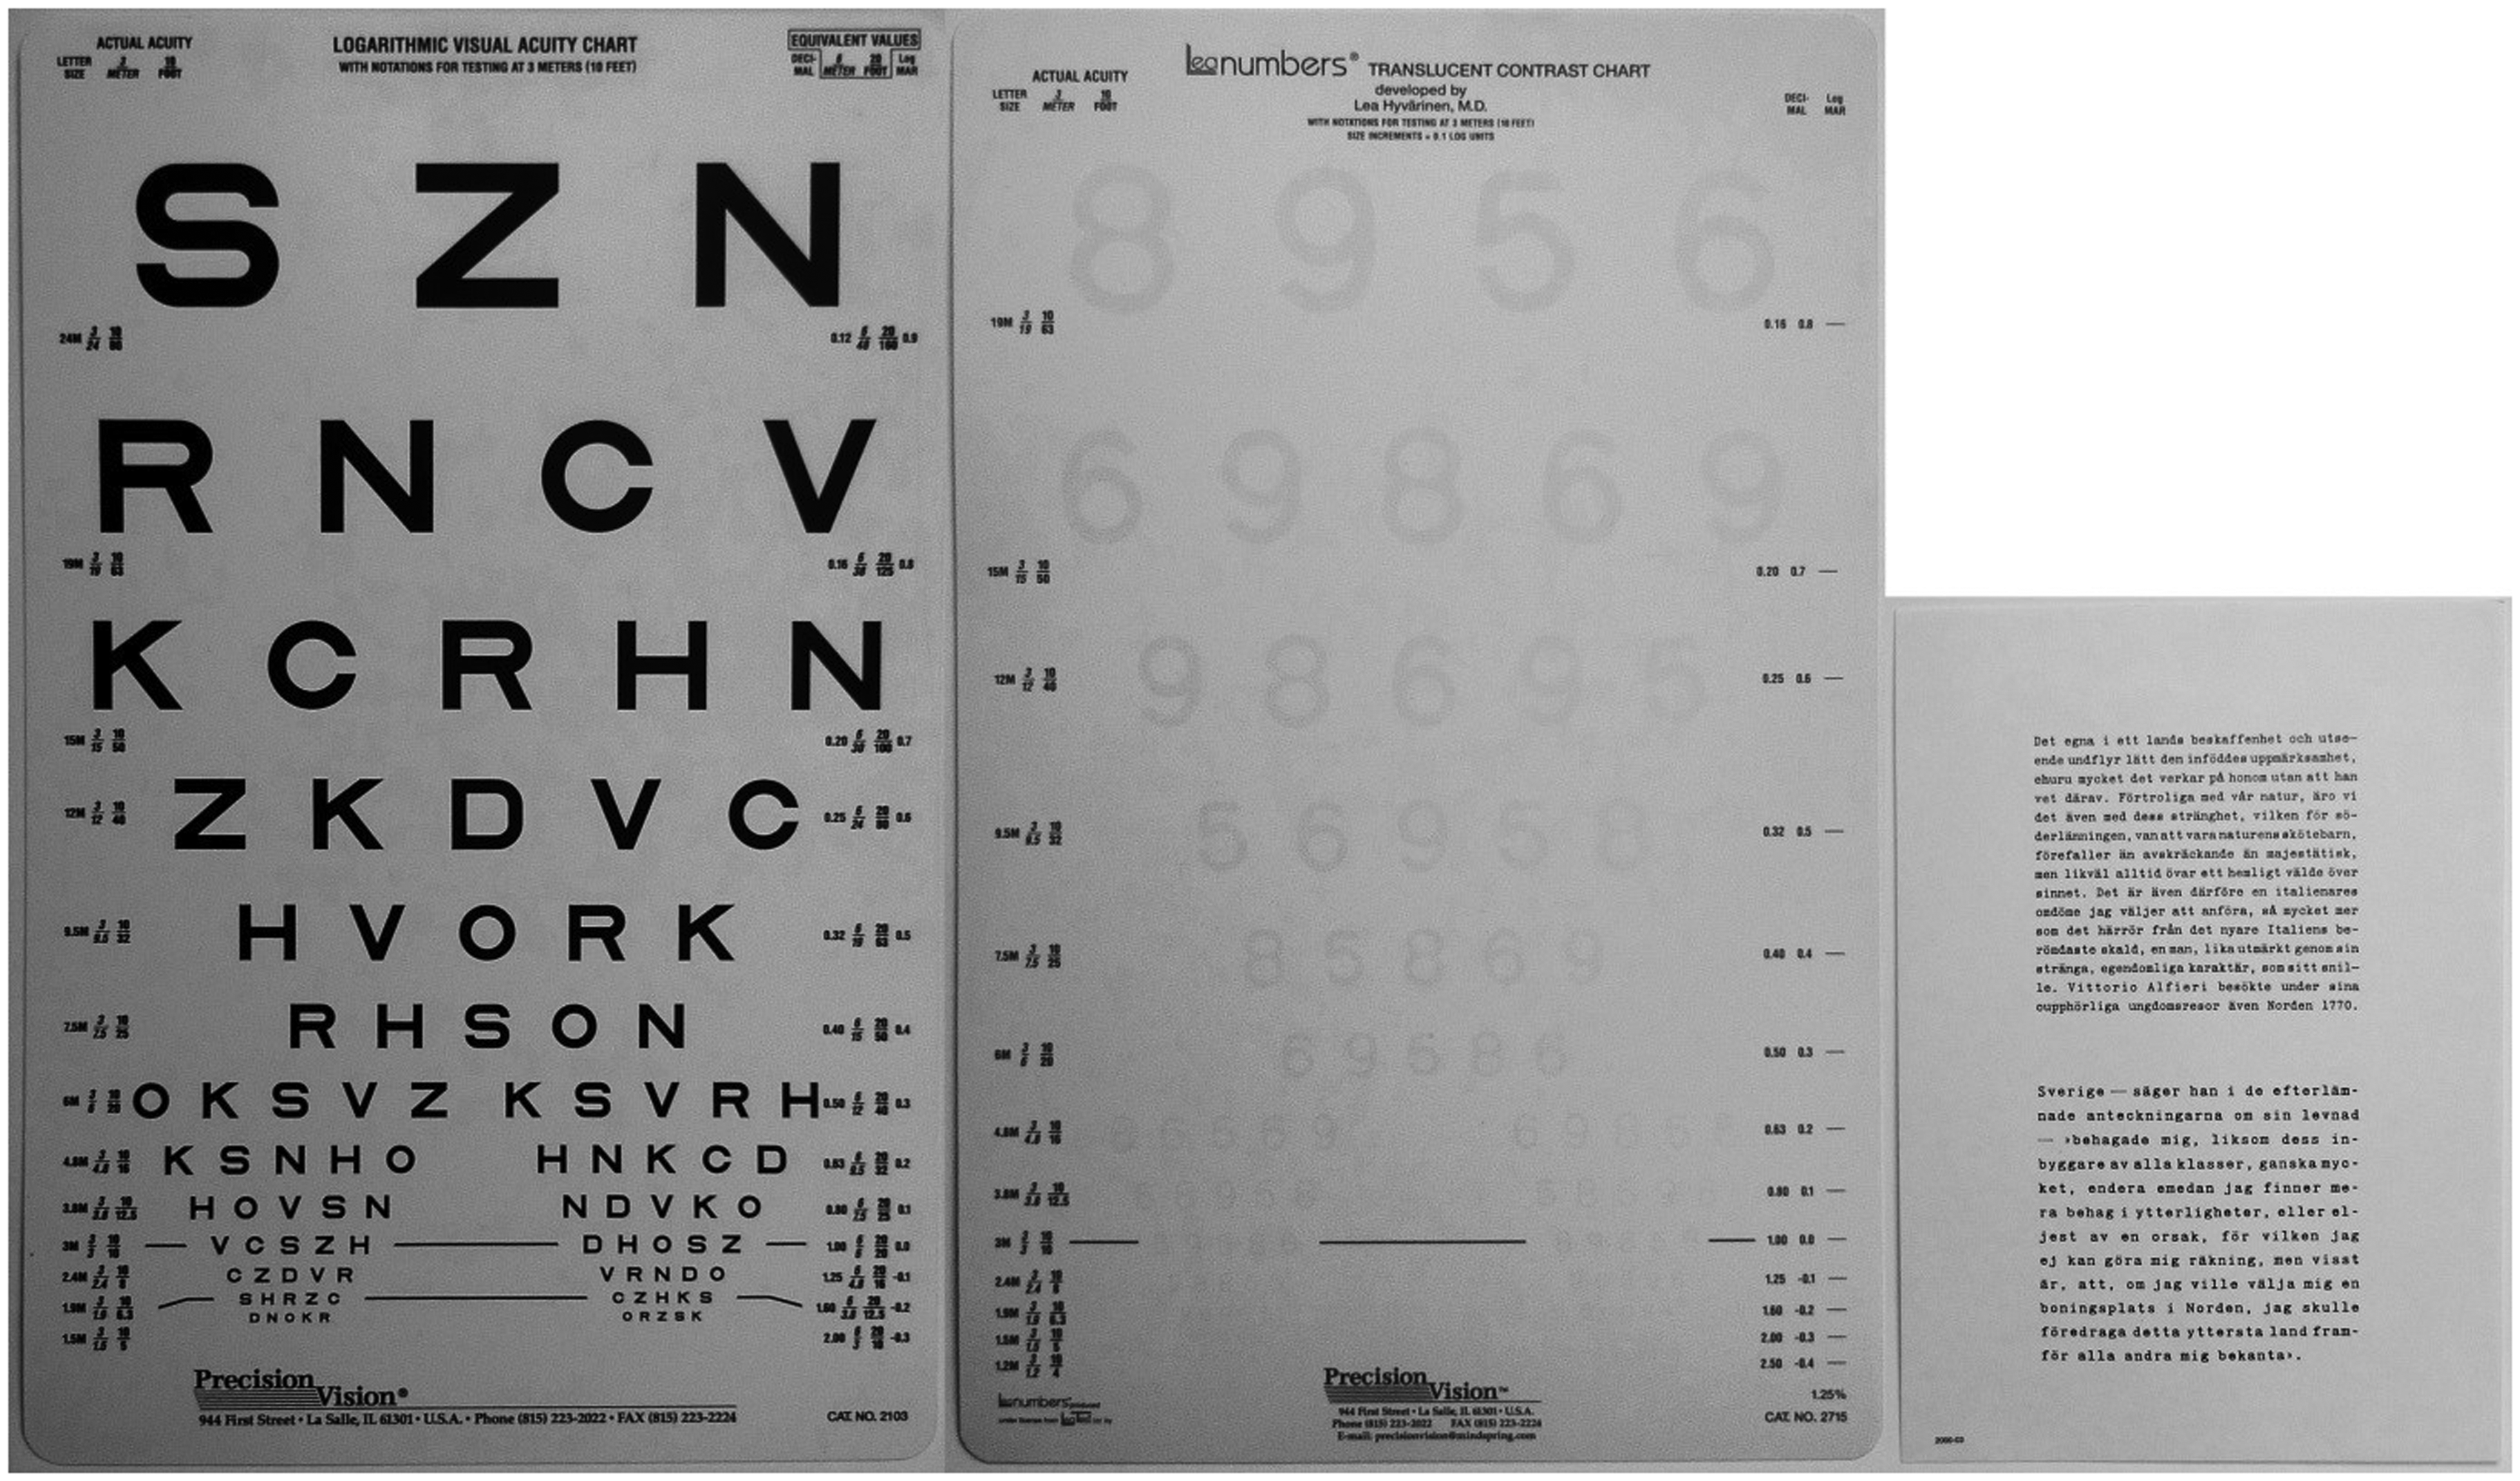
Visual acuity at 3 m distance (I in Figure 3), monocular/binocular (Standardised 3 m Logarithmic SLOAN Visual Acuity Test, Precision Vision, La Salle, IL, USA), see Figure 4. Contrast visual acuity (CVA) at 3 m distance (I in Figure 3), binocular (Translucent Low Contrast Visual Acuity Chart with 1.25% contrast, Precision Vision, La Salle, IL, USA), placed on a 1.2 m high table covered with a green operating drape. The CVAs for the first nine rows with optotypes on the test were (in order from the top) 0.16, 0.20, 0.25, 0.32, 0.40, 0.50, 0.63, 0.80, and 1.0 (Figure 5). Visual acuity at near range (II in Figure 3), near vision reading chart (minimum 5 p), (standardised reading charts, ‘Svenska Stilskalor’), developed by Anders Hedin, 1982, 0.17 m × 0.24 m, Henry Eriksson AB, Bandhagen, Sweden, Figure 5. Laboratory study. The Precision Vision 3 m visual acuity (VA) test (monocular/binocular, Standardised 3 m Logarithmic SLOAN Visual Acuity Test, Precision Vision, La Salle, IL, USA) and the Precision Vision 3 m contrast visual acuity (CVA) chart (binocular, Translucent Low Contrast Visual Acuity Chart with 1.25% contrast, Precision Vision, La Salle, IL, USA) together with the standardised reading chart used in the operating light area (OLA)
During the test situation, the illuminance levels from the surgical luminaires were set according to a predetermined schedule (Figure 4). A standardised reading chart was placed on the operating table in front of the subject, in the OLA (III in Figure 3). It took some time to set the surgical luminaires to the correct illuminance levels, but it was easier to change the general lighting. The subject was asked to close his/her eyes for about 30 s, while the general lighting was changed to the first lighting scenario according to a predetermined schedule consisting of: existing, test 1 (T1), test 2 (T2) or test 3 (T3).
When the first of the 12 lighting scenarios was on, the individual was asked to: Open his/her eyes and look at the OLA (III) and adjust his/her eyes for 30 seconds to the luminance level.
Look at the contrast visual acuity (CVA) chart placed 3 m in front of him/her (I). For 2 minutes, the subject tried to read the numbers on the different visual acuity levels (lines) on the low contrast visual acuity chart, each level timed and recorded. After 2 minutes, he/she was stopped and the CVA was recorded. Rate the general lighting from very bad to very good by placing a mark on a visual analogue scale (VAS), consisting of a 10 cm long line (Figure 8). Rate the operating lighting from very bad to very good by placing a mark on a VAS, consisting of a 10 cm long line (Figure 8). Close his/her eyes while the general lighting was changed to the next scenario (minimum of 30 seconds).
After testing the subject’s visual abilities in the four general lighting scenarios for the first surgical luminaire scenarios, the existing lighting scenario was turned on and the operating illuminance was changed to the next operating light scenario. The general lighting was then set according to the predetermined schedule. This was repeated for all three operating light scenarios. This is presented in Figure 4.
The contrast visual acuity (CVA) was recorded and if needed, a + or −was added to the score if the subject could read more or less than the actual visual acuity row, i.e. if the subject could read one optotype on the next row, a + was added. This was then translated into a number based on the size of the difference between the rows and the number of optotypes on each row. So if a subject could read the entire 0.40 row and one optotype on the 0.5 row (consisting of five optotypes), this would translate into 0.40 + ((0.5–0.40)/5) = 0.42. The visual performance was recorded as the time needed to read the first line of the contrast visual acuity chart and the actual CVA measured 2 minutes after the start of this task. The percentage of the participants that could read the first eight lines at this point was also recorded.
When a subject had completed the tests in the 12 lighting scenarios, he/she was asked to repeat the first test, in order to analyse if the tests had any learning effects.
2.5 Field study
In the field study, personnel rated their perceived visual performance, the perceived lighting quality, the perceived colour temperature and the perceived level of tiredness directly after performing surgery in any of the lighting scenarios (see Figure 8).
In the field study, surgical procedures were performed in the same operating theatre as in the laboratory study, with both the existing and test lighting installed (Figure 6). The test lighting scenario evaluated was the scenario with the best results from the previous laboratory study (T3). The general lighting in the theatre was randomised on a daily schedule between the existing and the best test lighting (T3) scenario (see Table 3 for details).
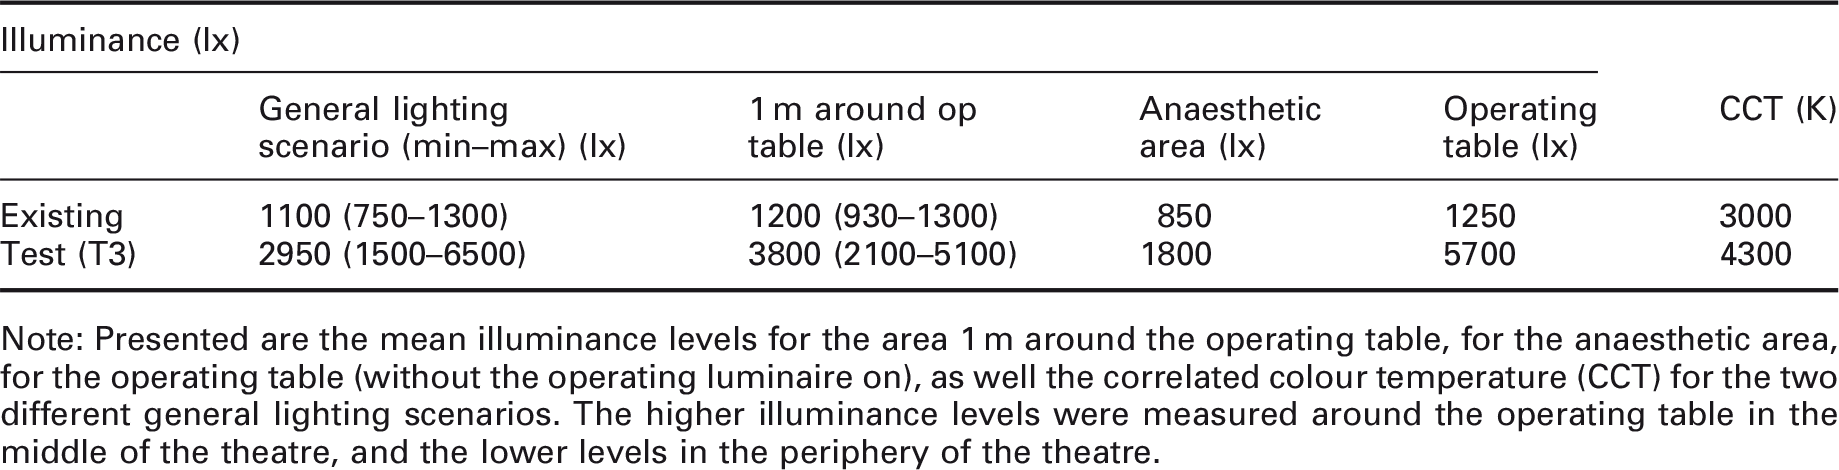
Field study: The existing general lighting (left) compared to the test general lighting (right) Field study: Mean illuminance for the general lighting in the existing and the best test lighting (T3) scenarios Note: Presented are the mean illuminance levels for the area 1 m around the operating table, for the anaesthetic area, for the operating table (without the operating luminaire on), as well the correlated colour temperature (CCT) for the two different general lighting scenarios. The higher illuminance levels were measured around the operating table in the middle of the theatre, and the lower levels in the periphery of the theatre.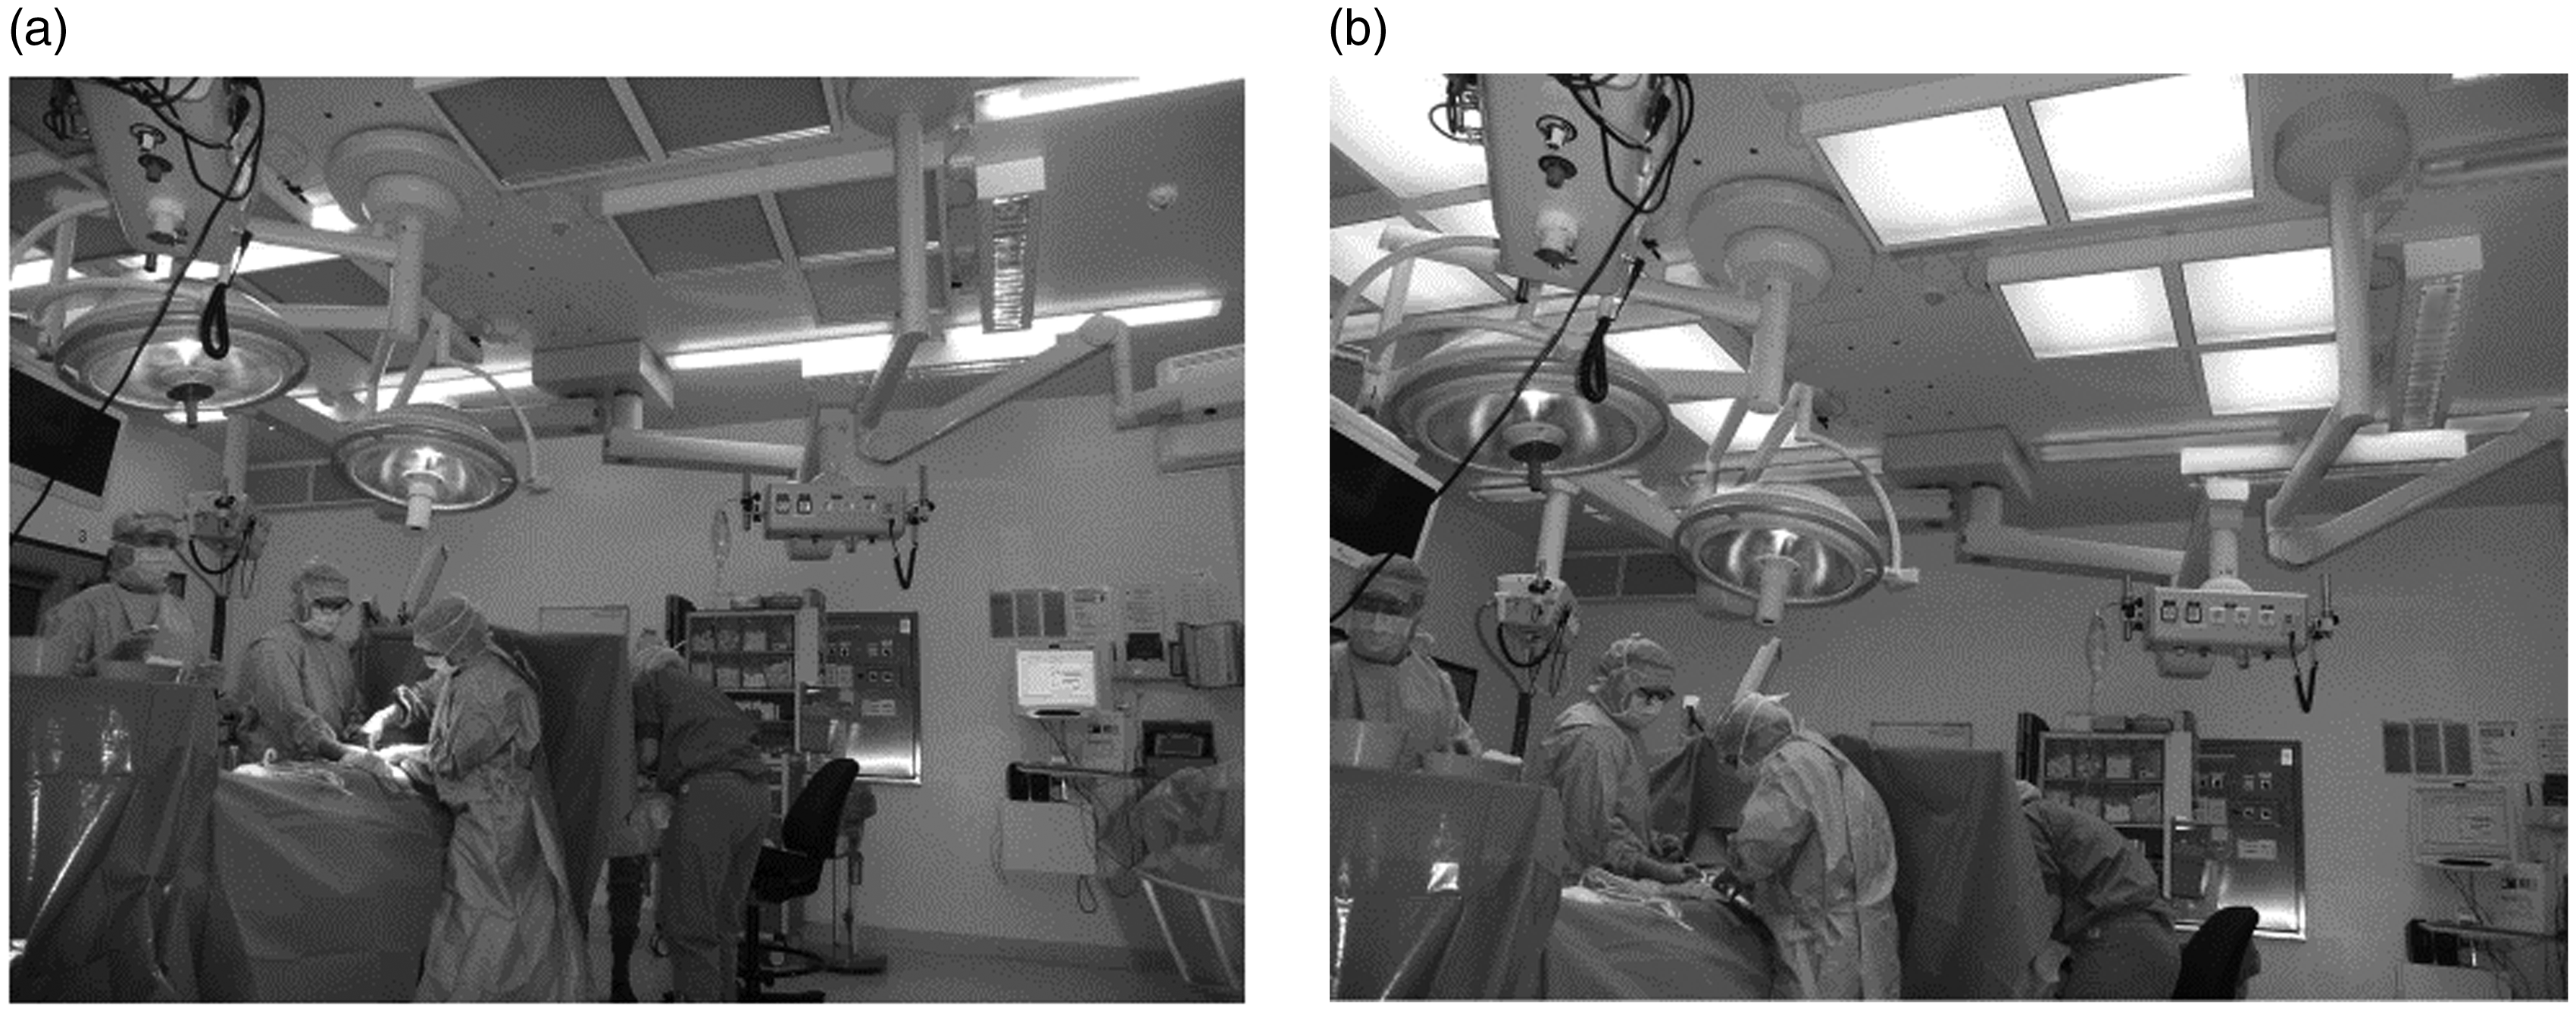
During a five-month period from January to June of 2013, 84 open surgical procedures were evaluated. The participation was initiated by the personnel, mostly the circulating nurse and the surgeon. Laparoscopic surgery procedures were excluded. It was mandatory for the surgeon, scrub nurse and anaesthetist nurse to answer the questionnaires, but voluntary for the circulating nurse. The illumination at the operating cavity was measured for all the surgical procedures and varied between 16,000 and 114,000 lx. To reduce risk of infection, the circulating nurse held the illuminance meter (Hagner Screenmaster) 0.10 m above the operating cavity when measuring the illuminance of the operating light once after the surgeon had made the first cut. The illuminance at the operating cavity level was therefore slightly less than the illuminance data reported.
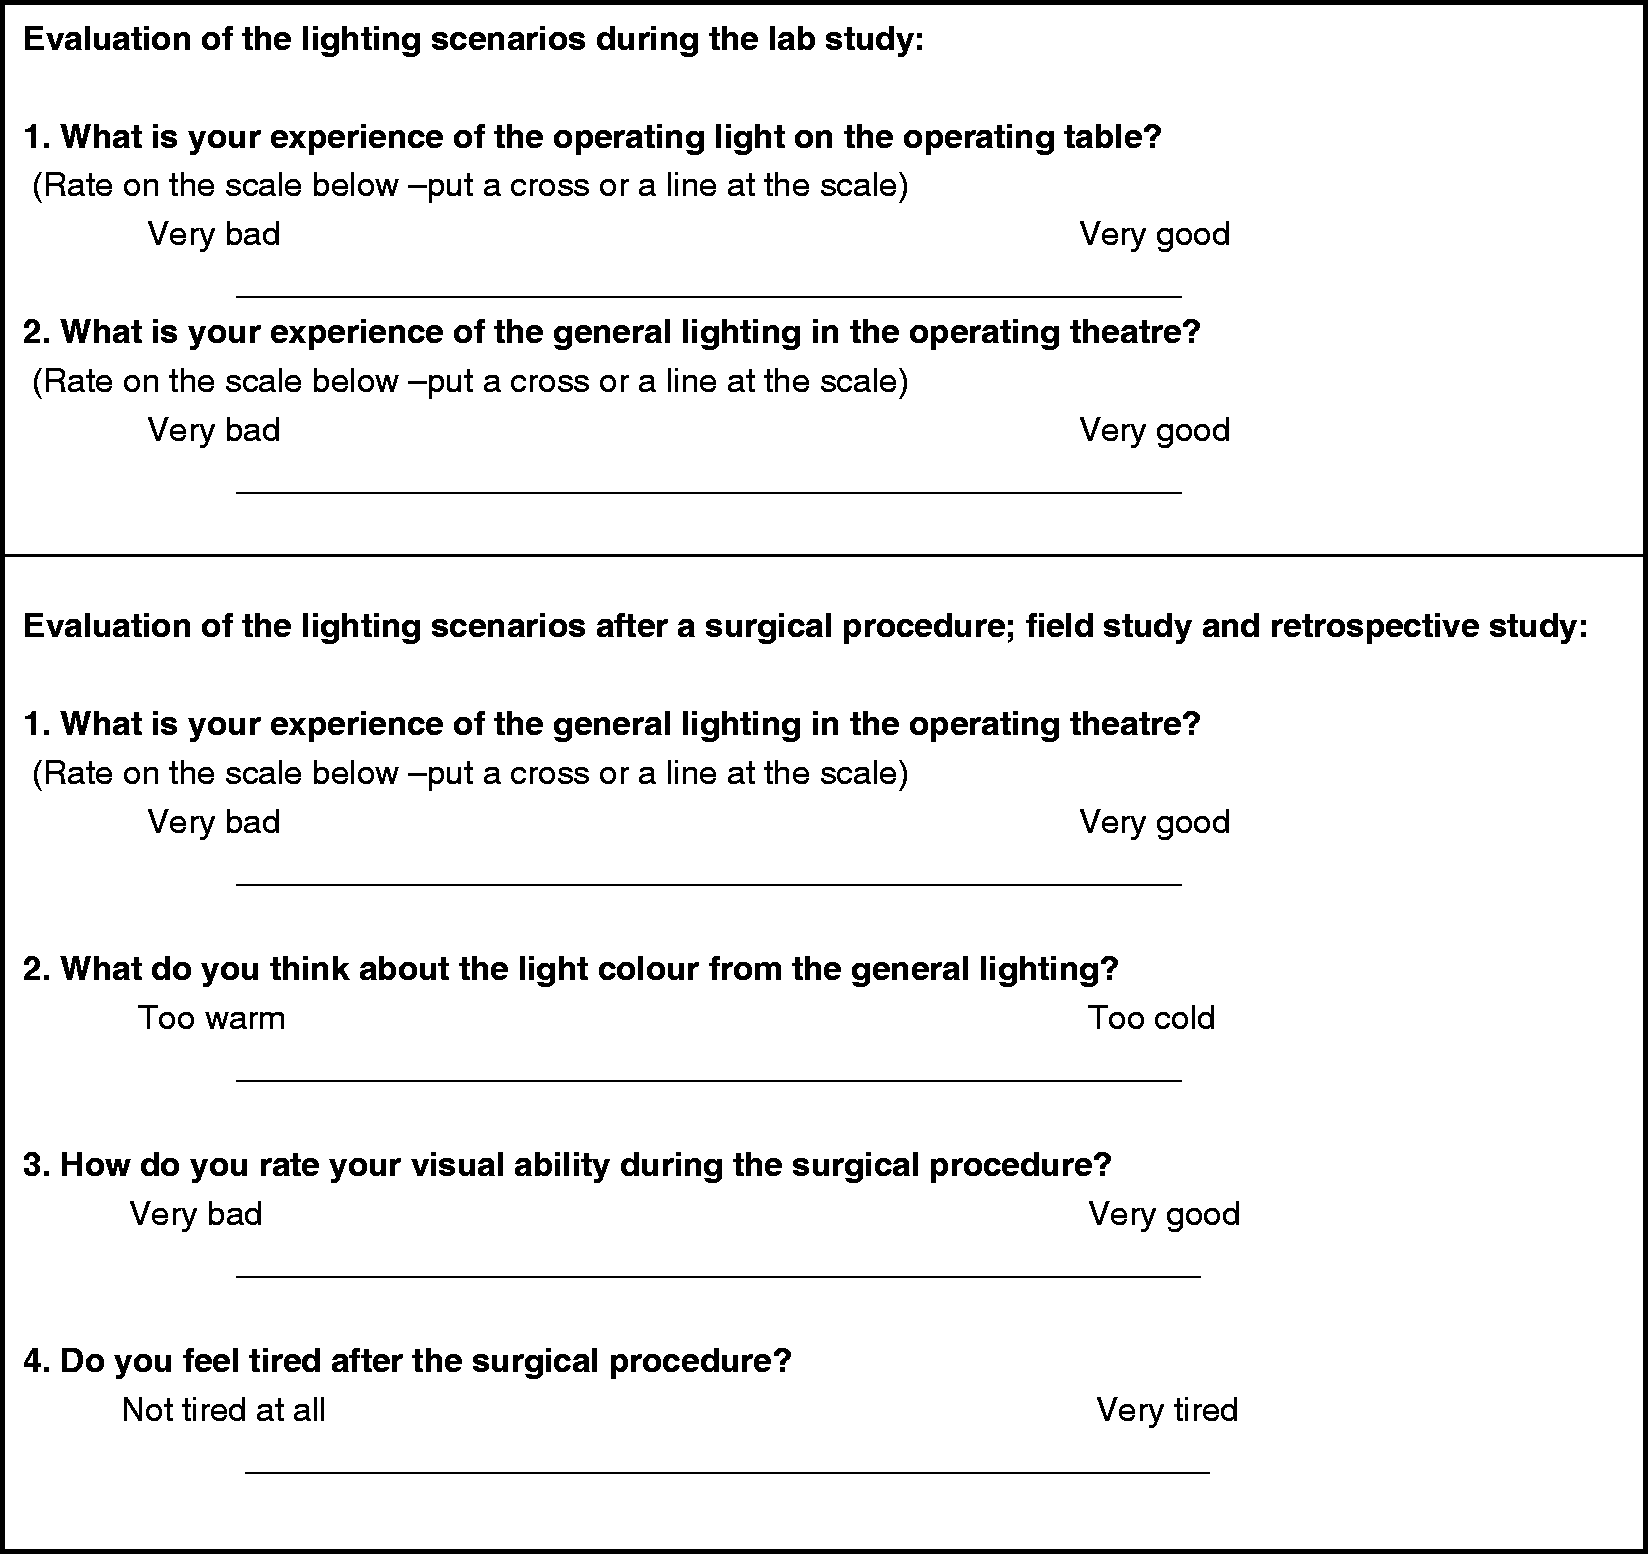
The questionnaire (Figure 8) was developed for this study and included visual analogue scales (VASs) (0.1 m long lines).32,33 It consisted of the surgeons’ and assisting personnel’s ratings of the general lighting, as well as the lighting at operating table, and their perceived visual performance during the procedure (ranging from very bad [0] to very good [10]), the perceived colour temperature of the light (ranging from very warm [0] to very cold [10]) and their perceived tiredness during the procedure (ranging from very sleepy [0] to very alert [10]). The questionnaires were internally validated; each participant was his/her own control.
Questionnaires were obtained from 84 surgical procedures, 26 in the existing lighting scenario and 58 in the test lighting (T3) scenario. In 23 of the surgical procedures (16 in the test lighting (T3) scenario), the surgeons used a computer screen to look at X-rays or endoscopic procedures for 10–15 minutes. The operating luminaire was turned off during this time and the general lighting was dimmed to 70 lx over the anaesthesiology equipment/patient’s head in both lighting scenarios. The mean illuminance at the periphery of the operating theatre for the test lighting (T3) scenario was 1800 lx. In the existing lighting scenario, this was 800 lx. The displays were placed at slightly different locations in different surgical procedures, which resulted in the means on the screens to differ somewhat (see also Figure 7).
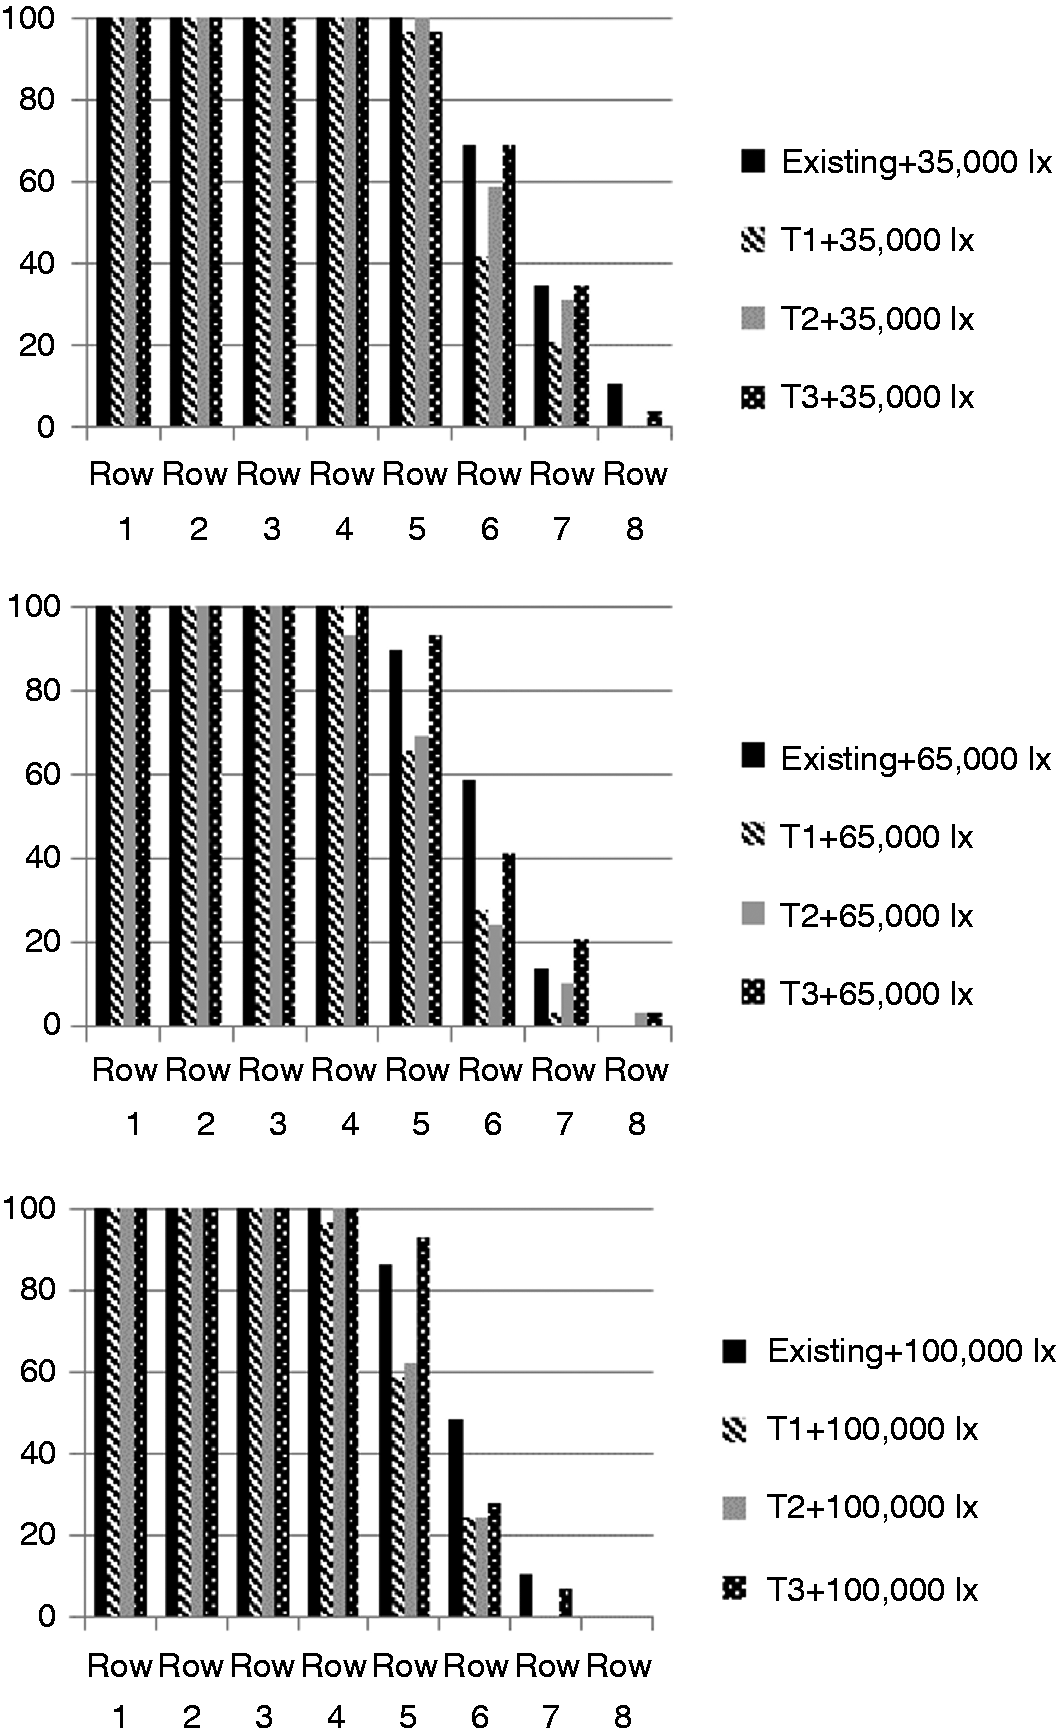
The tasks in the field study The questions asked of the subjects in the laboratory study and the operating personnel in the field study (translated from Swedish). Each visual analogue scale line is 10.0 cm long and the subject’s mark across the line resulted in the value for the rating (for example 7.6 cm from the left side gave the value of 7.6) Laboratory study: Percentage (%) of subjects that could read the first eight rows in each of the general lighting scenarios for the three operating light scenarios (35,000 lx, 65,000 lx, 100,000 lx). Row 5 is the same as CVA 0.4. The results are affected by the amount of glare from the operating lights resulting in adaptation problems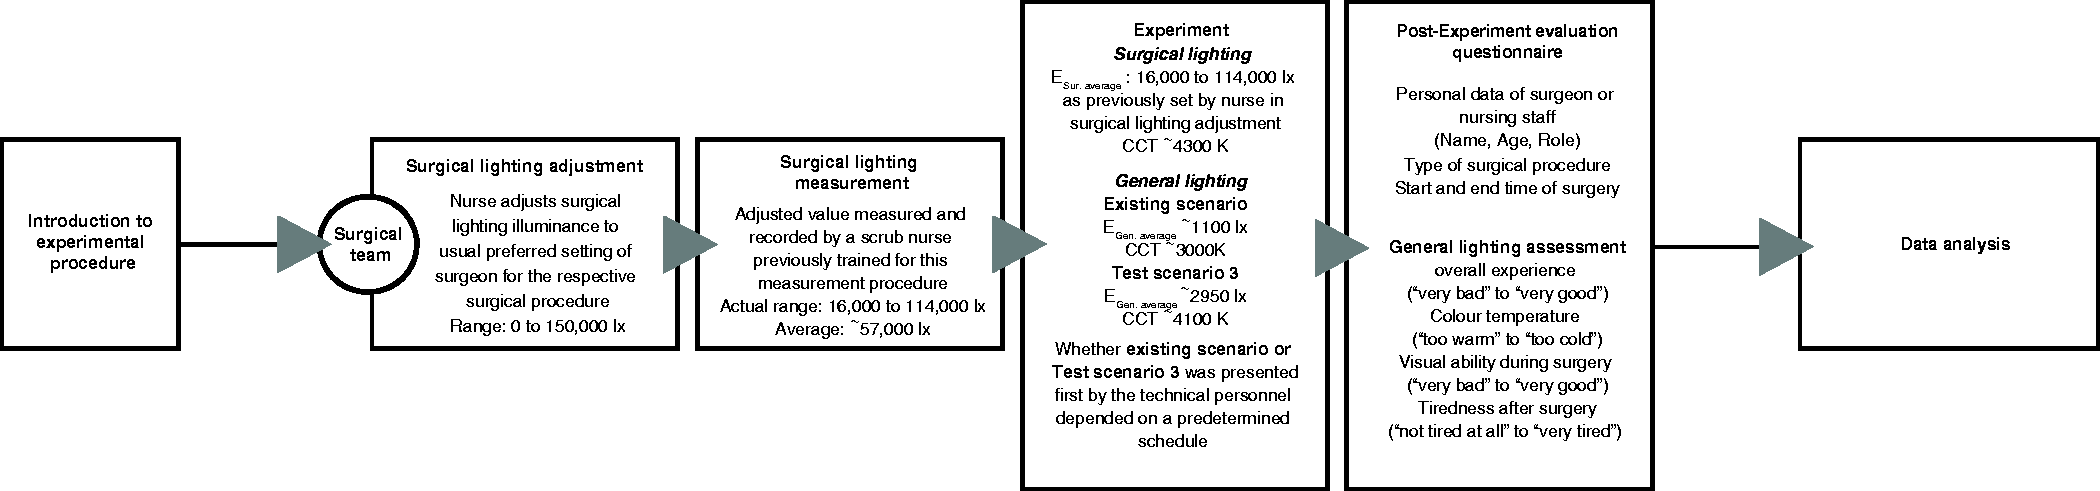
2.6 Retrospective study
The retrospective study was a session held during a morning staff meeting one month after the completion of the field study. The personnel that had worked in both the test and existing lighting scenario rated their perceived visual ability, as well as the perceived lighting quality and colour temperature in the two lighting scenarios, without being in the operating theatre. The same questionnaire as in the field study was used.
2.7 Statistical analysis
All analyses were carried out using SPSS 20.0 (IBM Corp., Armonk, NY, USA). Statistical significance was set at *p ≤ 0.05 (two-tailed).
2.7.1 Laboratory study
A repeated measures analysis of variance (ANOVA) was carried out using a generalised estimating equation (GEE), since each subject performed the tests 12 times. Subject identification number and the 12 lighting scenarios were used to indicate the repeated measurements.
The effects of different lighting scenarios on the CVA index, and the subjective ratings (perceived general lighting, perceived operating lighting) were analysed using a linear model type of the GEE. To exclude confounding variables (e.g. learning effect and tiredness) associated with performing 12 repeated CVA tests in a relatively short time, an unadjusted version was first analysed and then an adjusted model with the test sequence was included. However, results from the test sequence for adjustment did not modify the main effects of the lighting scenario meaningfully. We repeated all statistical analyses using the logarithm of the CVA index and ratings as a sensitivity analysis. However, the results using the log-transformed CVA index or ratings did not show any meaningful differences from the results using the original data. Thus, the results reported in this paper are based on the original data with the unadjusted model.
2.7.2 Field study
In the field study, the four self-rated questions in the first questionnaire (n = 39) (perceived visual ability, perceived lighting quality, perceived colour temperature, perceived tiredness) were analysed using the General Linear Model/Repeated Measures for differences between lighting scenarios within subjects. The relations between the variables were also tested with the Pearson’s Moment Correlation.
2.7.3 Retrospective study
Data from the retrospective study, perceived visual ability, perceived lighting quality, perceived colour temperature, for the existing and the test lighting (T3) scenarios were analysed using a paired t-test since the same respondents answered the same questions regarding both the test and the existing lighting scenarios. In the paired sample t-test, the null hypothesis that the rating is the same for both the existing and the test lighting (T3) was analysed using a standard t-test.
3. Results
3.1 Laboratory study
The results from the visual ergonomics questionnaire showed that 17 of the 29 subjects (59 %) reported eyestrain in their ordinary working conditions. Thirteen of the subjects were over 45 years of age and 7 of them reported eyestrain (54 %), and that the individuals with eyestrain reported four times more musculoskeletal discomfort from neck and shoulder than those without eyestrain.
Results from laboratory study first grouped according to illuminance level provided by operating light and then by type of general lighting: time to read the first row on the contrast visual acuity (CVA) chart starts after the subjects have adjusted to the lighting conditions for 30 seconds. Contrast visual acuity is determined 2 minutes after the start of the contrast visual acuity test. Ratings of the lighting conditions are made after this (n = 29). For the different lighting scenarios, see Table 1
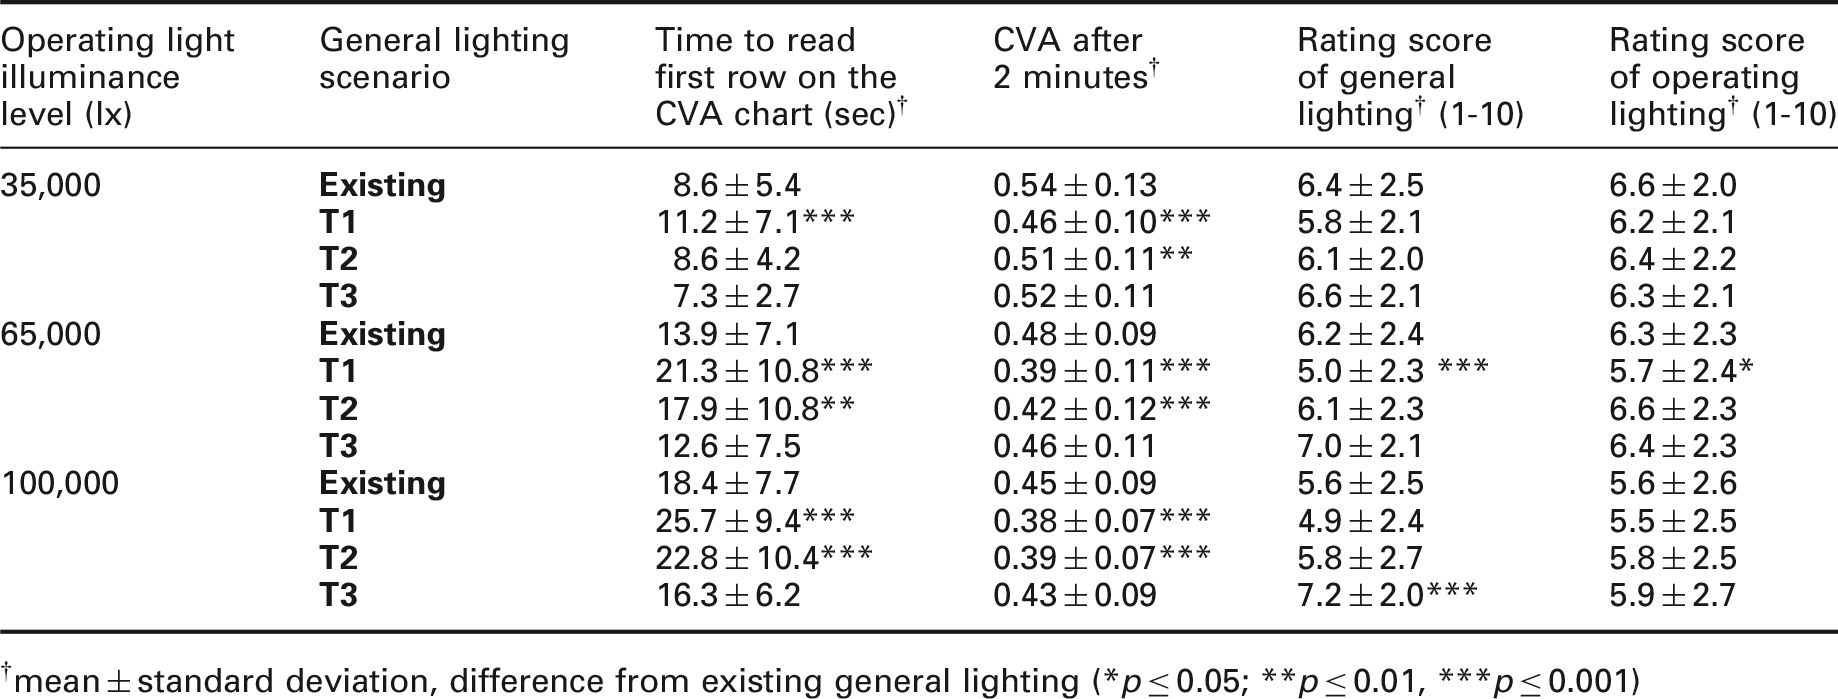
mean ± standard deviation, difference from existing general lighting (*p ≤ 0.05; **p ≤ 0.01, ***p ≤ 0.001)
Results from laboratory study as in Table 4, but here grouped according to type of general lighting and illuminance levels provided by operating light. Time to read the first row on the contract visual acuity (CVA) chart starts after the subjects have adjusted to the lighting conditions for 30 seconds. Contrast visual acuity is determined 2 minutes after the start of the contrast visual acuity test. Ratings of the lighting conditions are made after this
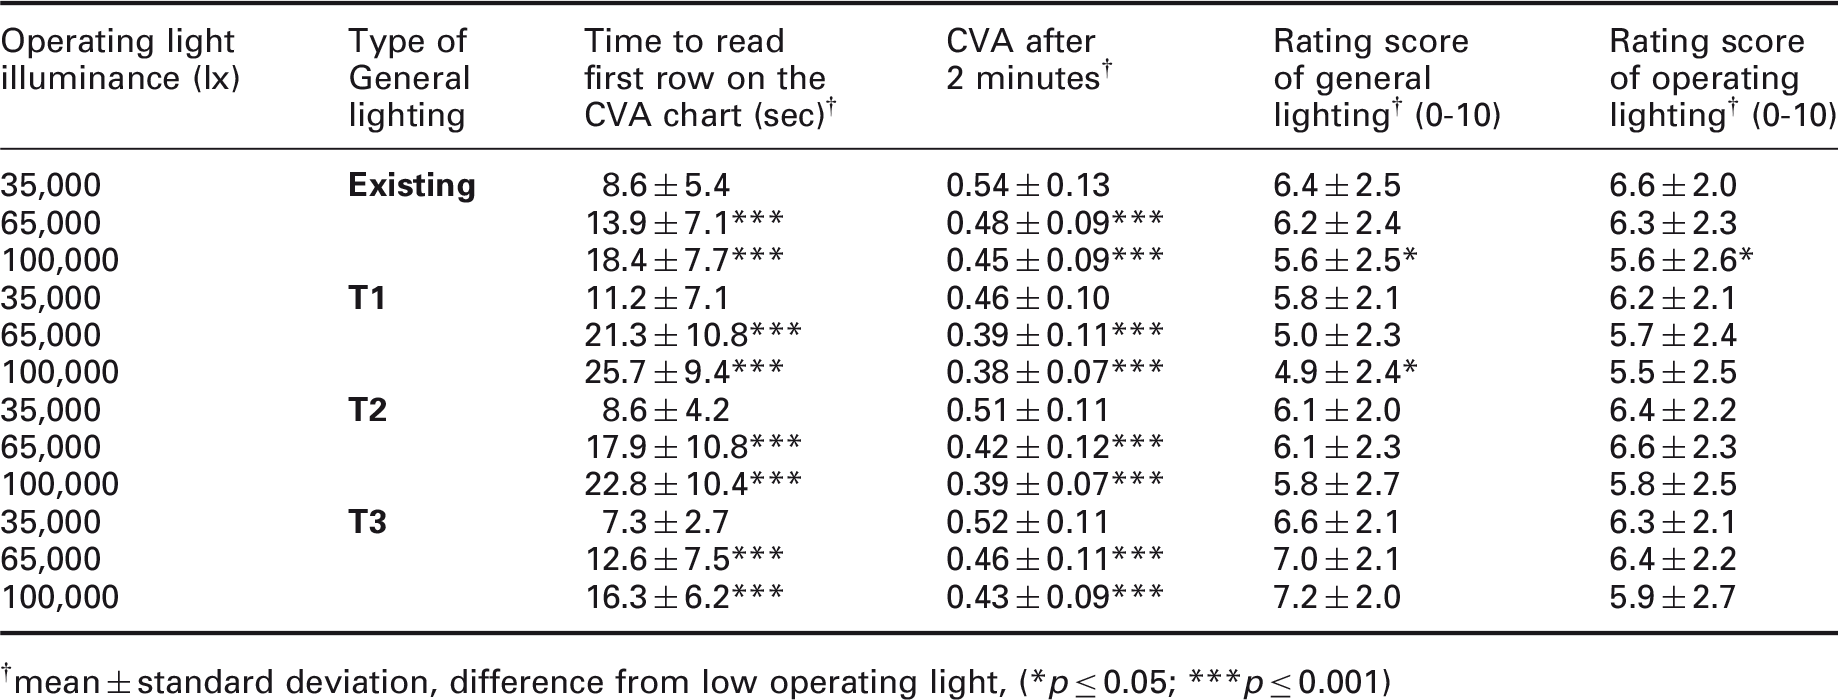
mean ± standard deviation, difference from low operating light, (*p ≤ 0.05; ***p ≤ 0.001)
There was a tendency indicating that the T3 lighting scenario provided better visual performance in a shorter time (time to read first CVA row). The CVA was similar after 2 minutes for the existing and the T3 lighting scenarios, with a tendency for the existing lighting scenario to result in a higher CVA. For the higher illuminance levels of the operating light, the T3 general lighting received significantly better ratings. The operating light ratings were similar in the different general lighting scenarios (see Tables 4 and 5).
The effects of changes in CCT are revealed by comparing the existing and T2 lighting scenarios. The illuminance levels on the CVA test were similar for the T2 and existing scenarios, but the CCT was higher for the T2 lighting scenario. For the T2 lighting scenario, it took the subjects longer to read the first row, and the CVA after 2 minutes was lower, especially for the higher illuminances from the operating luminaires. The subjective rating of the T2 lighting scenario was similar to that of the existing lighting scenario (see Tables 4 and 5).
When dividing the results into the different general lighting scenarios and comparing the different levels of operating light, the rating of the general lighting was better for the low level of the operating light (high levels of operating light produced more glare), except for T3 where the high level received the best rating. However, the lower rating of the higher illuminance levels from the operating light was only significant for the existing and T1 lighting scenarios (see Tables 4 and 5.) The role in the operating theatre (surgeon, anaesthetic nurse, scrub nurse, circulating nurse), age or gender of the participants did not influence the results.
3.2 Field study
Field study: Subjective ratings (with standard deviation) for existing and test general lighting scenarios for perceived lighting quality, perceived colour temperature, perceived visual ability and perceived tiredness
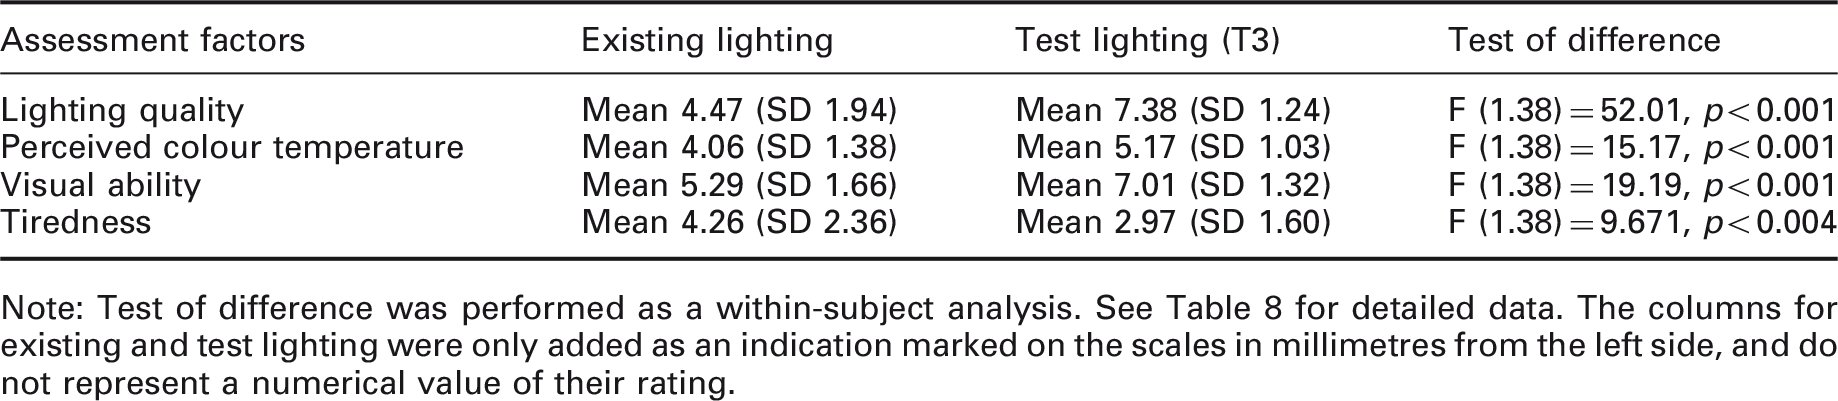
Note: Test of difference was performed as a within-subject analysis. See Table 8 for detailed data. The columns for existing and test lighting were only added as an indication marked on the scales in millimetres from the left side, and do not represent a numerical value of their rating.
Field study: Correlation analysis of variables from questionnaire
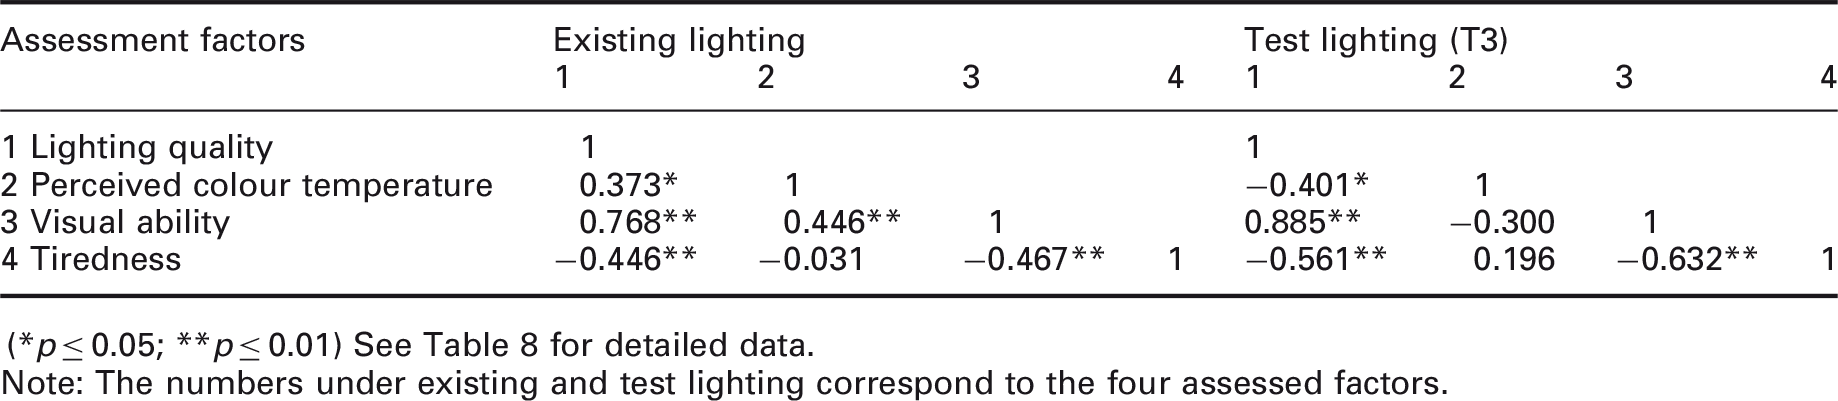
(*p ≤ 0.05; **p ≤ 0.01) See Table 8 for detailed data.
Note: The numbers under existing and test lighting correspond to the four assessed factors.
The correlation analysis showed that the participants that rated the perceived lighting quality as high, also rated their perceived visual ability as high for both the existing and the test lighting (T3) scenarios. The participants that rated the perceived lighting quality high, also perceived lower tiredness levels. The correlation between perceived visual ability and perceived tiredness was, in other words, negative: the better they rated their perceived visual ability, the lower they rated their perceived tiredness (see Table 7). The time of day and duration of the surgical procedures were analysed and did not show an effect on the results. More than half of the participants started in the morning before lunch; none of the surgical procedures was performed at night; the average time for a procedure was 1.5 hours. The perceived colour temperature was regarded as warmer in the existing lighting scenario and cooler in the test lighting scenario (T3). When the subjects perceived the test lighting (T3) colour temperature as average, the lighting quality was rated as high. In the existing lighting scenario, the perceived colour temperature was rated as warm and the lighting quality as average.
The illuminance levels provided by the operating luminaire were measured in the centre of the surgical light beam for all surgical procedures but one (83 in total), and was on average 60,000 lx in the existing lighting scenario, compared to 55,000 lx in the test scenario (not a significant difference).
3.3 Retrospective study
Field study data: Mean is shown if a person answered more than once in that lighting scenario
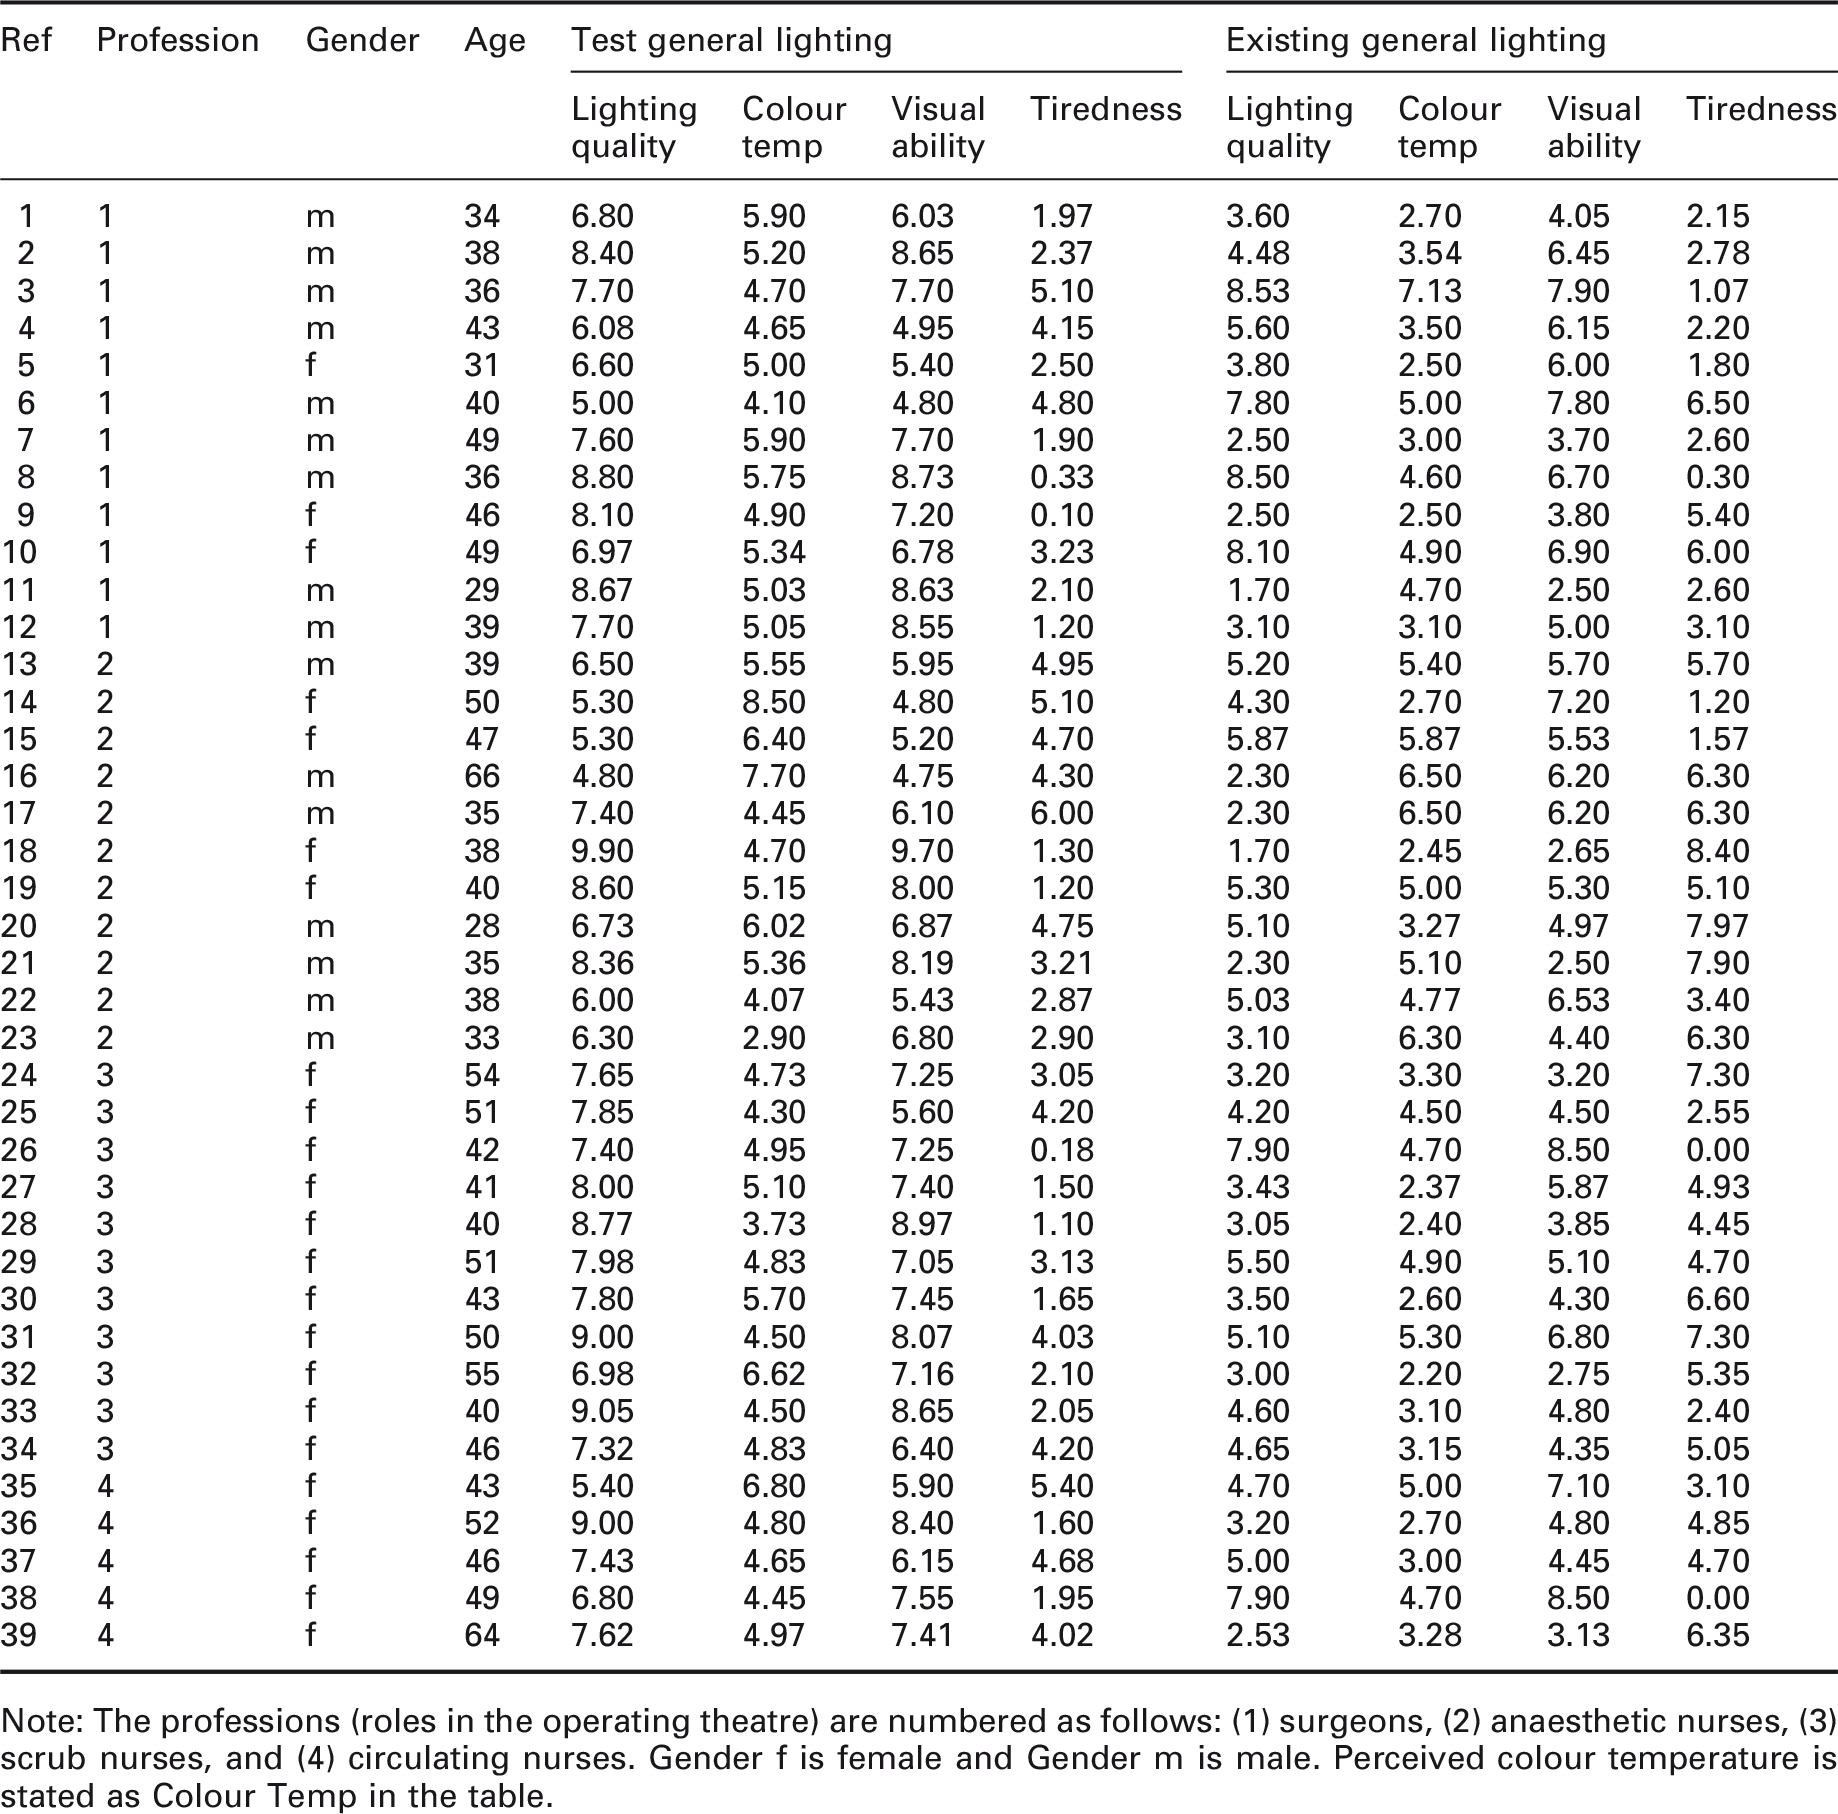
Note: The professions (roles in the operating theatre) are numbered as follows: (1) surgeons, (2) anaesthetic nurses, (3) scrub nurses, and (4) circulating nurses. Gender f is female and Gender m is male. Perceived colour temperature is stated as Colour Temp in the table.
Results from retrospective study: Personnel that had worked in the two lighting scenarios were asked to rate both of the lighting scenarios at the same time concerning lighting quality, perceived colour temperature and visual ability
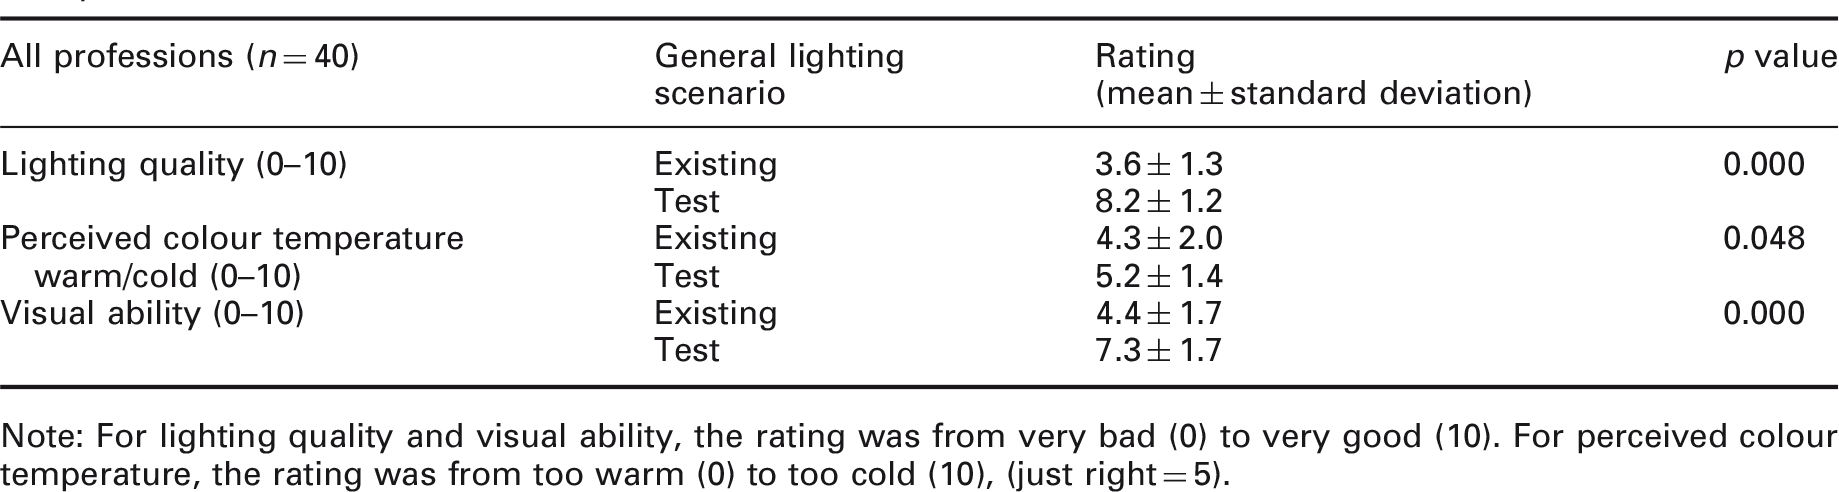
Note: For lighting quality and visual ability, the rating was from very bad (0) to very good (10). For perceived colour temperature, the rating was from too warm (0) to too cold (10), (just right = 5).
4. Discussion
4.1 Laboratory study
In the laboratory study, the existing and the T3 lighting scenarios were associated with the best results in general, both for the CVA and for the perceived general lighting ratings. When comparing the different operating lights in each general lighting scenario, the presence of high luminance ratios (i.e. potential glare) had a significant impact on the subjects’ ability to see – the higher the luminance ratio, the longer time it took to see the first row on the CVA chart. A bright light and a high luminance ratio can cause a temporary blurring of vision and a reduction in the quality of an image, 3 which is referred to as light adaptation glare. After two minutes, the difference was still present with a lower CVA for the higher illuminance levels from the operating luminaire. It is thus essential to reduce the luminance ratio between the operating luminaire and the surrounding area and not to use the highest possible illuminances for the OLA. ‘The more – the better’ 10 seems not to be true for operating lights, not at these levels of illuminance.
The surgeon spends most of the time in surgery looking into the operating cavity. Increased general lighting illuminance levels will probably not have any significant effects on the surgeon’s performance. However, the T3 lighting scenario will most likely facilitate the visual ability of the scrub nurses due to the reduced luminance ratio between the operating cavity and the instrument table. The anaesthetic nurse will more easily see the patient and the medications, but the illuminance on the monitor screens with the T3 lighting scenario will probably decrease the contrast on the monitors, which in turn will decrease visibility. Some sort of shielding device for the monitors to decrease the illuminance at the screen can mitigate this effect.
The CCT level in the existing lighting scenario was 3000 K and in the operating lamp 4300 K. The lighting scenarios were programmed with an increasing CCT for T1 (3900 K), T2 (4100 K) and T3 (4300 K) compared to the existing lighting scenario. An increase of the CCT from 3000 K to about 4000 K can improve visual ability, for example, for the perception of blueness of the lips (sign of hypoxia). The purpose of the test scenarios was to have the same CCT for the general lighting as for the operating lamp (4300 K). There was a slight increase of the CCT in the different test lighting scenarios, due to programming of the experimental luminaires, but the difference between T1 and T3 was only 400 K, so we do not think that it had a large impact on the results.
The difference between the T2 and existing lighting scenarios for the illuminance at the CVA was only 80 lx, but the CCT was higher for the T2 lighting scenario. The existing lighting scenario resulted in better CVA scores than the T2 lighting scenario. However, the subjects’ ratings of the perceived general lighting quality were similar for the two. An explanation for the differences in CVA could be that pupil size depends on the amount of light available in the short wavelengths, 34 causing less light to enter the eye. This can have an effect on the CVA since a good CVA is dependent on the amount of illuminance. Thus, in order to have a similar amount of light hitting the retina when the pupil is smaller, the amount of illuminance needs to be higher for light with a higher CCT. The subjective discomfort glare is also larger with higher CCTs.35–37 In a situation where individuals are exposed to glare, and have adapted to a higher luminance level, the adaptation level can reduce the CVA.
The illuminance levels were changed so that the first lighting scenario, T1, would have an illuminance similar to the existing lighting scenario. T2 had twice the amount of illuminance of T1, and T3 had an illuminance four times as high as T1. The T3 lighting scenario, in particular, had higher illuminance levels around the operating table to reduce the luminance ratio and decrease the risk of glare. More studies need to be performed to further clarify the effects of illuminance levels.
There was a tendency for the T3 lighting scenario to be better for the CVA in a shorter time frame and for the existing lighting scenario to be better after two minutes. One reason that T3 was better in the shorter time frame may be the quick contrast response via the ganglion cells with a high CCT that enhances visibility.18–20
The CVA – used in this study for distance vision to evaluate these specific circumstances with high luminance ratios present – is not a commonly used test for disability glare. Most of the existing glare tests require an instrument with a specific luminance, which was not applicable in this study. The CVA test was the only one that could be used with an operating luminaire to evaluate the effect of glare on contrast vision. The Regan Charts might have been an alternative solution for the glare test at a distance. 38
The results from this study show that increasing the illuminance to about 2000 lx for the general lighting, 4000 lx around the operating table, and 5500 lx on the operating table will positively affect the visibility and the ratings of the lighting. The European standards only discuss general lighting of 1000 lx, which this study indicates may be insufficient. The North American standards, on the other hand, provide recommendations similar to the ones presented here; thus, this study supports the American recommendations. CCT recommendations may also be required, and further studies in this area are needed.
The study also indicates that there probably is a need to check the vision of individuals who are working with visually demanding tasks (e.g. operating personnel) to determine at an early stage the conditions that affect the visual ability of the ageing work force.
4.2 Field and retrospective study
The purpose of the field study was to examine the results from the laboratory study in real surgical work. Since the ratings of the lighting in the field study were performed on different days and during different surgical procedures, the retrospective study was performed as a cumulative measurement of the experience of existing and test lighting (T3) over time. The amount of reported eyestrain among the personnel shows the importance of addressing the lighting aspect in an operating theatre. The results from the field and retrospective studies show the importance of not only testing the effect of lighting on visual acuity in a laboratory setting but also on the perceived lighting quality in the field.
The use of visual analogue scales (VAS) is common in the medical field and was chosen in this study for rating the subjects’ perception of the visual environment. There are several weaknesses in using VAS regarding the studied aspects. One of them is that only the extremes of the scales are semantically defined. It might have been better to use a scale with intermediate steps, such as the Likert scale. However, one advantage of the VAS is that it can be changed into millimetres and allows calculating variations between the subject’s answers on different occasions. 39 Intermediate steps can be added to a VAS but since the scale is not linear this can affect the individuals’ ratings. We have strictly followed a principle of within-subject analysis only.
The mean illuminance level on the operating table increased with the test lighting (T3) to 5700 lx (according to IESNA, 2011, it should be between 4000 lx and 6000 lx), 4 compared to the existing lighting scenario that provided just 1250 lx (according to SS-EN 12464-1, the general lighting should be 1000 lx). 5 This resulted in a more even illuminance level on the operating table surface and lower luminance contrasts. This fact may have contributed to the better rating of the visual ability in the test lighting (T3) scenario. Another factor is that the mean illuminance levels from the operating light in the operating cavity had a tendency to be lower (9.2% lower) in the test compared to the existing lighting scenario. This supports the hypothesis that if the general lighting is higher and the luminance ratio is lower, there is no need to increase the amount of illuminance from the operating light. The theory that a more even light distribution at the working area will reduce the need for higher illuminance levels from any task-specific light may thus be supported.
In the field study, a test lighting scenario (T3) was compared to an existing lighting scenario during surgical procedures. All personnel rated the test lighting scenario (T3) significantly better than the existing scenario regarding perceived lighting quality and visual ability in the first questionnaire, even though the results in the lab study showed no difference. Since both the CCT and the illuminance levels were changed, it is uncertain which had the largest effect. The participants could have rated the test lighting better simply because it was a new alternative, indicating that the Hawthorne effect could be present. 40 But according to Fostervold et al., 41 the effect would likely be minimal since the intervention field study was longer than 2.5 months. Since the test lighting was rated equal or better to the existing lighting scenario and gave equal or better results on the visibility test in the laboratory study, this effect should be minor.
Perceived tiredness was also reduced in the test lighting scenario (T3) and the level of tiredness had a negative correlation with the perceived lighting quality and visual ability. The results from the visual ergonomics questionnaire from the laboratory study show that about half of the medical staff reported eyestrain. If the lighting situation and the visual ability are perceived as good, this can result in less eyestrain and an increased sense of wellbeing that may result in a lower level of tiredness. The decrease in tiredness reported by the personnel following the increased illuminance and higher CCT of the test lighting could result in immediate improvements in patient safety. The higher levels of illuminance and the increased CCT (from 3000 K to 4300 K) in the test lighting scenario may have had a larger effect on the hospital personnel. However, in the long run, it could be harmful to the personnel’s circadian rhythm when working in the night shift. Research42,43 has indicated possible health risks of exposure to intense light during night work. Consequently, the effects, including possible side effects, of using bright general lighting in an operating theatre, especially at night, need to be further examined. These levels of illuminance and CCT at night increase the visual ability that could improve patient safety, but it can have a negative effect on personnel health. How lighting can be designed for night times to improve both needs to be further investigated.
The subjective ratings of the perceived colour temperature in both of the lighting scenarios show that the personnel did not experience the test lighting (T3) as too cold or that the existing lighting was too warm.
The illuminance in the anaesthetic area increased from 850 lx to 1800 lx. This led to an increase of the illuminance levels at the computer screens, resulting in a decrease in contrast of the screen and potential disability glare due to reflected luminaire images in the screen. Some of the anaesthetist nurses commented on this in their questionnaires. They felt that the general test lighting (T3) reflected on the screens disturbed their visual ability. This was anticipated from the start of this study, so monitor hoods to shadow the displays were obtained for the screens. A discussion was held with the operating ward personnel about turning off or dimming the luminaires behind the anaesthetic area to avoid glare. Too much light reaching the display during surgical procedures can result in lower contrast and reflections on the screen. This causes a reduced visual ability and eyestrain. It is thus necessary to select, locate and arrange the luminaries to avoid introducing high brightness reflections 3 ; or to reduce the light reaching the screens by using some sort of shielding device. The light reaching the displays should not exceed 500 lx, 44 otherwise the image contrast on the screen decreases. After the study, the luminaire behind the anaesthetic area in the operating theatre was turned off to reduce the risk of glare. It was also recommended that the incoming light nearest the anaesthetic computer screens should be dimmed and/or has good louvres with a clear cut-off angle so the light does not reach the computer screen directly.
The mean illuminance levels from the operating luminaire were lower in the test lighting scenario (T3). The luminance ratio on the operating table may have affected how the personnel adjusted the levels of illuminance from the operating luminaires. Unintentionally, this might influence the personnel to set the operating light at a higher illuminance when the luminance ratio was high, in the belief that more light will enhance their visual ability. The illuminance measurements in the operating cavity might have been somewhat unreliable due to the limited experience and knowledge among the personnel on how to measure. Two nurses had been educated in how to perform the measurements, and they showed it to the rest of the nurses. These levels of illuminance from the operating luminaire have not been measured in any previous studies. Therefore, it could be an indicator of the actual levels used in the operating cavity.
Further research is needed to clarify the application of increased illuminance levels surrounding the operating table. In this study, it was not possible to investigate different illuminance levels under the same CCT, but this would be interesting to study more closely. Questions also arise regarding the lighting recommendations at night. This needs extensive research to consider both visual ability, patient safety and the effects on the circadian rhythm of staff. It would also be interesting to see what levels of illuminance are actually required in the operating cavity for different types of surgical procedures.
5. Conclusions
Increased general lighting illuminance (from 1000 lx to 2000 lx) and an increased CCT (from 3000 K to 4300 K) improved visual ability for operating personnel. The tiredness experienced among personnel decreased, and better general lighting may be an efficient way to improve surgical results and medical safety. The current lighting recommendations for daytime use of operating theatres/operating rooms should, according to this study, be changed to higher recommended illuminance values, such as 2000 lx for the general lighting at the periphery of the operating theatre, 4000 lx around the operating table and 5500 lx on the operating table. This requires an increase in energy use, but will very likely improve visual ability and patient safety. For night time use, more studies are needed to examine the effects on the personnel’s circadian rhythm. The anaesthetic area and its surroundings should also be considered closely. Due to the high levels of illuminance, the placement of luminaires and any louvres on luminaires needs to be considered thoroughly. Luminaires behind monitor screens used during surgery should be turned off, dimmed and be asymmetric (projecting light towards the walls) or be well shielded to avoid the risk of reflected glare for the anaesthetic personnel. The illuminance at the anaesthetic computer screens should be adjusted so that it does not decrease screen visibility.
The highest level of illuminance from the operating luminaire (100,000 lx) resulted in higher luminance ratios and thus a higher likelihood of glare and prolonging the duration for personnel to visually adapt to work tasks outside of the operating field. Too much light from the operating luminaire can thus cause problems for the medical staff members requiring good visual acuity outside of the operating field. Many staff members reported eyestrain in the laboratory study, indicating problems with the visual ability. An illuminance level between 50,000 lx and 100,000 lx is probably sufficient for the task, but more studies are needed to reach more specific conclusions.
Footnotes
Acknowledgements
The authors wish to thank the personnel at the Operating Department at Helsingborg Hospital, Sweden, for participating. Thanks, also, to Yiyi Xu and Marcus Runefors who have performed part of the statistical analysis and Eja Pedersen for statistical analysis and supporting discussions, all at Lund University. We also wish to thank professors Per Odenrick and Gerd Johansson at Lund University for their support in the study layout and writing the paper.
Declaration of conflicting interests
The authors declared no potential conflicts of interest with respect to the research, authorship, and/or publication of this article.
Funding
The authors disclosed receipt of the following financial support for the research, authorship, and/or publication of this article: We thank the Bertil och Britt Svenssons Stiftelse för Belysningsteknik (Bertil and Britt Svensson’s Foundation for Illumination Technology) for financial support. Metalund (Centre for Medicine and Technology for Working Life and Society) and FORTE (Swedish Research Council for Health, Working Life and Welfare) also financed this study.