
Abstract
This study extends previous findings on the effect of different levels of short-wavelength light on human alertness. This study explores the alerting ability of long-wavelength light at two levels (40 lx and 160 lx). Eight subjects took part in the 60-minute experiment for each of two nights, during which their objective alertness and subjective alertness were evaluated using electroencephalogram and questionnaire. Results show that both levels increased electroencephalogram beta power, which shows a different pattern compared with the previous findings on short-wavelength light. These results strongly suggest that although short-wavelength light may impact alertness through circadian system, long-wavelength light will have to achieve that through other pathways. The further comparison between current and previous results also suggests that long-wavelength light is just as strong on acute alerting ability, as shown by electroencephalogram measures and self-rating questionnaire, as short-wavelength light.
1. Introduction
Light influences a range of human biological functions, apart from vision, referred as the non-image forming (NIF) effect. Light is now known to be a potent stimulus for modulating circadian rhythm, hormonal systems, core-body temperature, sleep and even gene expression. 1 Studies have shown that these biological effects of light are associated with the melanopsin-containing intrinsically photosensitive retinal ganglion cells (ipRGCs), in addition to the conventional rods and cones.2,3 Bright light exposure is shown to change the alertness-related cortical structure in the brain. 4 The alerting effect of light differs with wavelength, due to the spectral sensitivity of the ipRGCs to light. Experiments have demonstrated that short-wavelength light (460 nm) has a stronger alerting effect than shorter (430 nm) or longer wavelengths (550 nm or 630 nm).5,6 The ipRGCs have maximal sensitivity at around 480 nm, which is attributed to the presence of melanopsin. However, light can still impact NIF functions in the absence of ipRGCs through rods and cones. 3 And animals that cannot detect light for NIF effect are still capable of image formation. 7
Although earlier studies have linked the alerting effect of light to its ability to suppress melatonin, more recent studies have demonstrated that melatonin change is actually not needed to produce these effects. In one experiment conducted in the afternoon, during which melatonin level is low and has little impact, light exposure still showed an impact on both objective and subjective alertness. 8 Another study conducted in the early morning hours also suggested that the alerting effects of light may be mediated by mechanisms independent of acute melatonin suppression. 9 A study suggested that both short-wavelength and long-wavelength lights increased alertness at night, as shown in EEG power change, whereas only short-wavelength light suppressed melatonin significantly. 10 Another study compared white (2568 K) light and red (630 nm) light and showed that melatonin levels were suppressed by white light only. Results also suggested that red light can improve both alertness and certain types of performance at night without suppressing melatonin. 11
Many other studies have suggested that the underlying mechanism, by which light exposure improves alertness, is not solely driven by short wavelengths through melanopsin. However, it would be difficult to determine these mechanisms because light has multiple effects on brain activities through parallel pathways. 12 For example, studies suggest that ‘warm’ colours such as red and yellow evoke feelings of arousal, while ‘cool’ colours such as blue are associated with calming feelings. Red, especially, has been associated with feelings of danger, rage and excitement. Red is also suggested to increase human receptiveness to external stimuli, therefore affecting the emotional responses. 13 The colours green and blue, in comparison, are associated with feelings of relaxation and calmness. 14
Electroencephalogram (EEG) measurements are often used to evaluate acute alertness change. EEG power fluctuations might reflect the immediate neuroendocrine responses, since light can have an impact on EEG measures independent of melatonin levels. 11 Some studies have looked into how exactly short-wavelength and long-wavelength light exposure impacts EEG power. Two levels (10 lx and 40 lx) of blue and red lights were both found to increase EEG beta power and reduce sleepiness. 12 Another study found that both 10 lx and 40 lx were effective for the blue light, but only 10 lx, not 40 lx of red light significantly affected the EEG. 10 Red light is even suggested to be a stronger alerting stimulus in the afternoon than blue light, which might be explained by the idea that long-wavelength cones mediate the alerting effects of red light during the daytime. 8 These studies have shown that both long-wavelength and short-wavelength light of the same corneal illuminance evoked similar alerting effects (i.e. increased EEG beta power); however, the pathway mediating nocturnal melatonin suppression might not be the same as that mediating other physiological responses to light exhibited by the endocrine and the autonomic nervous systems. 15
In a previous study, we have investigated the alerting effect of short-wavelength light at three light levels (40 lx, 80 lx and 160 lx) in the evening. 16 Results showed that 160 lx light significantly increased alertness, as evaluated by EEG and self-rating questionnaire (Karolinska Sleepiness Scale, KSS). This study aims to expand on the previous work by investigating the impact of long-wavelength on the measures of EEG power and KSS.
2. Method
The objective of this study, specifically, is to investigate the effect of two levels (40 lx and 160 lx) of a long-wavelength light (λmax =640 nm), compared to remaining in darkness (<1 lx), on human alertness during the evening.
2.1 Test participants
Eight participants (aged 28 ± 3.6 years; five females and three males) were recruited for this within-subject, two-session study. In order to give comparable results, these are the same eight participants who also took part in the previous experiments. All participants reported their individual sleep/rise time as well as their daily consumption of nicotine, caffeine and alcohol before taking part in the experiment. Smokers and those who were rated as extreme late chronotypes were excluded (The bedtime reported by participants range between 10:30 p.m. and 12:30 a.m.). The study was approved by the University of Leeds Ethics Committee and all participants signed informed consent prior to the experiment. An information sheet was also given to participants and they were requested to refrain from caffeine and alcohol three hours prior to the experiment, and to try to maintain a regular, constant sleep/rise schedule during the experimental period of time. The results produced from these eight participants are reported here.
2.2 Lighting conditions
Light exposure was delivered through 12 LED cubes (provided by Thouslite Lighting System) mounted in the ceiling of a room with white walls and grey carpets. The lighting system provides spectrally tunable lighting based on multi-channel LED technology. Participants were asked to sit under the light while reading, with a table in front of them (Figure 1). The lighting measures were taken within the flat reading area on the table.
The lighting environment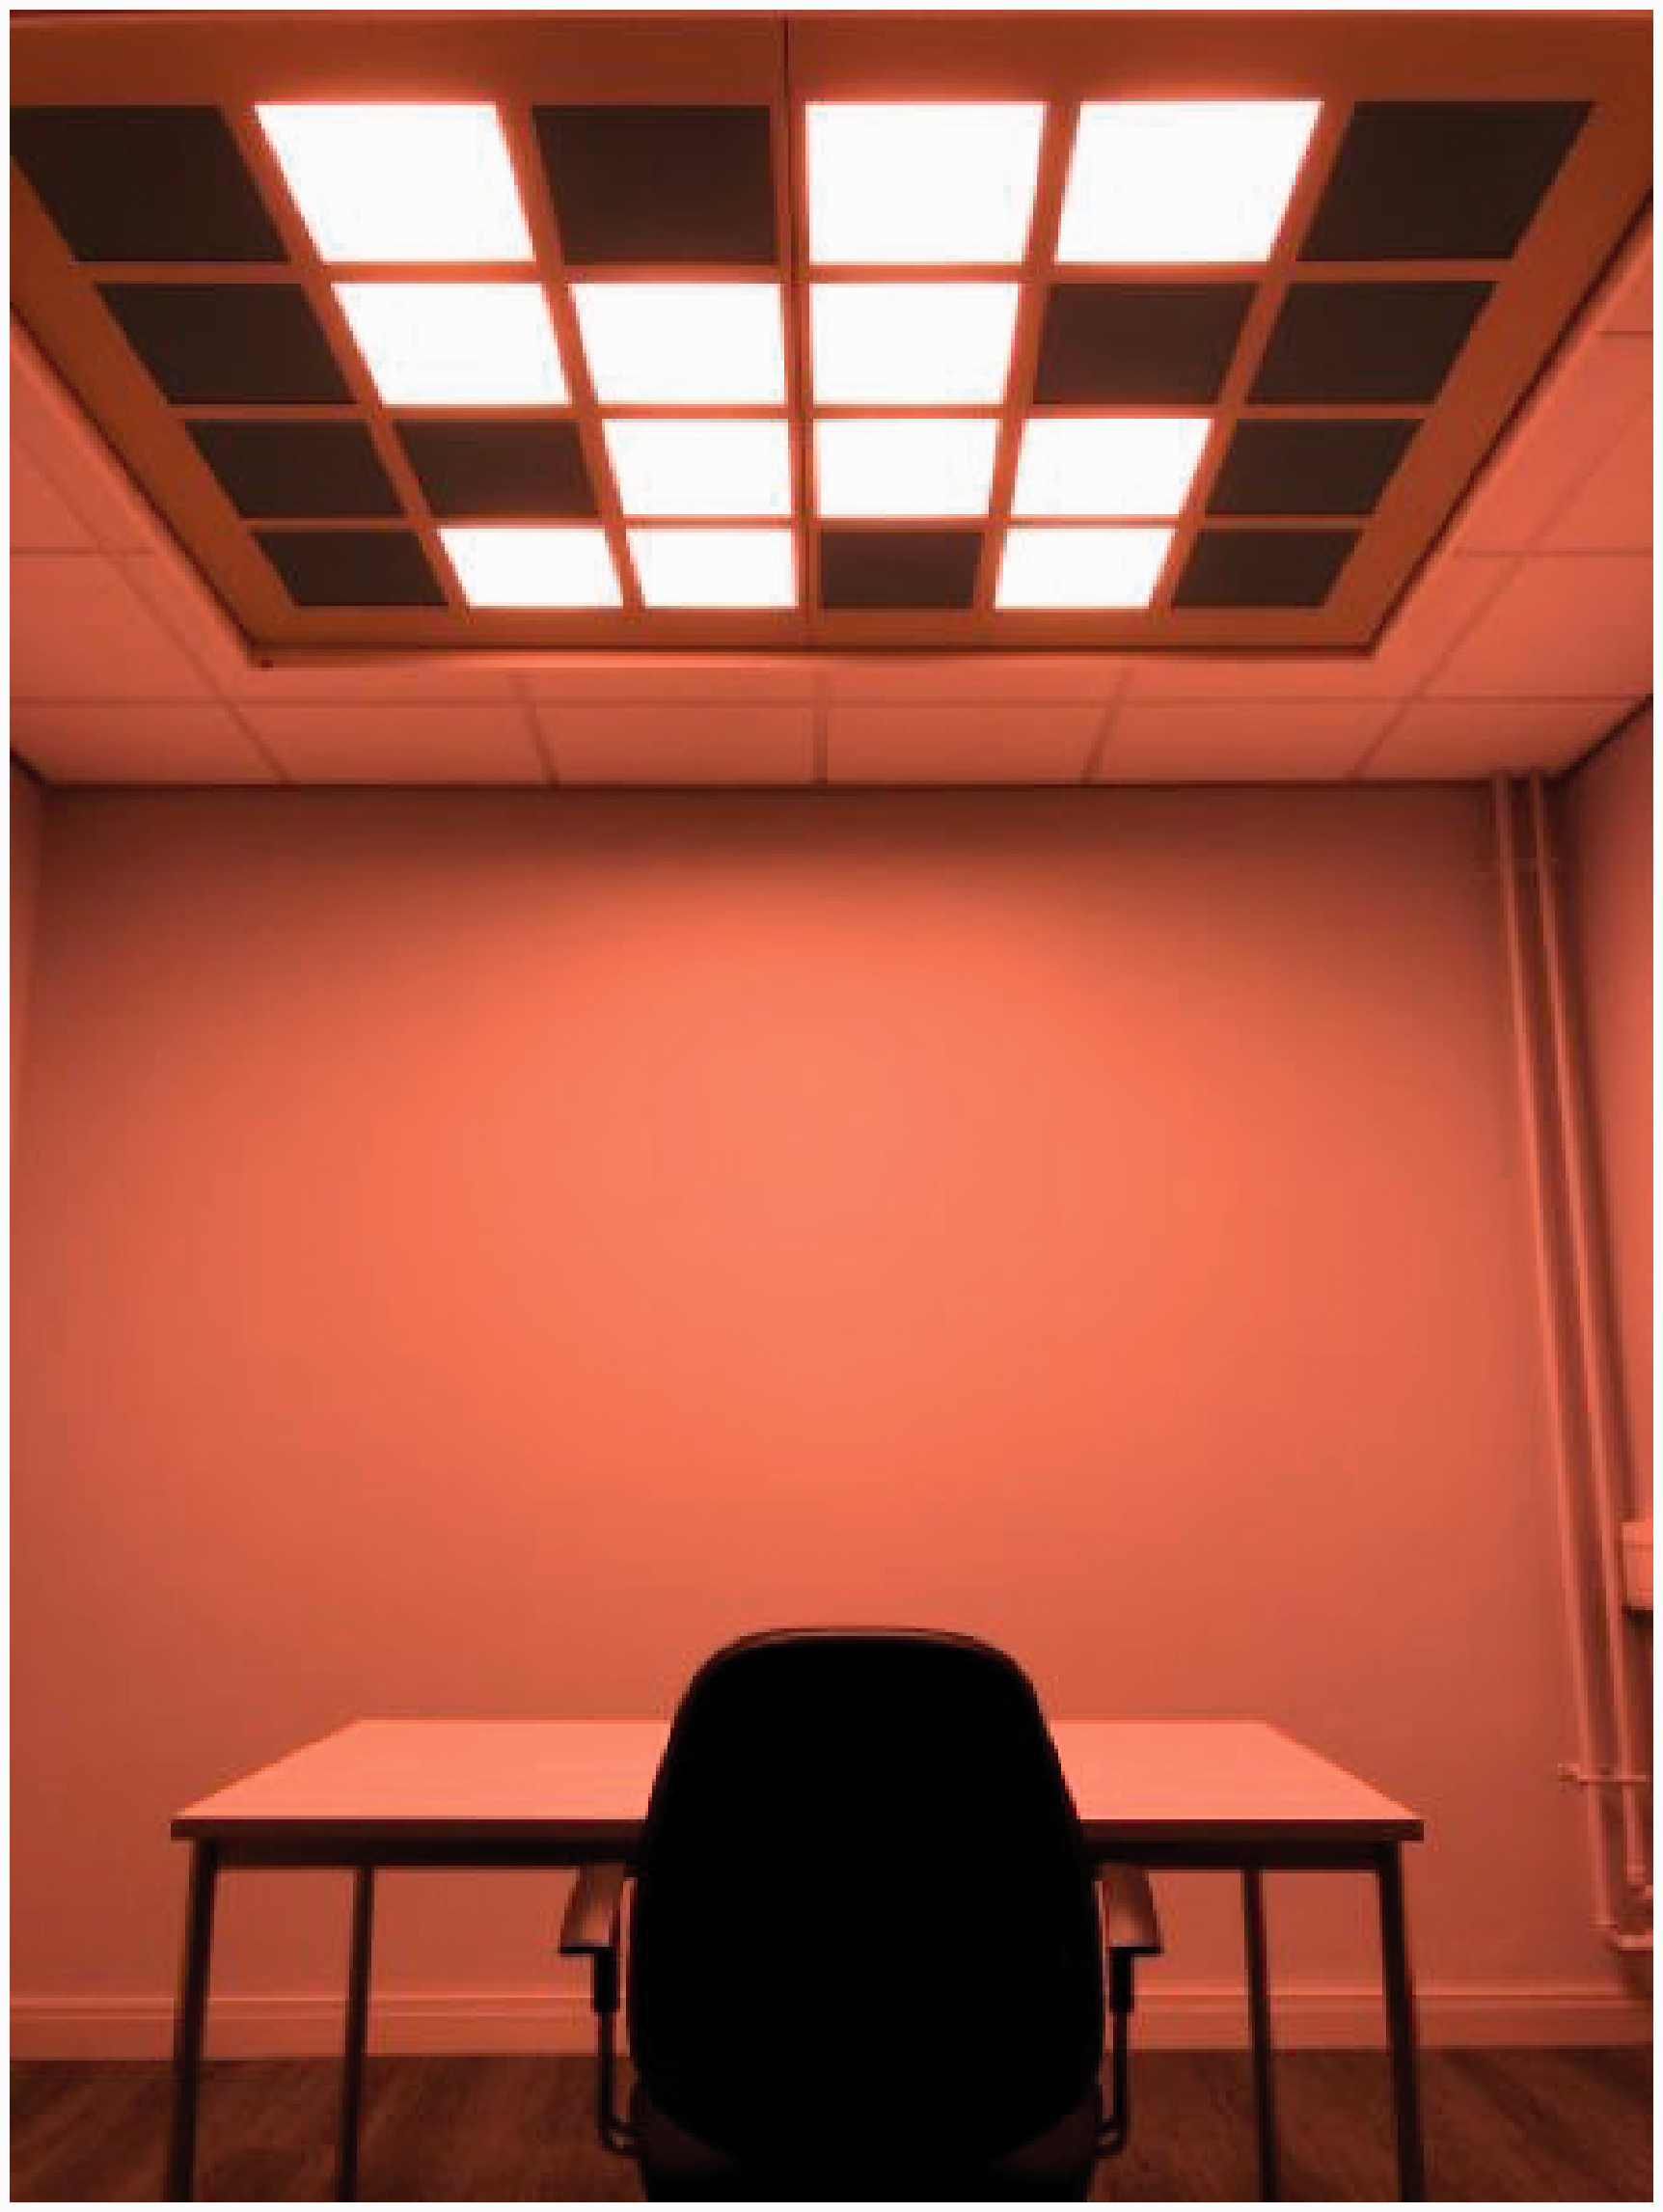
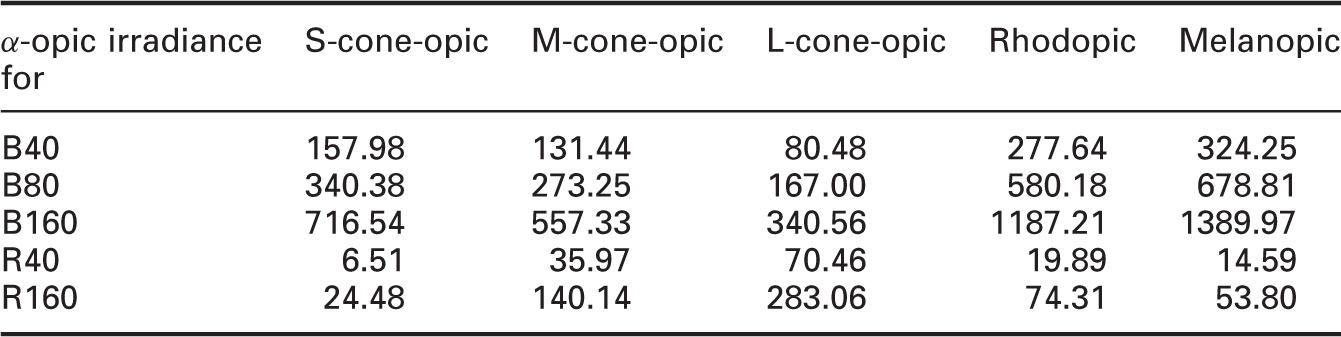
Two long-wavelength light conditions were used. They are two illuminances on the table, 40 lx (R40 lx) and l60 lx (R160 lx). The light levels at the eye are 16 ± 1 lux and 52 ± 1 lux, respectively. They had a peak at 630 nm (40 lx) and 640 nm (160 lx) with a full width at half maximum of 25 nm. The spectra of the two lighting conditions were measured with an X-Rite i1Pro spectrophotometer and are shown in Figure 2. The α-opic irradiance for each lighting was calculated according to CIE S 026 /E:2018.
17
To better compare the results, α-opic irradiances of the three short-wavelength lights from the previous study (B40, B80 and B160) are also listed (Table 1).
Spectral power distribution of two lighting conditions α-opic irradiances (mW/m2) for six lights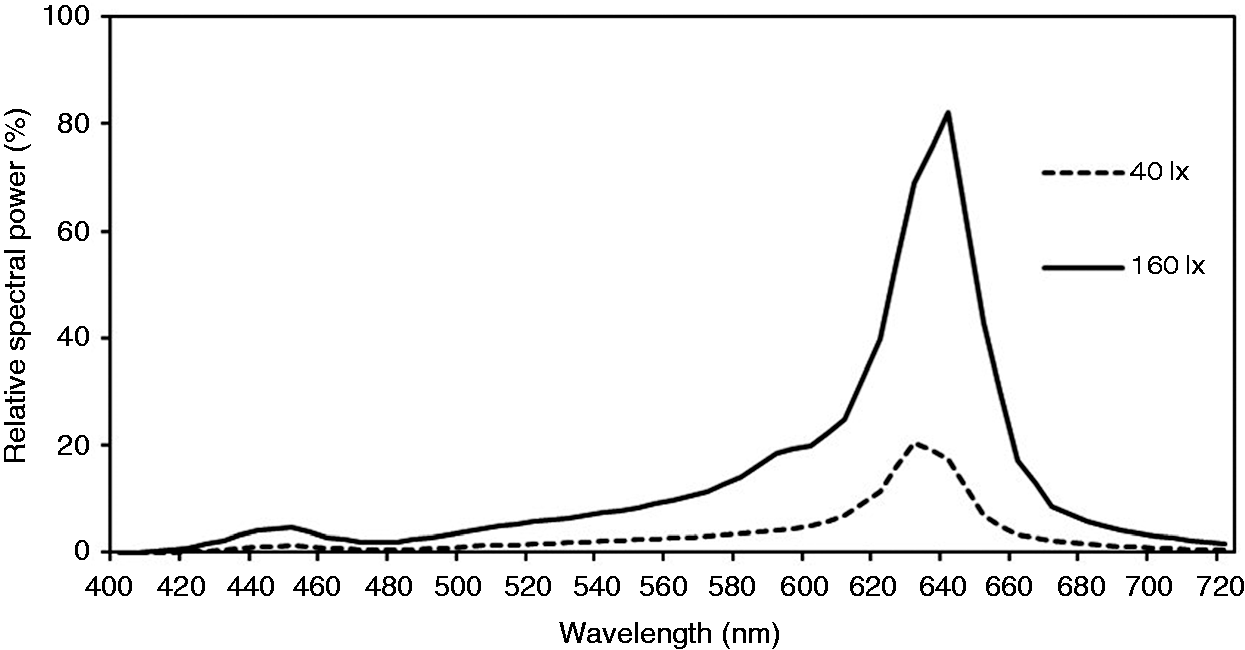
2.3 Experiment protocol
Experiment protocol of this study is kept consistent with the previous study. 16 Each participant completed two sessions over two nights, starting at around the same time (8 p.m.). Participants were fitted with EEG electrodes prior to the start of the exposure. The order of the conditions (R40 lx and R160 lx) was presented randomly for each participant to avoid potential sequence effects. Sessions were separated by at least 72 hours for the same participant to avoid potential carry-over effects.
EEG was continuously recorded over 60 minutes during the experiment. EEG data were collected using B-Alert Live Software (BLS) with a wireless Advanced Brain Monitoring (ABM) EEG device (X10 headset with standard sensor strips). Recordings consisted of EEG with nine electrode positions (Fz, Cz, Oz, F3, F4, C3, C4, P3 and P4) and two reference mastoid electrodes. The electrode impedance test was performed several times during the experiment to ensure the good quality of the signal acquisition. The EEG signal was band-passed from 1 to 40 Hz and decontaminated using ABM's validated artefact identification and decontamination algorithms which identify and remove five artefact types include electromyogram (EMG), electrooculogram (EOG), excursions, saturations and spikes. Power spectral density (PSD) was computed by performing Fast Fourier Transform (FFT) with application of a Kaiser window. PSD of selected 1-Hz bins was averaged after application of a 50% overlapping window across three 1-second overlays.
Participants were exposed to light for 60 minutes in each session. Red lights were energised for 40 minutes, preceded by a 20-minute dim (<1 lx) period.
Subjective sleepiness was evaluated using the Karolinska Sleepiness Scale (KSS), a self-reporting scale that ranges from 1 (‘extremely alert’) to 9 (‘very sleepy, fighting sleep’).The KSS was rated three times (every 20 minutes – at the 20th, 40th and 60th minutes) during each session. Participants were asked to rate themselves from 1 to 9, according to their sleepiness. For the duration of the 60 minutes, the participants were free to read a book. They were also asked to keep their eyes open and reduce head movement throughout the experiment. No other activities (e.g. using electronic devices, eating or talking) were allowed (Figure 3).
Experimental design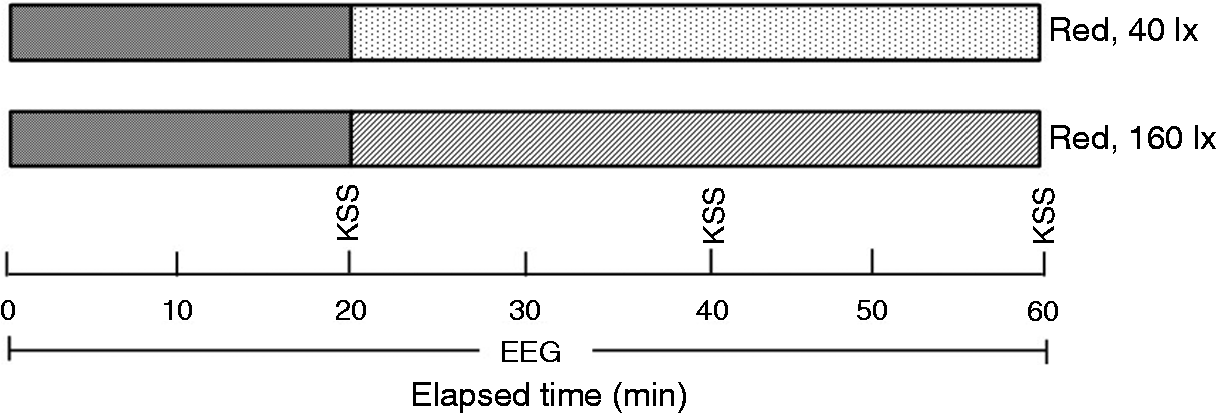
3. Results
3.1 EEG
EEG measures collected from nine electrode sites were averaged to produce overall EEG PSD, and then grouped into 5–9 Hz (theta alpha) and 13–30 Hz (beta) frequency bins. EEG alpha power (8–12 Hz) was extracted from Oz and Cz, where the signals are stronger.
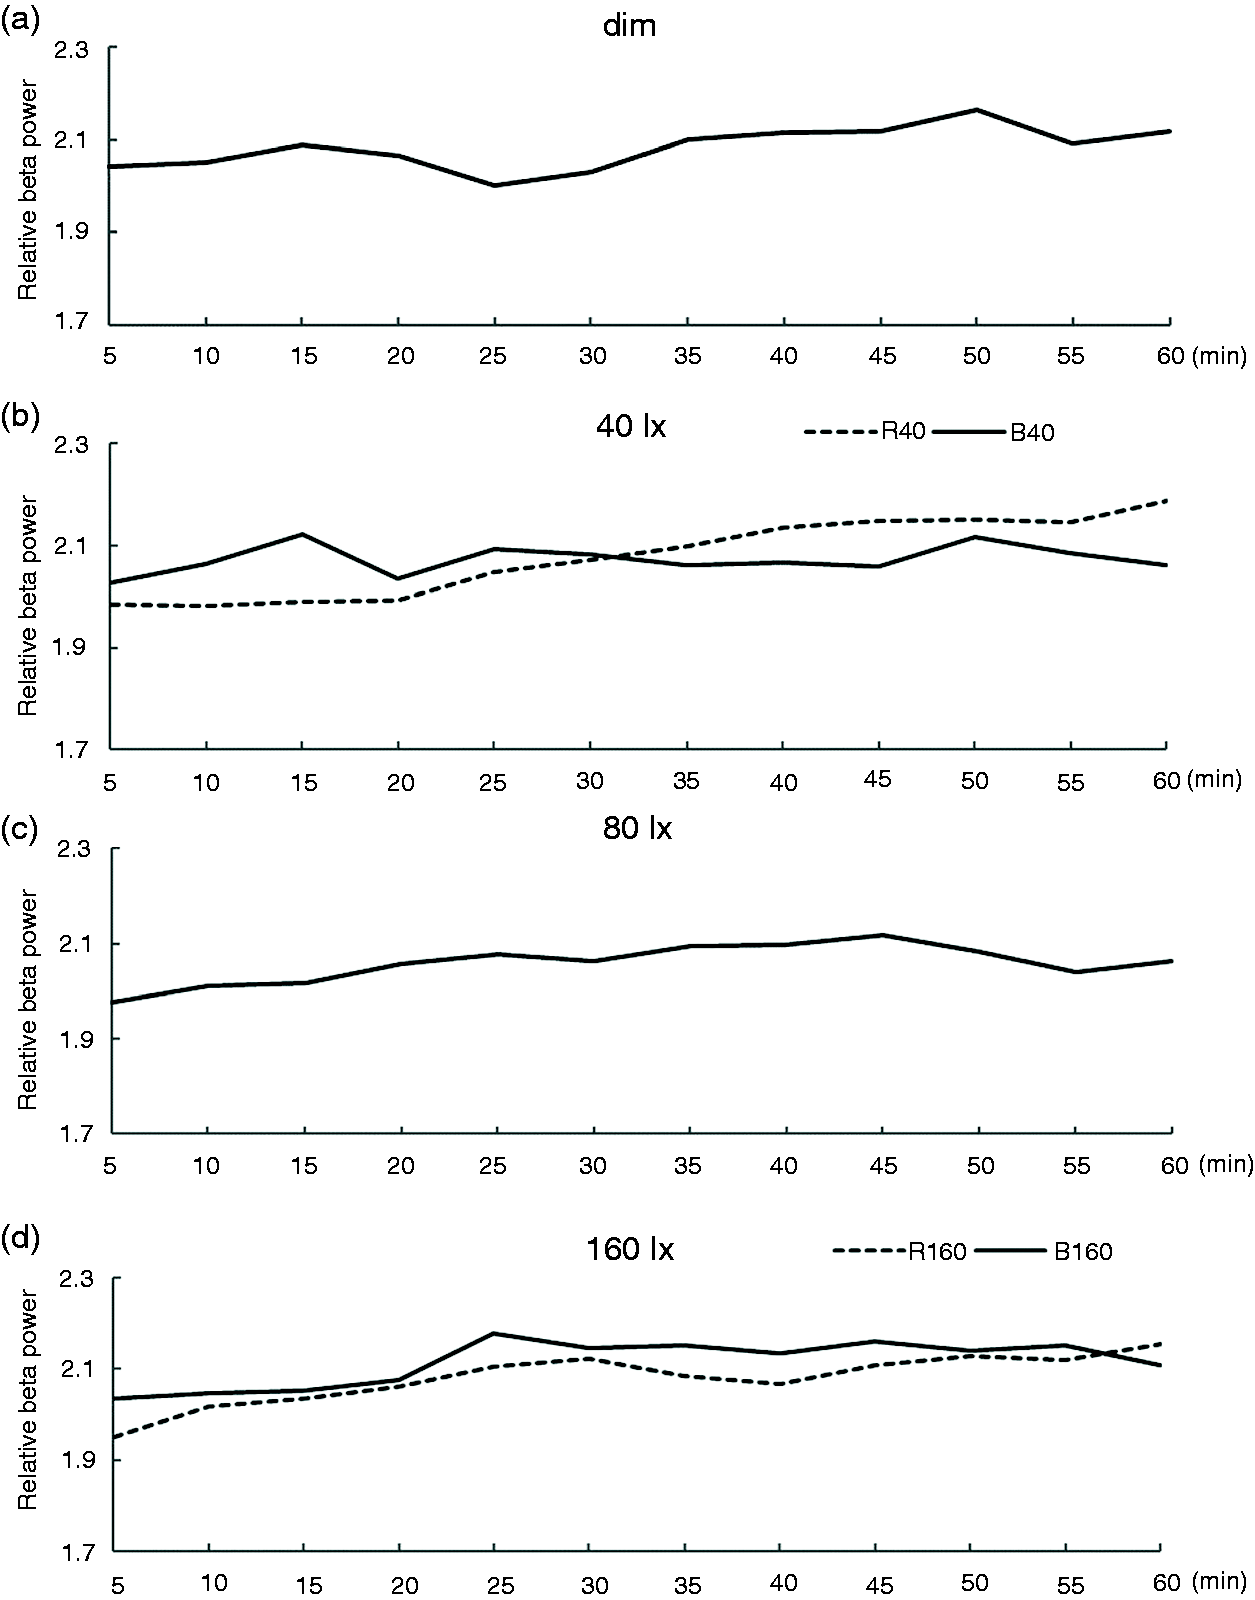
EEG beta power change during the 60-minute exposure for six lighting conditions (dim, R40, R160, B40, B80 and B160) is plotted in Figure 4. Figure 4 shows the beta power changes every minute (where beta power is averaged over every minute). Figure 5 shows the power change every 5 minutes (where beta power is averaged over every 5 minutes).
EEG beta power change during exposure at 1-minute intervals EEG beta power change during exposure at 5-minute intervals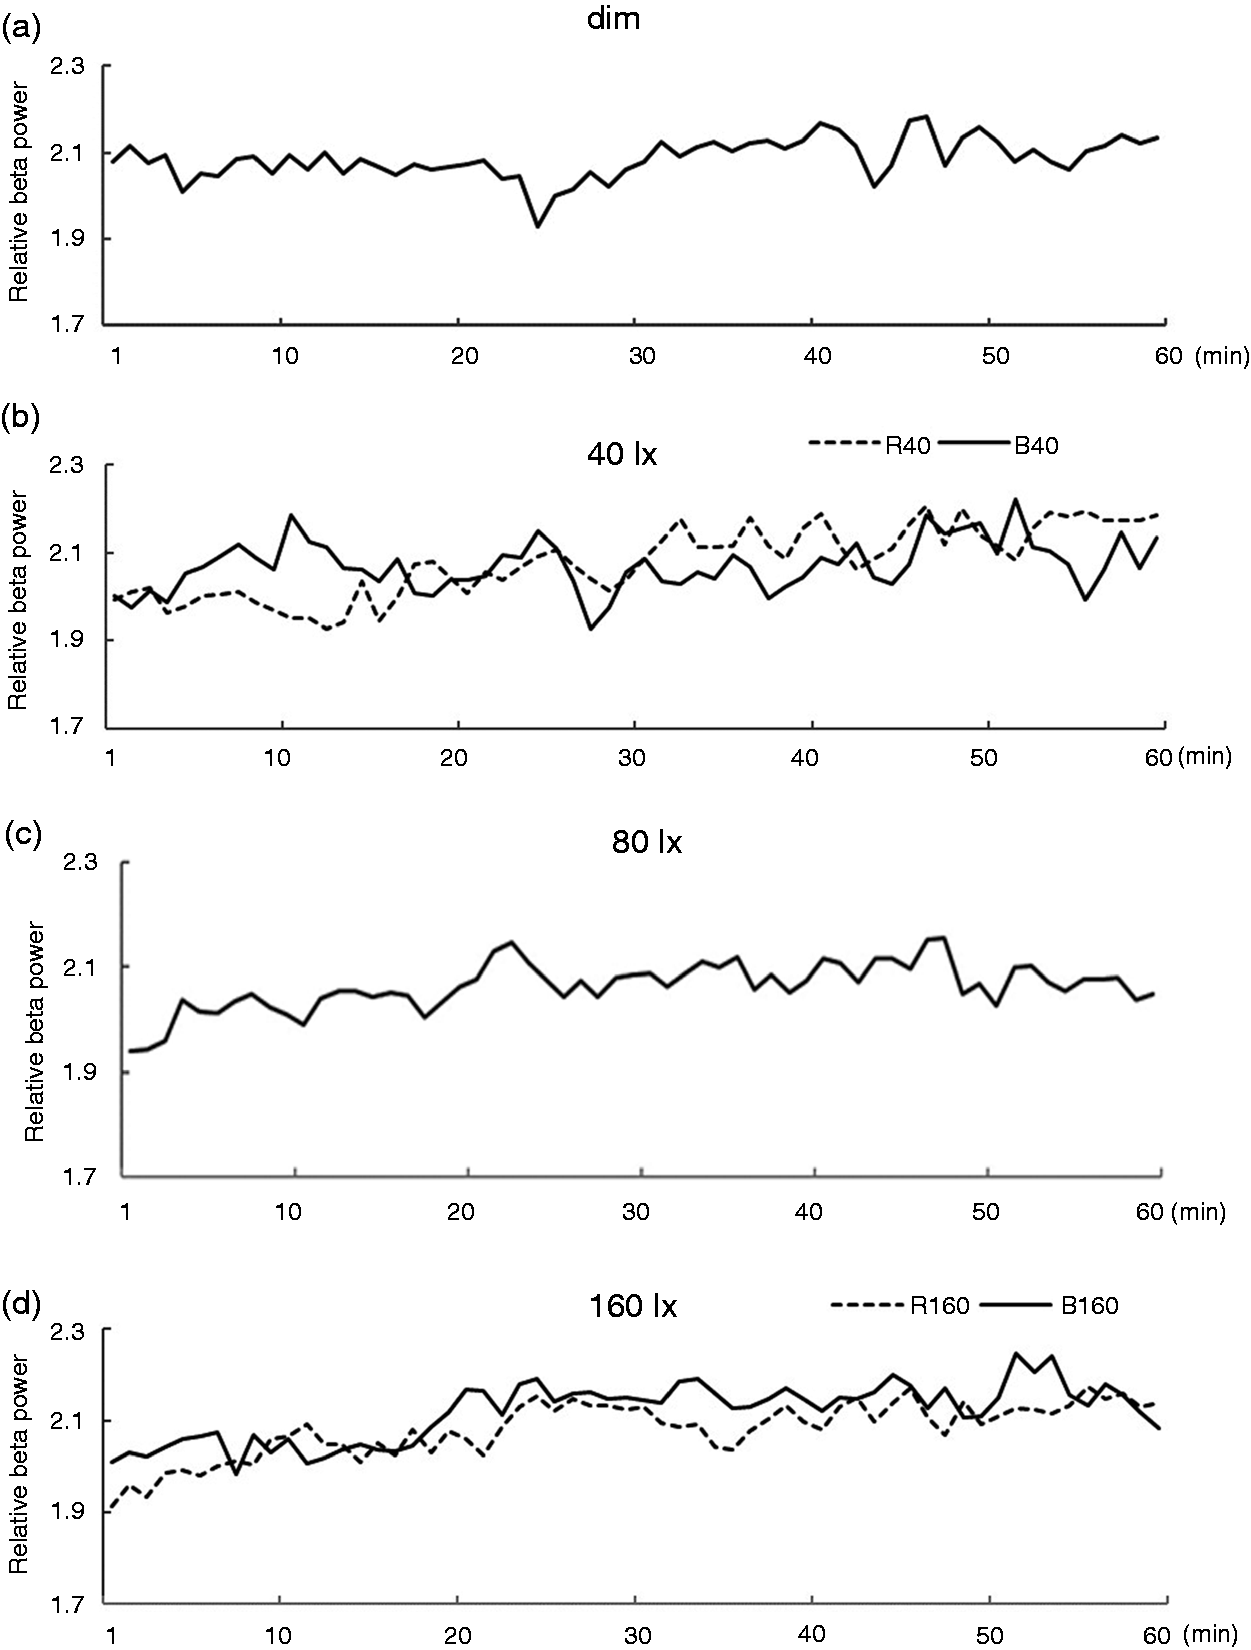
Pairwise comparisons for EEG beta power
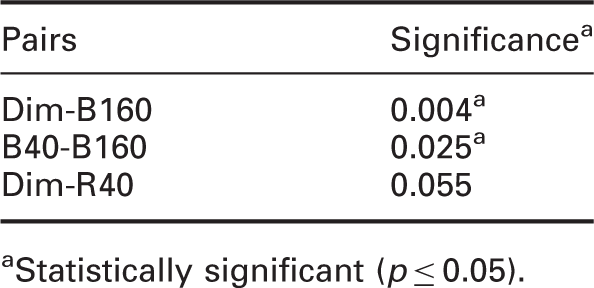
Statistically significant (p ≤ 0.05).
One-way ANOVA revealed a significant main effect of lighting condition in theta alpha (F(5,42) = 2.490; p = 0.046) and beta (F(5,42) = 4.894; p = 0.001). No significant difference was observed in alpha (F(5,42) =0.983; p = 0.439). Post hoc pairwise comparisons found significant differences between Dim and B160, B40 and B160 in beta range (Table 2). Figure 6 shows the results of normalised power for six lighting conditions in three frequency ranges studied (where * indicates statistical significance). Note that the results of dim, 40 lx, 80 lx and 160 lx Blue light from the previous study
16
are added in Figure 6 to give a better comparison. The results showed that EEG beta power is significantly higher after exposure to 160 lx Blue light than remaining in Dim light (p < 0.05). Exposure to 40 lx Red light has also increased beta power although this did not quite reach statistical significance (p = 0.055).
Mean ± standard error of the mean of normalised EEG power for three frequencies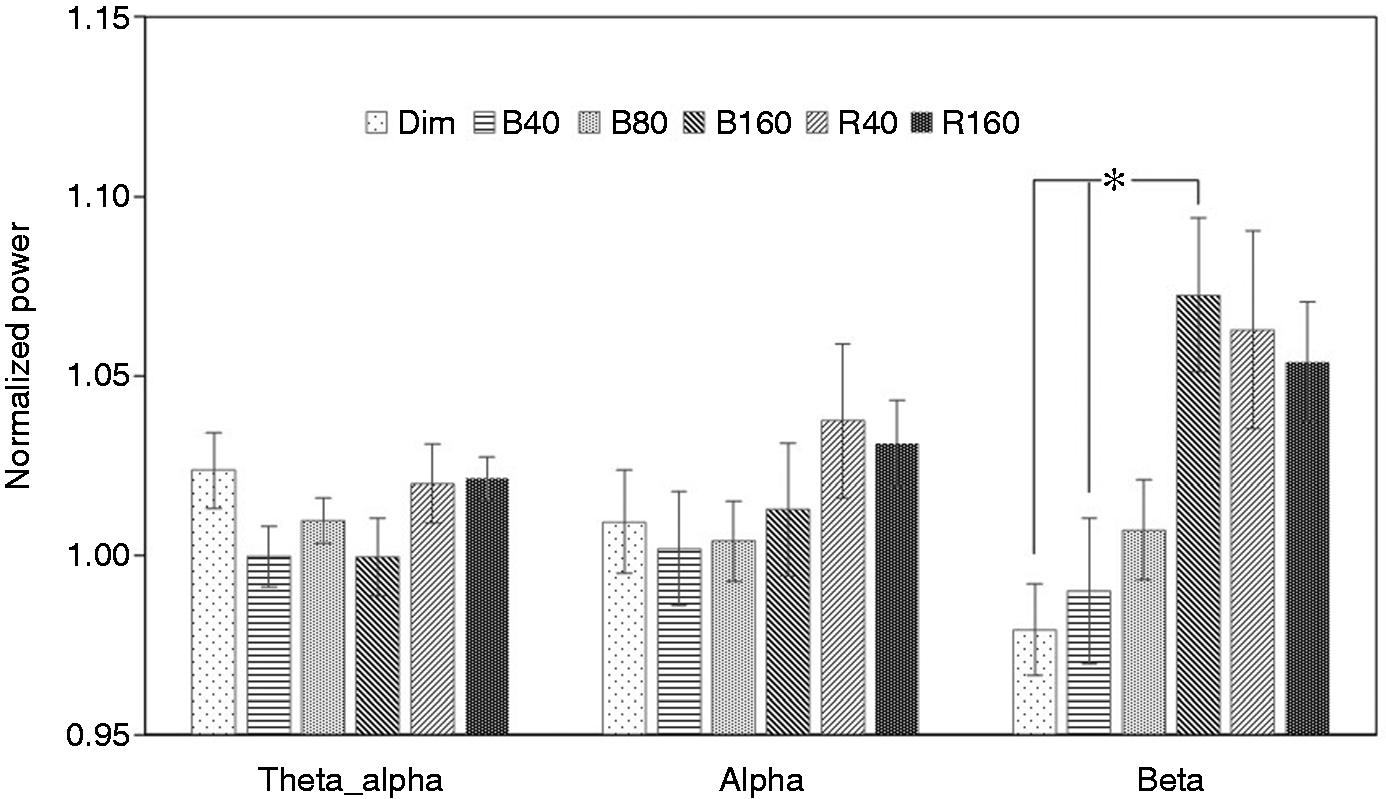
Lighting conditions (6) × time (3) ANOVA results for EEG beta power
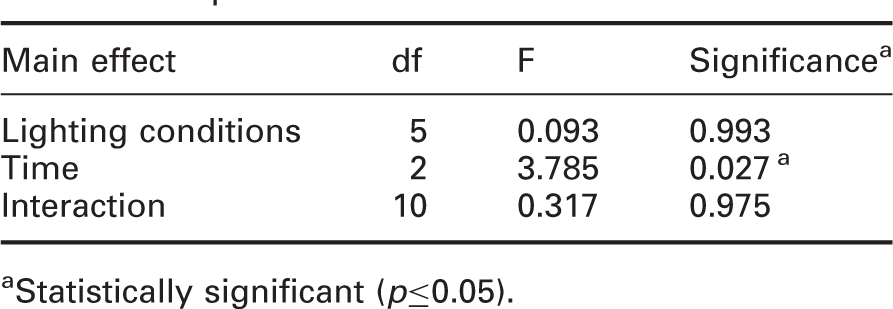
aStatistically significant (p≤0.05).
3.2 Subjective sleepiness
Pairwise comparisons for KSS scores
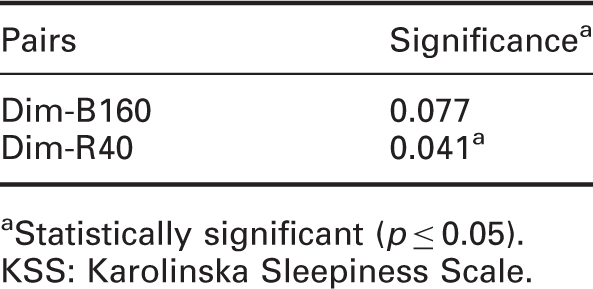
Statistically significant (p ≤ 0.05).
KSS: Karolinska Sleepiness Scale.
One-way ANOVA revealed a significant main effect of lighting condition (F(5,42) =3.422; p = 0.011). Post hoc pairwise comparisons found a significant difference between Dim and R40 conditions. Figure 7 shows the results for the normalised KSS scores under six lighting conditions (where * indicates statistical significance). Mean score in R40 condition is significantly lower than the score in the Dim condition (a lower KSS score means more alertness).
Mean ± standard error of the mean of normalised KSS scores (lower scores indicate greater alertness)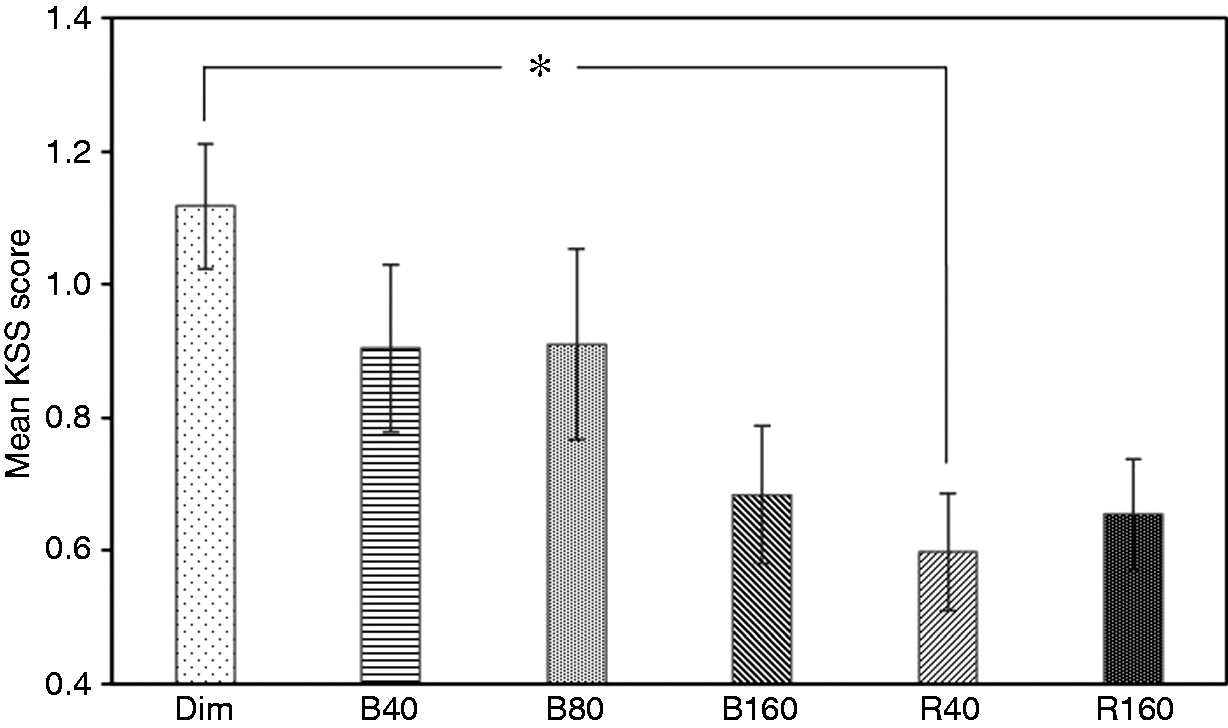
4. Discussion
In a previous study, 16 we compared short-wavelength lights at three levels (40 lx, 80 lx and 160 lx) and it was observed that exposure to 160 lx light significantly increased EEG beta power compared to remaining in the Dim condition. Since the increase in EEG beta power indicates greater alertness, combined with other statistical results of EEG and KSS, we concluded that 160 lx light significantly increased alertness compared to the Dim, 40 lx, and 80 lx conditions, whereas 40 lx and 80 lx light did not show a statistically significant effect.
In this study, we investigated how exposures to long-wavelength lights of two different levels (40 lx and 160 lx) affect objective (EEG) and subjective (KSS) alertness during the night time. The results are then compared with the result of Dim condition in the previous study. A significant effect of light levels on EEG beta (13–30 Hz) power was observed. Exposure to both 40 lx and 160 lx long-wavelength lights significantly increased beta power compared to the Dim condition. Both exposures also increased EEG high alpha power, although this did not reach statistical significance. The effect on theta alpha and lower alpha power is not noticeable. However, no significant difference between 40 lx and 160 lx long-wavelength lights is observed.
The results of subjective alertness (KSS) scoring are consistent with the EEG results. Participants rated themselves as more alert under both 40 lx and 160 lx lights. Both lighting conditions have significantly lower scores than that under the Dim condition (where lower scores indicate higher alertness), this again shows a significant alerting effect of two lights compared to Dim light. There is no statistically significant difference between the KSS scoring of the two lights. As in the previous study, participants were asked to report significant changes on their bed time and any other unusual feelings (including sleep problem) on the second day after experiment. There was no report of unusual bed time shifts or sleep difficulties.
So far very few studies have compared the effect of light levels of short-wavelength and long-wavelength light on alertness. In the related study that looked into this topic, usually only two levels (10 lx and 40 lx) are investigated.8,9,18 This study extends the research on the effect of light levels on light-induced alertness. The findings suggested several interesting points.
Firstly, the results have shown again that melatonin suppression is not needed for a light-induced alerting effect. The long-wavelength lights tested in this study have very low S-cone-opic, rhodopic and melanopic irradiance values, as showed in Table 1, compared to the Blue light previously tested. However they are as effective as the Blue light in promoting alertness. This clearly suggests that if a long-wavelength light that is ineffective for stimulating the melatonin change had an impact on alertness, it would have to occur via a different pathway (other than the circadian system). Several studies have shown that cutting the blue portion of the light spectrum (in various ways) resulted in significantly reduced melatonin suppression.19,20 However, short-wavelength attenuated or filtered white light which hardly suppress salivary melatonin concentrations showed no adverse effect on alertness or performance as compared with bright light.21,22 These are also indirect evidences that melatonin suppression is not necessary for us to observe an alerting effect of light.
Secondly, in previous study, 16 only 160 lx blue light significantly increased alertness. 40 lx and 80 lx blue lights seemed to have an effect, though it is not statistically significant. The two long-wavelength lights tested in this study, however, both showed statistically significant effects. We previously concluded that a certain level of light is needed to induce alertness. The results in this study suggested that this threshold level is not the same for light of different spectral composition, as 40 lx long-wavelength light has already significantly increased alertness. It seems that for short-wavelength light, a higher level of light is needed to produce a significant effect on EEG measures and KSS. Traditionally, a ‘cool colour’ (such as blue) is associated with the feeling of calmness, which seems to be contradictory to the idea that blue light promote alertness. One argument for this could be that short-wavelength light impact alertness mainly through the change of melatonin level (although this might not be the only pathway), which presumably will have to take a certain period of time. Therefore, short-wavelength light, compared to long-wavelength, might take a longer duration before showing a noticeable alerting effect. Blue light also has a much higher melanopic irradiance, as listed in Table 1, than long-wavelength of the same light level, which indicates that blue light triggers ipRGC (melanopic) response much more strongly. This again showed that one of the important ways through which blue light affects alertness is circadian system, whereas long-wavelength light has achieved this mainly through other pathways.
Comparing the EEG and KSS results under each lighting condition with their corresponding α-opic values, alertness seems to increase as the increasing α-opic irradiance for the blue lights. However, this does not seem to apply to the red lights. This again showed the first point we made that red light might impact alertness mainly through other paths (apart from the circadian system). For blue lights, there seems to be a dose–response relationship between alerting effects and their α-opic metrics. This would require further study to find out more.
It is also noticeable that two levels of lights (40 lx and 160 lx) tested in this study are not significantly different from each other in promoting alertness. It seems clear that the relations between light levels and alertness change are not linear. The first question raised from this is whether red (long-wavelength) light is actually more effective than blue in terms of acute alertness change? Additionally, 10 lx of red light is also found to significantly affect the EEG measures compared to preceding dark conditions. 10 It remains unknown whether there is an optimum light level of red light for alertness, and these results definitely demand further study.
5. Conclusions
This study expanded the previous work on the effect of light levels of short-wavelength on alertness. Two light levels of long-wavelength lights were investigated with the same experimental methodology and the results have shown that long-wavelength is as effective as blue light in promoting acute alertness. This study is also a validation of the notion that melatonin is not the only pathway regulating alertness and long-wavelength light impacts alertness through another mechanism. This study also provides some evidence that the relation between long-wavelength light and alertness change is not linear and further study is required to explore on this issue.