



Abstract
A field study was conducted to investigate how changes in the illuminance affect pedestrian reassurance when walking after dark in an urban location. The field study was conducted in daytime and after dark in order to employ the day–dark approach to analysis of optimal lighting. The results suggest that minimum illuminance is a better predictor of reassurance than is mean illuminance. For a day–dark difference of 0.5 units on a 6-point response scale, the results suggest a minimum horizontal illuminance of approximately 2.0 lux.
1. Introduction
When choosing to walk a potential pedestrian will consider the degree of risk involved in making that journey. Reassurance is the confidence a pedestrian might gain from road lighting when deciding to walk after dark 1 and is an important consideration because those people who feel safer are likely to engage in more walking behaviour,2,3 a benefit for personal health and a benefit to the alleviation of transport problems if more people walking means fewer people using motorised transport. The likely risks include tripping accidents, 4 being victimised,5,6 and not being seen by drivers of motorised vehicles. 7 Road lighting is expected to alleviate these risks because better lighting can change how well people can see: increasing the adaptation luminance increases the speed of visual processing, improves the discrimination of detail, makes colour judgements more accurate and increases the distance at which we can see anything suspicious. 8
Using a qualitative approach it has been shown that the presence of road lighting enhances reassurance to a degree similar to that of access to help and greater than that provided by the physical features of an environment associated with prospect and refuge. 1 Confirmation is found in Loewen et al. 9 who found that 42 of 55 respondents mentioned lighting when asked to list ‘features of the environment that they believed could make it safe from personal crime’; it was the most frequent category of response, above other factors such as open space and access to refuge. Lighting may be seen as more important because it positively affects these other characteristics, or more specifically, one's ability to see the degree of prospect and refuge. 10 The next question is what are the ideal characteristics of light? This article considers the amount of light, as might be defined by the illuminance on horizontal or vertical surfaces, and does not consider further parameters such as the spectral power distribution of light.
A common approach is to evaluate road lighting after dark, asking test participants to describe their level of reassurance using a category rating scale. There are three limitations to this approach.
The first limitation concerns stimulus range bias. In many studies there are two levels of lighting (e.g. lower and higher levels of illuminance or brightness) and these tend to show a higher rating of safety with the higher light level.9,11–16 This is a trivial result because no matter what light levels are used, the higher level will always be rated as safer, leading to a recommendation for that higher light level. 17 So, while in one study 16 a horizontal illuminance of 1.31 lux was considered safe compared with 0.24 lux, an even higher illuminance of 12 lux is still inadequate because in a separate study 13 it led to lower ratings of safety than did an illuminance of 17 lux. An explanation for this result is stimulus range bias, as has been demonstrated in evaluations of perceived safety. 17 Range bias arises from the inability of respondents to make absolute judgements of reassurance (or other quantitative evaluation) but instead map the range of observed stimuli to the range of available response categories. 18
The second limitation is that comparing ratings of reassurance captured after dark does not account for variations in the baseline level of reassurance in an area. Consider a study where lighting characteristics are compared by evaluating after dark several differently-lit locations: any effect of those differences in lighting is confounded by changes in other environmental differences, such as variations in signs of incivility, which may enhance or deflate the apparent effect of differences in lighting.
A third limitation is the difficulty in establishing the needs of a typical pedestrian. For after-dark ratings, the advice to designers would be to recommend the light level associated with a specific point on the response scale. This was the approach used by Simons et al. 19 the results of which were used to establish light levels for BS5489-3:1992. 20 Simons et al. used a nine-point rating scale to evaluate the ‘overall impression’ of the lighting with end points labelled very poor (1) and very good (9). The three light levels recommended were those which corresponded to ratings of good (7), adequate (5) and poor-to-adequate (4). This is, however, unlikely to be a robust approach, because the range of illuminances considered introduce range bias, the choice of interpretation points (4, 5 and 7) is arbitrary, and there was no control for the effects of other environmental differences.
An alternative approach is employed in the current study, the day–dark method as pioneered by Boyce et al. 21 In the day–dark method, ratings of reassurance are captured both during daytime and after-dark and the effectiveness of lighting is evaluated against the difference between the daytime and after-dark ratings. Good lighting is that which minimises the day–dark difference. Using the day–dark method, Boyce et al. suggested the optimum illuminance to be 10 lux, as above 10 lux there was negligible reduction in the day–dark difference but below 10 lux there was a significant increase in the difference. That study was, however, carried out in car parks in the United States, these tending to have higher illuminances than typical of pedestrian paths: further work is required to determine if the results hold for other situations.
The day–dark method does not establish an optimal illuminance by the assumption of a point on the response scale, but instead by minimising the day–dark difference. The day–dark method offsets the influence of extraneous environmental differences; in effect, the daytime ratings act as a normalising factor for the baseline level of reassurance in an area to better isolate the effect of road lighting. If this latter point is correct, we might therefore expect the day–dark difference to show a stronger association with the illuminance (or other characteristic of lighting) than does the after dark method. This is because any effect of changes in the illuminance may be partly masked if only the after-dark rating is considered, as it will be confounded by other non-lighting factors. It is known, however, that ambient lighting is associated with the number of pedestrians, with a lower number of pedestrians being present when the ambient light level is lower.22,23 This introduces a confound to the assumption that the day–dark difference completely isolates the effect of road lighting: further research is required to identify the extent of this influence.
If evaluations of reassurance are influenced by range bias, then both the daytime and after-dark evaluations would be equally influenced and the effect would be removed when establishing the difference. If range bias were the only factor influencing the responses then the daytime ratings would be the same as the after-dark ratings leading to a difference of zero. Since the dark ratings established by Boyce et al. were lower than the daytime ratings, this suggests range bias does not explain the whole evaluation, there is some objectivity.
Boyce et al. 21 determined the day–dark difference for the responses to one evaluation (which asked how safe the subject thought it would be to walk alone, with responses given using a seven-point scale). It is not uncommon in past studies for reassurance-type evaluations to be assessed with a single question, such as ‘How safe do you feel being out alone in your neighbourhood after dark?’ or ‘Is there any place around here where you feel unsafe walking at night?.’ Reassurance is, however, a complex concept that may include behavioural, emotional and cognitive factors, and may be better represented by responses to a series of questions, rather than a single question.24–26 A single question offers simplicity and can increase response rates by reducing the length of a questionnaire. However, any single questionnaire item may be open to interpretation by respondents who may use different judgements and evaluations to inform their response. Complex concepts such as reassurance may not be able to be measured by a single question as they are too broad, and therefore a series of different but related questions that tap into different aspects of the same concept may be more appropriate, as is done in other conceptual areas such as quality of life and health. 27 A further benefit to asking multiple questions and summating responses across these to address the same overall concept is an increase in reliability, due to minimising random measurement error resulting from individual variations in how a single question is interpreted and responded to. It would be interesting to determine whether the determination of optimal lighting is affected by questionnaire design, specifically whether it considers the response to one item or multiple items.
Current guidance for pedestrian lighting recommends mean and minimum horizontal illuminances. 28 The basis for the recommended values is unknown. 29 It would also be worthwhile to question the metrics by which road lighting is specified. Studies of lighting and reassurance have tended to consider only average horizontal illuminance, where this average should be determined from an array of measurements across a defined area. 30 Mean illuminance says nothing about the spatial variation in spot measurements of the illuminance: the same mean is possible from installations with low and high illuminance uniformity, and those with low uniformity can present dark, gloomy locations. If a low level of reassurance is associated with the presence of dark, gloomy locations within the field of view, it may be found that the spatial distribution of light provides a better measure of reassurance than does the quantity of light, 31 and there is support for this from a field survey carried out within car parks. 32 Thus, minimum illuminance or the uniformity of illuminance (minimum/mean) may exhibit better association with reassurance than does the mean.
This paper reports a study in which evaluations of reassurance were carried out in several residential roads, in daytime and after-dark, to confirm four proposals.
After-dark reassurance ratings are not significantly associated with mean illuminance. The day–dark difference in reassurance ratings is significantly associated with mean illuminance. The day–dark difference in reassurance ratings is associated better with minimum illuminance or illuminance uniformity than with mean illuminance. Analysis of the day–dark difference conducted using responses to a range of survey items may lead to a different outcome than when conducted using the response to a single survey item.
Finally, the results are used to estimate optimal light level recommendations for minimising the day–dark difference in evaluations of reassurance.
2. Method
Reassurance in outdoor locations was investigated using the day–dark method proposed by Boyce et al. 21 In this method, participant ratings of reassurance are recorded in both daylight and after-dark conditions, and the difference between these two ratings is plotted against lighting parameters to examine the effect of changes in lighting.
2.1. Test locations
Characteristics and mean and minimum illuminances of the ten test sites

The road lighting was single-sided in eight locations except for R7 in which the lamps were staggered. The underpass (R10) was lit on both sides. In R3 there was some illumination from external lighting on buildings on the far side of the road to where the evaluation sheets were filled in.
2.2. Light measurement
Three photometric values were recorded; horizontal illuminance, hemispherical illuminance and semi-cylindrical illuminance. The meters were mounted on a trolley and connected to a data logger (HOBO 4-channel analogue logger, UX120-006M). The three illuminances were recorded using separate photometers (Hagner E4-X) with detectors SD11 and SD10 used for measuring semi-cylindrical and hemispherical illuminance respectively. The semi-cylindrical illuminance sensor was mounted on a post so that it measured illuminance in the vertical plane at a height of 1500 mm above floor level, based on guidance in BS EN 13201-3:2015, 30 and facing parallel with a pedestrian's direction of travel on the path. The horizontal and hemispherical sensors were placed flat, in the horizontal plane, and were 150 mm above floor level. In accordance with the manufacturer's instructions, readings for the semi-cylindrical and hemi-spherical illuminances were multiplied by detector correction values of 1.961 (semi-cylindrical) and 0.882 (hemispherical). A GPS device was used simultaneously to mark both location and time of measurements and one wheel of the trailer was connected to an odometer to measure distance travelled.
With this apparatus, the illuminance was recorded for ten evenly spaced locations between the two lamp posts of each test location. For the eight roads (R1 to R8), these measurements were taken along the centre of the footpaths on both sides of the road, giving 20 measurement points; for the park pathway and the underpass, only a single row of measurements along the centre of the pathway were recorded, giving 10 measurement points.
Light measurements were carried out after-dark on two occasions, 13 and 20 March 2017, with both sets of measurements commencing at 19:00 (sunset on these dates occurred at 18:07 and 18:20, respectively). Both evenings were cloudy; the first evening remained dry but on the second evening it was raining. Plotting the measurements from the first evening against those recorded on the second evening across all ten streets suggested linear determination or r2 = 0.95 (horizontal illuminance), r2 = 0.96 (hemispherical illuminance), and r2 = 0.94 (semi-cylindrical illuminance) (N = 180 in all three cases). This suggests a good degree of consistency between the two sets of measurements. The mean ratio (evening 1/evening 2) of horizontal illuminances recorded at the 180 measurement points is 0.99 (std. dev. = 0.36; N = 176, 4 outliers excluded) which suggests readings on the second evening were 1% lower than those on the first evening. It was therefore decided to use the mean of the two measurements taken at each measurement point as the best estimate for that location.
For each measurement point on a road, an average was found for the measurements taken on the two separate evenings. The mean and minimum of these 20 measures of illuminance (or ten measurements in R9 and R10) are shown in Table 1. Road lighting guidance tends to specify the average illuminance but without stating whether that should be the mean or median. We therefore used the mean following definition of average luminance in one source as the arithmetic mean. 30
The three measures of illuminance were all highly correlated (horizontal vs. hemispherical illuminance, r2 = 0.93; horizontal vs. semi-cylindrical illuminance, r2 = 0.83; hemispherical vs. semi-cylindrical illuminance, r2 = 0.84) considering the mean value for each location (R10 excluded, because the extreme mean illuminance of this location led to high r2 values, 0.99 in each pair). A high degree of correlation is also revealed if the analysis is performed using the 180 individual measurement locations (horizontal vs. hemispherical illuminance, r2 = 0.95; horizontal vs semi-cylindrical illuminance, r2 = 0.87; hemispherical vs. semi-cylindrical illuminance, r2 = 0.96). Given this degree of similarity, as was also found by Boyce et al., we use here only horizontal illuminance as the metric for light quantity.
2.3. Questionnaire design
Questionnaires were used to evaluate each location (see Figures A1 and A2 in the Appendix). Fear of crime is defined as a perception of risk that produces an emotional response and results in avoidance or protective behaviours.25,26,34,35 These aspects of fear of crime are dependent on and influence each other.35,36 Asking how safe or worried someone feels taps into the perceptual facet but does not capture the emotional or behavioural effects. Using multiple questions instead of relying solely on one item provides a better measure of the fear of crime–reassurance spectrum and also minimises random error resulting from participants' interpretations of the rating scale items.
In addition to perceptual, emotional and behavioural aspects, reassurance also has contextual and environmental aspects, of which lighting is part of the latter. The questionnaire was designed to evaluate these elements within the time constraint of a field survey requiring repeated evaluations in a single test session. For daytime surveys, there were ten questions. There were four questions relating to the ‘self’ addressing the three layers of reassurance: cognitive (‘How risky do you think it would be to walk alone here at night?’, ‘How safe do you think this street is?’), emotional (‘How anxious do you feel when walking down this street?’) and behavioural (‘I would rather avoid this street if I could’). The question ‘How safe do you think this street is?’ is similar to that used by Boyce et al. (how safe the subject thought it would be to walk alone in the parking lot) although they used a 7-point response scale. There were five further questions regarding environmental and contextual aspects (‘I can see clearly around me,’ ‘Apart from the researcher and any other participants, there are lots of other people on the street,’ ‘This street is kept in good condition,’ ‘I can see a lot of litter and rubbish on this street,’ ‘How familiar are you with this particular street?’). To these a supplementary question was added to check attentiveness (see below). For the after-dark version, a further five questions regarding road lighting were added (see below). Responses to all questions were captured using 6-point scales.
2.3.1. Imagined after-dark evaluation
In some studies,13,37–39 respondents were asked to evaluate perceived safety in a laboratory setting rather than being in the real location at the time-of-day to which the evaluation pertains. In the study by Mason et al. 3 for example, response data were collected through interviews within the home of the respondent. Asking how safe the person would feel walking alone around the neighbourhood after-dark requires imagining being outside in the neighbourhood after-dark. An environment may be evaluated differently depending on whether the observer is viewing it through imagery or experiencing it in the real world, even if the images are made as realistic as possible. 40
One question in the current survey asked: How risky do you think it would be to walk alone here at night? (1 = Not at all risky to 6 = Very risky), with identical questions being used in the daytime and after-dark versions of the questionnaire. While the after-dark evaluation could be based on direct experience, the daytime evaluation would require an imagination of the likely perception of risk after dark. When an item is evaluated by memory, it tends to be remembered as weaker or lower (e.g. less bright) than the original experience. 41 This was demonstrated in one study where stimuli were recalled as being darker with successive evaluation than with simultaneous evaluation. 42 The risk at night question was therefore included to provide some measure of internal validation. It was predicted that daytime ratings of after-dark risk would suggest greater risk than those provided after dark.
2.3.2. Attentiveness
A question was included to check test participants' attention. This is a so-called bogus question for which the response should be predictable and not affected by the test locations.
43
One bogus question was included within each questionnaire, drawn from a pool of sixteen questions (Figure 1). Questionnaires were identical for all survey locations and for day and after-dark other than the additional questions included in the after-dark version. The one change was the choice of bogus question.
The pool of 16 bogus questions
2.3.3. Lighting after dark
Five questions were added to the after-dark version of the questionnaire. In response to the question ‘The lighting on this street is..,’ there were four semantic differential rating scales: bad-good, bright-dark, glaring-not glaring and unevenly spread (patchy)-evenly spread (uniform). The final question asked ‘Overall, how satisfied are you with the lighting on this street?’ with a very dissatisfied-very satisfied response scale. These lighting questions also employed a 6-point response scale and were always located after the reassurance questions on the questionnaire. The responses to these questions are not analysed in this paper.
2.4. Sample
Twenty four participants were recruited for the experiment. This sample size was determined through analysis of the sample sizes used in previous studies that have found a significant effect of road lighting on reassurance, and the resultant effect sizes where these could be estimated.13,21,44,45 Following Boyce et al., 21 a repeated measures design was used in which all participants provided ratings on all streets, during daylight and after-dark. Using a repeated measures design a sample of 24 participants can reveal a difference between the ten locations (in terms of the difference in day–dark ratings) with an effect size of 0.18 (Cohen's f). This assumes an alpha of 0.05 and a power of 0.8, using a repeated-measures ANOVA. This is categorised as a medium effect size, based on Cohen's definitions. 46
The 24 participants were aged between 18 and 38 years, with a mean age of 24 years, and included an equal balance of males and females. The state of participants' vision was self-reported in the consent to participate form. Five wore corrective lenses for far tasks, three for near tasks, three for near and distant tasks, and 13 did not use corrective lenses. This sample was recruited through the University of Sheffield's volunteer mailing list and each participant was reimbursed a small fee for their time and participation.
2.5. Procedure
The 24 participants were divided into four groups of six, with each group being taken to the ten locations together. The day–dark order (i.e. whether the daytime or after dark evaluation was carried out first) and the location order (i.e. forward or reverse route directions) were counterbalanced across these four groups. The day and after-dark sessions were always separated by at least one day, up to a maximum of eight days due to either logistical matters or adverse weather conditions. The tests were conducted between the 18 and 30 November 2016. The typical starting time for the daytime sessions was 10.30 am and for the after-dark sessions approximately 4.45 pm, following a sunset time of approximately 4 pm. A test session took approximately 2 hours.
At each location the evaluation point was close to a lamp post. Before completing the questionnaire the test participants were asked to walk a set distance (Table 1), usually between the two lamp poles used for the lighting measurements, then cross and walk back to the evaluation point. They were asked to face towards this same area when responding to the questions. The timing of each participant in the group was staggered by approximately 15 seconds so that they walked this route alone.
3. Results
The recorded data (rating responses) are uploaded as supplementary data to this paper. For analysis the rating scores for three questions were reversed so that a larger value on all questions represented a safer or more positive evaluation: I can see a lot of litter and rubbish on this street; I would rather avoid this street if I could; and How risky do you think it would be to walk alone here at night?
The responses were collected in ten roads. Of these, two (R9 and R10) were different environments to the remaining eight, being a park path and an underpass, rather than footpaths alongside a residential road. The underpass (R10) has higher illuminance than the other locations. Furthermore, being a semi-enclosed location, in daytime the underpass was relatively dim compared to the other nine locations, and the evaluations resulted in a day–dark difference of less than zero. We therefore carried out two analyses in parallel, one in which all ten locations were included and one in which only the eight roads were included; these analyses are labelled below as N = 10 and N = 8 respectively.
Analyses of participants' responses using graphical and statistical techniques suggested that they were drawn from a normally distributed population. The mean (and minimum) illuminances of the ten roads were not suggested to be drawn from a normally distributed population and hence analyses including these data were carried out using non-parametric techniques.
3.1. Attentive responding
Two steps were included in the procedure to examine attentive responding.
A bogus question was included to confirm attention. The bogus questions had a correct response and thus incorrect responses would indicate a lack of attention and thus raise concern about the validity of other responses. It was found that 99% of responses to the bogus question were correct: This suggests respondents were giving attention to the questions. The 1% of incorrect answers corresponded to unexpected personal characteristics, such as cultural diversity and eating habits.
Participants responded to the question ‘How risky do you think it would be to walk alone here at night?’ in both their daytime and after-dark sessions. In the daytime session, this therefore required a response based on an imagining of the environment after-dark. Following reverse coding of all responses, so that a higher rating indicated it being less risky to walk alone at night, mean ratings were calculated for each participant across all 10 roads combined. These data were normally distributed, and a paired-sample t-test suggested ratings were significantly lower in the daytime session (mean = 3.53) compared with the after-dark session (mean = 3.78, p = 0.009). This suggests participants may have perceived the risk of walking alone at night to be higher when they were imagining this situation but viewing the street in daylight, compared with when they were physically present on the street at night. In turn, this suggests participants accurately read the questionnaire in the daytime session, responding appropriately by imagining the street when after-dark. Were this not the case, we would expect ratings to have been higher on the daytime session for this question than on the after-dark session.
3.2. After-dark results
Degree of linear correlation between illuminance metrics and the mean after-dark ratings for three of the questionnaire items evaluating reassurance

aSpearman's Rho.
Safe: How safe do you think this street is?
Anxious: How anxious do you feel when walking down this street?
Avoid: I would rather avoid this street if I could
3.3. Day–Dark analysis: Safety
Following Boyce et al.,
21
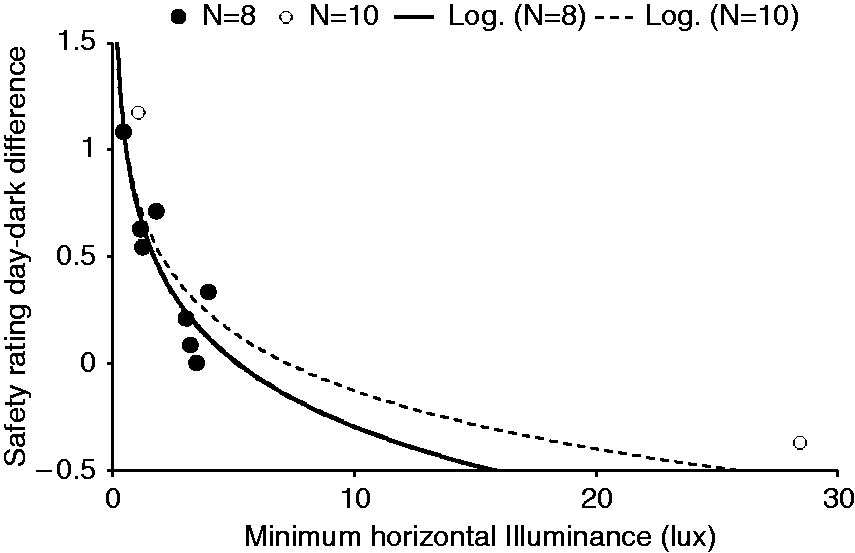
we first explored the day–dark difference as computed from responses to a single question; How safe do you think this street is? Figures 2 to 4 show mean day–dark differences for this question plotted against mean, minimum and uniformity of horizontal illuminance. The trends were well explained by a logarithmic function (Table 3).
Day-dark difference of safety ratings plotted against mean horizontal illuminance, for N = 8 and N = 10 roads. Regression lines use logarithmic function Day-dark difference of safety ratings plotted against minimum Illuminance, for N = 8 and N = 10 roads. Regression lines use logarithmic function Day-dark difference of safety ratings plotted against uniformity of horizontal illuminance for N = 8 and N = 10 roads. Regression lines use logarithmic function Goodness of fit of logarithmic function to explain the day–dark difference of safety ratings plotted against mean, minimum and uniformity of horizontal illuminance


Considering all ten locations (N = 10), minimum illuminance and uniformity offer stronger association with the day–dark difference than does mean illuminance. Considering only the eight road locations (N = 8) the association between mean illuminance and the day–dark difference is now stronger (r2 = 0.78) than with the ten locations (r2 = 0.56). Minimum illuminance exhibits an association with the day–dark difference that is slightly greater than that of mean illuminance, and both are stronger than association with uniformity.
With mean illuminance, the two analyses (N = 8 and N = 10) suggest different relationships between lighting and reassurance, in other words, it is a different relationship in different types of location. Minimum illuminance (Figure 3) and uniformity (Figure 4) appear to be more robust to changes in the location sample, with greater similarity between the trend lines for the N = 10 and N = 8 analyses.
3.4. Day–Dark analysis: Composite rating
The analysis was repeated but collating responses to multiple survey questions. These were responses to eight questions, excluding responses to the two internal validation questions (the bogus question, and ‘How risky do you think it would be to walk alone here at night?’) and excluding also responses to the lighting evaluation questions.
A principal components analysis (PCA) was used to explore grouping and generate a composite rating of reassurance. It selects and summarises the sample into components, which explain the maximum variance per item. 47 Due to this, and to allow comparison with the day–dark analysis based on the safety question only, the PCA was carried out on the database of day–dark differences.
It was anticipated that the questionnaire would reveal two components, one being individual aspects of reassurance (perceptual, emotional and behavioural aspects) and the other being contextual and environmental aspects. Therefore, no rotation solution was applied. In this analysis we are concerned primarily with the first of these, how lighting influences the individual aspects of reassurance.
The Kaiser–Meyer–Olkin (KMO) test suggests that the sample is sufficient for a PCA analysis since the resultant value (KMO = 0.72) is greater than 0.70. 47 The input to this PCA were the difference in ratings between day and dark test sessions for each participant on each street. This resulted in 240 data values for each question (24 participants × 10 streets). This approach resulted in the use of repeated-measures data within the PCA. This is acceptable based on previous work, 48 and because the PCA is used for exploratory rather than inferential purposes.
Component matrix extracted using principal component analysis and component scores

Component scores for each question were calculated using the regression method. 49 These scores were used to weight the survey response data to establish a composite reassurance score. We included here the responses to all eight questions, following Field et al. 50 Note, however, that those items not suggested to belong to the reassurance component (loading < 0.4) have a relatively low component score and therefore contributed little to the composite reassurance score.
Mean composite reassurance day–dark difference scores

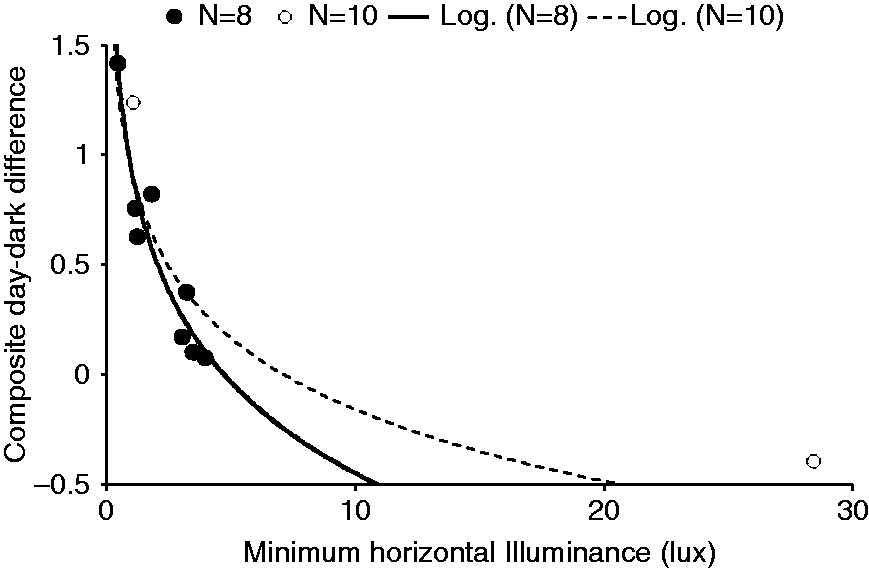
Figures 5 to 7 show mean day–dark differences for the transformed composite reassurance score plotted against mean and minimum illuminance and uniformity. The trends were well explained by a logarithmic function (Table 6). For both analyses (N = 10 and N = 8) minimum illuminance and uniformity exhibit a stronger association than does mean illuminance: Minimum illuminance exhibits a slightly stronger association than does uniformity. The graphs again suggest a more robust explanation when using minimum illuminance or uniformity than when using mean illuminance, i.e. a smaller difference between the N = 8 and N = 10 best-fit lines.
Composite transformed scores plotted against mean horizontal illuminance in 10 test locations and 8 test locations. Regression lines use logarithmic function Composite transformed scores plotted against minimum horizontal illuminance in 10 test locations and 8 test locations. Regression lines use logarithmic function Composite standardised scores plotted against uniformity in 10 test locations and 8 test locations. Regression lines use logarithmic function Goodness of fit of logarithmic function to explain composite day–dark difference plotted against mean, minimum and uniformity of horizontal illuminance


3.5. Regression modelling
Using the day–dark difference of either the safety question alone or the composite reassurance score, minimum illuminance and uniformity appear to provide a stronger correlation with the reassurance effect of lighting than does mean horizontal illuminance. It was next considered whether some combination of two or more of these metrics would provide a better prediction. This was investigated using a series of multiple regression models and logarithmic values of mean illuminance, minimum illuminance and uniformity.
Results from multiple regression models using combinations of mean, minimum and uniformity of horizontal illuminance to predict the transformed composite day–dark difference score of reassurance (N = 10)

Multiple R-squared for models with only one predictor. Adjusted R-squared when more than one predictor included in model.
AIC: Akaike information criterion.
Results from multiple regression models using combinations of mean, minimum and uniformity of horizontal illuminance to predict the transformed composite day–dark difference score of reassurance (N = 8)

Multiple R-squared for models with only one predictor. Adjusted R-squared when more than one predictor included in model.
AIC: Akaike information criterion.
When comparing these models, higher values of the coefficient of determination (R2) and lower values of AIC suggest the better model. For N = 10, Table 7 indicates that models using any two of the three terms provide the best fit to the data, although the improvement over consideration of either minimum illuminance or uniformity alone may not be practically significant. There is no benefit to using the three-term model. For N = 8, the model using only minimum illuminance provides the best fit: the addition of further terms does not offer any improvement in prediction power (Table 8).
Assuming that the ideal model is the simplest which offers the highest prediction power, Tables 7 and 8 suggest minimum illuminance to be a good candidate. There is a small benefit to adding a second term in the N = 10 analysis (Table 7), which may reflect the more diverse range of situations included in that analysis. The resultant models are shown in equations (1) and (2) for N = 10 and N = 8, respectively.


4. Optimal illuminance
Horizontal illuminances estimated according to day–dark differences of either 1.0 or 0.5 units

N = 10: All ten locations.
N = 8: Underpass and park excluded.
A day–dark difference of 0.5 units implies that the after-dark evaluation of reassurance is slightly below that experienced in daytime, and which may be considered as good lighting. This is characterised by road lighting providing either a mean horizontal illuminance of approximately 7.0 to 9.0 lux, a minimum of approximately 2.0 lux or a uniformity of approximately 0.25. These conditions lie between lighting classes P3 (mean = 7.5 lux, min = 1.5 lux, U = 0.2) and P2 (mean = 10 lux, min = 2.0 lux, U = 0.2), 28 these classes being formerly defined as appropriate for heavy/moderate night-time use by pedestrians or pedal cyclists. 53
Consider next a day–dark difference of 1.0 units; while this is a greater difference than 0.5 units, it is sufficient to induce a significant effect on walking behaviour. 2 This is characterised by road lighting that provides either a mean horizontal illuminance of 3.0 to 5.0 lux, a minimum of 0.6 to 0.9 lux, or a uniformity of approximately 0.15. These conditions lie between lighting classes P5 (mean = 3.0, min = 0.6 lux, U = 0.2) and P4 (mean = 5.0 lux, min = 1.0 lux, U = 0.2), 28 these classes being formerly defined as appropriate for minor night-time use by pedal cyclists or pedestrians solely associated with adjacent properties. 53 The lower class (P5) was to be adopted when important to preserve the village or architectural character of an environment. Given that a minimum illuminance of 1.0 lux is suggested to be required for the detection of trip hazards, 54 this suggests that a minimum of 1.0 lux is desirable.
5. Conclusion
This paper reports a field survey where the effect on reassurance of changes in lighting was evaluated using subjective appraisals. It was confirmed that mean horizontal illuminance did not correlate with after-dark ratings of reassurance. While mean illuminance exhibited significant correlation with the day–dark difference, this was better predicted by minimum illuminance. For a day–dark difference of 0.5 units, the results suggest a minimum illuminance of approximately 2.0 lux, decreasing to a minimum illuminance of 1.0 lux for a day–dark difference of 1.0 units. The optimal illuminance established using the composite reassurance score is slightly higher than that established using only the safety question, although the difference is unlikely to be of practical significance.
Uniformity also tends to provide a better prediction of the day–dark difference than does mean illuminance, with a higher uniformity reducing the day–dark difference. Uniformity does not, however, provide any control over the absolute level of light installed as is needed to control lighting externalities such as energy use. What may be useful is for lighting guidance to specify the minimum illuminance and uniformity rather than the mean and minimum as in the current standards.
There are a number of limitations in these conclusions. The field study was conducted in one urban region of a UK city: the findings should therefore be validated through studies conducted in other locations, including different countries, sub-urban and rural locations, and different ranges of illuminance.
The test participants were aged between 18 and 38 years: older people are likely to have poorer visual capabilities which may demand a higher level of lighting. Although older people may express a lower level of reassurance than younger people in a given situation, this would be offset using the day–dark approach if the difference between older and younger test participants remained similar in daytime and after dark. This assumption remains to be tested. Further trials should be conducted using participants recruited from an older age group.
The subjective evaluations should be confirmed using alternative methods. These might include the measurement of involuntary physiological responses such as eye movement or heart rate. They might also include behavioural measures such as usage of a location as determined by counting the number of pedestrians at a certain location with control used to isolate the effect of lighting from other changes such as the purpose of walking, time of day and weather. Two studies have done this, albeit to compare daylight and darkness rather than changes in road lighting illuminance, and both demonstrated that there are greater numbers of pedestrians (and cyclists) when the ambient light level is higher.22,23
There is also a need to consider further needs of lighting for pedestrians, in particular the need to see other people, to see hazards, and for drivers to detect pedestrians. These needs may require higher illuminances than found in the current study, and may require recommendation of vertical illuminance rather than horizontal.
Supplemental Material
location photographs -Supplemental material for Evaluation of pedestrian reassurance gained by higher illuminances in residential streets using the day–dark approach
Supplemental material, location photographs for Evaluation of pedestrian reassurance gained by higher illuminances in residential streets using the day–dark approach by S Fotios, A Liachenko Monteiro and J Uttley in Lighting Research & Technology
Supplemental Material
Supplemental material for Evaluation of pedestrian reassurance gained by higher illuminances in residential streets using the day–dark approach
Supplemental material for Evaluation of pedestrian reassurance gained by higher illuminances in residential streets using the day–dark approach by S Fotios, A Liachenko Monteiro and J Uttley in Lighting Research & Technology
Supplemental Material
supplementary data -Supplemental material for Evaluation of pedestrian reassurance gained by higher illuminances in residential streets using the day–dark approach
Supplemental material, supplementary data for Evaluation of pedestrian reassurance gained by higher illuminances in residential streets using the day–dark approach by S Fotios, A Liachenko Monteiro and J Uttley in Lighting Research & Technology
Footnotes
Declaration of conflicting interests
The authors declared no potential conflicts of interest with respect to the research, authorship, and/or publication of this article.
Funding
The authors disclosed receipt of the following financial support for the research, authorship, and/or publication of this article: This work was carried out with support from the Engineering and Physical Sciences Research Council (EPSRC) grant number EP/M02900X/1.
Appendix
References
Supplementary Material
Please find the following supplemental material available below.
For Open Access articles published under a Creative Commons License, all supplemental material carries the same license as the article it is associated with.
For non-Open Access articles published, all supplemental material carries a non-exclusive license, and permission requests for re-use of supplemental material or any part of supplemental material shall be sent directly to the copyright owner as specified in the copyright notice associated with the article.
