



Abstract
This article discusses quantitative recommendations for road lighting as given in guidelines and standards, primarily, the amount of light. The discussion is framed according to the type of road user, the driver and the pedestrian, these being the user groups associated with major and minor roads, respectively. Presented first is a brief history of road lighting standards, from early to current versions, and, where known, the basis of these standards. Recommendations for the amount of light do not appear to be well-founded in robust empirical evidence, or at least do not tend to reveal the nature of any evidence. This suggests a need to reconsider recommended light levels, a need reinforced by recent developments in the science and technology of lighting and of lighting research. To enable improved recommendations, there is a need for further evidence of the effects of changes in lighting: This article therefore discusses the findings of investigations, which might be considered when developing new standards.
1. Introduction
The Commission Internationale de l'Eclairage (CIE) describes two main purposes of road lighting: (1) to allow all road users, including operators of motor vehicles, motor cycles, pedal cycles and animal drawn vehicles to proceed safely; and (2) to allow pedestrians to see hazards, orientate themselves, recognise other pedestrians and give them a sense of security. 1 A third purpose is also given (to improve the day- and night-time appearance of the environment) but that does not fall within the scope of this paper.
Guidelines and standards for road lighting are provided to help designers achieve these purposes, and to do so, they provide quantitative recommendations for the appropriate level (luminance or illuminance), colour (or other characteristic derived from the spectral power distribution (SPD)) and spatial distribution of light. Example documents include CIE 115:2010, 1 EN 13201-1:2014, 2 EN 13201-2:2015, 3 IESNA/ANSI RP-8:2014 4 and BS 5489-1:2013. 5 These are consensus documents which means that they are written and reviewed by committees representing a cross-section of the industry – manufacturers, designers, installers and researchers.
This paper discusses the basis of quantitative recommendations for road lighting; the background to current guidance, the need to revise standards to respond to developments in science and technology, and recent and ongoing research being carried out to provide an empirical basis for revised recommendations. The discussion is focussed upon research into road lighting for pedestrians and drivers, the categorisation used by the CIE to distinguish between two sets of lighting recommendations. 1 The European standard EN 13201 also presents two sets of recommendations, the M-classes and the P-classes: the M-class is intended for drivers on traffic routes; the P-class for pedestrians and cyclists but also for drivers at low speeds (≤40 km/h).2,3
Road lighting is an extremely broad topic. To limit the scope, we have not included research of vehicle-mounted lighting, tunnel lighting, conflict areas, the effects of or measurement of glare, sign illumination, traffic signals or parking and dedicated pathway areas.
2. The basis of current road lighting recommendations
2.1. Early standards
A road lighting standard is required to ensure a good installation and to provide a basis for tender. 6 In 1927, British Standard 3077,8 identified eight classes of lighting, defined by minimum mounting height and maximum space:height ratio. 6 While minimum illuminances were also defined for each of the eight classes, these ranging from 0.1 lux (0.01 foot candles) to 21.5 lux (2.0 foot candles) at a test point, these minima were not intended to be considered as a figure of merit for the installation but only as a rating of its size and had no theoretical basis. 6 The 1927 British Standard was suggested by Waldram to be the first milestone in the technical progress of street lighting. The second milestone, Waldram suggested, was the 1928 field study in Sheffield, UK, of 52 experimental installations, the problems observed in that study leading promptly to a revised standard. 6
Example of the ‘recipe’ method for prescribing road lighting criteria. This example is from British Standards Code of Practice 1004:1974 part 2. 9

2.2. Standards for driving
Two approaches have been used to set lighting standards for traffic routes where drivers are the primary road user: consideration of visual function and consideration of road accidents.
In North America, the initial approach for establishing light levels was to consider how changes in lighting affected the frequency of road traffic collisions, and hence the safety of vehicle occupants and the vulnerable road users they hit. This is the basis of the Illuminating Engineering Society of North America (IESNA) road lighting recommendations (originally implanted in 1972 but still the basis of current standards in North America), derived from the work of Box.
14
Box examined the relationship between illuminance and freeway (or motorway) crashes on 203 miles of road. First, he considered the presence versus absence of road lighting: the day/night crash rate ratios for lit and unlit roads were 1.43 and 2.37, respectively. Using this ratio to calculate an expected crash rate, Box concluded that installing road lighting on freeways reduced nighttime crashes by an average of 40%. Consider next the light level (Figure 1): Box concluded that roads with the lower range of illuminances (0.3 to 0.6 horizontal foot candles (HFC), or 3.2 lux to 6.4 lux) had a lower night/day crash ratio than roads with a higher range of illuminances (0.8 to 1.1 HFC and 1.3 to 1.5 HFC; 8.6 lux to 11.8 lux and 14 lux to 16.1 lux). As a result of these data, Box recommended a level of 0.5 HFC (5.4 lux) for freeways. This result seems counter to intuition as a higher lighting level increased the crash rate ratio. It must be remembered that additional lighting can create additional glare and impacts the driver’s adaptation level so while this result is not expected, it may be justifiable.
Day/night crash ratio plotted against illuminance, after Box
14
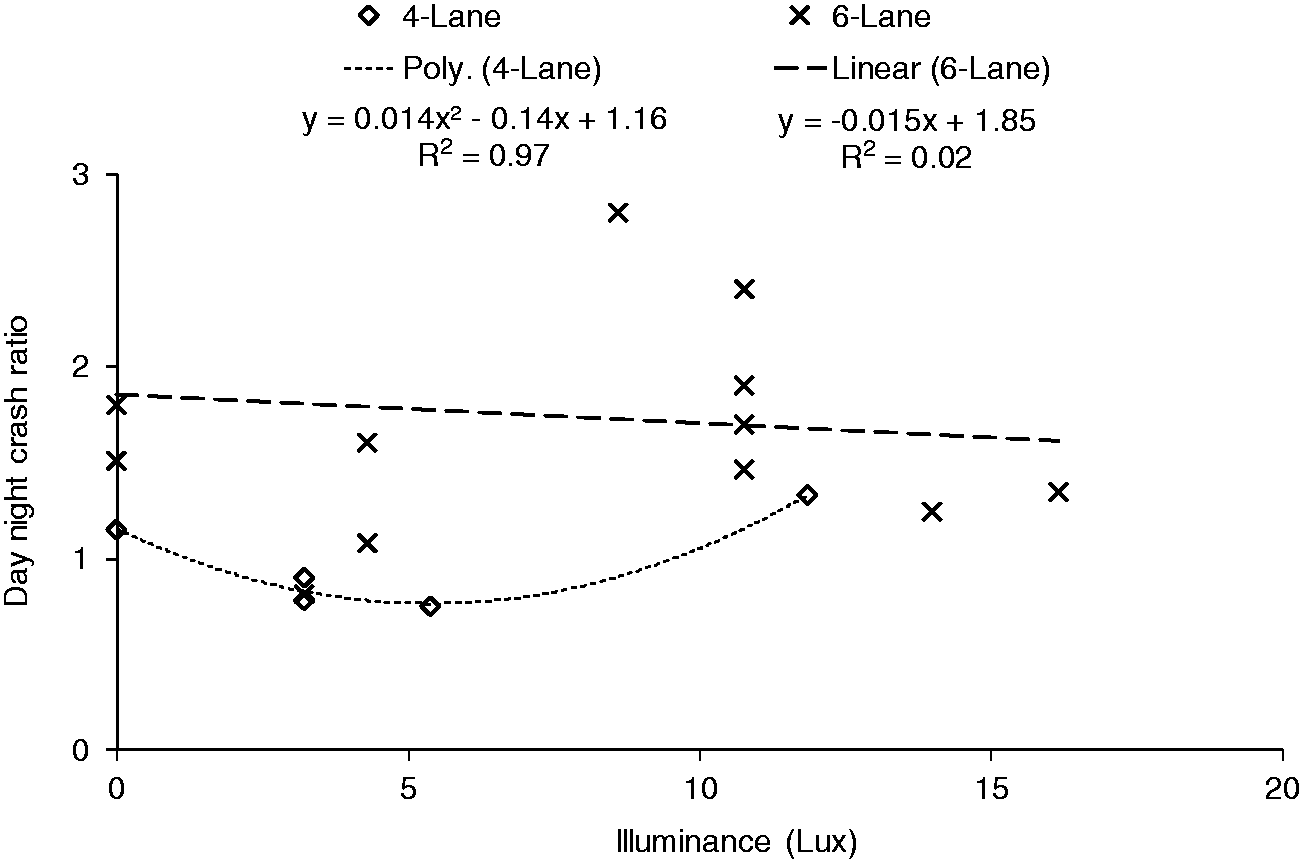
There are limitations in the Box data. First, Box performed only a limited statistical analysis: subsequent study has concluded the data do not exhibit a relationship between light level and crash rate. 15 This can be seen by the regression lines shown in Figure 1; while results for the four-lane roads are well-fitted by a polynomial curve (R2 = 0.97), those for the six-lane road are not (R2 = 0.02 for the linear fit is not improved by a polynomial equation). Second, these values were applied only to freeways; the levels for other roadway categories had no empirical backing. Despite these limitations, the 0.5 foot candle illuminance determined by Box has been carried through the standards and translated into luminance criterion.
The first step in developing a metric based on human vision was to establish an appropriate photometric quantity. This required the use of luminance, which describes the luminous intensity per unit area in a given direction, specifically that reflected from the road surface towards the driver, and which provides a better measure than illuminance of how well an object can be seen. The luminance method, developed during the 1970s, was documented by the CIE in 1982, 16 and accepted by the IESNA in 1983. 17 In the process of accepting luminance as the criteria, the IESNA converted the existing illuminance values to luminances based on the roadway pavement classification.
The luminance of any point on a road surface is a function of the illuminance on, and the reflection properties of, the pavement material. The luminance method therefore requires knowledge of the road surface properties and the geometry between the light source and the observation position relative to a point on the road surface. The need to make assumptions about the observation point and viewing direction means that luminance-based design is applied only to situations such as motorways where the assumption can be made. In conflict areas, where multiple directions of view are likely, illuminance-based design is retained. Road surfaces are divided into a small number of representative classes according to the type of surface material and texture (in some countries, weather is also a factor), and for each class, there is a representative road surface reflectance table. 18
Field verification suggests that the targeted design luminance is not always met, with in-situ measurement of road surface luminance varying by up to 45% from the design value. 19 One contribution to this difference is uncertainty in the road surface reflectance data,20,21 for example, the age and the traffic volumes on the pavement can vary the reflection characteristics. Another limitation is the difficulty in measuring luminance in-situ with limitations from both the instrumentation and the logistics of performing the measurements. 22 The luminance method is also limited in adverse weather and wet road surface conditions due to changes of surface reflection. 23
The second step in developing a vision-based system for lighting design was to consider how changes in luminance (and other road lighting characteristics) affect factors of visual performance such as the ability and time taken to detect and identify objects. Using lighting that increases the likelihood of detecting a potential hazard and reduces the time taken to achieve this detection leads to a more rapid braking response. This in turn can avoid accidents or at least reduce the severity of an accident by reduction in the impact speed. Indeed, studies have shown that road lighting has a greater effect for reducing fatalities and serious injuries than for minor injuries.15,24–26
Adrian 27 developed a model of visibility based on the detection of a small object in the roadway. This target was a square of 20% reflectance, observed as a two-dimensional flat object: with a side length 180 mm, it was located at a distance ahead to subtend a visual angle of 10 minutes of arc. The other inputs to the model included a driver age of 63 years and an observation time of 0.2 seconds. The visibility level (VL) of an array of these targets was calculated and a weighting function used to create a single metric that became known as small target visibility (STV).
The definition of ‘small’ in STV is an important factor. For smaller sizes, a slight change in size can have significant effect on visual performance whilst for larger sizes, where performance is already at a plateau, 28 then changes in size may have negligible effect on performance 29 (see also Section 4.1).
STV values in IES-2000 based on roadway type and usage 30

STV: small target visibility; VL: visibility level. Median strip: the reserved area (central reservation) separating opposing lanes of traffic on dual carriageways and motorways. The table refers to the width of the strip.
Luminance values in IES-2000 based on roadway type and usage 30

As any of the three criteria of illuminance, luminance or STV could be used to establish lighting designs, local agencies were able to choose which. One of the issues with STV was that it could not be field verified and, as a result, the concept was discussed and reviewed significantly, and in next version of IES RP 8, 4 luminance was established as the only design criteria; illuminance was used for field verification and STV was used as a selection criterion between designs.
Comparison of average luminances recommended in CIE115:1995 in Table 6.1 and also Appendix A Table A1, which gives lighting requirements ‘when the STV concept is used’ 32
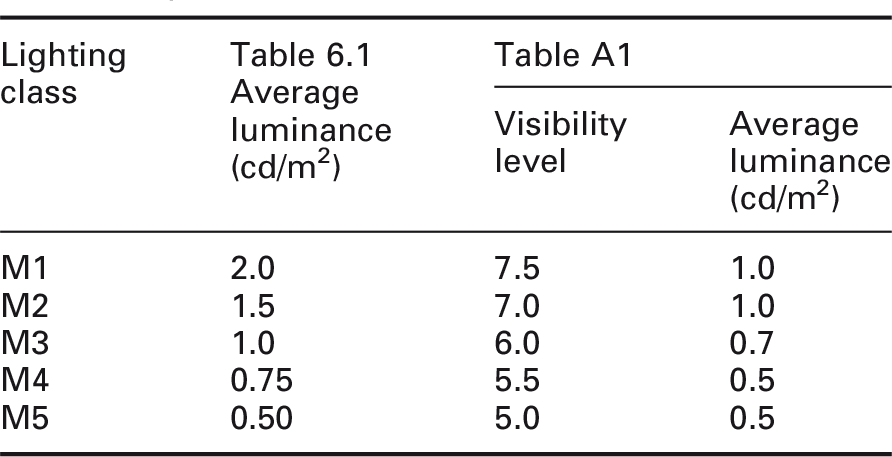
M lighting classes for dry roads from CIE 1
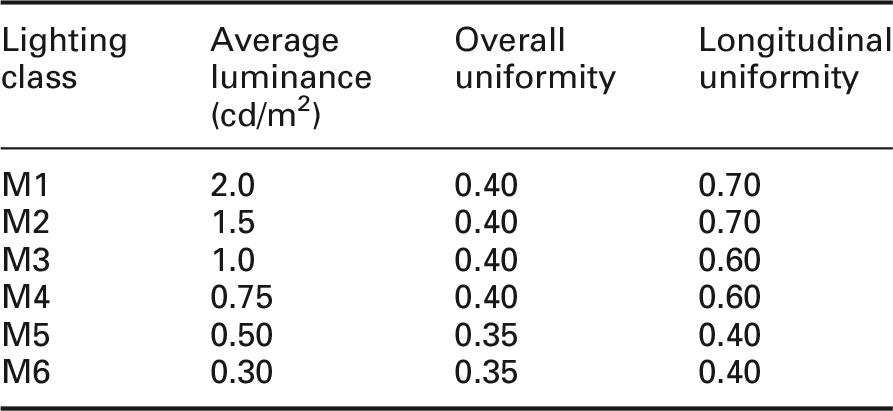
Note: Not shown here are recommendations for wet surface uniformity, threshold increment and surround ratio.
Weighting factors for selecting an M-class of road lighting 1

P lighting classes from CIE 1

A. Minimum vertical illuminance (lux).
B. Minimum semicylindrical illuminance (lux).
Weighting factors for selecting a P-class of road lighting 1

2.3. Standards for pedestrians
Lighting in minor roads, often called subsidiary roads, is intended to target the needs of pedestrians. For example, BS5489-1:2013 states that the main purpose of lighting for subsidiary roads and areas associated with those roads is “to enable pedestrians and cyclists to orientate themselves and detect vehicular and other hazards, and to discourage crime against people and property. 5 The lighting on such roads can provide some guidance for motorists, but is unlikely to be sufficient for revealing objects on the road without the use of headlights”. CIE guidance 1 states that ‘The road lighting should enable pedestrians to discern obstacles or other hazards in their path and be aware of the movements of other pedestrians, friendly or otherwise, who may be in close proximity’.
An early distinction between types of road user occurred in the 1930s when the British Minister of Transport set up a committee to examine the efficient provision of road lighting with particular reference to ‘the requirements of residential and shopping areas’. 6 This led to recommendations for only two classes of lighting – traffic routes and other roads requiring lighting – with the intention that lighting on traffic routes should be sufficiently good for drivers to proceed safely without the use of headlights. 6
The 1992 British Standard recommended three lighting classes for subsidiary roads, these having horizontal illuminances of 3.5 lux, 6.0 lux and 10 lux, with the choice defined by a narrative description of the typical application. 33 These illuminances were derived largely from a field study in which a small group of people evaluated the ‘general impression’ of lighting in 24 locations using a nine-point category rating scale. 34 The three horizontal illuminances were proposed as they corresponded to ratings of good (7), adequate (5) and poor-to-adequate (4) on the nine-point scale. The results, however, are likely trivial, being influenced by stimulus range bias, 35 and the field survey did little more than stretch the range of illuminances encountered in the survey to fit the response scale. Stimulus range bias means that a field survey in which a different range of illuminances had been observed would have indicated that different illuminances correspond to ratings of good, adequate and poor, and this can be seen in the earlier, but unfortunately unconsidered, field survey reported by de Boer.35,36
While it is possible in hindsight to criticise evidence for the 1992 British standard, there was at least an intention to base the guidance on empirical evidence, and that is not apparent in later guidelines. In 1995, CIE recommended six lighting classes, with average horizontal illuminances ranging from 1.5 lux to 20 lux. 32 In 2003, EN 13201-2:2003 also recommended six lighting classes but with a narrower range of illuminances (2.0 lux to 15 lux), 37 and this range was retained in later updates to standards.1,3 Other than the Simons et al. field study described above, the empirical evidence for these recommendations, if any, is unknown.
Table 7 shows the light levels recommended for pedestrians and Table 8 shows the weightings provided with which to determine which of the six lighting classes of Table 7 is appropriate for a given situation. These are the recommendations of CIE, 1 but those of EN 13201-1:2014 and EN 13201-2:2015 are similar.2,3 This similarity between the two documents is unsurprising since ‘many of the members on the CIE committee are also members of the CEN committee’, 38 which is not the same as independent groups reaching similar conclusions.
There are a number of unknowns in these data. First, consider that the fundamental element is the mean horizontal illuminance: there is no published explanation of the basis for these values. This lack of support means designers are unable to consider whether their requirements are met and researchers have no basis for direct criticism.
Second, consider the supplementary illuminance values. The ratio of minimum to average horizontal illuminance is 0.2 in every class, which suggests convenience rather than an empirical basis. For the facial recognition criteria, the ratio of horizontal illuminance to vertical illuminance is about one-third and the ratio of horizontal illuminance to semi-cylindrical illuminance is 0.2, again suggesting convenience rather than an empirical basis. There are no known reasons for these criteria and the consistent ratios suggest they were not independently evaluated but are simply an arbitrary ratio.
Additional criteria for facial recognition are provided for situations where facial recognition is considered to be necessary, but without comment as to when facial recognition may or may not be necessary. The additional criteria are minimum values of vertical or semi-cylindrical illuminance to be considered alongside minimum horizontal illuminance. The face of another person tends to be largely a vertical surface and hence ensuring an adequate illuminance on the vertical plane may be beneficial. Semi-cylindrical illuminance is provided as an alternative measure, possibly because the basis of this measure (the averaged illuminance on the curved surface of an upright semi-cylinder) is believed by some to better characterise the ability to evaluate faces. 39 This is unlikely to be the case because a single value of semi-cylindrical illuminance provides no more information about spatial distribution than does a single value of vertical illuminance. The belief in semi-cylindrical illuminance appears to come from two studies, which plotted semi-cylindrical illuminance against results of facial recognition experiments,40,41 but without fair comparison of the alternatives, 39 and ignoring that other studies34,42,43 had concluded that semi-cylindrical illuminance did not offer an advantage over horizontal or vertical illuminance. 39
Third, consider that a lighting class is chosen with consideration to five parameters: travel speed, traffic volume, traffic composition, parked vehicles and ambient luminance (Table 8). An immediate response to these parameters is that they have limited relevance to the stated purposes of road lighting, i.e. to ‘enable pedestrians to discern obstacles or other hazards in their path and be aware of the movements of other pedestrians, friendly or otherwise, who may be in close proximity’. 1 Instead, they relate largely to the potential for, and severity of, collision with a motor vehicle. Whilst that is clearly an important consideration, the disconnection between the stated aims of lighting and the approach to choosing how much light is provided does not provide confidence that the intended purpose will be met.
There is some evidence that travel speed, 44 traffic volume, 45 traffic composition 46 and the presence of parked vehicles 47 are associated with the risk of accident/injury to pedestrians. There is not, however, any evidence that differences between the options are fairly represented by a weighting of 1.0 in all cases, in particular since the options are not clearly defined, and there is no evidence that the weightings should be considered to be cumulative. Guidance for Australia and New Zealand provides an alternative set of weighting factors, 48 for which the options are better defined (e.g. there are quantitative values of traffic volume rather than being labelled very high, high, moderate, etc.) and the weightings appear to be more nuanced.
This means the weighting factors may be leading to lighting design conditions that are not appropriate, possibly too high and leading to excessive energy consumption and light pollution, or too low and leading to insufficient visual benefit for pedestrians. For example, while a mixed traffic composition may benefit from a higher illuminance than single-type traffic, this approach does consider whether the illuminance provided by the lower P-classes (e.g. class 4 or 5) may already be sufficient to meet the demands of mixed traffic.
3. The need for new standards
A fundamental need for standards to be reviewed is that they do not appear to be founded in robust empirical evidence. Such evidence is needed first to show that the assumed benefits of lighting do exist (i.e. improved visibility, improved safety, improved feeling of safety), and second to show how these benefits might be affected by changes in context and changes in lighting. Furthermore, within recent years, there have been developments in the technology of road lighting and the technology of research, and developments in our understanding of vision and the side-effects of road lighting.
3.1. Developments in science and technology
Waldram 6 and the online archive of Simon Cornwell 49 describe developments in the technology of road lighting. In 1405, the Aldermen of The City of London were ordered to see that a lighted lantern was hung outside every house along the road (‘highway’ in the original), followed in 1461 by a standard specification for the candles. Gas lamps were first used in London in 1807, followed a few years later, in 1816, by arguments in the Cologne Zeitung newspaper against lighting at night (with arguments including that ‘the fear of darkness will vanish and drunkenness and depravity increase’). Arc lamps were used to light public areas in Paris (1878) and Cleveland (1879). In London, arc lighting and incandescent lighting were introduced in the 1880s.
The introduction of discharge lamps in the 1930s is described by Waldram 6 as the third milestone in street lighting, because ‘engineers were presented with lamps with almost the simplicity of the filament lamp, with three times the efficiency and twice the life. Public lighting could be provided on a scale and to a level which was previously not economically possible’. One problem with discharge lamps compared with the filament and gas lighting they replaced, was that they ‘gave light of an unfamiliar colour which has strange and unflattering effects on personal appearance’; new installations were a matter of public interest with the result that ‘local authorities began to demand better lighting and to be prepared to pay for it’. 6
Low pressure sodium (LPS) lamps were first installed in 1932, high pressure mercury vapour in 1933, fluorescent in 1946 and high pressure sodium (HPS) in 1966. 49 There are three limitations with these types of lamp. First, there were limited options for SPD, which for LPS and HPS lamps meant a yellowish-orange appearance and a low colour rendering index. Second, these were large lamps (LPS lamps in particular) and gave limited opportunity for optical control, leading to an assumption that if one part of the roadway was well lit, then an adjacent footpath would also be well lit. Third, other than some types of fluorescent lamp, they have switching-on cycles, which can require several minutes to reach full output. These limitations are removed with the implementation of Solid State Lighting (Light Emitting Diodes – LEDs) in roadways and outdoor areas. LEDs can have very fine optical control due to the small size of individual units, almost limitless control over SPD if sufficient primaries are used, and can be switched on and off instantaneously. The introduction of LEDs has thus led to new requirements for new recommendations associated with spectrum, spatial distribution (e.g. the surround ratio and specific sidewalk requirements 50 ) and dynamic control. The small physical size of LEDs renders new applications possible. For example, using self-luminous road studs as lane markers may provide a better solution than overhead road lighting in some situations. 51 This is likely to reduce sky glow and energy consumption.
While visual conditions under road lighting are likely to fall within the mesopic region, where both rods and cones provide significant responses, road lighting recommendations are given using photopic quantities. That is, the recommended illuminances (or luminances) are derived from the CIE standard photopic observer 52 and hence ignore any contribution from the rods (and short wavelength sensitive cones). Since rods and cones display different spectral sensitivities, a photopic-only approach may not be adequately accounting for changes in the SPD of road lighting. That limitation has become more important since the widespread introduction of LEDs which, compared with sodium and mercury lamps, significantly enhance the opportunity to change and tune SPD.
One recent development in road lighting measurement is the establishment of a system for mesopic photometry, 53 with work currently ongoing to establish how it should be applied in practise. 54 The mesopic system was derived from two parallel bodies of work, the European MOVE consortium55–58 who used laboratory experiments with three representative visual tasks – can it be seen, how quickly and what is it? – and the Lighting Research Center 59 who used reaction time to detection of peripheral targets in experiments of ascending practicality related to driving: An abstract target, 60 a driving simulator, 61 and driving on a test track. 62 The mesopic visual response is essentially a weighed combination of the scotopic (S) and photopic (P) responses, and hence the CIE mesopic system 53 provides the weighting factor according to the level of adaptation and the S/P ratio of lighting, this being established by consensus between the two bodies of work. A focus of current research is how to define the level of adaptation.63,64
While there is now a system for mesopic photometry still to be resolved is the situations where it should be applied. For some driver-related activities, mesopic models may not be applicable,65,66 a result of the diminishing use of peripheral vision during driving on main roads, the ever changing adaptation luminance due to the dynamic nature of drivers’ eye movements, and the simultaneous use of headlights. The CIE system has been applied, however, in pedestrian lighting recommendations,5,67–69 to characterise the illuminance reduction permitted when using lighting of greater short-wavelength content, this being of benefit for tasks such as obstacle detection70,71 and spatial brightness perception. 72 Alongside the S/P ratio, a minimum value of colour rending is also prescribed, arbitrarily set at Ra = 60 for consistency with the previous version of BS5489, 73 to avoid encouraging the use of extremely high S/P ratios. 68
There have also been developments in technology associated with road lighting research.
In-situ light measurement techniques with cameras and illuminance meters linked to a GPS coordinates to evaluate lighting installations over large distances
15
; An efficient form of lighting would be to light only what road users tend to look at. While eye tracking has long been possible, the recent development of mobile eye tracking has made it much easier to investigate where people tend to look whilst travelling74–77; Systems that allow for monitoring of in-vehicle driver behaviour and the assessment of the impact of roadway conditions on that behaviour
78
; The calculation of road surface luminance (and other properties) is a complex task. One development that reduced the effort demanded was the introduction of the desktop personal computer.
A further development may change radically the approach to lighting, at least on traffic routes. That is the introduction of autonomous (driverless or hands-free) motor vehicles, 79 which offer the promise of fewer accidents due to automated collision avoidance systems. The need for lighting is reduced if the driver is not required to search for hazards, provided of course that all vehicles are autonomous and that the collision avoidance system do not fail, which is a high expectation. One potential benefit of the detection systems is that they may be able to communicate with the road lighting system to allow the road lighting to be adjusted (e.g. switched on or luminance increased) in response to an approaching vehicle.
3.2. Side-effects of road lighting
The aim of lighting guidance should be to ensure that the correct quantity and quality of lighting is used, where and when it is of benefit. Lucas et al. 80 referred to the management and use of light being similar to administering a drug: light has both benefits (positives) and unwanted side-effects (negatives) giving the need to control the dosage of the light so as to provide the maximum benefit whilst minimising the negatives.
One reason to suspect that light levels are on the high side and could be reduced is that they have tended to rise with time. For example, the maximum recommended illuminance for subsidiary roads in the UK increased from 10 lux in 1992
33
to 15 lux in 2003.
37
Figure 2 shows the tendency for the average illuminance of street lighting in Britain to increase with time, as determined by Crabb et al.
81
from data presented by McNeill.
82
Changes in technology have moved towards lamps of greater efficacy and light levels may have increased, because there was an ability to do so, not because there was evidence of a benefit to be gained from higher light levels.

In 1972, Waldram discussed the ‘sky haze’ due to street lighting. 83 The discussion of sky glow has continued,84–87 showing, for example, that the use of LEDs of high CCT (6500 K) increases scattered light and hence sky glow compared with conventional sources of lower CCT. 85 Too much light or an inappropriate quality of light might also lead to wasteful energy consumption, 88 to light trespass on property 89 and to unwanted impact on the natural environment. 90 While there are strong lobbies to reduce the impacts of these externalities, by using lower light levels, restricted spectral tuning or optical control, recommendations still need to meet the intended benefits for road users, e.g. a pedestrian’s ability to detect a trip hazard or a driver’s ability to detect a pedestrian on the carriageway. For this, we need robust evidence of how such benefits are affected by changes in lighting and this is not evident in existing standards.
One impact of lighting side-effects is that there may be a need to consider additional or alternative recommendations. The average illuminances and uniformity of current standards may no longer be sufficient and future standards may need to include maximum light levels, limitations for SPD and spatial distribution and exposure doses.
4. Lighting for drivers
Research undertaken to establish the benefits of road lighting for drivers can be divided into three broad types: Laboratory studies of visual function, driving performance investigated using simulators or test tracks and studies of the relationship between different types of lighting and the frequency (and/or severity) of road traffic collisions. The first of these shows how lighting affects those aspects of fundamental visual functions considered pertinent to driving. The second considers holistic driving performance or visual function within the context of other cognitive demands of driving. The third considers how lighting affects the outcome of driving performance.
4.1. Laboratory studies of visual function
The relationship between light level (luminance) and visual performance tends to follow a plateau-escarpment relationship28; at low light levels, an increase in luminance brings significant increase in visual performance (the escarpment), but a point is reached beyond which further increase in luminance no longer increases visual performance (the plateau). Identifying this point of transition is one approach to establishing the optimum luminance for a task.
Identification of a target is an on-axis task and performance may be characterised by acuity. For foveal acuity, the data suggest that higher luminance may enhance acuity but do not suggest that changes in SPD have significant effect.91–93 SPD is expected to have an effect on visual performance, in mesopic conditions, for targets that stimulate regions of the retina beyond the fovea, either by size or by off-axis location. This can be seen in the study by Lewis 94 who measured threshold luminance contrast of back-illuminated transparencies of sinusoidal contrast gratings, which subtended a visual field of approximately 13° wide and 10° high. At luminances of 10.0 and 3.0 cd/m2, there was no difference between the three lamps examined (MH, HPS, LPS), but as the average photopic luminance decreased further into the mesopic (1.0 and 0.1 cd/m2), then an effect of SPD became apparent, with the MH lamp having significantly lower relative luminance contrast threshold than the HPS or LPS lamps. It should be noted that further research indicated that in a driving environment, the mesopic effect was minimised at higher speeds do the reduction in the use of the peripheral vision and blur due to visual flow through the field of view. 65
The reaction time to detection of a target is suggested to be of direct relevance to driving performance as the speed of detection plays an important role in perceptual judgements made by the driver and can be easily translated into stopping distances. 95 Several studies60,94,96,97 have investigated detection rate and reaction time to detection, for on-axis and off-axis targets, under different luminances and SPDs. The effect of SPD on detection can be characterised by the S/P ratio (the ratio of scotopic (rod) to photopic (cone) photoreceptor responses). For off-axis targets, at luminances within the mesopic region, lighting of higher S/P ratio tends to reduce the reaction time to detection and increase detection rate. For example, in He et al., 60 who compared reaction times under HPS and MH lamps to the onset of an achromatic 2° disc, presented 15° off-axis, the benefit of higher S/P ratio was observed for luminances below approximately 1.0 cd/m2. The significance of SPD for the detection of peripheral targets may, however, depend on the characteristics of the target and the independent variable used to quantify detection. 98
Researchers have attempted to develop a model of lighting based on visual performance. Hills considered the visibility of tail lights, road surface obstacles and pedestrians, and characterised this using the luminance difference between the target and background and the visual size of the target. 99 Davison reported that the association between fundamental measures of visual performance (e.g. acuity) and driving performance was weak and suggested instead the need to consider contrast sensitivity. 100 VL provides one way of doing this. Consider the luminance of a target object and its background: VL is the ratio of the actual difference in luminance to the luminance difference at threshold, calculation of this threshold giving consideration to contrast polarity, observation time and observer age. 27 As VL increases above 1.0, an object starts to appear in silhouette. Subsequent research has been carried out to explore VL and establish the value of VL needed for adequate visibility.101,102 Most recently, Buyukkinaci et al. 103 found that VL ≥ 7.0 ensured the target could be detected, established using four target reflectances (0.2 to 0.5) under four classes of lighting (M2 to M5): note that these are higher levels of visibility than adopted in Appendix A of CIE115:1995. 32
Detection is affected by the size and reflectance (and hence luminance) of the target. 99 A standardised target of size 200 mm × 200 mm is used in some studies, this being considered the smallest size of object which might be dangerous to traffic. 104 At 100 m ahead this subtends a size of 7 min. CIE115:1995 refers to a smaller target (180 mm × 180 mm) but located at a closer distance, 83 m ahead of the observer, and which hence subtends a similar visual size. In CIE115:1995, the STV target had a luminance reflectance of 20%. Reflectance is an interesting issue for hazard detection. Road lighting illuminates the road surface and an object is revealed by negative contrast (silhouette) against the light background: objects of low reflectance are easily perceptible. Vehicle head lighting illuminates vertical surfaces and an object is revealed in positive contrast against the dark background; objects of high reflectance are easily visible but those of low reflectance are not. 104
Some studies have revealed limitations of the STV approach. Lecocq 105 raised concern about the use of STV in wet conditions; Menard and Cariou 102 suggested that the small target was of little use in evaluating the visibility of pedestrians; Raynham 31 questioned the validity of such a simple object for real obstacles.
One limitation of vision-based models is that they tend to consider only one, or a limited number of, the myriad features of a visual task (size, contrast, location of target) encountered in the real world. The next approaches to be considered overcome this limitation by considering the outcomes of a change in lighting, on either driving behaviour or accident rates.
4.2. Driving performance
Driving performance can be examined whilst using a simulator or driving a real car on either a test track or open road. Following studies which had examined peripheral detection in laboratory situations,60,61 Akashi et al. 62 examined detection while participants drove along a test track. Rather than using an abstract response task to note detection of a peripheral target, their test participants were required to use the brake and accelerator pedals to indicate detection. While such an approach is a step toward better ecological validity compared with button pressing, it was still a direct response to detection.
Measures of driving performance include the mean and variance of vehicle speed and lateral position, or driver actions such as steering wheel control. 106 In a simulator study, Shahar et al. 51 examined lane control on a curved section of rural road, the road being either unlit (i.e. no road lighting but headlighting was in use), conventionally lit, or unlit but using self-luminous (LED) road studs. They examined the standard deviation of lateral position because this gives some idea of the driver’s control over the vehicle. For left-hand turns, the standard deviation of lateral position was lower for driving with road studs than for either the lit or unlit road: for right-hand turns, there was a smaller standard deviation for the road studs than the unlit road, but not smaller than for the lit road.
In a large scale field study, Li et al. fitted approximately 2500 cars across seven states of the USA with data collection systems, including video and in-vehicle sensors. 107 Every trip in these vehicles was monitored for more than one year. The resultant database provides a rich database of driver behaviour. The lighting data collection of the previously described project was captured in two US states that overlap with the driver behaviour data collection. 15 Combining these two data sets allows for an analysis of the impact of lighting in specific portions of the roadway.
Impact of an increase in the illuminance on driver behaviour

These data are for the entrance ramp. 107
indicates a decrease in the behaviour; ↗ indicates an increase in the behaviour.
NS: not significant; EN: entrance category.
4.3. Lighting and road accidents
Investigating the association between changes in lighting and the frequency and/or severity of road traffic accidents is an outcomes-based approach to setting light levels. While it does not directly examine why a change in lighting leads to measured outcome, accident reduction is the benefit part of the cost–benefit approach used in some cases to justify installation of road lighting. For example, a UK manual assumes reductions in personal injury accidents of 10% on motorways and dual carriageway roads and 12.5% on single carriageway roads. 108 In contrast, in New Zealand, it is assumed that upgrading or improving lighting leads to a 35% reduction in crashes. 26
In 1992, the CIE published a report which examined 62 studies of lighting and road accidents from 15 countries. 109 These suggested new or improved lighting led to accident reductions after dark in the range of 13% to 75%, although only approximately one-third demonstrated statistical significance. One interesting point is that they found ‘No definitive relationship between accident reduction and parameters of lighting’.
The 2009 Cochrane Collaboration review 110 of road lighting and traffic accidents identified 17 controlled before-after studies, including the Box study described above, conducted in the USA, UK, Germany and Australia and published from 1948 to 2006. There are fewer studies here than in the CIE review because Cochrane reviews apply strict inclusion criteria. Of the 17 studies, 12 investigated the effects of newly installed street lighting, four investigated the effects of improved lighting, and one study investigated both new and improved lighting. Effectiveness of lighting was determined using a rate ratio of accidents before and after the change to lighting compared with the corresponding ratio in a control area. The review found, for example, that installing road lighting in a previously unlit road led to a rate ratio of 0.45 (95% confidence interval 0.29 to 0.69), which implies a 55% reduction in crashes compared to that in the control area.
Advances in technology mean it is now much easier to collect and analyse larger data samples and that can be seen in more recent studies. For example, Wanvik considered 763,000 injury accidents on Dutch roads over a 20-year period (1987–2006). 24 The analysis used an odds ratio approach, comparing lit and unlit roads in daylight and after dark, and determined that on lit roads injury accidents after dark were reduced by 50%. This agrees well with the 55% reduction found in the Cochrane review. Within these data, it can be seen that the benefit of road lighting is reduced during adverse weather and poor road surface conditions and that there is a larger benefit for pedestrians and cyclists than occupants of motorised vehicles. Yannis et al. 25 considered 358,485 police-recorded road accidents in Greece, 1996 to 2008, and also found that on lit roads, there were fewer accidents than on unlit roads. One study used night/day crash ratios to investigate effects of lighting on crash frequency for a specific part of the road – intersections. 111 They examined 22,058 accidents at 6464 intersections in one US state (Minnesota) over a 4-year period (1999–2002). Lit intersections were associated with a 12% lower night/day crash ratio than unlit intersections.
Comparing accident rates between lit and unlit roads tells us nothing about the influence of changes in light level or other characteristics, and to do that a large number of sites with different light levels are needed – this was the approach used in the USA by Box (Figure 1). 14 Using large datasets help to overcome limitations of a road accident approach to establishing light levels associated with events being infrequent and having multiple causation factors. 100
A similar study was carried out in the UK.112,113 Data were collected from 89 two-way urban roads, each at least 1 km long, and with a 30 mph speed limit, within a 3-year period (1974–1977). The photometric measurements and the accidents analysed were only those for dry conditions. Average road surface luminance was found to be the best predictor of the night/day accident ratio, and the best-fit trend suggests an increase in luminance from 0.5 to 1.0 cd/m2 reduces the night/day ratio from approximately 0.57 to 0.42, a 15% reduction in accidents at night (Figure 3). This increase in luminance is approximately equal to an increase from 0.7 to 1.4 foot candles (assuming a diffuse road surface reflectance of 20%), for which the Box data (Figure 1) suggest a reduction in accidents at night of approximately 3% for the six-lane roads but an increase of over 100% for the four-lane roads. One reason for the differences is the speed limit, being lower in the roads examined by Scott
112
but is also likely to be affected by factors such as road geometry and traffic volume.
Night/day accident ratio plotted against average road surface luminance. The curve is the best-fitting exponential through the data after weighting each ratio for the number of accidents to which it relates (after Hargroves and Scott
113
)
Jacket and Frith 26 examined 7944 crashes across 270 km of road in New Zealand in the period 2006 to 2010. This analysis used night/day crash ratios to determine the effect of changes in lighting, lighting being measured in the field. They found a 19% reduction in after-dark crashes (across all types of reported accident) for each 0.5 cd/m2 increase in average luminance, a similar reduction to that reported by Hargroves and Scott. 113 The reduction varied with context, ranging from 15% for crashes on wet roads to 56% for midblock collisions with pedestrians.
Gibbons et al. 15 examined 83 000 crashes in the period 2007 to 2012 over 2000 miles of road in the USA, with the lighting being measured across the whole of these roads. This work used the night to day crash rate ratio (number of crashes per million vehicle miles during the night/number of crashes per million vehicle miles during the day) to determine the relationship between light level and safety. The results suggest that increased illuminance leads to a reduction in the night/day crash ratio, this relationship changing for different types of road, but that at some point, an illuminance is reached beyond which further increase in illuminance is unlikely to bring further benefit in terms of safety: This point identifies the optimum illuminance. For freeways, this optimum was 5.0 lux. This is lower than illuminances determined (assuming road reflectance class R2 with q0 = 0.07) from the recommendations of IESNA 4 (9 lux) and CIE 1 (21 lux for class M2). That the optimum light level from Gibbons et al. for a freeway is significantly less than current recommendations indicates an opportunity to reduce light levels on this class of road by around 50% without increasing the night/day crash ratio.
Comparison of results or recommendations is not always straightforward because of differences in approaches to specifying context. CIE guidance defines context by user (driver or pedestrian) and within each of these a lighting class is selected using a series of criteria that have been determined to be related to safety such as vehicle speed, traffic volume and presence of parked vehicles (Table 6). The IESNA system relates lighting recommendations to road type (Tables 2 and 3) and does not consider these other criteria.
Many studies14,15,26,113 use the ratio of nighttime to daytime road accidents as the measure of effectiveness of changes in lighting – better lighting reduces the night/day crash ratio. Using this ratio, however, involves making an implicit assumption that changes in traffic densities, level of alcohol intoxication, level of driver fatigue and driver demographics from day to night are the same for roads lit to different levels and this may not be correct. 114
One approach to controlling these differences is to take advantage of the clock change associated with Daylight Savings Transition (DST). Typically, adjustment to DST means that the clock is advanced by one hour in spring and set back by one hour in autumn. The effect of this change is that a certain period of time, close to either dawn or dusk, is suddenly changed from daylight to darkness (or vice versa), whilst the traffic density, level of alcohol intoxication, level of driver fatigue and driver demographics are unlikely to have changed. Any change in accident rates in these periods, before and after the clock change, can plausibly be ascribed to the change in ambient light.
Sullivan and Flannagan adopted this approach to investigate fatal road accidents. 115 They compared crash rates (1987 to 1997) across the USA occurring in the weeks before and after the Spring and Autumn DST clock changes. While this study did not examine changes in the level of road lighting, it does provide some evidence of the types of road accident that are likely to be prevented by light. Specifically, collisions involving pedestrians were found to be up to seven times more likely in darkness than during daytime, the risk being greater for collisions on straight, high speed rural roads than at intersections. In contrast, crashes involving a single vehicle were only marginally more likely in darkness.
Odds ratio of accident risk in darkness

Note: Data are the pooled estimate of accidents in Sweden, Norway and the Netherlands, after Johansson et al. 117
Inadequate lighting is not the only cause of road accidents. It was concluded by CIE that ‘the installation of lighting cannot be expected to result in a reduction in accidents if there is a major non-vision problem at any particular site’. 109 The assumed association between lighting and accidents can lead to pressure being applied to a local authority to install lighting in response to an accident without it being certain that the underlying cause was lack of lighting: this may prevent resources from being diverted to where they will be most effective. 118
A further caveat to the accident frequency approach is that driving performance can be hindered by distraction119–121 and this has been identified as a significant cause of road accidents.122,123 Drivers are less responsive to hazards when distracted by actions such as using a mobile phone, which can cause a greater distraction, and significantly slower reaction times, than that associated with the legal limit for blood alcohol level. 124
4.4. Comparing approaches
Research undertaken to establish the benefits of road lighting for drivers can be divided into three broad types: effects on visual function measured in the laboratory, driving performance on simulators or test tracks and the frequency and type or road traffic collisions. Either of these approaches could be used to set road lighting standards. In some cases, standards have migrated between different approaches; for example, the IESNA first set a light level based on crash data (the Box data), 125 then tried to move to a vision-based system (STV approach), 30 and has since returned to the original accident-based format. 4 These documents had some internal inconsistencies, but ultimately, the approaches have shown similar light levels to be selected with some slight variation based on roadway type with some roadways assuming they need a higher level than they do when crash data are reviewed. As an example, the illuminance criteria for Freeway Class A of 6.0 lux became 0.6 cd/m2 for an R1 road class.
An advantage of the vision-based approach is the direct link between the independent (changes in lighting) and dependent (visual response) variables. If vision was the only factor influencing driving performance and traffic collisions, then all three approaches would reveal similar relationships with lighting, but that is not the case. 126 Laboratory studies and simulators or test tracks tend to adopt a metric of interest (e.g. detection distance) to determine the effect of changes in lighting, with the assumption that this is directly related to safety. Driving performance is also influenced by fatigue, alcohol consumption and cognitive distraction, which change the relationship between lighting and performance. If the primary target of road lighting is to promote safe travel along a road, then standards should be guided by collision-based analyses. However, these demand more research effort than vision-based analyses due to the rarity of roadway crashes and the independent archiving of lighting data and accident data. In the meantime, research linking lighting to driver visual performance and behaviour must be used to determine light levels.
New lighting design approaches and research has shown then we can modify behaviours with the roadway lighting, which allows us to determine lighting needs in specific areas of the roadway. 107 This will ultimately determine the best approach to lighting a roadway with the maximal benefit to the driver.
5. Lighting for pedestrians
5.1. The visual needs of pedestrians
In 1950, Waldram stated that “probably the most important problem to be solved is the lighting of residential roads … The methods used hitherto have generally been small-scale imitations of traffic route methods and have achieved the worst of both worlds: there is room for some careful experiment and a new approach in this field.” 6 The foundations of lighting for pedestrians were set by Caminada and van Bommel. 40 Prior to this point, lighting research related to pedestrians had largely considered only their visibility to drivers127–129 rather than addressing the direct needs of pedestrians. From a common sense approach, Caminada and van Bommel suggested three key criteria to be detection of obstacles, identification of persons and pleasantness. Some verification of the likely importance of the first two of these criteria was gained using mobile eye tracking in a natural, outdoor urban setting.76–77 Eye tracking reveals those locations on which gaze is directed but without revealing the attention being paid to that object of view: what this work did was use a dual task (additional cognitive load) to reveal the more important of these visual fixations.
One issue not raised by Caminada and van Bommel was the contribution of lighting to promote reassurance to walk after dark, in other words, to increase the level of perceived safety or reduce the fear of crime. Directly asking people as to whether lighting makes them feel safer may lead the witness toward the desired answer regardless of whether it was the intended response. The benefit of road lighting was however demonstrated in a study using an unfocussed approach that aimed deliberately to reduce the focus on lighting or fear. 130 This was to ask people to provide photographs of locations where they would and would not be happy to walk alone, after dark and then use these images as visual prompts in a subsequent interview where they were asked to explain their choices of locations. The presence of road lighting featured in a similar proportion of responses as did access to help and the physical features of an environment associated with prospect and refuge, and these more than any other factors. The importance of light was also confirmed by others. 131
Locations that are considered to be brighter tend to be associated with higher levels of reassurance132,133 and brightness is influenced by both the level and SPD of lighting. Regarding the benefit of light level, studies examining two or more illuminances tend to find the higher illuminance to provide the safer environment,35,134 regardless of whether the illuminances observed were relatively low (0.24 lux and 1.31 lux), 135 or relatively high (15 lux, 25 lux and 50 lux). 136 In some studies, responses are sought before and after a change to the lighting, with that change tending to be an increased light level and/or a whiter SPD, and these tend to find a favourable response to the change – greater reassurance. What we do not know, however, is whether the favourable response was due to a change per se, a Hawthorne-like response where any change would have led to greater reassurance, or because of the actual changes in lighting conditions.
Two studies reveal directions that might provide resolution. First, consider the field survey reported by Knight, 137 which was largely designed to demonstrate that MH lighting would be considered safer than the HPS lighting it replaced. Knight also included a reverse change, in which the MH lighting was replaced with HPS lighting, and the results suggest a statistically significant reduction in the perception of safety (p < 0.05). This gives some confirmation that observers were evaluating the effect of lighting and not just responding to a change. Second, Boyce et al. 42 introduced the day-dark approach in which ratings of reassurance are captured both during daytime and after dark, and the effectiveness of lighting is evaluated against the difference between the daytime and after dark ratings. The advantage of this approach is that it leads towards an optimum illuminance rather than towards ever-higher illuminances. Boyce et al. investigated car parks in the US and their results suggested an illuminance of 30 lux was required to reduce the day-dark difference to 0.5 units on their 1–7 response scale. The day-dark method has since been applied to pedestrian footpaths and day-dark differences of 0.5 units on the response scale (1 = very dangerous to 6 = very safe) correspond to illuminances of 7.0 lux (a field study in Sheffield, UK) and 10 lux (a field study in Rome, Italy). 138
There is evidence that SPD affects brightness under the low light levels of road lighting, this evidence coming from studies using a range of contexts, procedures and specific SPDs.72,137,139–146 These studies tend to show that an increase of radiant power in the short-wavelength region enhances spatial brightness. There is on-going consideration regarding whether this is best characterised by the rod receptors or by some combination of the s-cone receptor and ipRGC,146,147 and with the adequacy of horizontal illuminance as a measure for spatial brightness: 148 Any proposals need to consider practicality alongside precision.
One reason for investigating reassurance is that greater reassurance is assumed to promote the decision to walk rather than use motorised transport for local journeys: Foster et al. found that for every increase of one level on a five-point Likert scale measure of perceived safety, the amount of time spent walking within the neighbourhood increased by 18 minutes per week. 149 This decision could be investigated directly by counting the numbers of pedestrians walking in different lighting conditions but this would require careful matching of test and control locations to ensure the only difference was lighting. In one study, 116 the effect of ambient light level on travel choice was investigated using the DST clock-change approach used by others to investigate road accidents: 115 the numbers of pedestrians and cyclists during the case period were significantly higher during daylight conditions than after-dark, and this relationship was subsequently confirmed using a second method of analysis. 150
Road lighting should aid the detection of pavement obstacles that might otherwise result in a fall, and the associated research has focussed on the ability to detect pavement irregularities such as a raised paving slab. This is important because falls on public footpaths are a significant problem in terms of the number of cases, the severity of the resulting injury and the national cost.151–154 Four studies have investigated how changes in lighting affect obstacle detection in peripheral vision, two using a scale model70,155 and two studies using larger apparatus to improve ecological validity71,156; a further study investigated the ability to safely navigate obstacles following a sudden reduction in light level. 157
Further work sought to identify the critical height obstacle that pedestrians ought to be able to detect, rejecting the widely cited (and apparently unsubstantiated) rule of 25 mm, and instead suggesting 10 mm to be the critical height. 158 In all, 10 mm is the approximate lower quartile of the range of minimum foot clearance when walking along a flat surface and the lower limit of the range of heights associated with the most frequent number of tripping accident compensation claims.
Laboratory trials show that while higher illuminances lead to increased detection probability, this reaches a ceiling in the region of 2.0 lux; observer age and light source spectrum (characterised using the S/P ratio) affect detection only at low illuminance (0.2 lux).70,71,155 Consideration of these results alongside those of Boyce 157 suggests that a minimum photopic illuminance of 1.0 lux is sufficient light for pedestrians of all ages to safely detect and avoid trip hazards under any type of lamp. Still to be resolved are the influences of disability glare and the spatial distribution of light.
Pedestrians make judgements about the intentions of other people, for example to inform the decision of whether or not to continue walking in the same direction or to take action to avoid approaching any closer. After dark, road lighting should assist this judgement. Early work on this topic examined identity recognition judgements.41,141,159 One conclusion drawn from this work was that lamp spectrum does not influence the performance of the identity task. Other studies, however, concluded that there is a significant effect of SPD137,160 and these data contributed to an assumed benefit of better colour quality in revised guidance. 68 Subsequent research first examined methodology, proposing that different procedures may lead to different conclusions,161,162 that facial emotion recognition from expression is a more suitable task than identify recognition,163–165 that a brief duration of 500 ms better resembles typical behaviour than does continuous observation,166,167 and that the stop-distance approach used in many studies may not lead to the same conclusions as evaluations made at the desirable observation distance of 15 m.166,167 In studies carried out using facial emotion recognition, SPD is not suggested to be a critical parameter.168–171 One question still to be resolved is whether a measure of vertical illuminance is needed to characterise this task or whether it is safe to assume that horizontal illuminance at the road surface is sufficient.
Cyclists are another category of vulnerable road user and their needs have received even less attention in lighting research than for pedestrians. Such research is desirable because cyclists are at high risk of a road accident, 172 and there are policies in many countries to promote cycling as a sustainable travel alternative to motorised vehicles. There is evidence that changes in practice and policy would be advantageous, 172 that improvements in the design and location of cycle lamps could improve safety,173–175 and that reflective clothing enhances conspicuity after dark. 176 Many cyclists appear reluctant, however, to use these aids to safer cycling, with on-road surveys in the UK suggesting that only around 25%–58% of cyclists use both front and rear lamps.177–179
5.2. Drivers’ detection of pedestrians
While there is a need to consider what pedestrians would like to see, a significant benefit to pedestrians of road lighting is that it may help to increase their visibility to drivers and hence reduce the frequency of road traffic collisions involving pedestrians. Globally, over 270,000 pedestrians die each year. 180 Within Europe, approximately 20% of road fatalities involve pedestrians and cyclists. 181 In the UK in 2015, there were 186,189 road accident casualties of all severities, of which 28,869 were killed or seriously injured (KSI): within this, 408 pedestrians were killed and 4940 seriously injured. 182
Studies using the DST approach to the analysis of accident records provide clear evidence that ambient light offers significant benefit to a reduction in road collisions involving pedestrians.115,126,183 One benefit of road lighting for pedestrian detection is that it can offset the reduction in detection distance brought about by glare from the headlamps of on-coming vehicles. 184
Regarding the amount of light needed to detect pedestrians, some evidence may be gained by considering lighting at pedestrian crossings. There is however no agreement as to the optimum light level for pedestrian crossings nor where to measure it. ANZ guidance 185 suggest horizontal illuminances of 16 lux (local roads) or 32 lux (arterial roads).
CIE also recommends horizontal illuminances, with averages of 20 lux in residential areas and 30 lux in commercial areas. 186 US guidance 4 suggests instead to use vertical illuminances (at 1.5 m height), these being 10 lux and 2 lux for areas of high and medium pedestrian conflict, these data as determined from test track studies. 187
A limitation of specifying a single value of illuminance is that it does not account for local conditions: it may be too low if visual adaptation is raised by extraneous local lighting or by a generally high level of road lighting. In the UK, TR12 of the Institution of Lighting Professionals overcomes this by recommending an illuminance relative to that of the road in which the crossing is placed, which is itself chosen partly with consideration to the surrounding environment. 188 Specifically, it suggests horizontal illuminances are 3.5 times (and vertical illuminances are 2.0 times), the horizontal illuminance of the road. For average road illuminances specified in BS5489-1:2013, these ratios lead to horizontal illuminances from 7.0 lux to 52.5 lux and vertical illuminances of 4 lux to 30 lux. 5 While this may be an interesting approach, the basis of the multiplication factors is unknown.
With conventional overhead lighting, a pedestrian moves between areas of positive and negative contrast when using a crossing. Between these areas, the contrast approaches zero and the pedestrian is difficult to see. An alternative solution was reported by Bullough et al. 189 in which the overhead lighting is replaced by low level bollards with a vertical, linear light source, placed just ahead of the crossing and aimed towards pedestrians on the crossing. This places the pedestrian in permanent positive contrast by illuminating vertical surfaces of the pedestrian rather than the road surface. The results of simulations and field trials suggested that pedestrian visibility is increased, glare to drivers is significantly reduced, and installation costs are reduced.
Other factors than lighting are involved in the detection of pedestrians. First, consider expectation: in some circumstances, a driver does not expect to encounter pedestrians and this reduces their conspicuity, 190 leading to the ‘looked but didn’t see’ phenomenon. Second, pedestrians tend to render themselves less visible to drivers by wearing dark clothing; there is a tendency for pedestrians to over-estimate their visibility to drivers and under-estimate the benefit of reflective clothing, 191 and to avoid using devices known to significantly enhance visibility such as reflective markings to highlight bio-motion 190 or active visibility aids. 192 Third, a potentially significant approach to reducing accident frequency is to consider legal responsibility for accident compensation. 193 In the UK, the victims (e.g. a pedestrian or cyclist) of collisions with cars must seek compensation for their injuries by proving that the car driver was at fault (i.e. negligent), causing harm to the cyclist by failing to uphold a reasonable standard of driving. An alternative approach is that of presumed liability, where it is presumed that the car driver is responsible for any collisions and must pay 100% of the compensation for the victim’s personal injuries unless the driver can prove that the victim was significantly at fault. If drivers are thus motivated to change the manner in which they consider the safety of vulnerable road users, this may benefit road safety regardless of any change in road lighting.
In recent years, there has been a tendency (within the UK at least) to switch off or dim road lighting at certain times of the night as an energy saving measure. Steinbach et al. 194 examined the impact of these actions on crime rates and traffic collisions across 62 local authorities in England and Wales of four energy saving changes to road lighting; permanently switching off, reducing the number of hours switched on at night (part-night), reducing the output (dimming) and replacing the widely used (in the UK) sodium lamps for whiter light sources. Regarding crime, it was found that neither switching-off nor part-night strategies affected crime rates, but that there was weak evidence of a reduction in crime associated with white light and dimming strategies. Regarding traffic collisions, the study found no evidence that either strategy led to an increase: this is somewhat surprising given the results of other studies suggesting lighting a previously unlit road reduces the after dark crash rate,24,25,109,110,111 and that lower light levels are associated with increased crash rates.15,26,113
A further problem with such energy saving strategies is that we do not know how it will affect behaviour. In one study, lighting was initially dimmed (to 20%, 40% or 60%) but switched to 100% (85 lux) when a test participant walked past a motion sensor: walking speed along a 19 m path was slower in those trials where lighting was initially dimmed compared to those in which it was maintained at full output. 195
6. Moving forward
With pressure being placed on the lighting industry to make responsible choices to control the side-effects of road lighting, and with developments in the science and technology of lighting and lighting research, there is an ongoing need for standards to evolve. An effective standard is one that is related to the intended benefits for road users – an aid to vision to be able to travel safely, to feel safe and to minimise the risk of road collisions. While there appears to be little, if any, credible empirical support for light levels recommended in much current road lighting guidance, data are emerging that will allow standards to be better informed by empirical evidence.
In addition to the quantification of lighting, there may be a need to change the parameters that are quantified. For pedestrian lighting, this may be a measure of vertical illuminance instead of or in parallel to horizontal illuminance. For drivers, there may be a move away from standards apparently based on STV towards alternative models such as Relative Visual Performance 196 or the Cumulative Probability Index where the probability of a driver seeing objects in the roadway can be used for the analysis of the lighting needs 197 and for determining visibility. 29
Such issues are discussed in technical committees such as those of Division 4 in the CIE. Currently, there are active technical committees considering lighting for drivers (TC4-51), pedestrians (TC4-52) and the impact of glare (TC4-33), and working groups considering lighting for the elderly and cyclists. In North America, the IESNA Roadway Lighting Committee is preparing a revision of all of their standards, trying to link lighting needs to driver performance.
Footnotes
Declaration of conflicting interests
The authors declared no potential conflicts of interest with respect to the research, authorship, and/or publication of this article.
Funding
The authors disclosed receipt of the following financial support for the research, authorship, and/or publication of this article: Gibbons: Much of the research mentioned in this article has been performed with the support of Government Agencies like the US Federal Highway Administration, local agencies, lighting companies and other interested parties. Fotios’ contribution to writing this article was supported by the Engineering and Physical Sciences Research Council (EPSRC), grant number EP/M02900X/1.