
Abstract
Luminance adjustment is a procedure commonly used to evaluate discomfort glare and the results from adjustment experiments form the basis of some recommendations for limiting its occurrence. There are, however, strong reasons to expect that settings made using adjustment are unintentionally influenced by extraneous variables. This paper discusses bias towards the initial anchor, the setting of the variable stimulus immediately before an adjustment is made. Specifically, the initial luminance is expected to influence the setting that is made by adjustment; for example, a lower initial luminance leads to a lower setting than a high initial luminance. To investigate anchor bias, a Hopkinson-like multiple-criterion adjustment experiment was undertaken, but with three different anchors. The results confirmed significant bias: glare settings were biased towards the luminance of the initial anchor. This demonstrates a need for caution when using adjustment to explore discomfort glare and when interpreting the results of past studies that used discomfort glare models fitted to data obtained with this procedure.
1. Introduction
1.1. Models of discomfort glare
Discomfort glare is generally defined as a psychological sensation that causes distraction or annoyance without necessarily being linked to a reduction in visual ability.1,2 This discomfort arises from the luminance of a light source (or luminance contrast) within the visual field of an observer that is sufficiently greater than the conditions to which the eyes are able to adapt to. 3
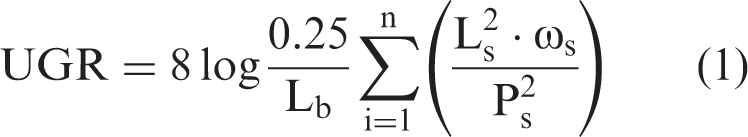
Lighting designers aim to minimise the risk of causing discomfort3,4 and one means for doing this is to calculate, for a proposed lighting installation, one of a number of recommended glare indices. Among such indices is the Unified Glare Rating (UGR),
5
shown in equation (1), as recommended by the Society of Light and Lighting (SLL)
4
and originally developed by the International Commission on Illumination (CIE).
5
The UGR describes the level of discomfort due to glare according to the luminance, size, and location of the light source, and the luminance of the background
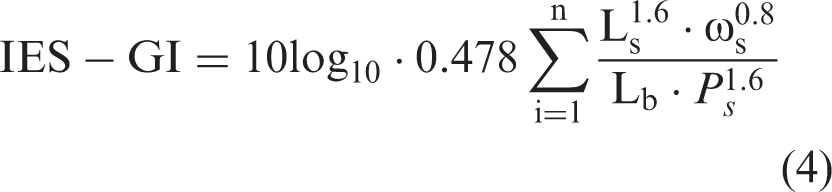
The UGR is a development of the Illuminating Engineering Society Glare Index (IES-GI),
6
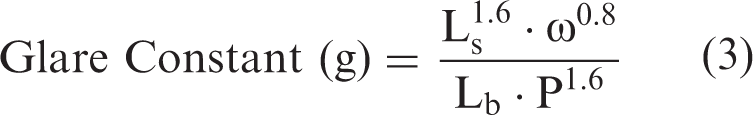
but with an alternative approach to account for the luminance of the background.7,8 The IES-GI (equation (2)) is itself a development of the Glare Constant (equation (3)) established in the discomfort glare studies of Petherbridge and Hopkinson,
9
but with a logarithmic function to account for the sensitivity of the visual system
10

The UGR and CIE discomfort glare systems were derived from the IES-GI without further experimental evaluations of discomfort glare sensation. In fact, during the development of the UGR, Sorensen 8 stated that the ‘basic formula [IES-GI] appears […] to be sound and the glare index concept is well established in the countries for which this method was developed. The basic formula was, therefore, accepted as the “dogmatic truth”’.
In other words, the discomfort glare model currently recommended by SLL 4 can be traced back to the glare experiments carried out by Petherbridge and Hopkinson. 9 As a matter of fact, the basic form of the IES-GI is still utilised in modern glare formulae (e.g. UGR).
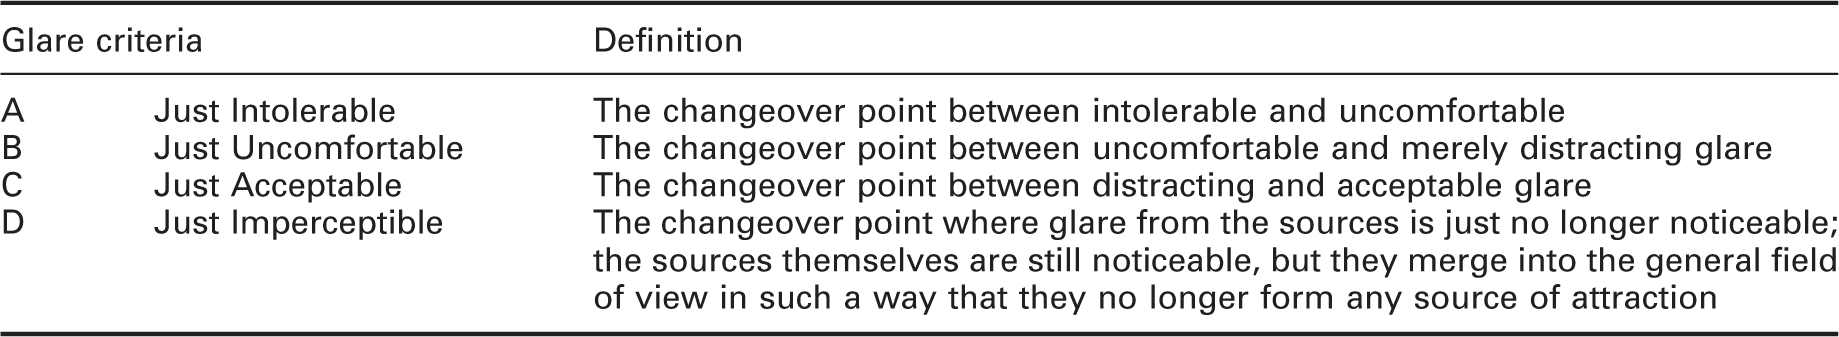
Definitions of the four criteria of discomfort glare sensation 9
Although glare indices are intended to provide consistent predictions across a range of conditions and measurement methods, many studies have reported large inconsistencies between subjective evaluations of discomfort glare sensation and the IES-GI.11–18 For example, previous work by the authors has shown extremely wide variance when values of IES-GI calculated from adjustments made to the source luminance were plotted against the level of glare sensation provided by test subjects
13
(Figure 1).
Glare sensation votes against calculated values of IES-GI
13
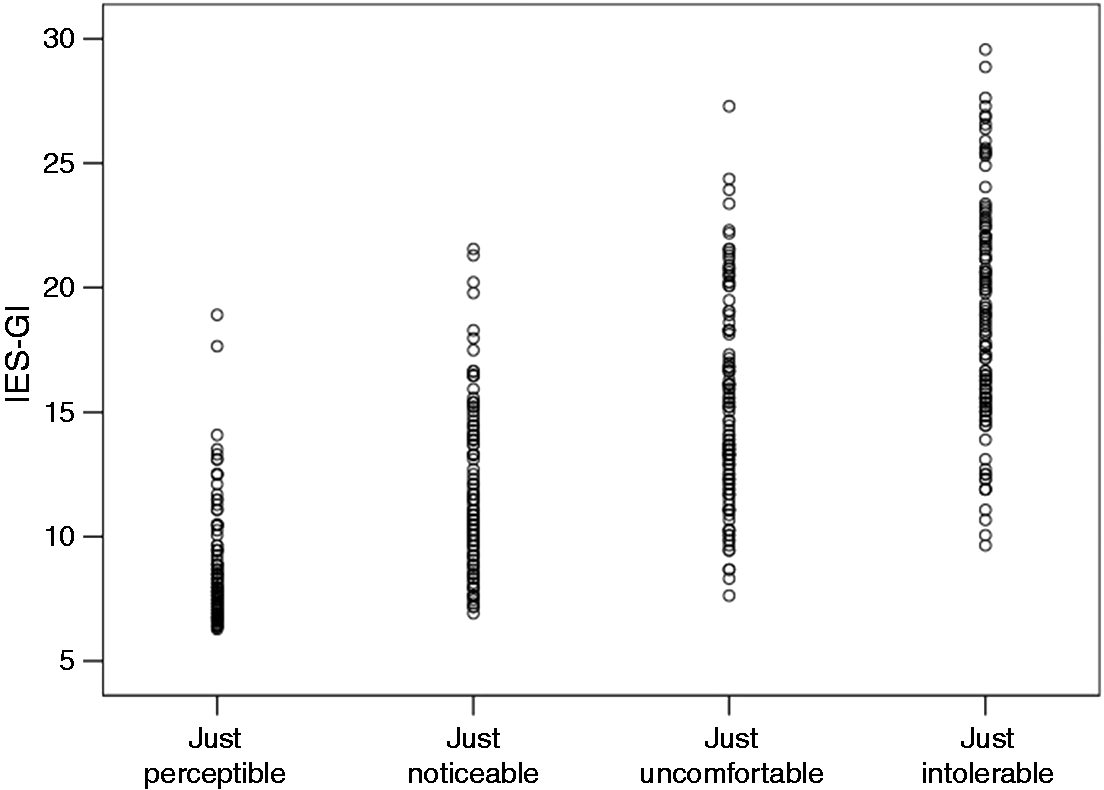
While discomfort glare is widely discussed in research and lighting design practice, it is not yet fully understood.19–21 One factor that may be limiting progress towards its better characterisation is an insufficient consideration of experimental methodologies. In this paper, we explore the contribution to the variance that might be attributed to one part of the adjustment procedure employed by Petherbridge and Hopkinson.
1.2. Adjustments and heuristic anchoring
When using the adjustment task in glare experiments, either the glare source or its background can be varied. Hopkinson
22
suggested that observers often felt more confident when the source luminance was held constant and were instructed to adjust the luminance of the background. For this reason, Petherbridge and Hopkinson,
9
and other studies by Hopkinson,23–26 mostly used adjustment of background luminance to the four predefined discomfort glare criteria, while adjustment of the source luminance was seldom utilised.
27
Adjustments to the four predefined discomfort criteria presented in Table 1 were consistently made in order of increasing magnitude. This is stated explicitly in Hopkinson and Bradley
27
: To begin, the source was off … [the observer] had previously been explained what was demanded of him, first, to raise the brightness of the source himself by means of the dimming control knob until the threshold of glare (Criterion D) was reached… the observer then slowly raised the brightness of the source again, allowing pauses for adaption, until the next degree, just acceptable glare (Criterion C) was reached. Criterion (B) just uncomfortable glare came next, and finally criterion A, just intolerable glare
To confirm that, when an adjustment procedure was used, the reported mean luminance could be explained by stimulus range bias (i.e. the mean luminance was located at the centre of the range of available luminance variation).34–36 Fotios and Cheal 37 carried out an experiment to investigate preferred light levels. Twenty-one participants were instructed to adjust the brightness inside a small booth until they achieved ‘satisfaction with the light level’. The trial was repeated using three ranges of illuminance (48–1037 lux; 83–1950 lux; 165–2550 lux) without the observer being informed of the change. These three ranges led to significantly different settings.
In their experiment, 37 both low and high anchors were used, these being the minima and maxima of each of the three ranges, and it was found that mean-adjusted illuminances were consistently biased towards the initial setting. One limitation of the procedure, however, is that the sequence of high and low anchors was not randomised but the low anchor was always experienced first. The anchoring effect was therefore further investigated in two studies seeking settings of preferred light level38,39 and in one study seeking settings of preferred correlated colour temperature 40 : significant anchoring effects were found in all cases.
A study by Osterhaus and Bailey 41 also provides evidence of anchoring bias in the evaluation of discomfort glare. Observers adjusted the luminance of a large field surrounding a monitor screen (maintained at 12.5 cd/m2) to identify two glare thresholds. These settings were made to six different initial luminances, ranging from 6.3 to 2000 cd/m2. The results showed that the adjustments were influenced by the initial setting: ‘subjects selected higher luminances when high initial presentation luminances preceded the adjustment’. Moreover, Stone and Harker 16 included conditions that would allow analysis of the effect of anchoring in a glare adjustment trial, but did not report any results that would permit such analysis.
The adjustment procedure presents a variable stimulus that is controlled by test subjects to identify a threshold value (or their preferred setting). According to the literature, 42 on successive trials, the variable stimulus should be set initially to values far above and far below the expected threshold value, and then the absolute value should be taken as the mean of these two settings. Boyce et al. 43 used an alternative approach to investigate preferred light levels, since their dimming control was set initially to the 50% position. Logadóttir et al. 38 examined this by using a mid-range anchor in addition to low and high initial settings. While they found that the preferred illuminances using only the middle anchor were significantly higher than the mean of the low and high anchors, they also noted that the non-linear response of their dimming controller may have influenced this disagreement.
In summary, the literature provides reasons to believe that adjustment tasks traditionally used in glare experiments might be biased towards the initial luminance setting. If this proves correct, the results from the Petherbridge and Hopkinson 9 study – and, hence, the resulting IES-GI index – might provide an incorrect estimate of the background light level (or, more precisely, the relationship between background and target luminances) associated with each glare criterion. To test this hypothesis, an experiment was carried out to confirm whether the initial luminance settings of a variable stimulus (anchor) affect the luminance associated with a given magnitude of discomfort glare.
2. Method
2.1. Experimental setup
Discomfort from artificial lighting was evaluated in laboratory tests, using a procedure designed to explore whether anchoring effects (i.e. resulting from different initial settings of source luminance) could be detected. For this study, the background luminance, the subtended area of the glare source, and the position of the glare source in the field of vision of the observer were held constant. There were no extraneous sources of natural or artificial light within the testing apparatus and all other extraneous variables (i.e. temperature, humidity and background noise level) were measured before and after each test session.
The design of the testing apparatus (Figure 2) was informed by previous studies11,13,14,17 that investigated the influence of time of day and view interest on the subjective evaluation of glare sensation.
Plan of the testing apparatus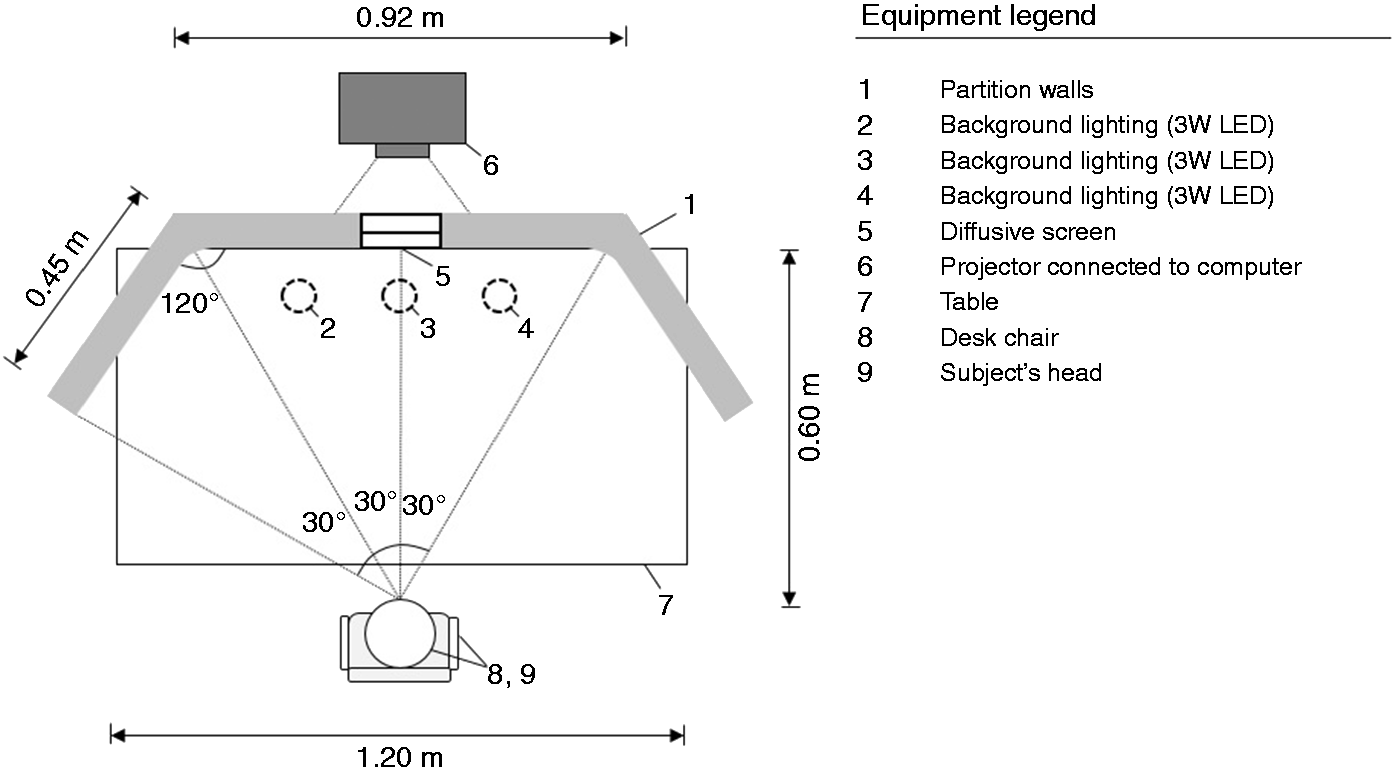
The testing chamber was semi-hexagonal in plan. The interior surfaces (2.7 m in height) were painted matte white, and three 3 W LED lamps were mounted above the subject's head position to produce background lighting with a constant luminance distribution. Luminances were measured from the location of the participant using a Minolta LS-100 luminance meter mounted on a tripod. From this position, the mean background luminance was calculated from 17 individual measurements taken on a regular grid symmetrical about the central fixation point and extended across the width of the apparatus.13,14,17 The mean luminance was held constant at 65 cd/m2 throughout the experimental procedure, since this value is within the range commonly found in interior spaces. 44 The background luminance was measured before and after each test session. The corners where the partition walls met at 120° angles were covered with matte-white tape to increase light uniformity across the chamber.
A desk with a diffusive white surface was mounted within the wooden partitions. The subject's head position was set at a height of 1.2 m from the floor, facing a small diffusive screen (0.08 m × 0.04 m) made from three sheets of translucent paper and mounted in front of a projector connected to a computer. The paper had uniform transmission properties allowing direct light from the projector to be evenly diffused across the area of the small screen. According to the literature, glare indices for artificial lighting are designed to deal with small sources subtending a solid angle below 0.01 steradians.45,46 For this reason, the small diffusive screen subtended an angle at the eye of 0.009 steradians and provided a variable luminance in the range between 200 and 32,000 cd/m2. The luminance of the small diffusive screen was measured using a series of spot-point measurements. The source luminance was progressively increased using the relative brightness function of an image editing software, which was operated by the experimenter. In order to achieve precise luminance values in repeated procedures, the projector had to be calibrated. To do this, the relative brightness was increased at evenly adjusted intervals and spot-point measurements were taken at each interval. Luminance values at each interval were then plotted on a curve using a polynomial function to obtain values between calibrated luminance points.
2.2. Experimental procedure
Definition of the three anchors according to the IES-GI and discomfort glare criteria
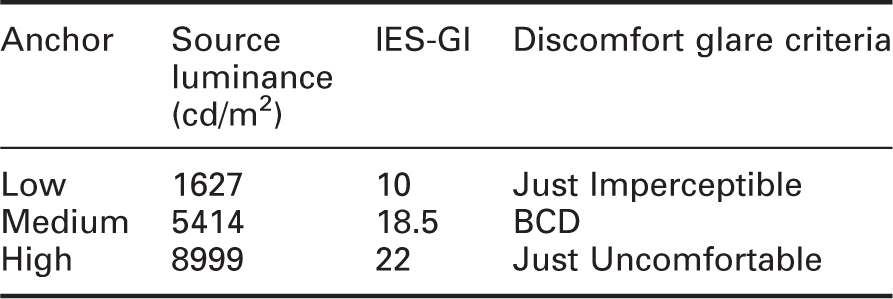
BCD: borderline between comfort and discomfort; IES-GI: Illuminating Engineering Society Glare Index.
For each anchor, the luminance of the diffusive screen was set to an initial brightness (Table 2) corresponding to an IES-GI that, on the Hopkinson scale, describes the source as being, respectively: Just Imperceptible (low anchor); borderline between comfort and discomfort or BCD (medium anchor); and Just Uncomfortable (high anchor). On Hopkinson's scale, the BCD lies between criterion B and criterion C. 26 The Just Uncomfortable criterion was used for the high anchor to avoid any potential harm to the participants with an initial setting corresponding to a glare index of Just Intolerable.
During the experimental procedure, test participants were asked to make judgements of visual discomfort using the glare criteria and descriptors used in the development of the Glare Constant 9 and the IES-GI6,10 (Table 1). Since it was considered that each descriptor could be open to self-interpretation due to the abstraction caused by the assessment, to aid subjects giving more meaningful judgements each criterion was linked to Hopkinson's detailed protocol published in MacGowan 47 and to time-span descriptors 45 (see Appendix 1).
Participants were first asked to adjust the chair so that their head was located at the correct viewing height. A set of instructions was then given including a definition of discomfort glare, the meaning of the four glare criteria, and a description of the procedure. To reinforce the participants' understanding of the four glare criteria, a pre-test condition was provided. The diffusive screen was set to one of the initial luminance settings, chosen at random. Participants were asked whether they would like the experimenter to increase, decrease or keep constant the brightness of the screen and to indicate when the brightness of the screen first reached a sensation of Just Imperceptible glare. For each trial, the experimenter adjusted the luminance of the diffusive screen at a controlled pace according to the participant's instruction. Once the lowest of the four criteria had been met, the luminance of the screen was increased and subjects were instructed to indicate when the other glare criteria were reached in order of increasing discomfort. The pre-test condition was followed by a pause of two minutes.
The brightness of the diffusive screen was then set to a specific initial source luminance anchor, chosen at random, and participants were asked to make the first of a series of recorded glare evaluations. Following the procedure adopted by Hopkinson and Bradley, 27 the subject was asked to direct their gaze towards the centre of the diffusive screen and to vocally indicate when its brightness reached, respectively, a sensation of Just Imperceptible, Just Acceptable, Just Uncomfortable, and Just Intolerable glare. Once each criterion was reached, the screen luminance was recorded. It must be noted that, for this experiment, the four levels of discomfort glare were always evaluated in order of increasing magnitude so as to follow closely the original procedure used by Hopkinson. 9 However, as already indicated by Pulpitlova and Detkova, 48 it is likely that this sequence might influence the adjustments made.
The IES-GI was calculated from the recorded luminances. After making the initial four evaluations, participants were given a short relaxation period (two minutes) before continuing the experiment starting with the next luminance anchor. The test procedure was again repeated until the subject had provided all four levels of glare sensation under each of the three different luminance anchors. To help mask any unwanted procedural effects (e.g. learning, fatigue), the luminance anchors were presented to each test participant in a randomised sequence. 49 Each test session lasted approximately 30 minutes.
Twenty-two subjects volunteered to participate in this experiment. They were recruited via an online advertisement addressed to all postgraduate students in the Department of Architecture at the University of Nottingham. The sample comprised 8 males and 14 females, with a mean age of 29.6 years (SD = 3.75 years). Seventeen subjects wore their normal glasses or corrective lenses, and all self-certified as having no other health or eye problems.
3. Results
3.1. Adjustment task and initial luminance settings
Mean source luminance (and standard deviation) for the three anchors and the four glare criteria
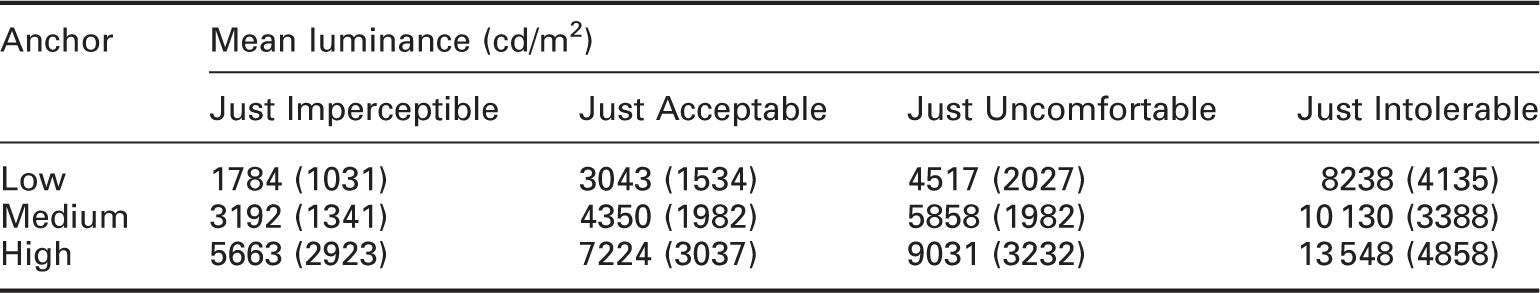
Figure 3 presents, on the x-axis, the four glare criteria provided by the test subjects according to the three initial luminance anchors. On the y-axis, the figure plots, on the left side, the mean IES-GI values of the small diffusive screen. On the right side, the figure presents the interpretation of the IES-GI derived from Hopkinson,
10
where benchmarks are provided for Just Imperceptible, Just Acceptable, BCD, Just Uncomfortable, and Just Intolerable glare (IES-GI ≥ 10, 16, 18.5, 22, 28, respectively). Calculated values of IES-GI below 10 are denoted as the condition that would not cause any glare sensation.
Mean IES-GI for the three luminance anchors and the four glare criteria (error bars show the standard deviation) BCD: borderline between comfort and discomfort.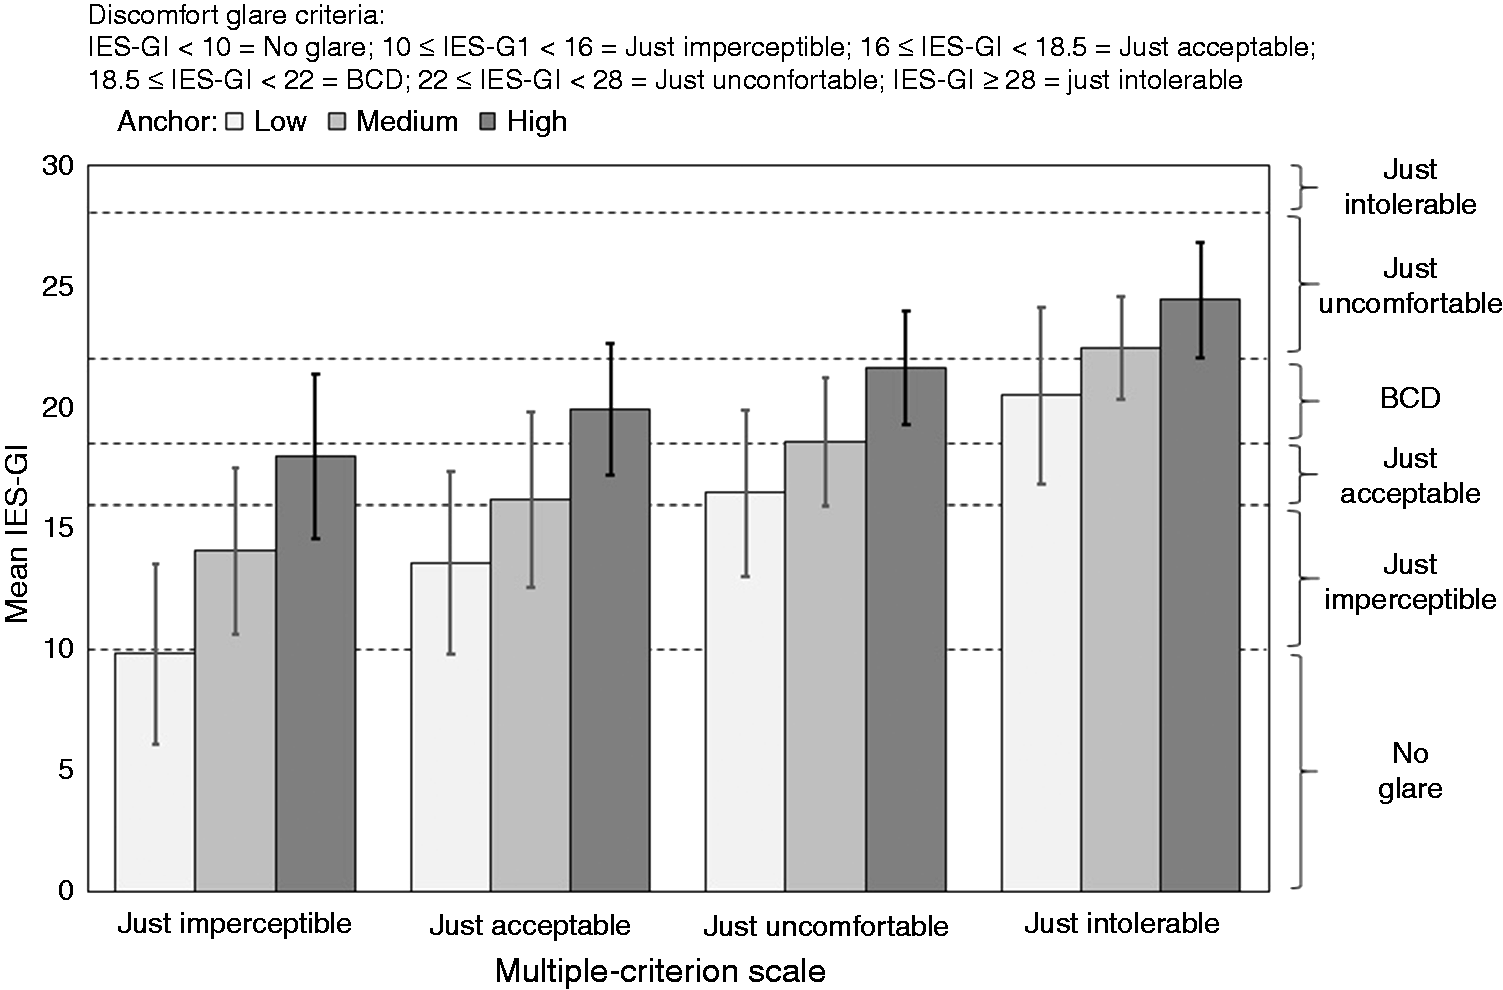
Figure 3 reveals a tendency for the IES-GI to be influenced by the luminance anchors. Specifically, mean values of IES-GI are consistently biased towards the initial luminance setting for each level of reported glare sensation, such that for each glare criterion the low anchor leads to a lower value of IES-GI and the high anchor leads to a higher value of IES-GI. This trend is apparent for all glare criteria. This confirms the experimental hypothesis that, when adjustment tasks are used, glare settings are made closer to the luminance of the anchor. For each glare criterion, the differences in mean IES-GI across the three initial luminance settings also appear to decrease when considering a higher level of visual discomfort. In this context, it should be remembered that participants were initially instructed to make judgements of glare sensation to the lowest glare criterion (Just Imperceptible), and then to the others in order of increasing visual discomfort.
Null hypothesis significance testing (NHST) was performed to determine if the differences between independent groups were significantly different. However, since NHST is dependent on both the size of the sample and on the magnitude of the effect under examination, 50 emphasis of the analysis was placed on the effect size (i.e. a standardised measure of the observed difference across the independent variable)51,52 and not only on the statistical significance (which, in cases of small or uneven samples, could confound the outcome).53–55
To analyse the data, a repeated-measures Analysis of Variance (RM-ANOVA) was initially run to compare the glare indices for each level of glare sensation across the three different anchors. This test was selected since graphical (Q–Q plot) and statistical (Shapiro–Wilk and Kolmogorov–Smirnov tests) inspection of the data revealed normal distributions around the mean (statistical results are not provided here). The Maulchly's test of sphericity was also used to test whether the variances of the differences between all paired comparisons of the within-subject variable were equal.56,57 The test revealed that the differences in variance across the independent groups, and for each glare criterion, were not statistically significantly different: Just Imperceptible: χ2(2) = 3.63, p = 0.16 n.s.; Just Acceptable: χ2(2) = 1.56, p = 0.46 n.s.; Just Uncomfortable: χ2(2) = 3.93, p = 0.14 n.s.; Just Intolerable: χ2(2) = 3.83, p = 0.15 n.s. Since the assumptions of normality and of sphericity were not violated, parametric tests were suitable for this analysis. 58
RM-ANOVA (sphericity assumed)
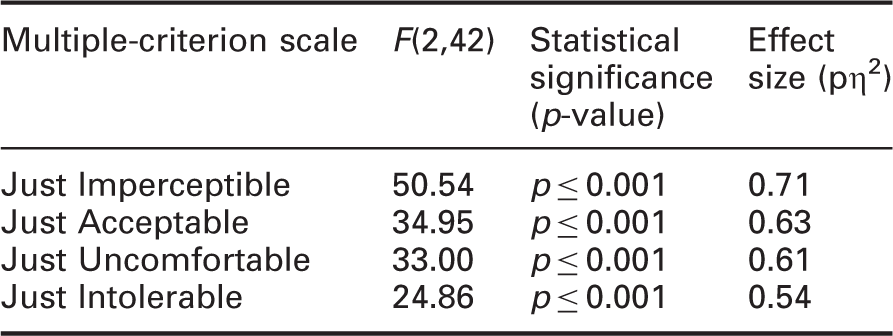
pη2 < 0.04 = negligible; 0.04 ≤ pη2 < 0.25 = small; 0.25 ≤ pη2 < 0.64 = moderate; pη2 ≥ 0.64 = large. RM-ANOVA: repeated-measures Analysis of Variance.
The results from the RM-ANOVA demonstrate that the differences in mean values of calculated IES-GI across the three anchors for all glare criteria are highly significant. The differences detected all have substantive effect sizes, ranging between large (pη2 = 0.71 for ‘Just Imperceptible’) and moderate (0.25 ≤pη2 < 0.64 for all other glare criteria). Interestingly, when participants reported high levels of glare, the magnitude of effect size decreases. This indicates that the differences in mean IES-GI across the three anchors become smaller, hence confirming what had previously been noted from graphical inspection of the data (Figure 3).
Post hoc testing was then performed, whereby all combinations between the initial luminance settings were compared against each other, and the statistical significance of the differences was calculated using one-tailed paired t-tests to determine where the variations detected in the RM-ANOVA were. Directionality of the hypothesis was informed by inspection of the central tendencies and graphical displays of the data.
60
Since there was convincing evidence of a direct relationship between initial anchors and calculated mean IES-GI for each glare criterion, a one-tailed hypothesis was applied.
61
In consideration of the experiment-wise error rate caused by the alpha level inflating across multiple pairwise comparisons – which was calculated as 1 – (0.95)n = 0.14 (thus, risking a 14% probability of making at least one Type I error), whereby n = 3, i.e. the number of tests carried out on the same data and with the same hypothesis
62
– Bonferroni corrections were applied.
58
In this analysis, the effect size was calculated by the Cohen's d coefficient, according to equation (5)
63
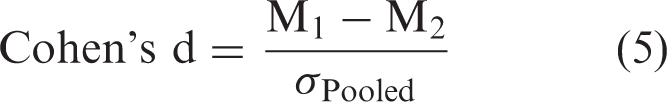
The interpretation of the outcome was derived from the benchmarks provided by Ferguson 59 for small, moderate, and large effect sizes (d ≥ 0.41, 1.15, and 2.70, respectively). Values below 0.41 were not considered to be substantive influences (i.e. they were not deemed as practically relevant effects).
Paired comparison t-tests and effect sizes
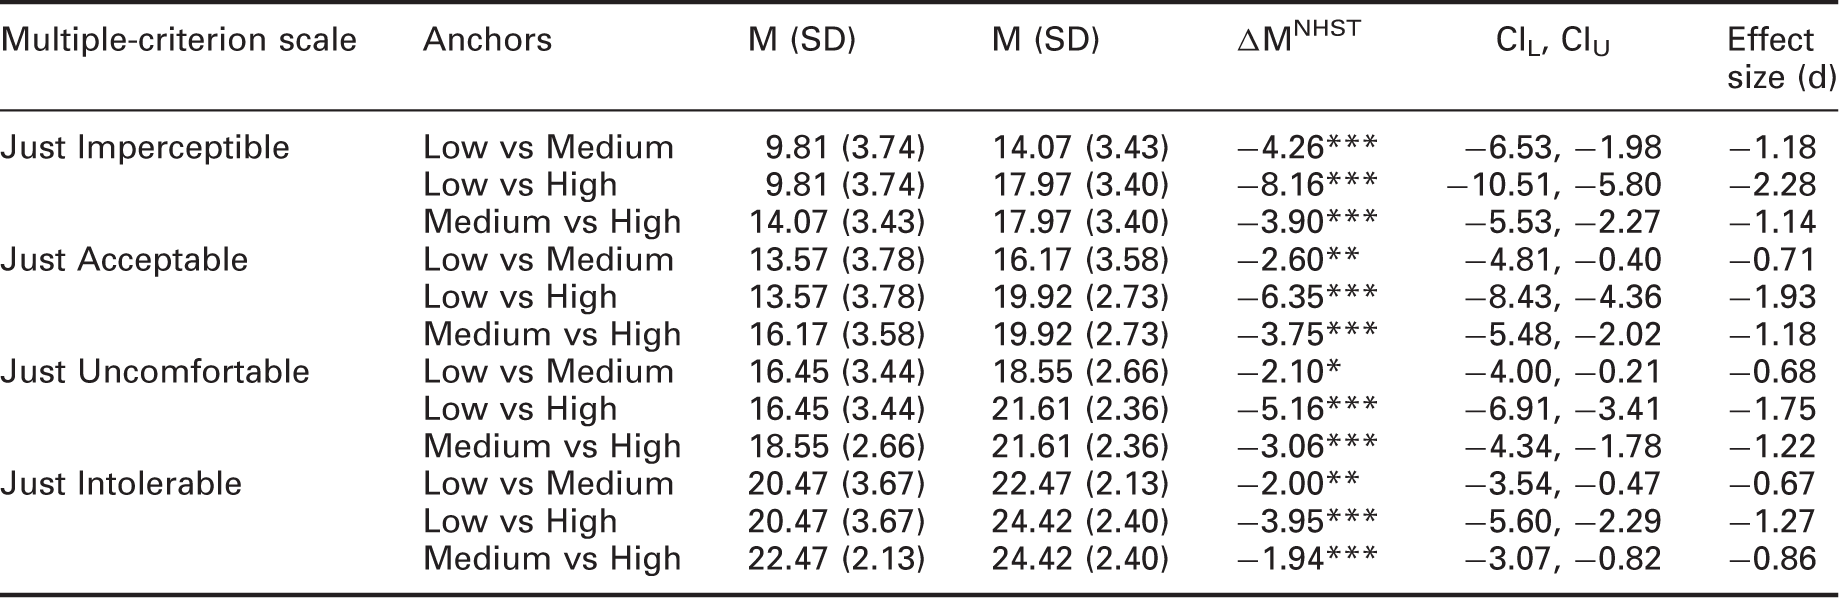
With Bonferroni corrections: *weakly significant; **significant; ***highly significant.
d < 0.41 = negligible; 0.41 ≤ d < 1.15 = small; 1.15 ≤ d < 2.70 = moderate; d ≥ 2.70 = large. NHST: null hypothesis significance testing; n.s.: not significant.
Inspection of the descriptive and inferential statistics shows that the sign of the mean differences and of the effect sizes are consistently negative across all comparisons, therefore signalling higher values of IES-GI when participants adjusted the luminance of the glare source starting from a higher initial anchor. The differences in means are highly significant in 9 cases, significant in 2 cases, and weakly significant in 1 out of 12 cases. All differences have a substantive effect size ranging from moderate (Cohen's d absolute value 1.15 ≤ d < 2.70 in seven cases) to small (0.41 ≤ d < 1.15 in five cases).
Statistical analysis of the data hence confirms that, when the initial anchor of the stimulus was increased, test subjects made adjustments to higher luminance settings for the same level of reported glare sensation. The effect of the anchor on the glare settings made by participants also appeared to be larger when considering a bigger difference in the luminance of the initial anchor. In fact, comparisons between the ‘low’ and ‘high’ anchors produced the largest differences in mean IES-GI and effect size for every glare criterion.
The findings also show that, when considering higher levels of visual discomfort, the differences in mean (ΔM) and the effect sizes reduce across comparisons. This suggests that the effect of the initial anchor on adjustments to the subjective glare criteria decreases when participants reported higher glare sensation. However, this might have occurred since participants were instructed to make adjustments to the four criteria on Hopkinson's multiple-criterion scale using only a sequence of increasing glare evaluation, i.e. starting from the lowest (Just Imperceptible) to the highest level of visual discomfort. Conversely, the procedure for this experiment did not consider how adjustments to the four predefined criteria could have influenced the outcome of the study if other orders had been used.
4. Discussion
Initial luminance setting and corresponding discomfort glare criteria
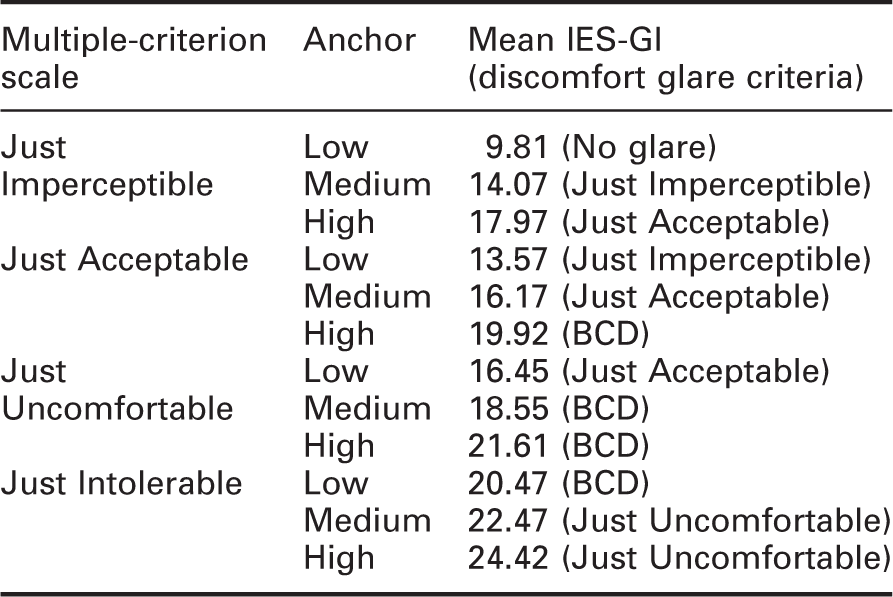
BCD: borderline between comfort and discomfort; IES-GI: Illuminating Engineering Society Glare Index.
Regardless of the anchor used in the current work, the mean IES-GI values presented in Table 6 are consistently lower than the standard discomfort glare criteria corresponding to Just Uncomfortable and Just Intolerable (i.e. IES-GI < 22 and 28, respectively) for the same reported level of glare sensation. Similar inconsistencies were reported by Akashi et al., 64 who found that UGR values overestimated glare ratings given under several fixed conditions. Although it is difficult to determine the exact reasons behind these inconsistencies, in part because different experimental procedures were used, it is likely that glare evaluations were influenced by the available range of the variable stimulus (i.e. range bias). In the current work, the maximum luminance was 32,000 cd/m2: if a lower or higher maximum luminance had been used, the results of previous work show that this would have resulted in different settings. 65
Comparison of BCD settings
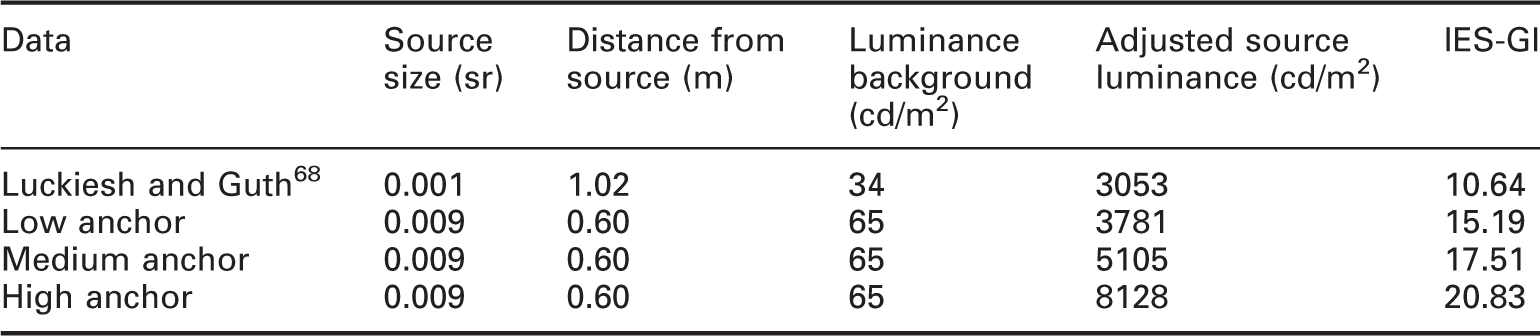
IES-GI: Illuminating Engineering Society Glare Index.
Hopkinson's suggestion that BCD lies between the second and third intervals is not however universally accepted; Adrian and Schreuder 69 assumed instead that it was the second interval on the four-point scale, and such differences in interpretation lead, from the same data, to different estimates of the BCD luminance.
5. Conclusions
The results from this study provide statistically significant and substantive evidence that, in a controlled laboratory experiment, adjustment tasks used to test the degrees of glare sensation from a bright light source are biased by the initial luminance setting (anchor). This confirms the hypothesis derived from a review of the literature on lighting preferences. This study found significant differences in the mean values of calculated glare index across different anchors for equal levels of glare sensation provided by participants. Such mean values were consistently biased towards the initial luminance setting presented to the participants before they were instructed to make adjustments to the glare source.
These results suggest the need to critically review the findings drawn from glare studies that have used adjustments from only a low initial luminance setting. For example, in the experiments by Petherbridge and Hopkinson, 9 observers were consistently instructed to adjust the glare source from a low initial luminance setting, this potentially bringing a bias to the conclusions due to an anchoring effect. Considering that the Petherbridge and Hopkinson study has been used as a fundamental reference for the development of most following glare models, this also raises some important questions related to the alleged precision of the glare indexes generally used to describe the levels of discomfort due to luminous sources.
In interpreting the results of our experiment, and planning future work, some methodological constraints should be acknowledged. Among these, participants often expressed a difficulty when making judgements of glare sensation for the lowest levels on the multiple-criterion scale, i.e. Just Imperceptible and Just Acceptable glare. In some cases, subjects also reported difficulty in making glare evaluations when directly observing the light source. Lastly, this experiment considered a forward-only order in the adjustments to the four glare criteria, and for future experiments we suggest the adoption of a randomised sequence. These caveats are being addressed in the ongoing experimental work.
Footnotes
Declaration of conflicting interests
The authors declared no potential conflicts of interest with respect to the research, authorship, and/or publication of this article.
Funding
The authors disclosed receipt of the following financial support for the research, authorship, and/or publication of this article: This work was supported by the Engineering and Physical Sciences Research Council [grant number EP/N50970X/1].