
Abstract
The impression of a space depends hugely on the light in the space, more specifically on the intensity, colour, beam shape and position of the light sources in that space. This relation though is very complex. The present study aims at understanding the relation between parameters of a lighting design and the resulting perceptions, focusing on the effect that overall brightness and perceived uniformity of the light in the space have on the perceived atmosphere of that space. Employing high-quality visualisations, we found that atmosphere perception can be accurately described by a second-order polynomial as a function of the two perceptual light attributes. In addition, we evaluated how well objective measures reported in literature predict brightness and perceived uniformity.
1. Introduction
A substantial number of studies has shown that light has a major influence on the impression of a space.1–7 Light has been found to affect the visual appearance,1,4,6 the affective appraisal3,6 and the appreciation of a space.1,2,5 Therefore, the lighting in a room should be carefully designed in order to support its function. For instance, a relaxing light setting may be desired in a wellness area, whereas an activating light setting would be more suitable for an office. The recent emergence of LED-based lighting systems enables us to create almost any desired light design. Yet, at the same time, predicting what atmosphere users will experience for a specific light design is not an easy job, especially since the number of control parameters to create a light design with LED lighting systems has increased tremendously. Therefore, with this growing potential and complexity of lighting systems comes a growing need to deepen our understanding of how light designs translate into the ultimate experience of a space. This includes insight into three important types of relationships: (1) the relation between the control parameters of a lighting system and the resulting spatial distribution of light in a space, (2) the relation between the distribution of light and how that light is perceived in terms of attributes such as brightness and uniformity, and (3) the relation between the perceived attributes and the impression of a space.
Previous research has gained insight into the above-mentioned relationships. For the first relationship, ray-tracing algorithms have been used to model the effect of various control parameters of a lighting system on the distribution of light in a space. 8 To unravel the second relationship, studies1,2 have uncovered which perceptual attributes of light in a room are most meaningful to an observer, while others2,9–12 have investigated how these attributes relate to objective characteristics of the light distribution in that room. Hawkes et al. 2 found that two dimensions are required to describe the perception of light in a space, namely brightness and interest, where the first is related to the perceived intensity of the light and the latter to the perceived uniformity. Research by Flynn et al. 1 similarly revealed the dimensions dim – bright and uniform – non-uniform as relevant for characterising the perceived light in a space, but also mentioned the importance of a third dimension, namely peripheral – overhead. Hawkes et al. 2 also tried to describe the perceptual attributes of light in terms of objective characteristics of the light. Brightness was found to correlate highly with the logarithm of the vertical illuminance on the eye of the observer. However, for interest, they were not able to find an objective measure with a high predictive value. Other studies have defined alternative measures for the brightness of the light in a space; it has been quantified as the mean luminance in a 40° horizontal band across the space, 11 as the spectrally-weighted irradiance at the eye, 10 or as the indirect illuminance at the eye. 12 Loe et al. 11 found that both the inter quartile range and the standard deviation of the luminance in a 40° horizontal band were good predictors of interest.
To understand the third relationship, the effect of the perceptual light attributes on the appreciation and subjective impression of a space has been studied. Hawkes et al. 2 showed that spaces rated high on brightness and interest, were often judged as more attractive. Flynn et al. 1 asked participants to assess a space with six different light conditions on 34 semantic scales and found that the dimensions evaluation, spaciousness and perceptual clarity represented persons’ appraisals of the room. In addition, their results revealed that a positively evaluated space typically contained non-uniform and peripheral light, irrespective of its brightness. Spaciousness depended on all dimensions, where a space equipped with uniform, bright and peripheral light appeared to be larger. Perceptual clarity of the space could be explained by the brightness dimension only.
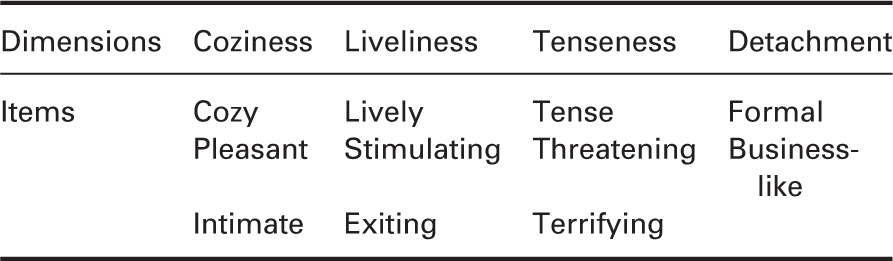
The studies described above mainly focused on visual aspects of the space, but the impression of a space can also be described in terms of its affective connotation. Vogels 13 developed a method to quantify the perceived atmosphere of a space, which is a measure of the affective appraisal of the space. Atmosphere still refers to a personal opinion, but it does not comprise a value judgment such as like or dislike. It can be described with four dimensions, namely coziness, liveliness, tenseness and detachment. Research has shown that the assessment of the atmosphere in an environment may depend on age 14 and culture. 15 Using homogeneous groups of participants, Vogels et al. 3 and Wang et al. 16 found systematic relationships between characteristics of the light in a room and its perceived atmosphere in laboratory spaces, while Custers et al. 17 showed the effect of light on atmosphere perception in the field. However, the number of conditions investigated in these studies was too low in order to extract generic design rules. Hence, more variations in light designs and light characteristics are needed so as to be able to create light designs that evoke the intended atmosphere.
To create a certain atmosphere with light, the first step is to understand the relation between atmosphere and the perceptual attributes of light, similar to what Hawkes et al. 2 and Flynn et al. 1 have done for the visual evaluation of a space. The next step is to understand how these perceptual attributes of light can be predicted from the physical light distribution. The main aim of the current study is to investigate how the brightness and perceived uniformity of the light in a room affects the atmosphere dimensions. Additionally, previously reported objective measures to quantify the brightness and perceived uniformity of the light are evaluated. As the conditions in the present study only consist of overhead light, the dimension peripheral – overhead is not considered.
In order to achieve these goals, we performed a study where participants evaluated the light and the atmosphere of a space under several light conditions. The light conditions varied in three ways: (1) by the number and spatial distribution of the luminaires in the ceiling, (2) by the type of luminaires and (3) by the luminance of the light design. These light conditions served as a way to study the effect of perceptual light attributes and not to study the effect of the design parameters per se, although we also report relevant relationships at this level. We used perceptually-accurate, 3D, computer-generated visualisations of a space, presented on a calibrated display, which previous research has demonstrated to be of a high accuracy compared to assessments in a real space. 18 This enabled us to accurately control the correlated colour temperature (CCT) and luminance of the light conditions, which is impossible for most existing luminaires. In addition, it allowed us to present more than 100 conditions in a fully randomised order, which would not be feasible in a physical room.
2. Methods
2.1. Design
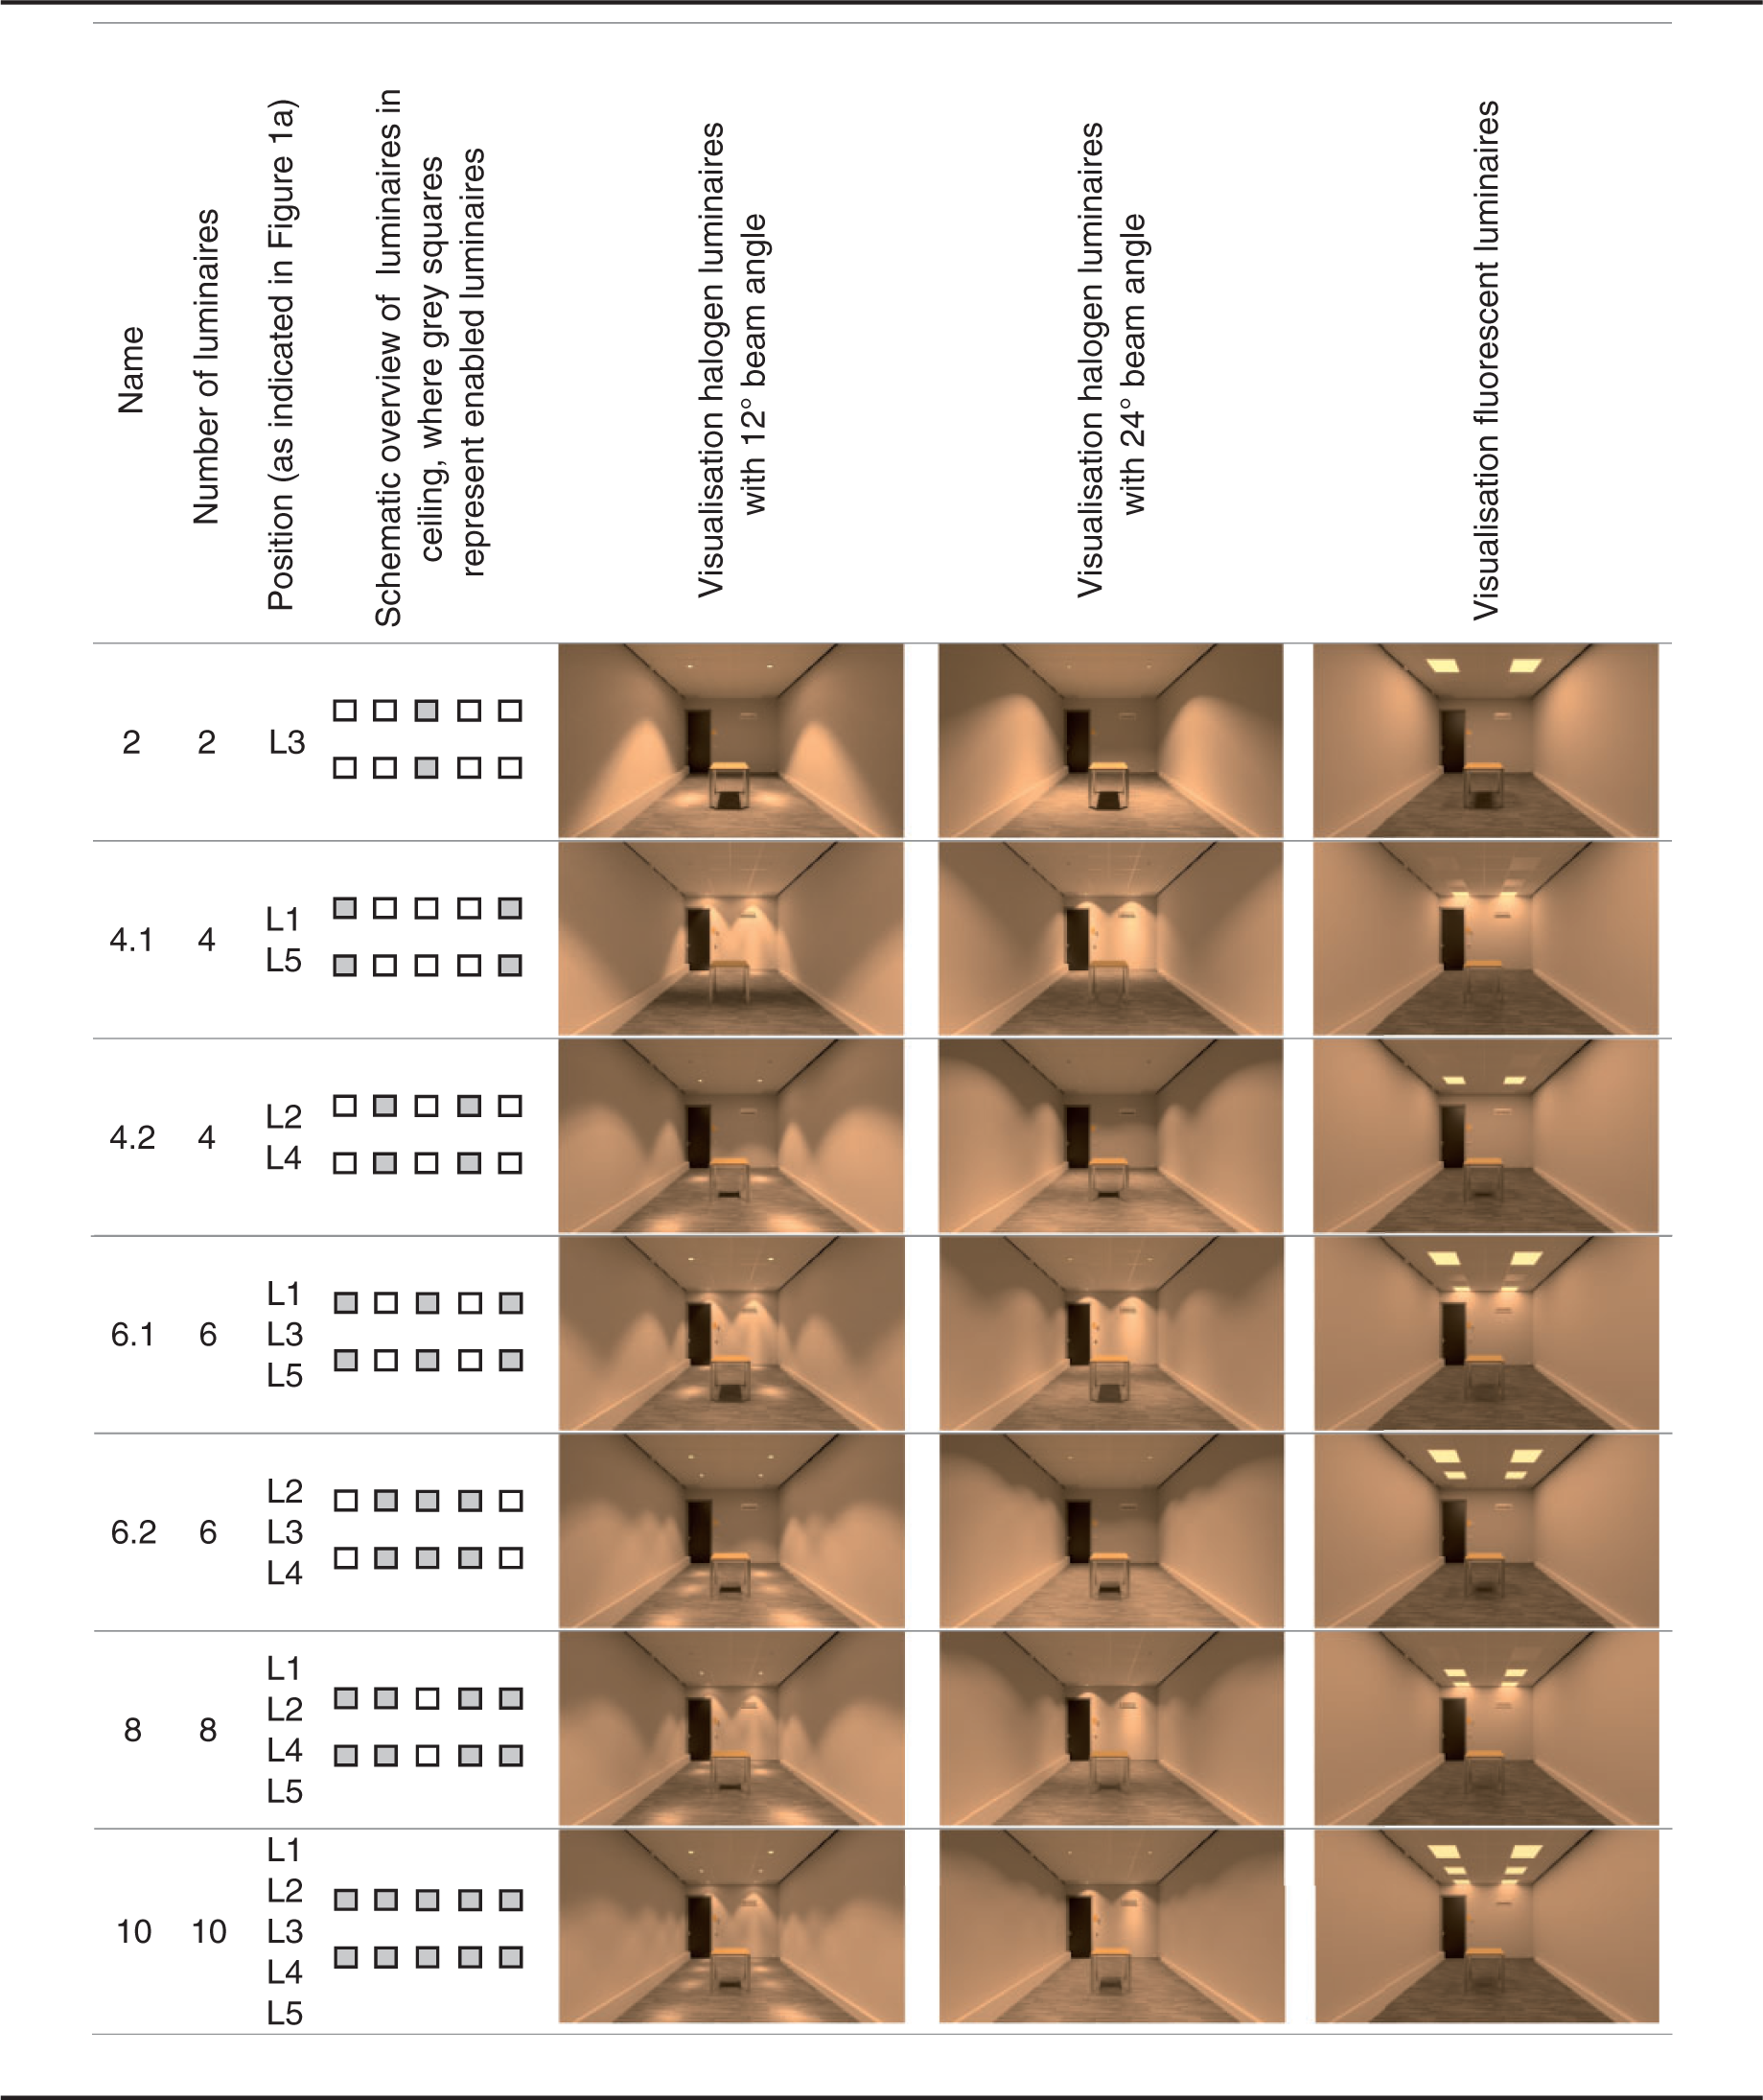
This study used a five (luminance) by seven (spatial distribution of luminaires) by three (type of luminaire) full-factorial within-subjects design. The independent variable luminance consisted of five light levels. The spatial distribution of luminaires comprised seven levels, varying in the number and position of the luminaires. Lastly, the type of luminaire consisted of three levels, namely halogen luminaires emitting directional light with a full width half maximum (FWHM) beam angle of either 24° or 12°, and fluorescent luminaires emitting diffuse light. All independent variables were assessed in a random order.
2.2. Participants
Twenty-four Dutch participants (fifteen females and nine males) took part in the study. Their average age was 22.5 years, ranging from 19 to 38 years, with a standard deviation (SD) of 4.0 years. None of the participants showed colour vision deficiencies on the Ishihara colour test. The study was approved by the ethical board of Eindhoven University of Technology, adhering to the Code of Ethics of the Dutch Institute for Psychologists.
2.3. Visualisations
We used computer-generated visualisations of a space with several light conditions. The visualisations were displayed on a calibrated 46-inch NEC P463 Full-HD display (1920 × 1280 pixels), with a minimum and maximum luminance of 0.1 cd/m2 and 277 cd/m2, respectively. The participants were seated at a distance of 1 m from the display. Dim ambient lighting (78 lux measured vertically on the eye of the participant) was used during instructions, but this was turned off during the main experiment.
2.4. The virtual space
The virtual space was based on a real laboratory space with a size of 6.3 (length) × 3.8 (width) × 3.0 (height) m3, using software package 3Ds Max. The space had white walls, white ceiling tiles, a grey carpet on the floor and a table located in the centre of the space. It was fitted with ten identical luminaires flush with the ceiling. A top view of the space is shown in Figure 1(a). The observer’s view of the space was identical to that of an observer sitting on a chair at the position indicated in the image. The resulting image was rendered with an Indigo renderer and tone mapped with the Reinhard ’02 Tone Mapping Operator before it was shown on the display. This method has been described and validated in previous research.
18
Figure 1(b) shows an example of an image simulating the observers’ view for one light condition.
(a) A plan of the virtual space, including the position of the virtual observer. The ceiling luminaires are numbered L1 to L5. (b) An example image simulating the observer’s view when all ten luminaires are on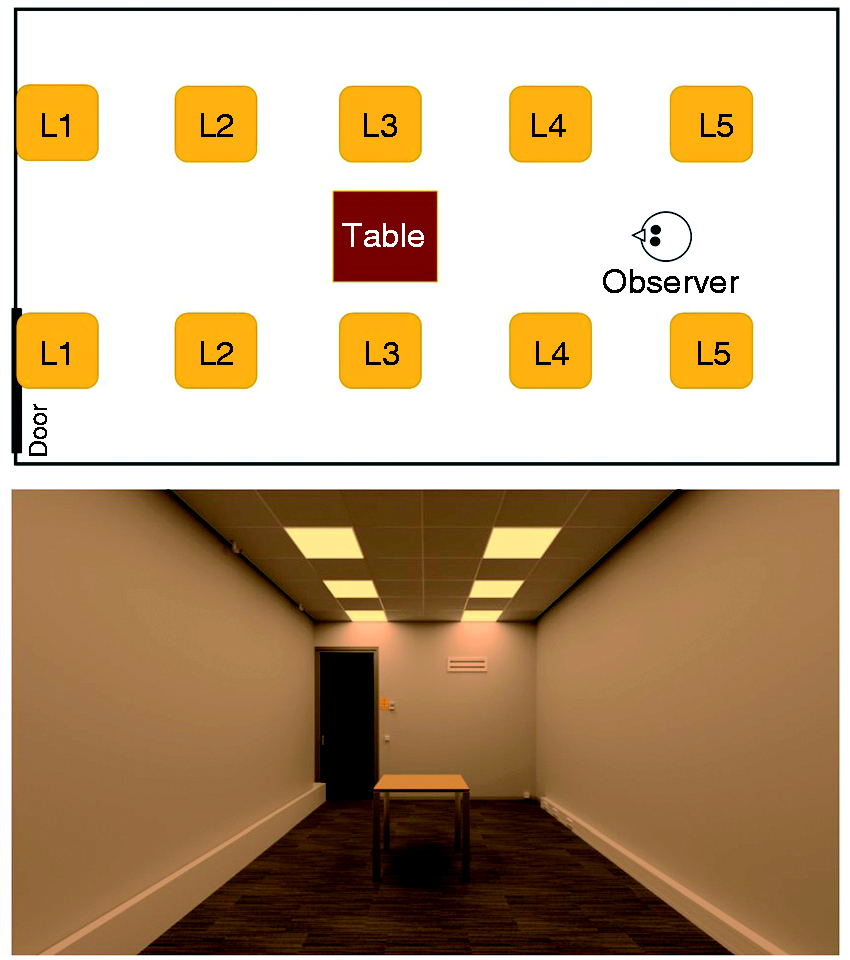
2.5. Light conditions
Overview of the seven levels of the spatial distribution of the luminaires in the ceiling. The first column presents the name of the level; the second column denotes the number of luminaires; the third and fourth columns indicate the positions of the luminaires. The three last columns show the resulting computer visualisations for the halogen luminaires with a beam angle of 12°, 24°, and for the fluorescent luminaires for a luminance level of 61 cd/m2
2.6. Dependent measures
Light perception was assessed by means of two perceptual attributes, namely brightness and perceived uniformity. Both were assessed on a 7-point semantic differential scale, which for the former was assessed on a doubled ended scale ranging from dim to bright and for the latter was assessed on a single-ended scale ranging from non-uniform to uniform.
Overview of perceived atmosphere dimensions and corresponding items
2.7. Procedure
The experiment was divided into two sessions. In the first session, the participant first gave informed consent and received instructions. Next, the dim ambient lighting in the laboratory space was turned off and a short practice run with three example light conditions was conducted. After that, the main part of the experiment started. All light conditions were shown in a random order, and in between, a neutral light condition (i.e. a visualisation with 10 fluorescent luminaires at an average luminance of 61 cd/m2) was shown for 4 seconds, to eliminate adaptation effects. Participants were instructed to look at the image on the screen for 4 seconds, in order to adapt to the presented light condition, and then to evaluate the atmosphere of the virtual space via a Graphical User Interface presented on a notebook. In total, the first session lasted approximately 50 minutes. The second session resembled the first, the only difference being that this time participants evaluated the brightness and perceived uniformity of the light in the virtual space. This session lasted approximately 40 minutes. The order of the sessions was chosen to not steer the participant in evaluating the atmosphere based on the light attributes. There was at least one day in between the sessions to avoid fatigue. At the end of the second session, participants were debriefed and thanked for their time.
3. Results
As mentioned before, our main objective was to find the relation between perceptual attributes of the light in a room and the perceived atmosphere of that room. In order to create rooms with differently perceived light attributes, we selected three independent variables that were varied in a controlled way. In the next subsections, we first determine the effect of the independent variables – and so of the different light conditions – on the perceptual light attributes. In the next step, we determine the effect of the different light conditions on the perceived atmosphere. Then, we model the relationship between the perceptual attributes of light and the perceived atmosphere, addressing the main goal of this study. And, finally, we evaluate various objective measures of the light distribution that are reported in literature as being accurate in describing the perceptual attributes of light in a room.
3.1. Effects of light condition on perceptual attributes of light
Figure 2 presents the ratings averaged across participants for the perceptual attributes of light (brightness and perceived uniformity) as a function of the independent variables (type of luminaire, luminance and spatial distribution of the luminaires). From this figure, we may conclude that brightness is mostly affected by variations in luminance, whereas perceived uniformity is more affected by the type of luminaire and spatial distribution of the luminaires. A repeated measures analysis of variance (ANOVA) was conducted to test for the effect of type of luminaire, luminance and spatial distribution of the luminaires on the dependent measures brightness and perceived uniformity.
Mean ratings and 95% confidence intervals split for luminance, type of luminaire and spatial distribution of luminaires on brightness and perceived uniformity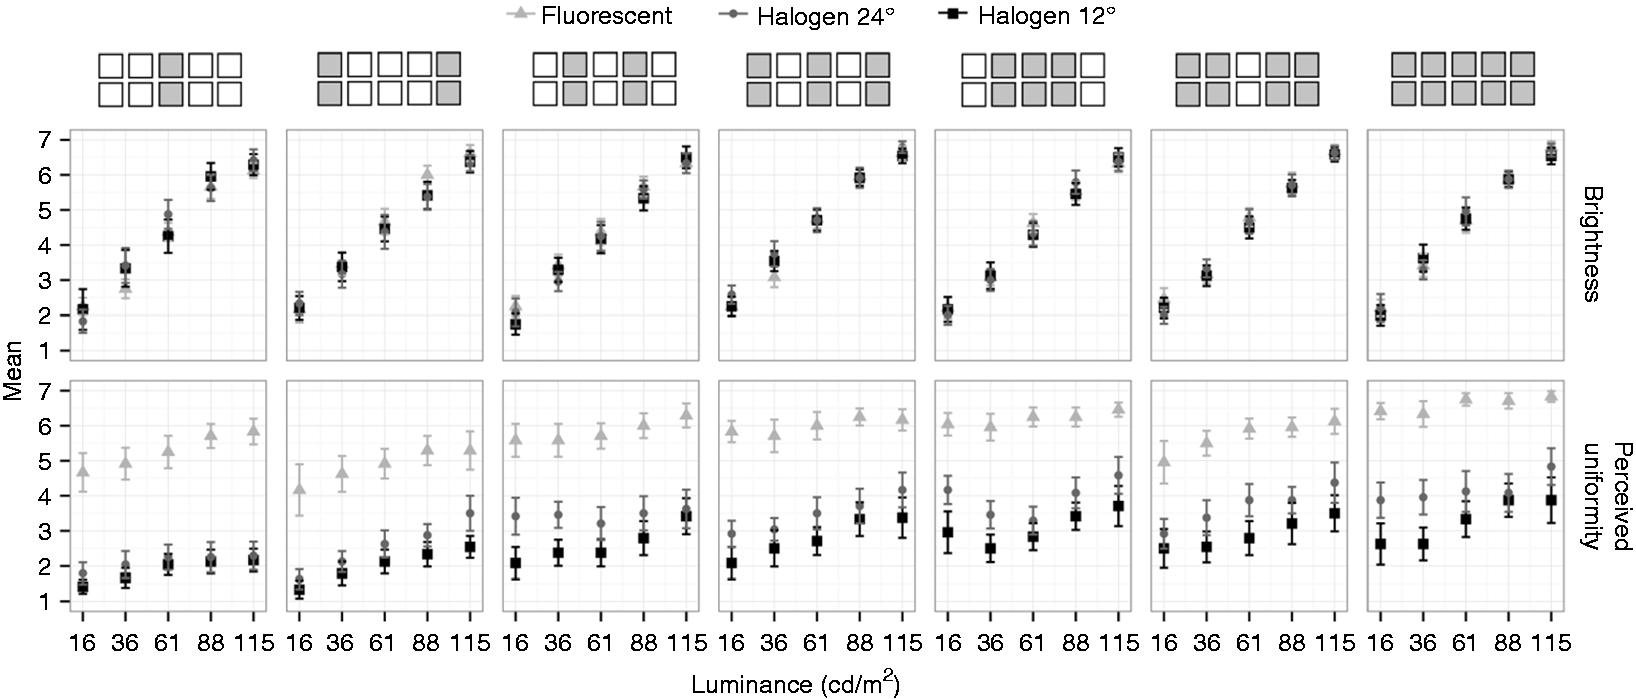
Brightness was significantly affected by luminance (F(4, 92) = 706, p < 0.001,
Perceived uniformity was significantly affected by all three independent variables. Type of luminaire was the most important predictor (F(2, 46) = 191, p < 0.001,
3.2. Effects of light condition on perceived atmosphere
Figure 3 presents the ratings averaged across participants for the four atmosphere dimensions (coziness, liveliness, tenseness and detachment) as a function of the independent variables (type of luminaire, luminance and spatial distribution of the luminaires). As can be seen, each atmosphere dimension depends on at least one of the independent variables. Coziness is mainly affected by the spatial distribution of the luminaires, liveliness and tenseness are mostly influenced by the luminance, and the luminance and type of the luminaires have a large effect on detachment. No statistical analysis is presented for these effects, as we are more interested in the relations between, on the one hand, brightness and perceived uniformity and, on the other hand, each of the four atmosphere dimensions.
Mean ratings and 95% confidence intervals split for luminance, type of luminaire and spatial distribution on coziness, liveliness, tenseness and detachment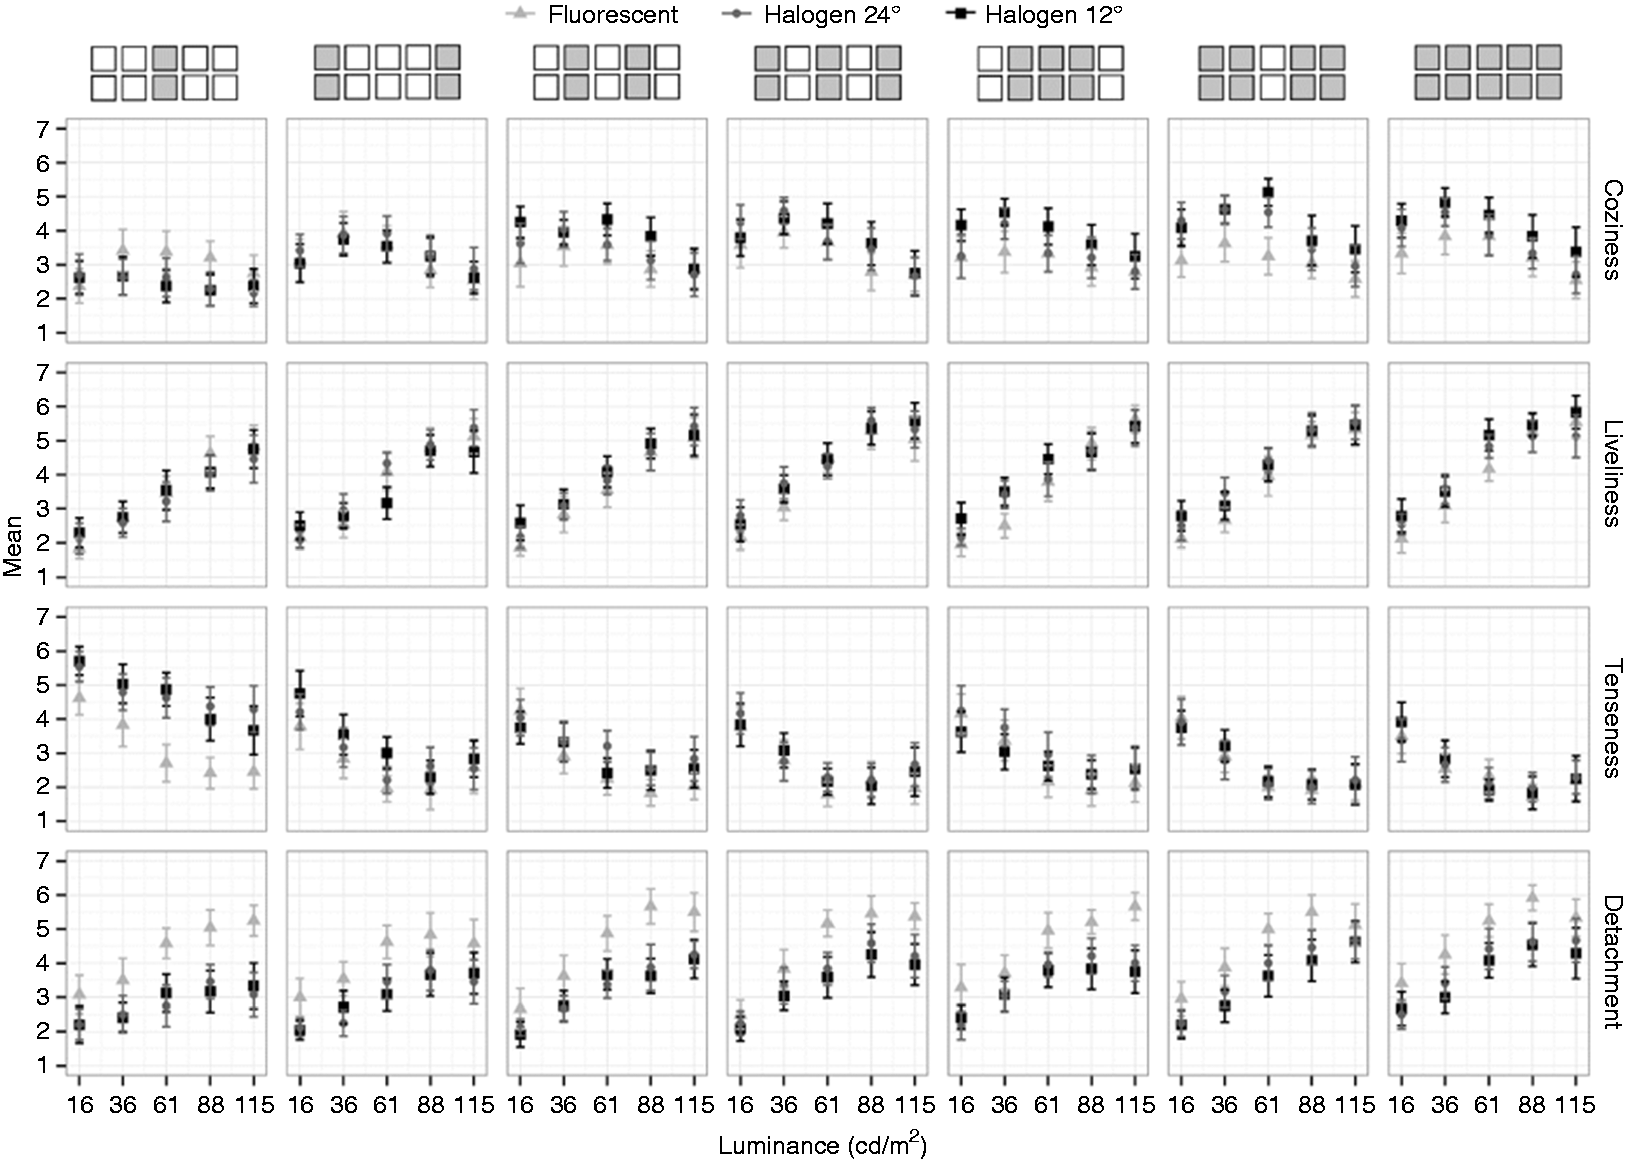
3.3. Relation between perceptual attributes of light and perceived atmosphere
For each atmosphere dimension, a second-order polynomial was fitted, using the least squares method, as a function of the brightness and perceived uniformity rating averaged over the participants, as shown in the following equation
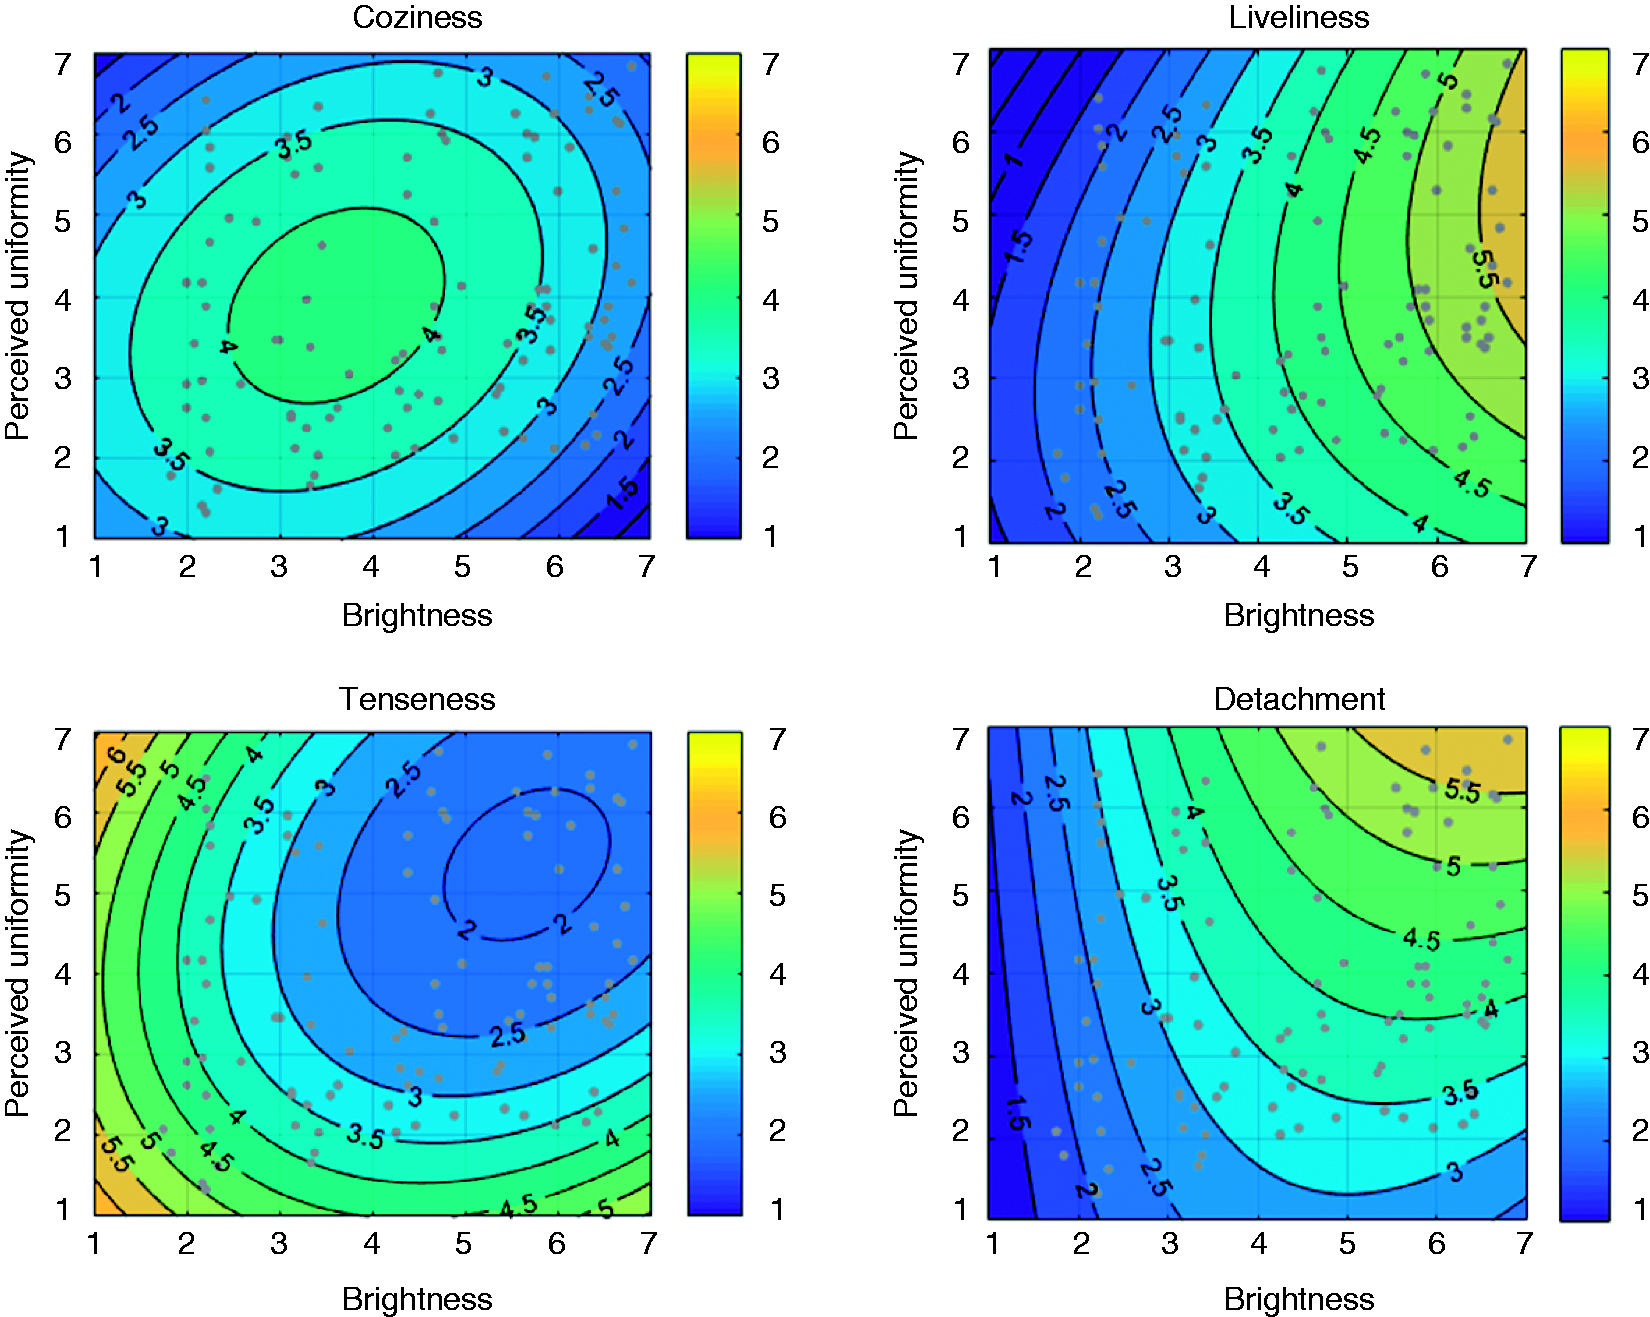
Plots showing iso-contours for the atmosphere dimensions coziness, liveliness, tenseness and detachment as a function of brightness and perceived uniformity. The numbers and colours differentiate the atmosphere dimension ratings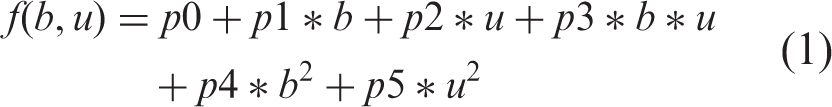
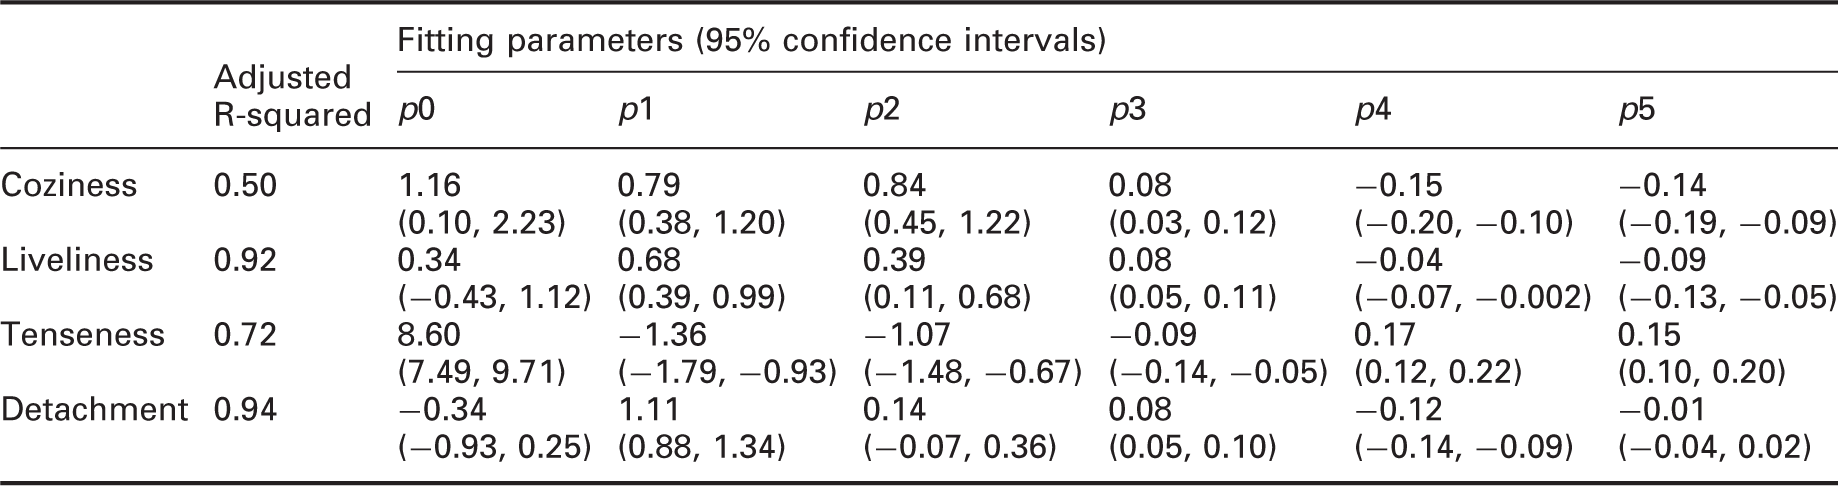
Fit statistics and fitting parameters (and 95% confidence intervals) for the second-order polynomial relations of coziness, liveliness, tenseness and detachment with the perceptual light attributes brightness and perceived uniformity
3.4. Physical measures for the perceptual attributes of light
The results above show that the appearance of brightness and uniformity depend on the intensity and spatial distribution of the light in the space. Several researchers have proposed objective measures to predict these perceptual attributes of light from physical properties of the light. Here, we test the performance of the objective measures defined by Loe et al.
11
for brightness and uniformity. Only these measures are tested since it was not feasible to measure the illuminance in the space as we made use of visualisations, and potential illuminance measurements of the display would be influenced by reflections via the surrounding laboratory space. First, the relation between brightness and the mean luminance of the 40° horizontal band is evaluated. The height of this horizontal band approximately overlaps with the front wall, and excludes the ceiling and floor. Figure 5 shows this relation for each of the five (average) luminance levels, while varying the type of luminaire and their spatial distribution. Linear functions (y = a*x + b, with y the mean luminance (in cd/m2) and x the brightness rating) were fitted with the least squares method through the data points with the same luminance level. In addition, a linear function was fitted through the data points of all light conditions. Table 4 lists the fitting parameters, the 95% confidence intervals, and the adjusted R-squared values for all these functions.
The relationship between the mean luminance in the 40° horizontal band (depicted on the y-axis) and the brightness (depicted on the x-axis). The dashed black line shows the fitted linear relation for all light conditions. The various markers differentiate the different average luminance levels (of the total image). For each level, a linear relation was fitted as well, plotted with a solid line in the same colour as the marker Fitting parameters and adjusted R-squared value for the linear functions y = a*x + b (where y is the mean luminance (in cd/m2) and x is the brightness rating) for all light conditions, and per individual luminance level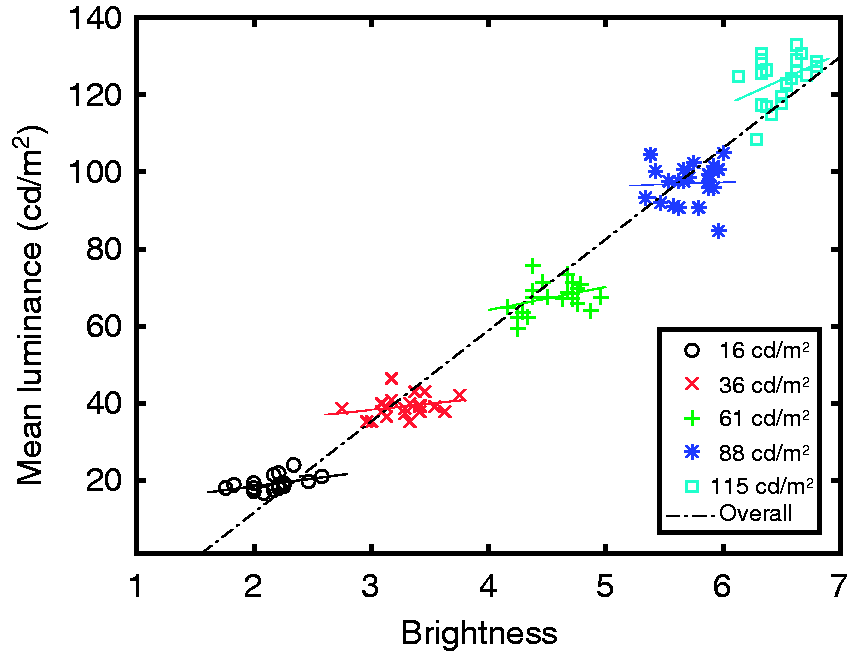
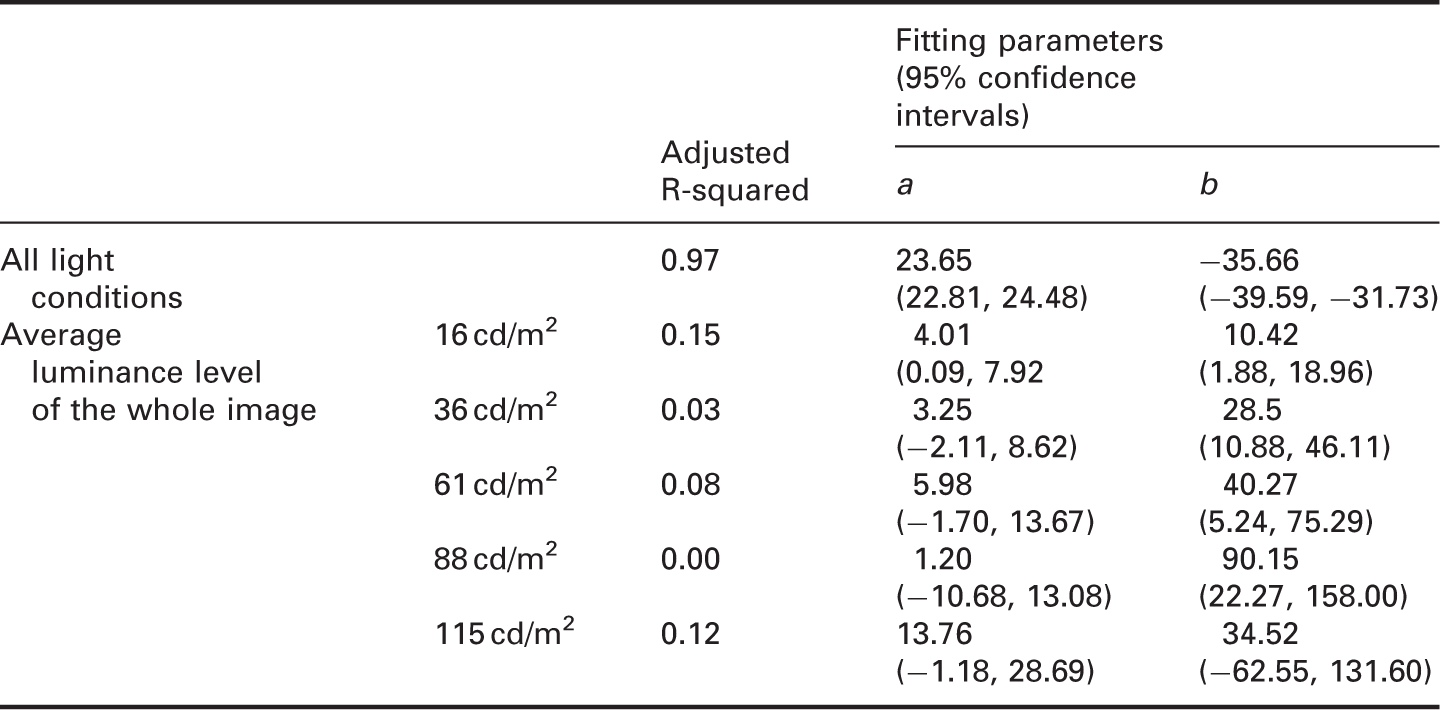
The goodness of fit when using all light conditions was very high, which indicates that the mean luminance in the 40° horizontal band correlates highly with the brightness ratings. For the individual luminance levels, the goodness of fit decreases considerably, resulting in adjusted R-squared values of maximally 0.15. This means that the mean luminance in the 40° horizontal band does not properly represent variations in brightness originating from variations in the type of luminaires and their spatial distribution.
Fitting parameters and adjusted R-squared value for the linear functions y = a*x + b (where y is the inter quartile range (IQR) of the luminance (in cd/m2) and x is the perceived uniformity rating) for all light conditions, and per type of luminaire
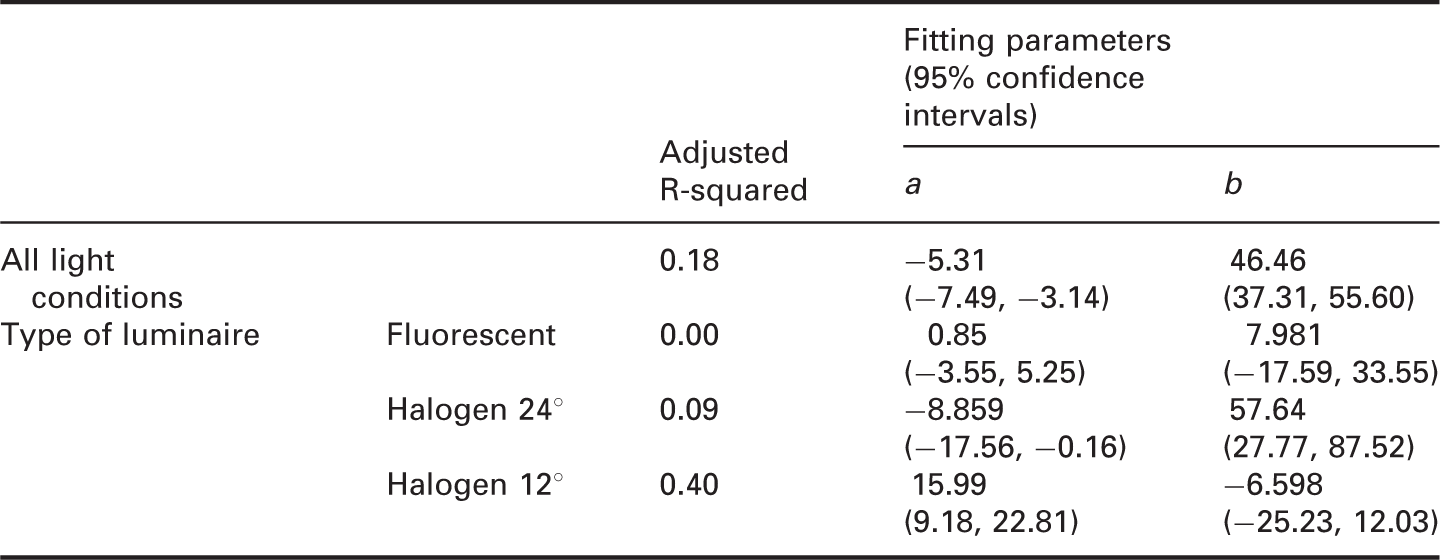
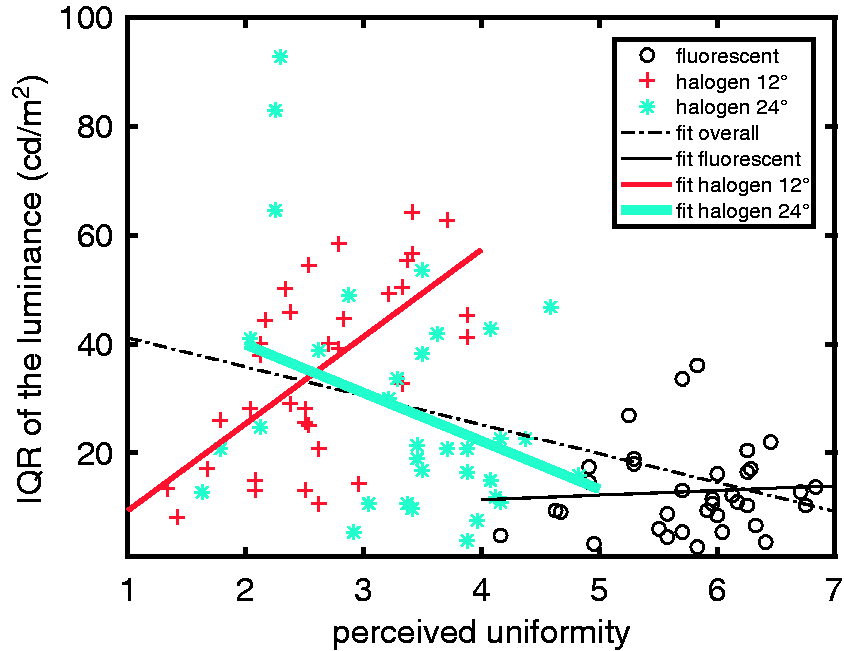
The relationship between the inter quartile range (IQR) of the luminance in the 40° horizontal band (depicted on the y-axis) and the perceived uniformity (depicted on the x-axis). The different markers differentiate between the types of luminaire and for each a linear relation is fitted (in the same range and colour as the marker). The dashed black line shows the fitted linear relation over all light conditions
4. Discussion
This study investigated light and atmosphere perception of a space while varying the type of luminaires in the space, their spatial distribution and the overall luminance of the light design. These manipulations resulted in different light conditions with different perceptual light attributes, which, in turn, resulted in different perceived atmospheres. The main purpose of the present study was to examine the predictive power of the light attributes – brightness and perceived uniformity – on perceived atmosphere, although we also explored relationships between the light conditions on the one hand and the light attributes and atmosphere perception on the other directly.
For all atmosphere dimensions, both the attributes brightness and perceived uniformity emerged as important predictors, although the nature of the relationship differed. Second-order polynomials of the light attributes resulted in substantial to even high predictive power on all four dimensions. A space lit with light of a medium brightness and perceived uniformity was perceived as coziest, and decreasing or increasing either of these attributes resulted in less coziness. Further, increasing brightness resulted in a livelier perceived space, and medium levels of perceived uniformity led to the highest liveliness ratings. A combination of bright and perceptually uniform light resulted in the least tenseness, and decreasing either of these attributes affected tenseness positively. At the same time, bright and perceptually uniform light led to a highly detached space, while decreasing the brightness and perceived uniformity resulted in lower levels of detachment. The least detached spaces were lit with dim and non-uniform perceived light.
Although earlier studies have also explored relationships between perceptual light attributes and atmosphere perception, the current study employs a larger number of light conditions, which may be beneficial for creating light designs. For instance, as illustrated by the plotted polynomials in Figure 4, different brightness and perceived uniformity levels may result in similar assessments on individual atmosphere dimensions. As an example, the same level of coziness can be produced with e.g. bright light of a low perceived uniformity, but also with dim, perceptually uniform light. For liveliness, the perceived uniformity may vary to a large extent without affecting the perceived liveliness of the space. This kind of insight can be very helpful in creating the right light condition for a desired atmosphere given the limitations of the lighting system.
To create a dedicated atmosphere, one not only needs to specify desired levels of perceptual light attributes, but one also needs to quantify the physical distribution of the light resulting in these perceptions. However, defining objective measures that accurately quantify the perceived light in terms of the luminance distribution in a space has been proven to be very difficult. In our study, the mean luminance in the 40° horizontal band across the space highly correlated with brightness. Unfortunately, the correlation drastically deteriorated when accounting for differences in type and spatial distribution of the luminaires. None of the measures proposed by Loe et al. 11 resulted in an adequate prediction of the perceived uniformity. This clearly demonstrates that more research is necessary to define an objective measure of the physical luminance distribution for perceived uniformity. Visual inspection of the visualisations depicted in Table 1 suggests that the perceived uniformity of the light can be revealed by looking at the floor of the room. Hence, the luminance of the floor, which falls outside the 40° horizontal band, might be of importance. However, extending the 40° horizontal band to include the floor of the space, did not improve the accuracy of predicting perceived uniformity. Additionally, the results showed that positioning luminaires adjacent to the outer walls of the space decreased the perceived uniformity. Perhaps, the way the luminance increases or decreases over the space (inside or outside the 40° horizontal band) affects the perceived uniformity more than the IQR of all luminance values. More research is therefore needed to better understand the how the luminance distribution in the 40° horizontal band, ceiling or floor affects perceived uniformity.
For completeness, we also analysed the direct effects of the individual design parameters of our lighting configuration on perceptual attributes of light and on atmosphere perception. These results, visualised in Figures 2 and 3, give insight into the influence of design decisions on perception, but the results may be different for spaces in different contexts, of different shapes and sizes, or for different types and arrangements of luminaires. Our assumption is that the insights on the relationship between perceptual attributes and atmosphere perception will prove more consistent and generalisable across situations. In order to confirm this assumption, more research is required to understand effects of light on atmosphere perception beyond the range of our manipulations, for spaces of different shapes and sizes. Additionally, future research may address the effects of more furniture in the space, to increase our understanding how furniture influences the effect of the light on atmosphere.
5. Conclusions
The present study aimed to investigate how the light attributes brightness and perceived uniformity affect the perceived atmosphere of a space. We have found that the dimensions of atmosphere can be accurately described by a second-order polynomial as a function of the two perceptual light attributes. Although these relations are complex, Figure 4 depicts them in a very apparent way. In order to create a dedicated atmosphere, the perceptual light attributes also have to be specified in terms of the physical spatial distribution of light in a space. However, the objective measures for brightness and perceived uniformity reported in literature did not result in adequate predictions of these perceptual attributes for our light conditions. Therefore, future research should concentrate on improving these measures. Nevertheless, this study is an important first step towards understanding how the numerous control parameters of LED-based light systems may influence the perceived atmosphere of an environment.
Footnotes
Declaration of conflicting interests
The authors declared no potential conflicts of interest with respect to the research, authorship, and/or publication of this article.
Funding
The authors disclosed receipt of the following financial support for the research, authorship, and/or publication of this article: Philips Lighting partly funded this project. Philips Lighting did not have any additional role in the study design, data collection and analysis, decision to publish, or preparation of the manuscript
Acknowledgements
The authors thank Dragan Sekulovski for his help with the data analyses. This research was performed within the framework of the strategic joint research program on Intelligent Lighting between TU/e and Philips Lighting.