
Abstract
Obstacle detection is an important visual task for pedestrians. An experiment was carried out to measure the ability to detect peripheral obstacles under variations of illuminance and scotopic/photopic luminance ratio and with older and younger test participants. The LED array used in this work enabled scotopic/photopic ratio to be varied whilst chromaticity was held constant. The tests employed a full-scale model with dynamic fixation and walking to better simulate pedestrian experience than in past work. Detection performance increased with illuminance, reaching a plateau at 2.0 lux. A higher scotopic/photopic ratio improved obstacle detection but only at the lowest illuminance used in this study (0.2 lux). Older participants showed poorer obstacle detection performance than younger participants but again only at the lowest illuminance.
1. Introduction
Tripping is a significant problem. For example, a US study found that approximately 40% of people aged over 65 years fall at least once a year, and around 2.5% of these falls lead to hospitalisation. 1 Demographic trends suggest rapid growth in the problem over coming years. Falls are also associated with significant impact on the individuals themselves, including fear of falling and social withdrawal. 2 At least half of falls occur outdoors (e.g. on pavements, kerbs, streets), and over 70% of these have been linked to environmental factors (e.g. tripping or slipping on uneven or slippery surfaces). 3 One aim of road lighting for pedestrians is to increase the probability of detecting obstacles and trip hazards. 4
Although previous research using eye tracking has shown that pedestrians look at the path for a significant proportion of time, 5 a large proportion of these fixations may be the commonly observed behaviour of travel gaze whereby gaze is held at a constant angle in front of the individual and carried forwards as they move. 6 Fotios et al.7,8 used a reaction time dual-task alongside eye tracking to identify potentially critical observations, when attention may have been focused on the location where the eyes were looking, and concluded that obstacle detection is an important task for pedestrians. Avoidance of tripping appears to be considered particularly important by older people. 9 While obstacle detection should be an important element in determining the lighting characteristics of pedestrian lighting, existing lighting guidelines were not informed by appropriate empirical evidence. 10
Visual space is mapped using peripheral vision. 11 Peripheral vision of an obstacle in the travel path is sufficient for successful obstacle avoidance during locomotion; eye tracking shows that visual fixation is generally not redirected to either the obstacle or the landing area.12,13 Obstacles may be avoided by gait adaptation or by stepping over them. Obstacles which require gait adaptation are generally static and do not alter their shape and size and therefore on-line monitoring of such obstacles is not necessary. To step over an obstacle we need to know its height, width and location: its shape or colour is not relevant. 14
The detection capability of the eye is mainly determined by contrast sensitivity. 15 For targets observed in peripheral vision, under mesopic levels of lighting typical of road lighting, luminance and spectral power distribution (SPD) affect threshold luminance contrast. 16 The scotopic/photopic luminance ratio (S/P ratio) is generally used to characterise the effect of SPD on visual performance at mesopic levels, with lighting of higher S/P ratio enhancing contrast detection.
Past studies investigating peripheral detection under lighting of different luminance and SPD.
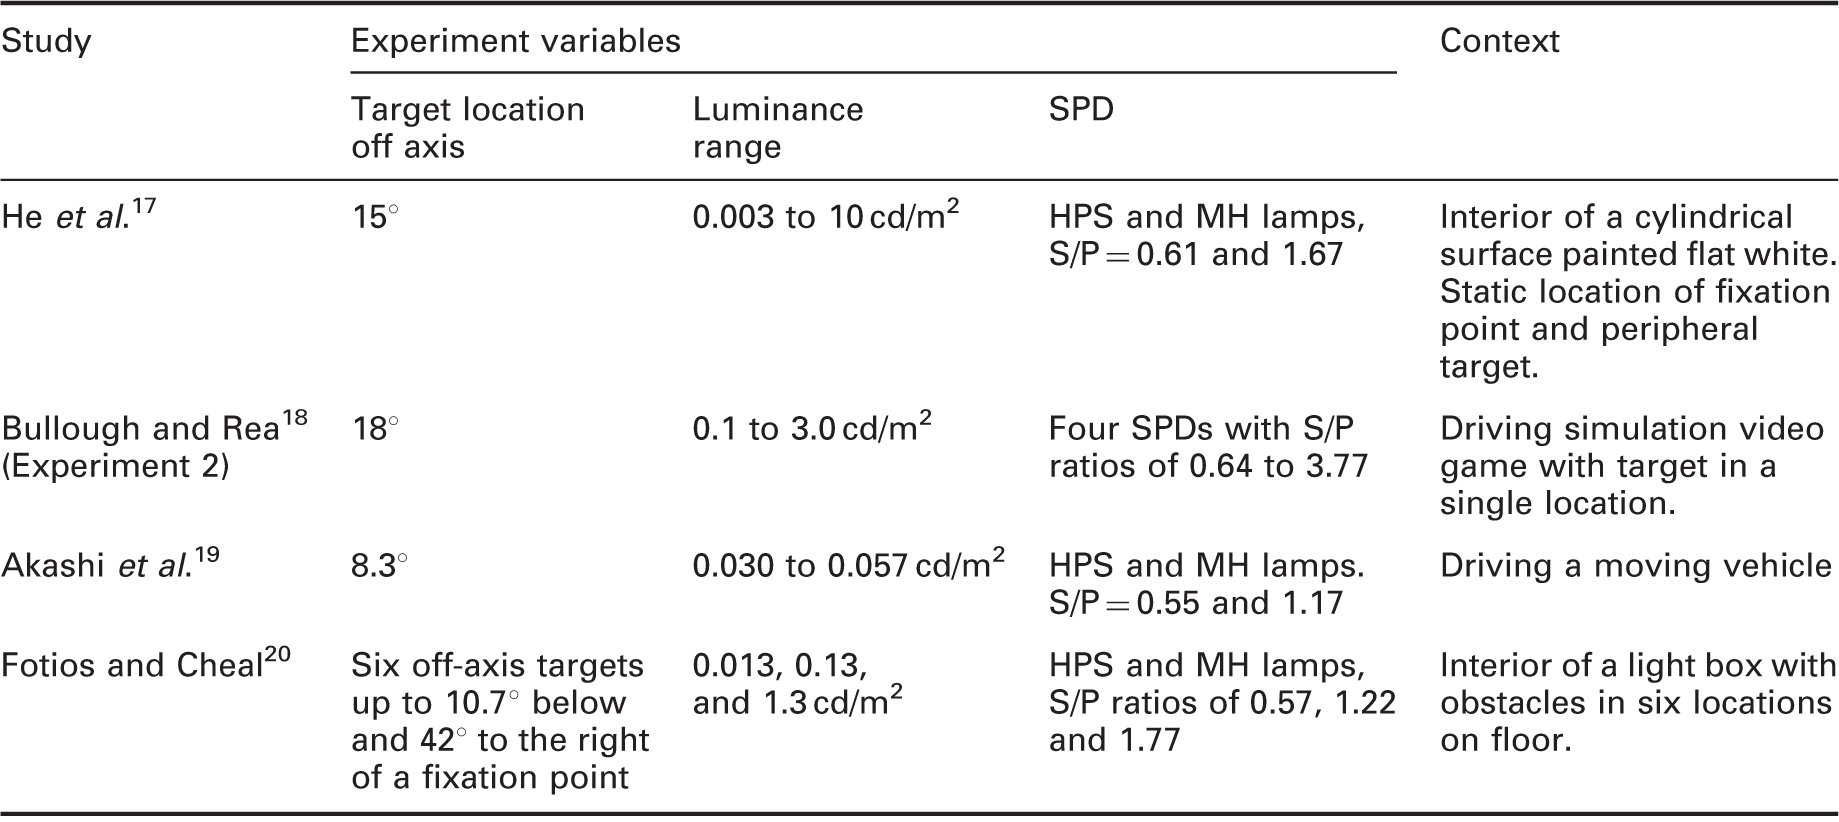
SPD, spectral power distribution.
Lighting of higher S/P ratio also increases detection probability and decreases reaction time but the interaction with luminance is not certain, the SPD effect being significant only at luminances of 1.0 cd/m2 or less in He et al. 17 but still significant at 3.0 cd/m2 in Bullough and Rea. 18 This may be because Bullough and Rea used a greater range of S/P ratios (0.64–3.77) than did He et al. (0.61–1.67). The CIE 21 defines the mesopic luminance region from about 0.005 cd/m2 to 5 cd/m2, and in this region the recommended system for visual performance based mesopic photometry defines the effect of SPD to be greatest at the low luminances (i.e. as the scotopic region is approached) diminishing to no effect at high luminance (as the photopic region is approached).
Fotios and Cheal 20 examined peripheral detection in a context more related to obstacle detection for pedestrians in that the obstacles were located on a horizontal surface below the fixation point, representing potential hazards to walking. Participants looked through an aperture at a fixation mark on the far wall of a small chamber. Three different illuminances were used, 0.2 lux, 2.0 lux and 20 lux, provided by an overhead light box to ensure diffuse lighting, luminances of approximately 0.013 cd/m2, 0.13 cd/m2 and 1.3 cd/m2, respectively, for the surface of reflectance 0.2. Variations in SPD were gained using the different lamp types (one HPS and two types of MH lamp). Cylinders in six off-axis locations, normally flush with the surrounding floor surface, could be raised one at a time to simulate an obstacle. A series of eight incremental heights were used, 0.40 mm to 7.94 mm. Upon opening the aperture for 300 ms to permit a view into the chamber, participants reported which, if any, of the cylinders had been raised. Performance under the different conditions was analysed using the obstacle height at which a 50% detection rate was achieved. It was found that detection performance improved as illuminance increased. At the lower illuminance (0.2 lux), it was found that a higher S/P ratio also improved detection, but this effect of SPD was not found to be significant at the higher illuminances.
This paper reports a new experiment on obstacle detection carried out to address potential limitations of previous work and thus improve the degree of representation for pedestrians in natural settings. First, a larger scale apparatus was used than the scale model previously used by Fotios and Cheal.20,22 Second, a dynamic fixation task was developed. Rather than a static location as used in the past work, this fixation point moved, simulating the visual gaze behaviour of pedestrians.7,8 The fixation marker would change, at random intervals, from a crosshair to a numeric digit, which test participants were instructed to read aloud. The aim of the dynamic fixation mark was to promote visual attention towards the fixation point and reduce instances of looking towards an anticipated target rather than the fixation point. Third, test participants walked on a treadmill during test sessions. Walking is a complex task 23 requiring the planning of foot placement, assessment of floor surface, planning of route, maintaining posture and stability, and therefore uses attention and executive cognitive functioning in the brain. 24 It has been shown that walking speed and accuracy declines with the addition of a secondary cognitive task. 25 The maintenance of balance required for walking on the treadmill together with the dynamic fixation were intended to increase cognitive load towards that of a pedestrian.
In addition, an attempt was made to better isolate one specific aspect of light spectrum, the S/P ratio, to investigate its effects on obstacle detection. This was done by using a tuneable LED array which enabled the S/P ratio to be varied whilst chromaticity was held constant.
2. Method
A test area was constructed within a laboratory, having walls on three sides and open at one side. This area had a false floor from which a cylindrical obstacle could be raised to a range of different heights. Whilst walking on a treadmill at the open end of the test area, participants indicated if they saw the obstacle by pressing a hand-held button. To encourage the use of peripheral vision for detecting the obstacle, a fixation target was projected onto the far wall, opposite the participant. The fixation target moved around the far wall and, periodically but briefly, changed to a number, which had to be read aloud by the participant. The test area was lit from above by two arrays of LEDs, and the detection task was carried out under 15 combinations of five illuminances and three S/P ratios.
2.1. Apparatus
The test environment was of dimensions 2.4 m wide, 2.4 m high and 3.8 m long, with walls covered in black cotton cloth on three of the sides and open at the fourth side (Figure 1). A walking treadmill was placed at this open end, facing the far wall. The treadmill had a surface height of 0.19 m and a maximum speed of 16.1 km/h. A wooden bar was fixed at waist height above the treadmill to act as a handhold for participants. The false floor of the test environment was made from medium-density fibreboard (MDF) and painted in Munsell N5 grey paint (reflectance R = 0.2). This covered the test area floor in front of the treadmill, and having the same surface height as the treadmill, this effectively created one continuous surface.
Diagram of apparatus – plan (left) and section (right). Dimensions: A = 2.4 m, B = 3.8 m, C = 2.6 m, D = 3.0 m.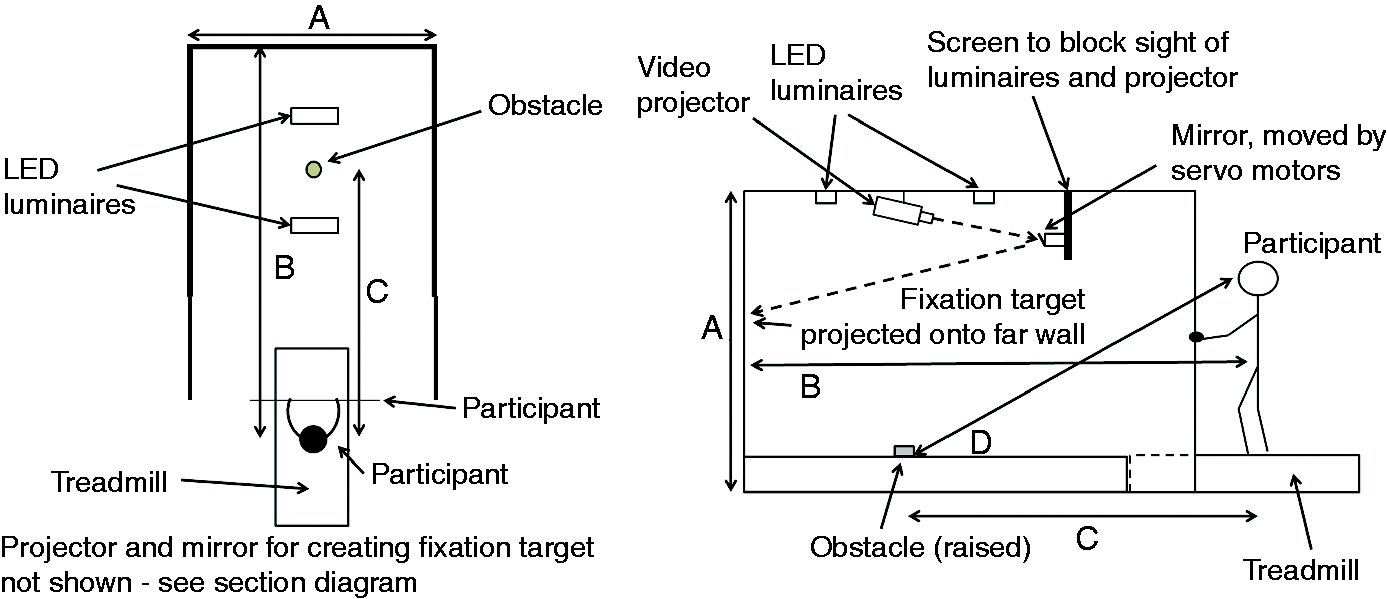
At the centre of the false floor, a cylinder, 200 mm in diameter, could be raised and lowered by a servo motor to either lie flush with the surrounding surface or protrude at variable heights, simulating an obstacle. This dimension was chosen to represent a typical potential trip hazard a pedestrian might encounter and require avoiding action, such as a raised drain cover or part of a paving slab. The height of the obstacle was controlled by a Python program, via a Pololu Maestro servo controller. The sides and top of the obstacle were painted in the same grey paint as used for the rest of the surrounding surfaces. The centre of the obstacle was positioned 1.2 m from the far wall and approximately 2.6 m from the participant’s position on the treadmill. Placing the obstacle 2.6 m ahead of the participant meant that it was in the region required for gait adjustment or steering to avoid a trip accident if not detected.6,14,26 At this distance, and for an eye-height of 1.5 m, the obstacle subtended a visual angle width of 3.81° and height of 0.47° at the maximum height used in this experiment (28.4 mm).
A data projector was suspended above the test area and directed towards a small mirror, indirectly projecting a fixation mark onto the far wall of the test environment. Low-reflectance black screening was placed around the mirror so that only the light falling on the mirror was reflected back on to the far wall, thus reducing any confounding effects of light from the projector. The mirror was mounted on a robotic two-axis gimbal which moved the fixation mark in a random path around the wall, simulating the visual gaze behaviour of a pedestrian walking in a natural outdoor setting.7,8 A screen was placed at the top of the test area to block sight of the luminaires, data projector and mirror apparatus (see section diagram in Figure 1), preventing any glare. The screen was adjusted based on the participant’s eye height at the beginning of each test session.
2.2. Lighting
Summary of lighting metrics.
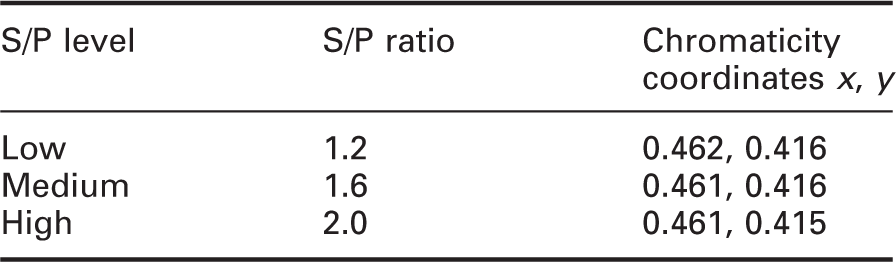
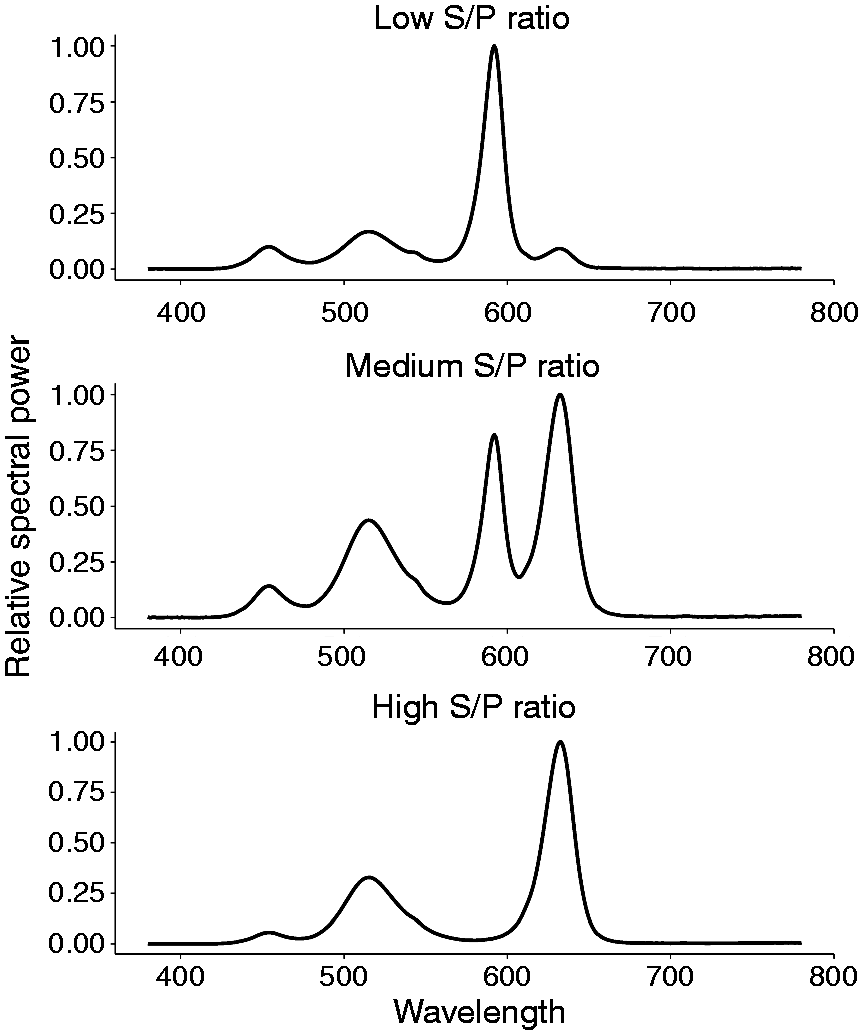
Relative spectral power distributions produced by LED arrays for low (S/P = 1.2), medium (S/P = 1.6) and high (S/P = 2.0) S/P ratios.
Tests were carried out under five horizontal illuminances (0.2 lux, 0.6 lux, 2.0 lux, 6.3 lux and 20.0 lux), as recorded at the centre of the obstacle. These illuminances increase in steps of 0.5 log units, bracketing the illuminances recommended in UK road lighting guidelines 27 and matching those used in previous peripheral detection studies20,22 to enable comparison. The illuminance on the surrounding surface reduced to approximately 80% of that on the obstacle at a distance of 600 mm from the centre of the obstacle. At 20 lux obstacle illuminance, the illuminance at the eye of the participant was 1.18 lux when directed towards the obstacle surface and 0.55 lux when directed towards the back wall. The side of an obstacle when raised presented a luminance contrast of approximately 0.7 against the surrounding surface.
2.3. Task details
The cylindrical obstacle was elevated by a servo motor to one of seven different heights, 0.5 mm, 2.8 mm, 4.5 mm, 7.1 mm, 11.3 mm, 17.9 mm and 28.4 mm. The sequence of the six largest heights (2.8 mm–28.4 mm) followed a geometric progression of ratio 1.59 (0.2 log unit steps). The smallest height (0.5 mm) was used as a control condition in order to check for false positives, as detection probability for this height was expected to be significantly lower than for the larger obstacles: Average visual acuity at 20° eccentricity in the mesopic luminance range is above 10 min arc, 28 but the 0.5 mm obstacle subtends a vertical angle of only 0.5 min arc at the eye. However, with sufficient contrast, even a small target can be detected: In this experiment, the luminance contrast of the obstacle side against the surrounding surface (approximately 0.7) was below the threshold contrast for a target of this size and eccentricity. 28
The seven heights were presented in a random order. The obstacle was elevated at two speeds, 1 mm/s and 2 mm/s. For a precise detection task, the target should appear near-instantaneously but that was not possible with the current apparatus. The rising height means the visual angle of the obstacle increases in a manner similar to the increasing size of a static obstacle as a pedestrian walks towards it. The speeds were chosen to fall within the range expected for typical walking speeds.
Participants indicated detection by pressing a hand-held response button. If detection occurred before the obstacle reached its maximum height, it would immediately return to lie flush with the surrounding surface, the home position, and a successful detection would be recorded. If the obstacle reached its maximum height without the button being pressed, it would remain at this height for 2 s, or until the button was pressed (whichever was sooner), before returning to the home position. If the button was pressed within this 2 s period, a detection was recorded, but if not a miss was recorded. The 2 s exposure time at maximum height was selected as, for the 2.6 m between the pedestrian and the obstacle, 2 s is approximately how much time the pedestrian would have before reaching the obstacle based on average walking speeds. 29 For the control condition (0.5 mm obstacle height), the exposure time at maximum height was increased to 8 s, this representing the typical average time of other trials, including random time interval and time to reach and remain at the maximum height. The 8 s control condition would capture false-positive responses from guessing or pressing the response button randomly.
The aim of this experiment was to measure obstacle detection in peripheral vision. Hence a fixation mark was projected on to the far wall of the test area, via the data projector and mirror described above. The fixation mark was normally a crosshair, but at random intervals between 2 s and 6 s, the crosshair would change to a digit (from 1 to 9) for 0.2 s before returning to the crosshair. Participants were instructed to read aloud these numbers, this response being recorded and used as a measure of fixation maintenance. The fixation mark moved randomly within an ellipse on the far wall, this ellipse having a height of 1.05 m and width of 2 m (15.7° × 29.5° subtended at the eye) with its centre 1.5 m above the false floor, creating a visual angle of 30° between it and the obstacle. The maximum possible visual angle between the fixation target and the obstacle was 41.4° (when at the top of the ellipse) and the minimum was 18.6° (when at the bottom of the ellipse). The speed of movement was between 14.7° and 36.4° per second, this speed changing with each change in direction.
A number of peripheral detection studies have employed a static fixation mark with little validation of the degree to which fixation was maintained.17,30–32 Better practice is to use some form of foveal task, as has been done in some studies.33,34 This is the purpose of the current dynamic fixation target – to encourage foveal fixation on the fixation mark, better ensuring that peripheral vision was used for the obstacle detection task. 35
2.4. Procedure
Thirty participants were recruited, 15 younger (aged <35 years, mean = 26.3 years, 8 females) and 15 older (aged >50 years, mean = 62.5 years, 4 females), who received a small payment. Normal colour vision was confirmed using the Ishihara test under a D65 daylight-simulating fluorescent lamp. Participants wore their normal corrective lenses (25% of the young group, 60% of the old group) and normal visual acuity (6/6) was confirmed using a Landolt ring test.
Following completion of the colour and acuity tests, a 20-min period was allowed for adaptation during which the laboratory lights were switched off and the LED lights used in the experiment were switched on, giving 2.0 lux and the medium S/P level. During this time, participants were given instructions. It was stressed that the fixation target task, following the target and reading aloud the number when it changed, should be their primary focus, and pressing the response button if they detected the obstacle was a secondary task. This was to encourage participants to maintain foveal gaze on the moving fixation target.
Participants were given time to become accustomed to walking on the treadmill, and find a speed that they were comfortable with. They were told to identify a walking speed that felt natural and was similar to that which they would use if walking down a street. The mean walking speeds of participants were 3.2 km/h for the young group and 2.2 km/h for the old group. Individual walking speeds were adopted because forcing participants to walk at unnaturally slow or fast speeds may have added additional task difficulty not found in a real pedestrian setting. 36 The speed setting determined by the participant was subsequently used in the main test.
A practice session was included to introduce the participant to the fixation task and the obstacle detection task (pressing the response button if they noticed the obstacle was raised). This involved 12 trials of increasing difficulty, in which the obstacle rose to progressively lower heights, and the fixation target added increasing difficulty (for example, it began as a static target, low on the far wall, reducing the off-axis angle of the obstacle, and eventually became a moving target, with a greater off-axis angle). Participants were deemed to have completed the practice session satisfactorily, if they detected the obstacle on 10 out of the 12 trials. All participants completed the practice session satisfactorily at their first attempt.
During a trial, participants fixated upon the fixation target, stating aloud any digits that appeared, whilst walking on the treadmill at their self-selected pace, and pressing a handheld button to note detection of a raised obstacle. Each of the seven obstacle heights was presented twice, once at each speed, with each presentation being defined as one trial. The order in which these 14 trials took place was randomised for each lighting condition. A random interval between 5 s and 8 s took place between the end of one trial and beginning of another. This was repeated under all 15 combinations of S/P ratio and illuminance in a semi-random, counterbalanced order, to ensure there were no systematic order effects.
Each lighting condition took approximately 3 min to complete. If the participant requested a break, or if four consecutive conditions had been completed, a short rest period was taken (≈3–4 min) until the participant was ready to resume. When all 15 conditions had been completed, a final 16th condition was carried out. This was a repeat of the first condition for each participant and allowed direct comparison with that first condition to test for practice or fatigue effects. Each condition appeared once as the first condition in each age group, ensuring all conditions were included in the first-repeat comparison. Overall, the experiment took approximately 2 h to complete for each participant, including instructions, adaptation and completion of all lighting conditions.
3. Results
The experiment was a mixed-measures design, with one between-subjects factor (age group) and two within-subjects factors (illuminance and S/P ratio). Two dependent variables were recorded, whether the obstacle was detected and the obstacle height (mm) at the point of detection. For this second measure, we analyse here only the results obtained with the largest obstacle height (28.4 mm). This is because the height of the obstacle when detected was limited by the maximum height the obstacle could go to for any particular trial. This may produce a floor effect, where no detected height is recorded at the lower heights if the obstacle is not detected. Using only the trials with the largest obstacle height reduces the likelihood of producing this floor effect. All groups of data were checked for normality by inspecting histogram distributions, measures of central tendency and the Shapiro-Wilks test. Except where otherwise stated, it was considered that these data were drawn from normal distributions and parametric tests were used to analyse the data. An alpha level of 0.05 was used for all statistical tests.
3.1. Fixation target identification
The fixation target changed to a digit with a mean frequency of 40 (sd = 5) during each condition. Overall, the digit was correctly identified in 91.8% (sd = 4.1%) of presentations, within which the young group had a slightly higher correct identification rate than the old group (means of 94.3% and 89.5%, respectively, p < 0.001). As around 9 out of every 10 digits were successfully identified, we have reasonable confidence that participants were looking at and following the fixation target throughout the experiment.
3.2. Obstacle speed
The obstacle was raised at two different speeds (1 mm/s and 2 mm/s) and each obstacle height was repeated twice for each lighting condition, once at each speed. To check whether the obstacle speed influenced detection performance, a series of paired comparisons were made between the two speeds for detection rate and detection height. These data were not normally distributed. For detection rate, comparisons were made across all obstacle heights and lighting conditions (a total of 112 comparisons) using the McNemar test. For detected height, paired comparisons were made using the Wilcoxon signed-rank test. All lighting conditions were compared but only for the largest obstacle height trials, resulting in 16 comparisons. Both tests were applied repeatedly to the data: To account for the increased chance of Type 1 errors, we used p-value adjustment using the false discovery rate (FDR) control method. 37
For detection rate, differences between the two different speeds were not suggested to be significant. However, for detection height, all 16 comparisons of obstacle speed were significant. The slower obstacle speed produced a lower mean detection height (5.63 mm, averaged across all conditions) than the faster speed (7.73 mm).
This difference can be explained by the latency between an obstacle being detected and the response button being pressed to indicate detection: The obstacle will travel a greater amount in this latency period for the faster speed. In a pilot study test, the participants were instructed to detect the obstacle (whilst tracking the fixation target) in which the obstacle rose almost immediately (<0.1 s) to the range of different heights. These data suggested a mean latency between the obstacle becoming noticeable and the response button being pressed of approximately 1.25 s. Given such a reaction time, at 2 mm/s the obstacle would travel 1.25 mm further than at 1 mm/s when the response button was pressed. Subtracting this latency distance from the detection heights, the effect of obstacle speed in all 16 conditions is no longer suggested to be significant.
It was concluded that any difference in detection height between the two obstacle speeds is a function of the extra distance travelled in the period between detection and response, rather than the speed affecting detection performance itself. The lack of any significant differences between the speeds when comparing detection rates also supports this conclusion. Thus, in subsequent analyses we used the mean detection rate and detection height for each participant as averaged across the two obstacle speeds.
3.3. Detection rate
Figure 3 shows the detection rates for every obstacle height under each combination of illuminance, S/P ratio and age group. As expected, detection rate increases as the obstacle height increases. Figure 3 shows a rapid increase in detection rate from the smallest obstacle height, until a plateau of maximal performance is reached, usually before the largest obstacle height used in this study (28.4 mm).
Mean detection rates by obstacle height and S/P ratio, for each illuminance level and age group.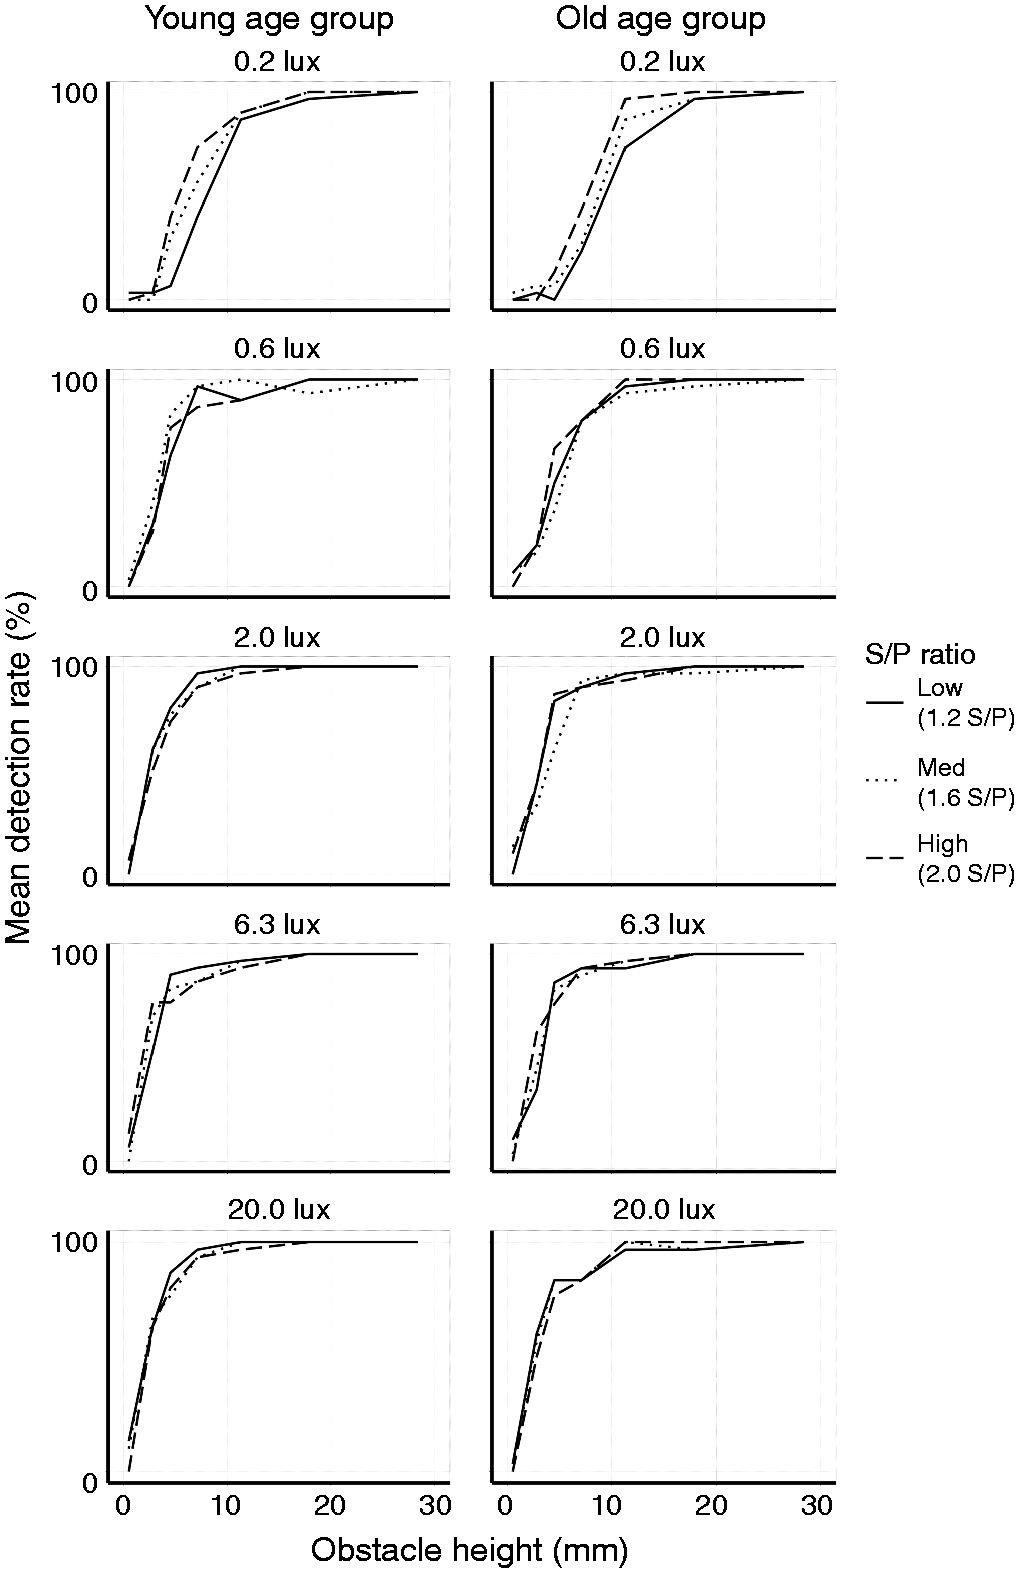
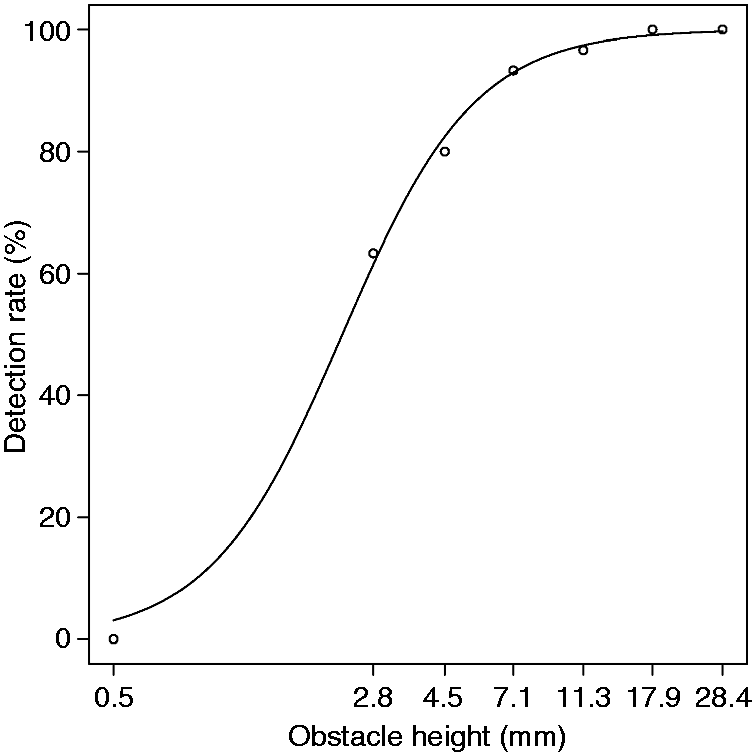
Comparison of detection performance between the various variables (age, S/P ratio and illuminance) was carried out using the obstacle height giving a 50% detection probability (h50). This was identified by using a four parameter logistic equation (4PLE) to create a line of best fit using detection rates for each obstacle height on each combination of illuminance and S/P as the data points. An example is shown in Figure 4. The 4PLE can be expressed as
Example of a 4PLE best-fit curve, for 0.2 lux illuminance, high S/P and young age group. Data points show actual mean detection rates at each obstacle height. A log10 scale is used for the x axis.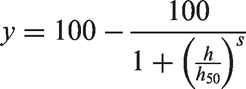
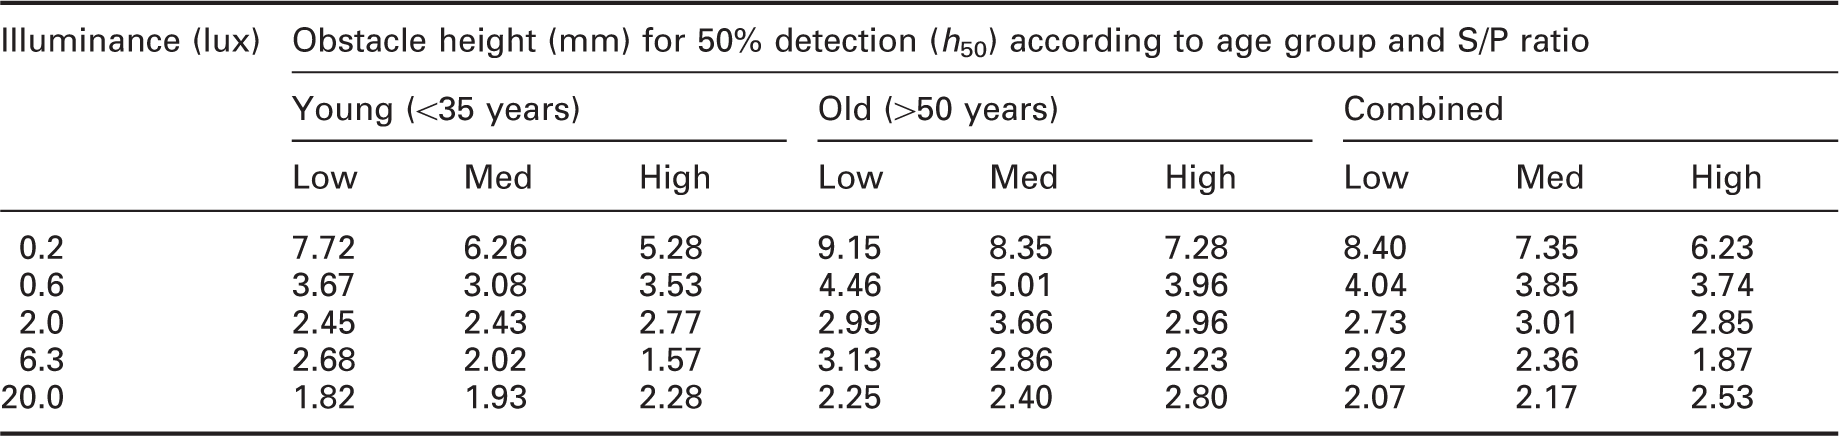
Obstacle heights for a 50% detection rate (h50) based on the 4PLE curves for each condition are shown in Figure 5. Smaller values of h50 indicate better detection performance: Figure 5 shows that detection performance improves as illuminance increases. However, performance appears to approach a plateau before the highest illuminance is reached, somewhere between 0.6 lux and 6.3 lux. There is also a suggestion that detection performance may vary between S/P levels, particularly at the lowest illuminance, as there are systematic differences between the levels: At the lowest illuminance, the high S/P gives the best performance and the low S/P the worst in both age groups. Table 3 shows the obstacle heights for 50% detection rate, as predicted by the 4PLE, for each illuminance and S/P combination. The value for each age group is shown, as well as a combined value.
Detected height of obstacle for 50% detection probability plotted against illuminance for each combination of S/P ratio and age. Obstacle heights (mm) for 50% detection probability, as determined by the 4PLE, for each illuminance, S/P ratio and age group. Note. Low S/P = 1.2; medium S/P = 1.6; high S/P = 2.0.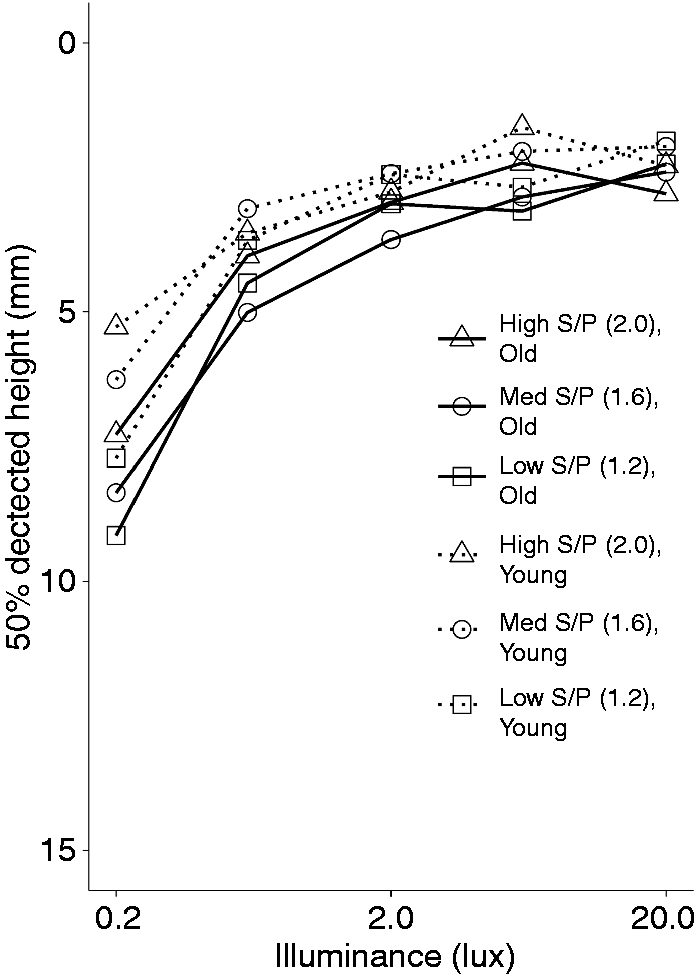
3.4. Detected heights
These data are the heights at which detection of the obstacle rising to the tallest height (28.4 mm) was recorded. When the distributions of detected heights within each combination of illuminance and S/P ratio were inspected for normality, some were positively skewed due to outlying data points at the higher end of the detected height range. Inspection of these outliers showed that performance on these outlying trials was not consistent with performance on the majority of other trials for the individual participants involved, and no systematic pattern was seen in the conditions that produced the outliers. It was therefore concluded that outliers were likely due to participant error, for example, loss of concentration on a particular trial. Removal of outlying values was therefore justified. 40 This was done by converting detected heights for each participant within each lighting condition to a z-score. Values with a z-score above a recommended threshold z-score of 2.576 were deleted. 41 This resulted in the deletion of one data point from nine conditions and two data points from one condition. The outlying values came from eight of the participants (four in each age group). After removal of outliers, the datasets for all conditions approximated a normal distribution.
Figure 6 shows the mean detected height at each illuminance, for each S/P ratio and age group. As illuminance increased, participants detected the obstacle at lower heights. There is a possible difference between age groups, with detected heights being generally larger for the older participants. There appears to be little relationship between S/P ratio and detected height, with the exception of the lowest illuminance level (0.2 lux), where the pattern of higher S/P ratio and lower detected height is repeated for both young and old age groups.
Mean detected height plotted against illuminance, for young and older age groups and three S/P ratios.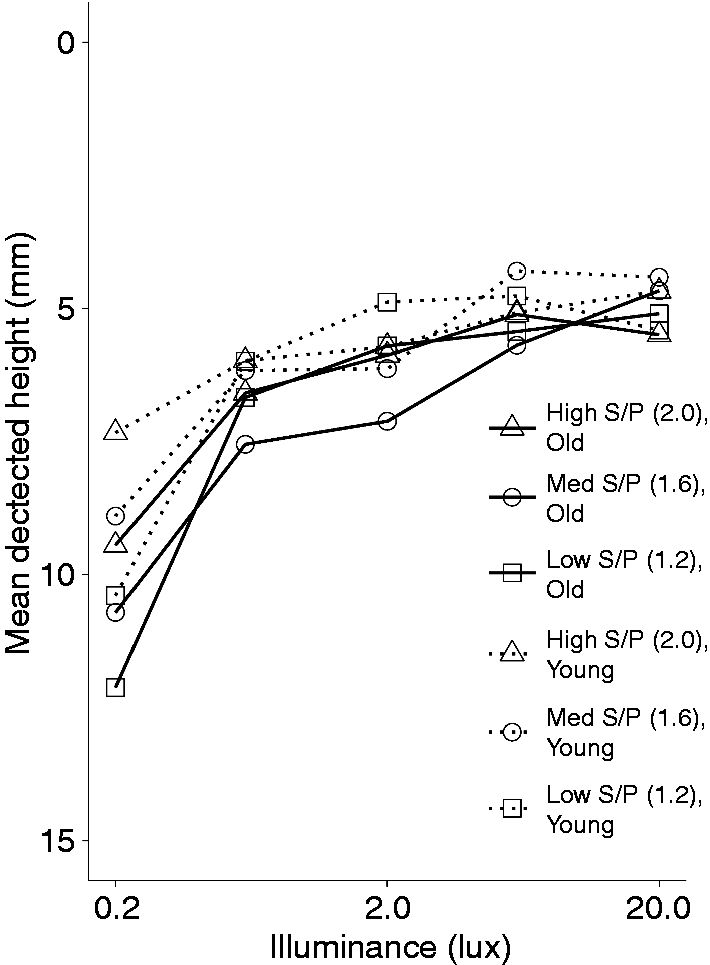
A mixed-model ANOVA was carried out to examine the relationships between age group, illuminance and S/P ratio, and detected height of the obstacle. The detected height was used as the dependent variable, with age group as a between-subjects factor (2 levels), and illuminance (5 levels) and S/P ratio (3 levels) as within-subject factors. The ANOVA found a significant main effect of illuminance (p < 0.001). Post hoc tests using the Tukey HSD test suggested that the detected height at 0.6 lux (mean = 6.75 mm) was significantly greater than at higher illuminances, and the detected height at 0.2 lux (mean = 9.94 mm) was significantly greater than all other illuminances (p < 0.001 in all cases). Detected height between values from 2.0 lux upwards did not significantly differ (means for 2.0 lux, 6.3 lux and 20.0 lux = 6.07 mm, 5.24 mm and 5.37 mm, respectively, p-values ranged between 0.083 and 0.994).
The model suggested that there was no significant main effect of age group on detected height (p = 0.123), and no significant interaction between age and S/P level (p = 0.68). However, there was a significant interaction between age group and illuminance (p = 0.014). Post hoc comparisons using the Tukey HSD test gave a suggestion that detection performance, as measured by the mean detected height, may have been better in the young age group compared with the old age group at the lower illuminance levels, but not at higher illuminance levels. For example, there was no significant difference between detected height for the young group at 0.6 lux and detected height for the old group at 6.3 lux and 20.0 lux, suggesting detection performance for the young group at this lower illuminance was equal to detection performance at the higher illuminances for the old group. This effect was confirmed by independent t-tests comparing the two age groups on each level of illuminance, using the FDR method of controlling for multiple comparisons. These showed that the young age group had significantly better performance at 0.2 lux compared with the old age group (means = 8.9 mm vs 11.0 mm, p = 0.04). At 0.6 lux and above, performance did not differ significantly between age groups (p-values of 0.14, 0.39, 0.77 and 0.98 at 0.6 lux, 2.0 lux, 6.3 lux and 20.0 lux, respectively).
The ANOVA suggested a significant main effect of S/P ratio (p = 0.004). Post hoc tests using the Tukey HSD test suggested the differences between S/P ratios may have lay between the high and low levels and the high and medium levels, but p-values did not reach statistical significance (p = 0.09 and 0.12, respectively). Additional paired t-tests with FDR adjustment comparing the three combinations of S/P ratio (high versus medium, high versus low, medium versus low) suggested the high S/P ratio produced a significantly lower detected height than the medium or low S/P ratios (p = 0.012 in each case, means for high, medium and low = 6.24 mm, 6.87 mm and 6.91 mm, respectively).
The interaction between illuminance and S/P ratio was statistically significant (p = 0.001). Post hoc tests using the Tukey HSD test suggested the detected height differed significantly by S/P ratio at 0.2 lux (specifically, the high S/P resulted in significantly lower detected height than the low S/P, means = 8.39 mm vs 11.26 mm, respectively, p < 0.01), but not at any other illuminance. This was further confirmed by repeated measures ANOVAs at each level of illuminance with FDR adjustment. Detected height varied significantly with S/P ratio at 0.2 lux (p < 0.001), but not at any other illuminance (p-values ranged between 0.131 and 0.858). The interaction between illuminance, age and S/P was not statistically significant (p = 0.79).
3.5. Practice effect
It is possible that performance changed for each participant as the experiment progressed, due to practice effects with the participant becoming more proficient at the task through learning, or fatigue effects with the participant becoming less proficient at the task as they become more tired or concentrated less on the task.42,43 To check whether any such effects occurred during this experiment, the first lighting condition used for each participant was also repeated at the end of the experiment. This allowed direct comparison of the same condition at the beginning and at the end of the experiment.
The obstacle height for 50% detection probability, based on the 4PLE, was compared for the first condition and the repeat condition. The obstacle height for a 50% detection rate on the first condition (h50) was 4.50 mm, compared with 2.69 mm on the repeat condition. Considering the mean detection height, a paired sample t-test suggested the mean height at which the obstacle was detected was significantly higher on the first condition compared with the repeat condition (means = 7.76 (sd ± 3.86) vs 5.20 (sd ± 2.61) mm, p < 0.001).
These results suggest there was a practice effect during the experiment: Obstacle detection performance was better at the end of the experiment than at the beginning. However, this should not create a bias within the current results as the order in which conditions were presented to participants was counterbalanced, ensuring each condition appeared an equal number of times at the beginning, middle and end of the experiment. 44
4. Discussion
4.1. Age
Tripping over objects on the floor is one of the most frequent causes of falls in the elderly, 45 and the elderly are less likely than young people to avoid obstacles if their attention is divided, a likely occurrence if walking down a street. 46 It is, therefore, essential for road lighting to aid the identification and avoidance of obstacles for all age groups, but particularly the elderly. Vision deteriorates as we get older, due to reduced levels of light reaching the retina, reduced contrast within the retinal image resulting from increased scattering of the light before it reaches the retina, and changes in the absorbance of the lens, particularly for shorter wavelength light. 28 This not only means that obstacle detection performance, in general, may be poorer amongst older people, but also that the spectrum of the light may have a different effect on obstacle detection performance amongst older people compared with young people.
Analysis of mean detection height in the current experiment suggested an effect of age at the lowest illuminance (0.2 lux) but not for higher illuminances (0.6 lux, 2.0 lux, 6.3 lux and 20 lux). This is similar to the results of previous work, 20 which compared younger people (mean age of 32 years) with older people (mean age of 68 years). The young group showed significantly better detection of obstacles than the old group at the lowest illuminance (0.2 lux), but there was no difference at higher illuminances (2.0 lux and 20 lux). Age did not appear to influence the degree to which SPD affected detection ability, as no interaction was found between age and S/P in this study. Both old and young participants were affected in the same way, with S/P only having an effect at 0.2 lux for both age groups.
4.2. Comparison with previous research
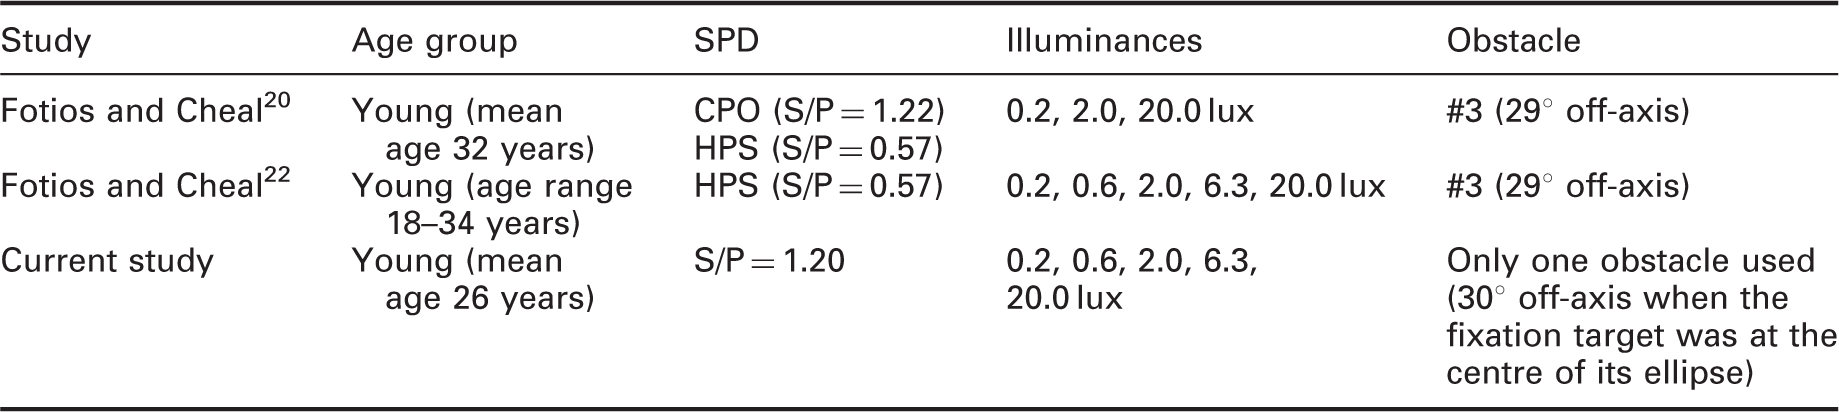
Figure 7 shows the current results along with those from previous studies of obstacle detection.20,22 Since these studies used different observation distances, the comparison is made on the basis of visual angle (min arc) subtended by the obstacle at the eye rather than obstacle height in millimetres. The data compared in Figure 7 are those representing the most similar conditions as shown in Table 4, providing the best match of participant age, obstacle location, lamp SPD and illuminance.
Conditions compared for three studies of obstacle detection.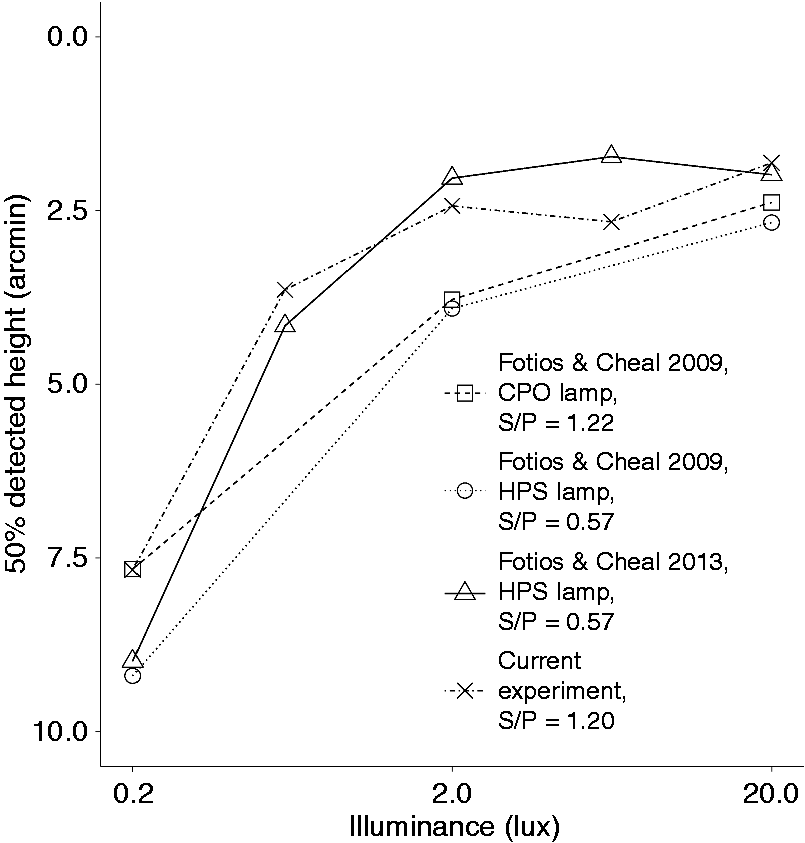
Data from all three studies follow a similar curve and appear to provide reasonably consistent results. This implies a satisfactory decree of reproducibility in the methods used in these studies and suggests the data provided in the current study are reliable. At the lowest illuminance (0.2 lux), the low S/P ratio sources (HPS lamps use by Fotios and Cheal20,22) require a larger obstacle height to reach a 50% detection probability than the higher S/P ratio (1.2) used in the current work and by Fotios and Cheal. 20 This is the expected result.
The 2009 study 20 used lamps with three different SPDs, providing S/P ratios of 0.57, 1.22 and 1.77. Results from this study suggested that S/P ratio had an effect on detection performance at the lowest illuminance of 0.2 lux, with a higher S/P giving improved detection of the obstacle, but not at higher illuminances. This finding mirrors that found in the current study, with S/P level only having an effect on detection performance at the lowest illuminance level used, 0.2 lux. This same interaction between S/P ratio and light level has been noted in other peripheral detection research. 17
5. Conclusion
This paper describes an experiment set up to examine the detection of peripheral targets in a manner that better simulated the pedestrian context than previous work by using a larger visual field, dynamic visual fixation and parallel cognitive load (maintenance of balance whilst walking). It was found that higher illuminances lead to increased detection probability with this effect reaching a ceiling in the region of 2.0 lux. It was found that observer age and light source S/P ratio affected detection only at the lowest illuminance used in this experiment, 0.63 lux. While this illuminance is at the lower end of current recommendations for lighting in subsidiary roads, 47 suggesting a lower design illuminance could be adopted in some situations, there is also a need to consider the lighting required for other visual needs of pedestrians, such as reassurance 48 and interpersonal judgements, 49 which may suggest different optimum lighting characteristics.
One limitation of the current study, and of other studies17–19,34 is that the peripheral target was always at the same physical location. Other studies20,22,31 have used multiple, randomly chosen, target locations, and it would be useful to know how this affected the results. It is also desirable to validate these results using an entirely different procedure to determine whether the conclusions from both converge.
Footnotes
Declaration of conflicting interests
The author(s) declared no potential conflicts of interest with respect to the research, authorship, and/or publication of this article.
Funding
The author(s) disclosed receipt of the following financial support for the research, authorship, and/or publication of this article: This work was carried out with support from EPSRC (EP/H050817) as part of the MERLIN project and the EPSRC-funded E-Futures Doctoral Training Centre for Interdisciplinary Energy Research, University of Sheffield.