
Abstract
Using road lighting to improve the detection of potential hazards may contribute to reduced accident rates for pedestrians, drivers and other road users. In past studies carried out to measure peripheral detection, the test participant was instructed to maintain fixation on a target during presentation of the peripheral target, but these studies did not question the degree to which this fixation was maintained. We therefore used eye tracking to record fixations during a peripheral detection task and introduced a fixation task designed to encourage fixation. It was found that observers were good at maintaining foveal fixation and there was little benefit in introducing a fixation task although this might be of greater benefit if the peripheral field contains more interesting distractions.
1. Background
Within the lighting research community, some have sought to study peripheral detection under different lighting conditions.1–11 This is of interest since using lighting to improve detection (“improve” implying a shorter reaction time to the onset of a stimulus and/or a greater frequency of detection) may contribute to better safety for motorists, cyclists and pedestrians after dark.
The visual field is scanned using peripheral vision: If something of interest is detected, head and eye movements are used so that this item of interest is placed on the fovea where the better acuity aids identification. In experiments investigating peripheral detection, a fixation mark is identified (e.g. a cross hair marked on a surface) and the test participant is instructed to maintain their fixation on this mark. The detection stimulus is then presented in a location peripheral to the target and it is assumed that the test participant maintains his/her visual fixation on the fixation mark. If fixation is directed towards the detection target instead of the fixation mark, the experiment is not accurately measuring peripheral detection as was intended. This raises the question of how the experimenter can be confident that fixation is maintained. We describe further methods that could or have been used to monitor fixation or to encourage fixation.
Fixation control in studies investigating peripheral detection.
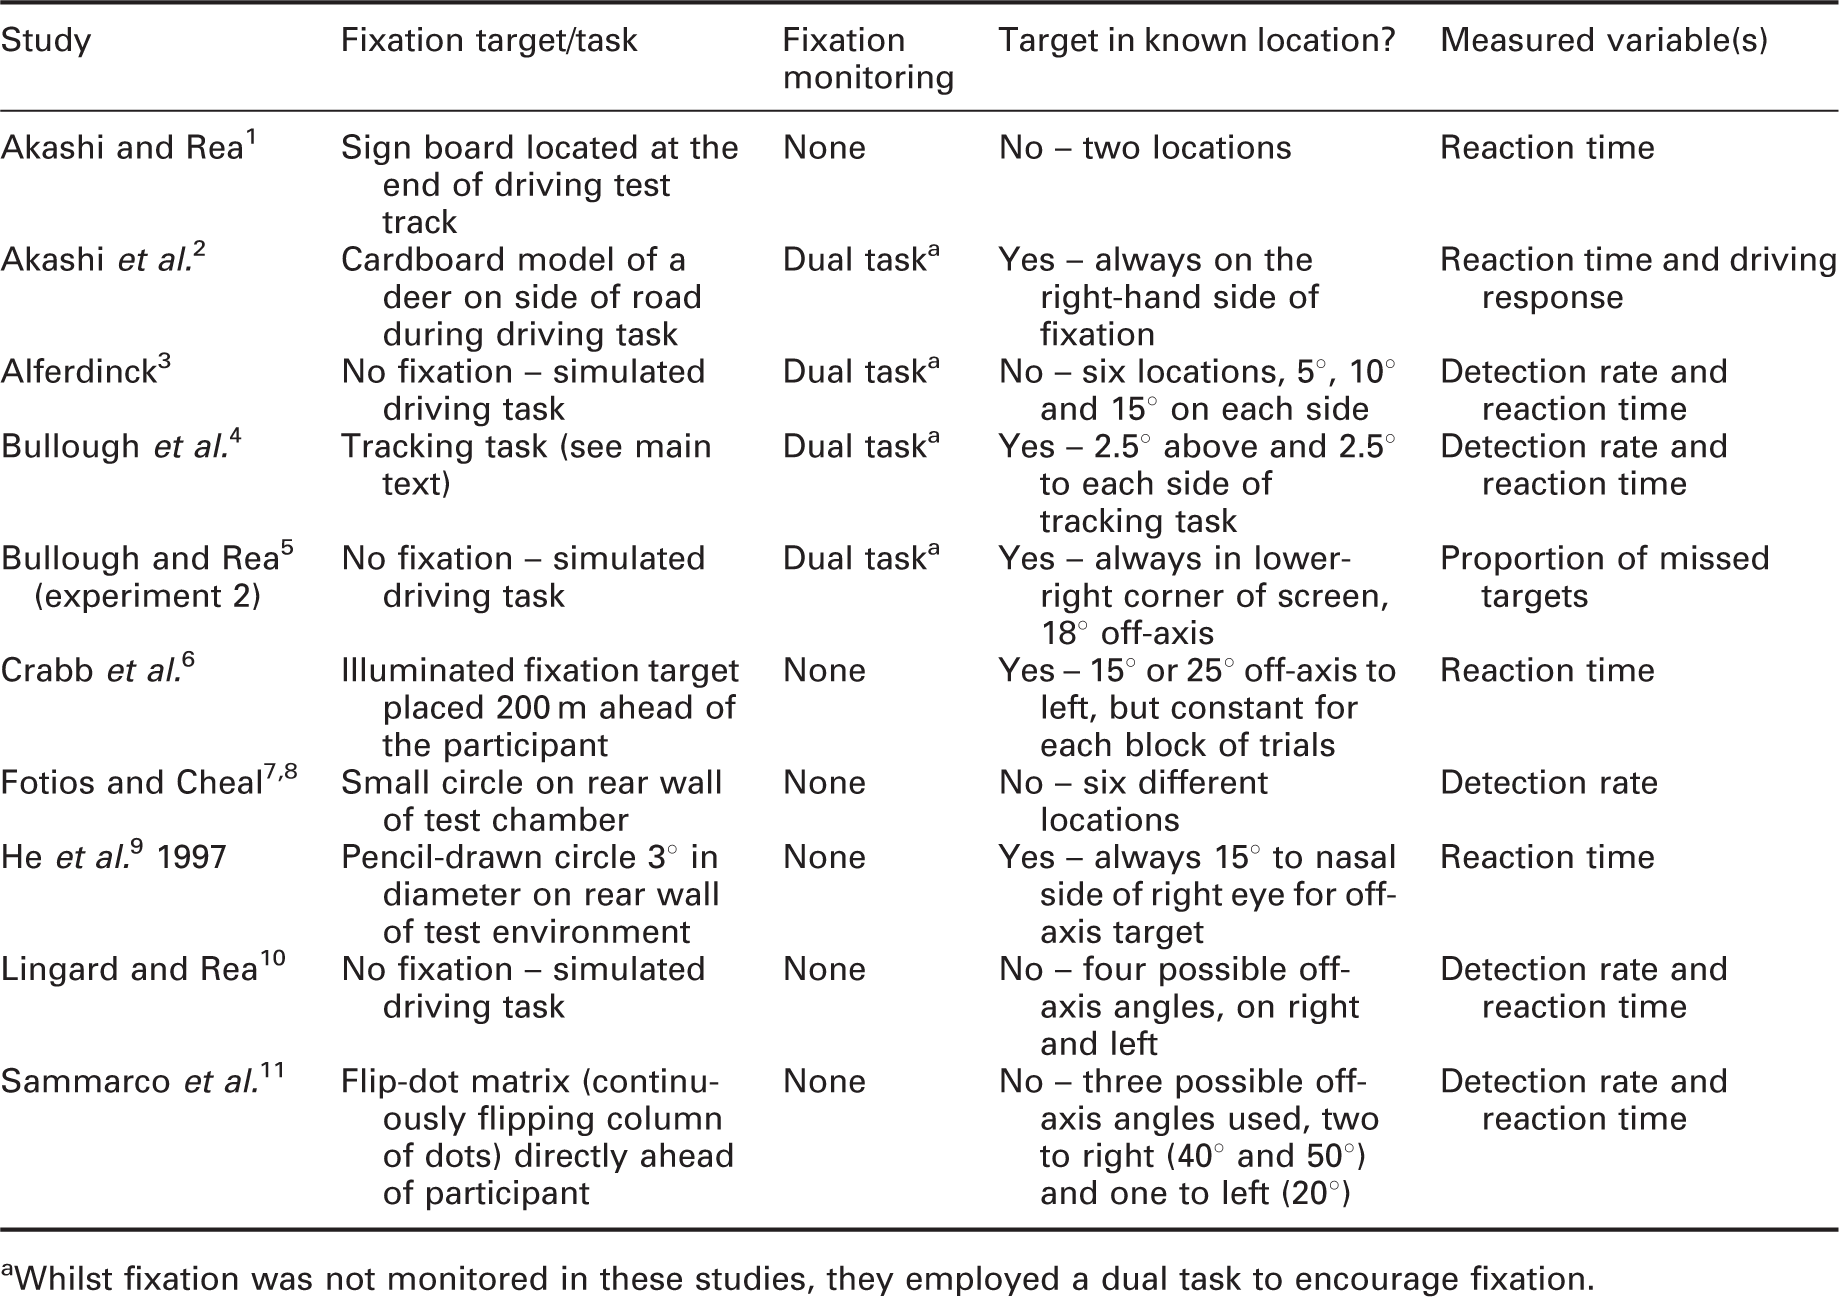
aWhilst fixation was not monitored in these studies, they employed a dual task to encourage fixation.
A second approach is to encourage fixation by placing a task at the fixation location, and the literature indicate two methods that have been used. One method is to use a task which prompts attention such as a real1,2 or a simulated3,5,10 driving task: In this task, the observer (driver) looks ahead to maintain safe driving; this does not ensure fixation on a specific target but ensured the peripheral task was maintained in a peripheral location. The second method is to use a task from which a task accuracy score can be used to indicate the degree of fixation. Bullough et al. 4 used a tracking task in which participants used a rotary knob to keep the randomly moving pointer of a meter in the central position. They included an over-ride that delayed presentation of the next target stimulus unless this pointer was in the central position.
A variation on these approaches to encouraging fixation was developed within a study of pedestrian lighting. Apparatus to measure pedestrians’ obstacle detection ability was developed to extend the studies of Fotios and Cheal.7,8 Rather than using a fixation mark in a specific location, this mark moved in a random direction within an elliptical area, simulating natural movement of the eyes.14,15 Whilst this movement means the relative location of the peripheral target is not fixed, it would lie within a known range of angles from the fovea and this range could be controlled through the size of the ellipse. This fixation mark would change to a digit for 0.2 s at a random point within an interval of 2.0–6.0 s, and test participants were instructed to say aloud what this digit was. Accuracy in identification of these digits provides a measure of the degree to which fixation was maintained.
Whilst some studies have used a fixation task to encourage foveal fixation, gaze behaviour was not monitored and it is still uncertain whether such tasks meet the intended goal of maintaining gaze on the fixation mark. This article reports a pilot study carried out to investigate the degree to which fixation is maintained during a peripheral detection task and whether this is improved by using a fixation task. This was done using eye tracking to record visual fixations.
2. Method
2.1 Apparatus
Obstacle detection in peripheral vision was examined using an apparatus developed from that used in previous work.7,8 The tests took place within an open-ended cubicle measuring 2.4 m wide, 2.4 m high and 3.8 m long (Figure 1) and this was located inside an unlit laboratory. Test participants stood on a platform (a treadmill, not in operation for this study) at the open end of this cubicle, facing the far wall onto which the fixation target was projected. A black metal bar acting as a safety handhold was placed above the platform. When this bar was held at roughly arms-length, participants were stood approximately 3.8 m from the far wall of the cubicle. Matt black cloth was draped over all visible surfaces other than the floor, and this was dark grey linoleum with low sheen.
Diagram of obstacle detection apparatus – plan (left) and section (right). Dimensions: A = 2400 mm, B = 2400 mm, C = 3000 mm, D = 3800 mm and E = 2600 mm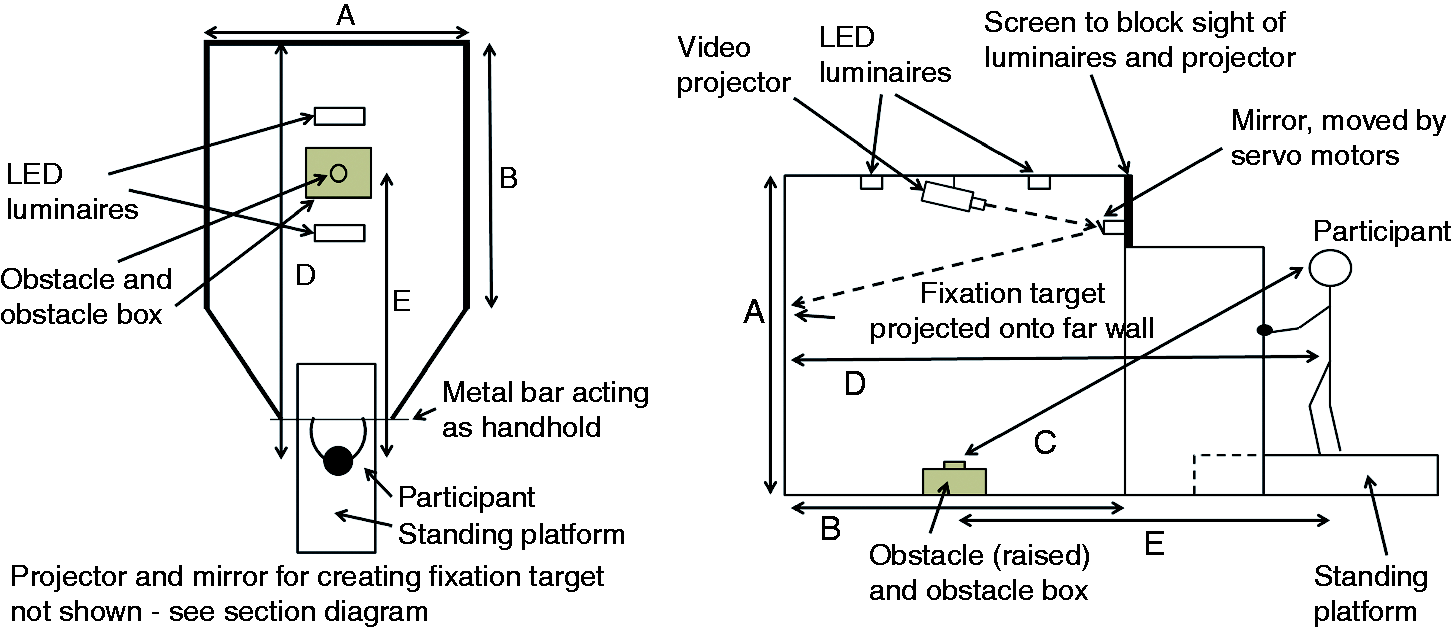
A simulated obstacle was placed on the floor between the test participant and the projection wall. This obstacle comprised a box (of top surface dimensions 600 × 450 mm and height 180 mm) which housed a servo motor attached to a cylinder with a diameter of 100 mm that could be raised and lowered from the top centre of the box. The top surface of the cylinder would lie flush with the top of the box when in its lowered position but could be raised to a maximum height of 50 mm above the top surface of the box, thus simulating various heights of raised obstacle. The servo motor was controlled through a computer program written in Python, via a Pololu micro-controller. The box and cylinder were constructed from MDF wood and cardboard with the visible surfaces painted with grey paint (Munsell N5).
The obstacle was placed so that its centre was 1.7 m from the front edge of the standing platform and 1.2 m from the far wall of the semi-enclosed cubicle. The horizontal distance between the participant’s position on the platform and the centre of the obstacle was approximately 2.6 m. The distance between participants was kept as close to constant as possible, and during trials with the same participant, by instructing them to always keep hold of the metal bar suspended over the platform. For an average eye height of 1.5 m, the distance between the participant’s eye and the obstacle was approximately 3.0 m. At this distance, the obstacle represented a visual size of 1.68° in width and 0.50° in height when reaching the maximum height (in this experiment) of 30.3 mm.
The obstacle box and surrounding area within the cubicle were lit by two LED luminaires suspended from the ceiling. Each luminaire contained four clusters of LEDs, these comprising four different types of LED to permit spectrum tuning. The luminaires were spaced 600 mm apart and positioned centrally within the cubicle area. The LEDs were controlled through a MATLAB program. This could be used to adjust the spectrum and luminance of the lamps. A sheet of Perspex was placed in front of each lamp to increase light diffusion and illuminance uniformity over the obstacle area.
The aim of this experiment was to explore whether a foveal task improved fixation rather than compare detection under different lighting conditions; therefore, only one lighting condition was used: The illuminance on the top surface of the obstacle was 2.0 lux, and the light spectrum had an S/P ratio of 1.33. Luminance values at the top surface of the obstacle, the rear wall at the middle of the ellipse and the centre of the fixation target were 0.13, 0.02 and 2.61 cd/m2, respectively.
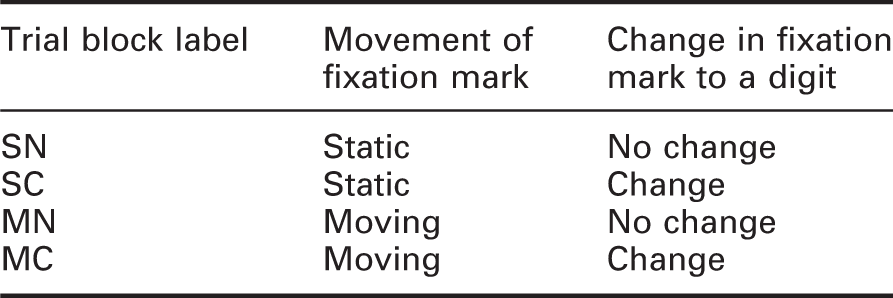
Variations in the movement and content of the fixation target.
The obstacle was presented at six different raised heights which followed a geometric progression of ratio 1.26 (0.1 log unit steps) which is the same progression as used for increasing gap sizes on the Bailey–Lovie acuity chart. 16 The obstacle heights selected were 3.0, 4.8, 7.6, 12.0, 19.1 and 30.3 mm.
During trials, participants wore a pair of SensoMotoric Instruments eye-tracking glasses. The eye-tracker recorded the eye movements of the participant, producing a video output of the scene in front of the participant (recorded by a forward-facing camera on the glasses) on which was superimposed the location where the eyes were looking. The eye-tracker also produced raw data comprising the gaze position as x and y coordinates centred on the video output every 33 ms, and details of fixations and saccades as defined by software used for processing the raw eye position data (BeGaze 3 from SensoMotoric Instruments).
Ten test participants were recruited, with a mean age of 28.7 years (standard deviation = 3.8 years), of whom three were females. This sample size was chosen to match those used in previous eye-tracking studies.17–20 All participants had normal colour vision and corrected acuity, as tested by the Ishihara colour vision test and Landolt ring acuity chart at 2 m under normal office lighting conditions. Two participants wore their own prescription glasses during the experiment.
2.2 Procedure
Tests commenced following a 10-min period for adaption to the low light level. During this adaptation time, participants carried out a practice test to allow them to become familiar with the tasks involved (observing the fixation target, reporting a digit when it appears and detecting the obstacle when raised). Participants were instructed to look at the fixation mark on the rear wall, stating aloud the digit presented in trials where this was done, and to indicate detection of the obstacle using a hand-held response button. Head movements were not restrained during these trials. To encourage focus on the fixation task, the experimenter informed participants that the foveal number-identification task was the primary task and they were requested to maintain fixation on the target as much as possible. The experimenter input the participant’s oral fixation marker responses: Obstacle presentation and response were recorded through the control software. There were four blocks of trials (Table 2) and these were employed in a different order for each test participant. Within each block, the obstacle was presented 18 times (three times for each of the six heights), and these 18 trials were presented in a random order.
3. Results
3.1 Accuracy with the fixation task
During the Static-Change (SC) and Moving-Change (MC) conditions, the fixation target would frequently but briefly change to a single digit, before returning to the default shape. This could occur at randomly selected intervals between 2 and 6 s, and the digit would appear for 0.2 s. The mean gap between digit presentations was 4.3 s, with a standard deviation of 1.1 s. The mean number of digits presented per condition was 49.4 with a standard deviation of 7.6. Participants were asked to state what the digit was if they saw it, and their response was recorded by the experimenter. The median proportion of correct responses was the same for both conditions (98%) and the Wilcoxon signed-ranks test confirmed that this difference was not statistically significant (p = 0.84). We conclude that test participants carried out this task accurately and that the fixation task maintained attention as was intended.
3.2 Eye tracking
Similar to Hu et al.,
21
two approaches were taken to analysing the eye tracking data. The first was to consider which area of the experimental setup was being looked at by the participant, the area of interest (AOI) approach which involves calculating the proportion of time or video frames the gaze of the participant is located in specific areas (the AOIs). This is a standard approach to analysing eye-tracking data, but it can be time-consuming to complete if video-coding is done manually, as is normally the case with dynamic visual stimuli. Two AOIs were used in this analysis – the fixation target area and the obstacle area. The fixation target area was defined as being anywhere on the far wall onto which the target was projected. The obstacle area was defined as being anywhere on the floor, obstacle box, or obstacle itself. These two areas filled most of the field of view in the video footage captured by the eye tracker (Figure 2).
Clockwise from top left: Gaze position (white circle) on fixation target (white cross), frame classed as target area; gaze position near fixation target, frame classed as target area; gaze position (black circle) on floor near obstacle box, frame classed as obstacle area; gaze position on obstacle box, frame classed as obstacle area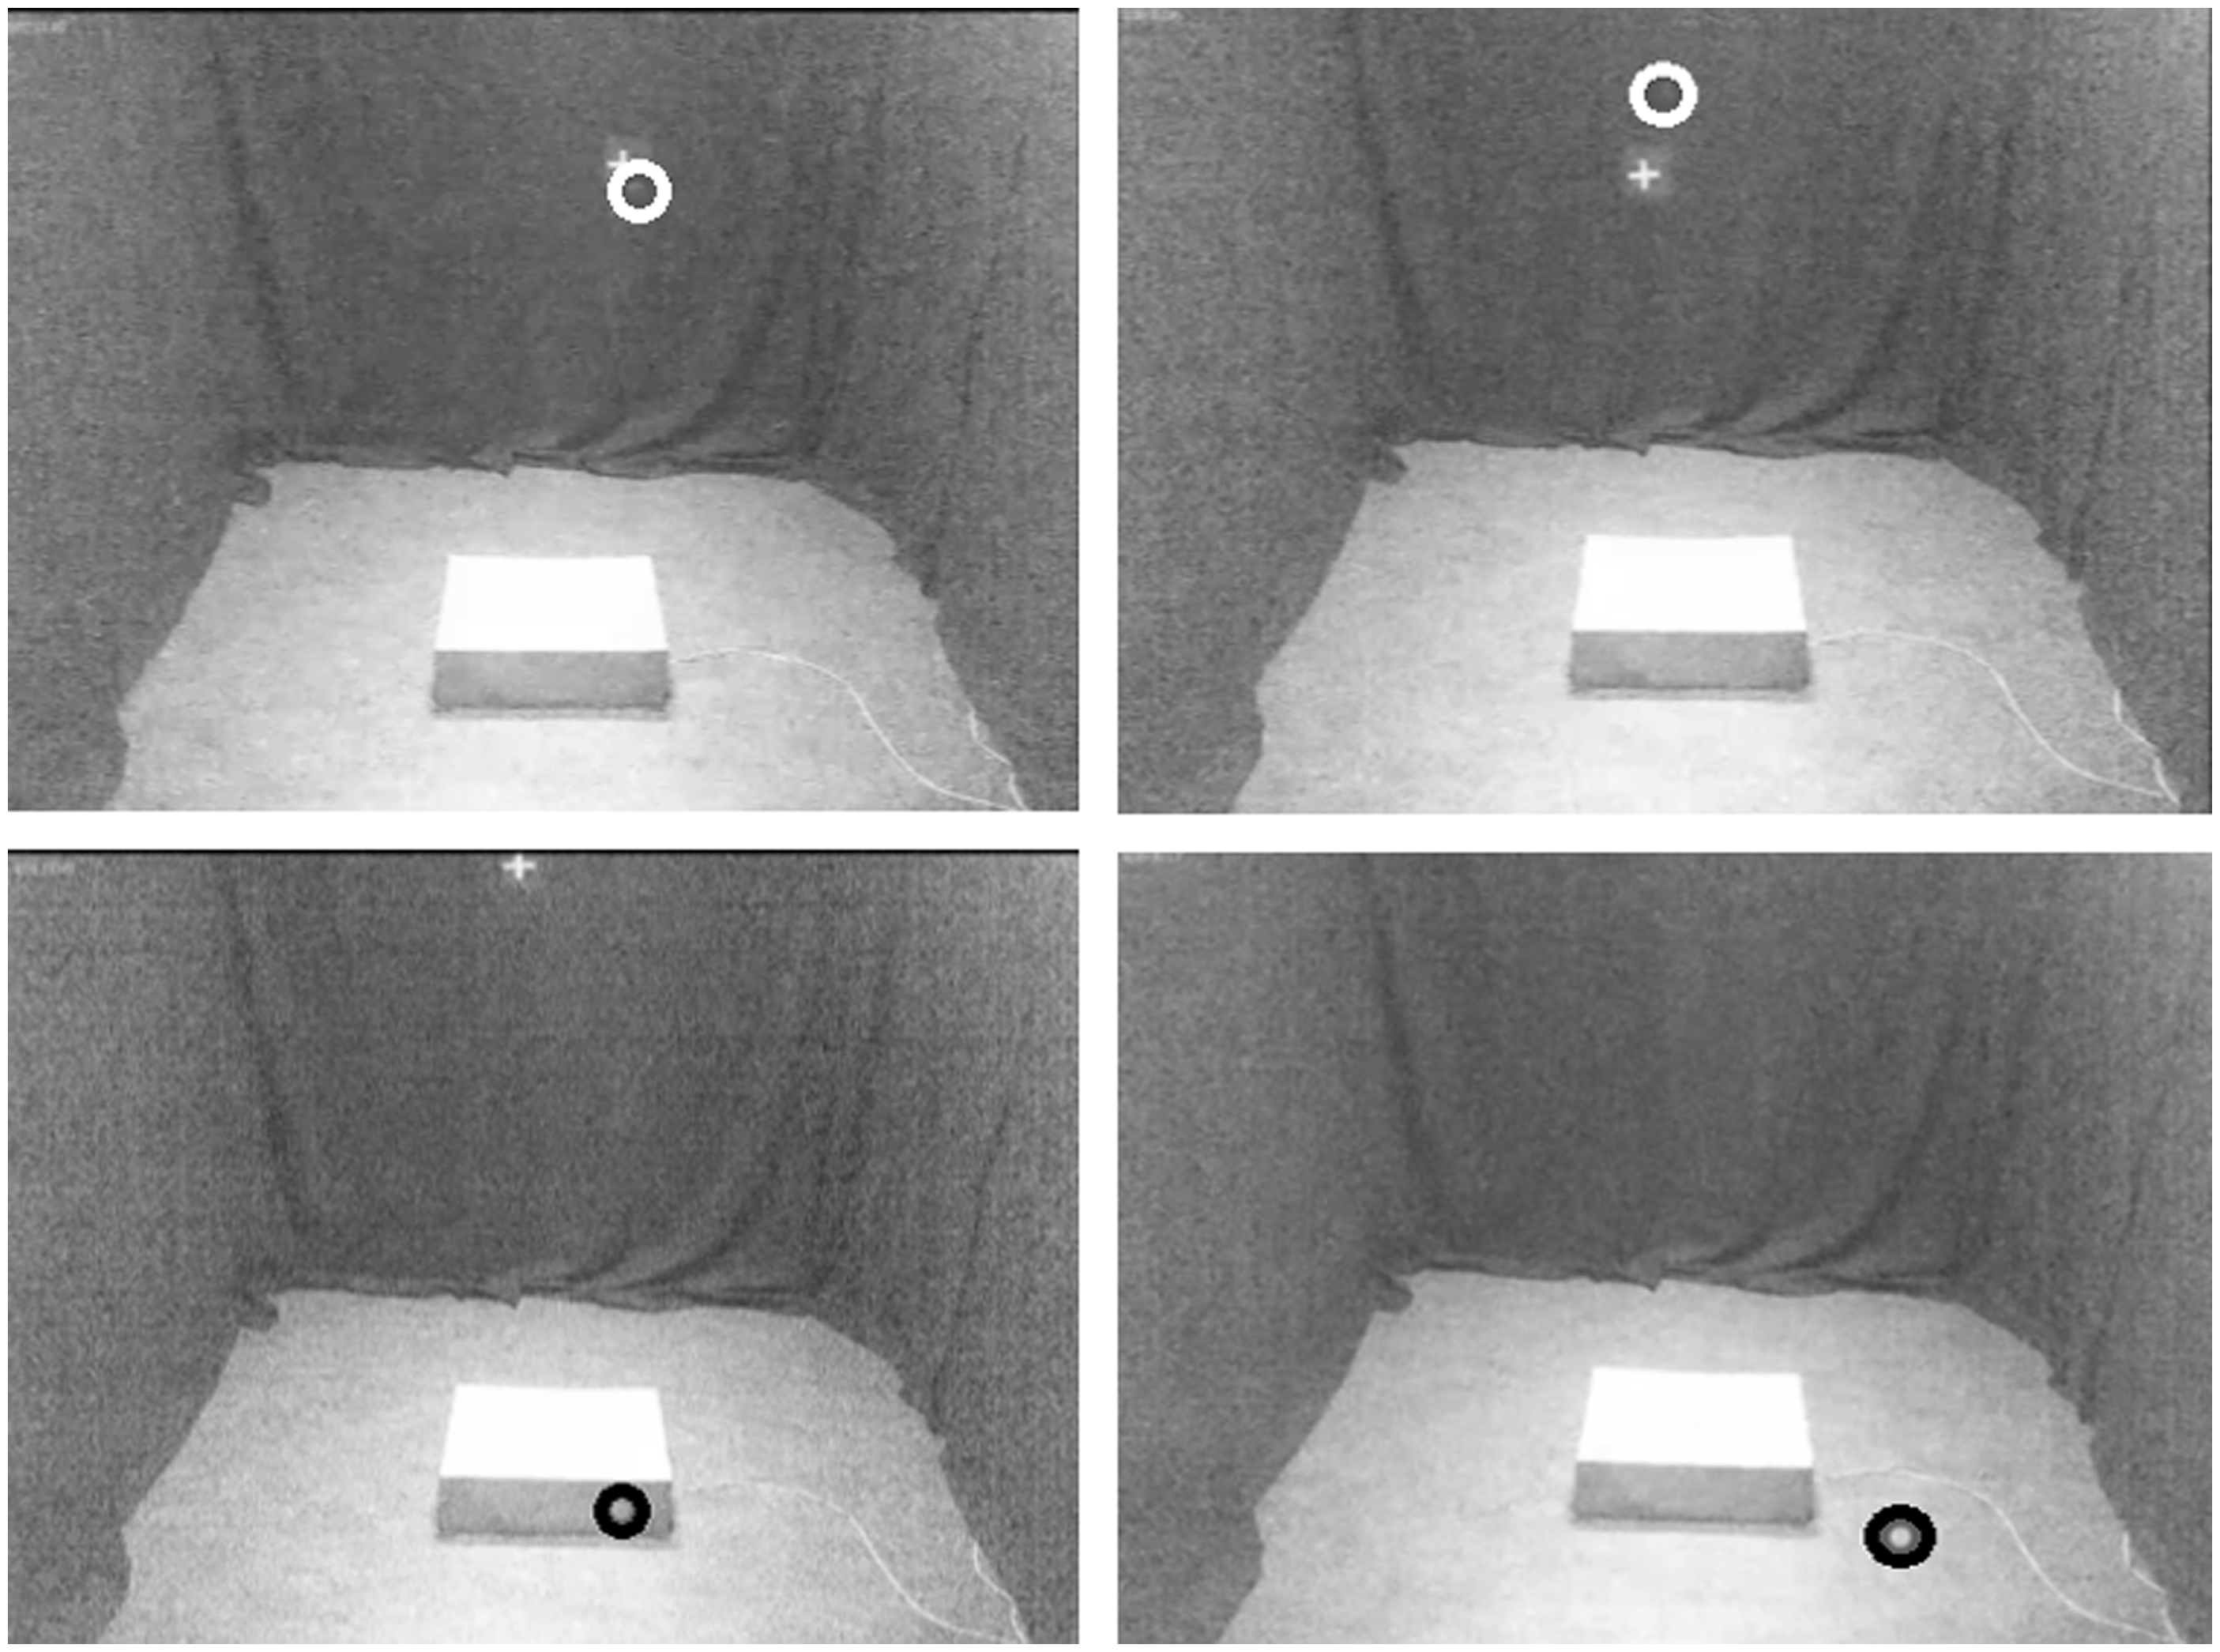
The AOI approach provides a fairly coarse level of analysis; for example, it does not discriminate between different parts of the AOI, which may be some distance apart, but it does discriminate between each side of the border between two AOI regions, which may be only a short distance apart. 21 It may also be the case that a participant looked downwards toward the obstacle but without foveal fixation quite reaching the target area, and the AOI approach would not reveal this. Any kind of glance downwards may have improved their ability to detect whether the obstacle was raised or not as eccentricity between the obstacle and fovea would have decreased therefore increasing sensitivity as measured by visual acuity and threshold contrast. 22 It is therefore important for the fixation target to not only try and prevent fixations at the obstacle and immediate area but also to prevent or reduce downward saccades that may increase detection ability. Hence, a second approach to analysis of the eye-tracking data was used, in which downward saccades are quantified as an indication of the amount of downward looking on each fixation target condition. This approach is similar to scan path analysis used in other research (e.g. Hu et al. 21 ).
3.3 Area of interest analysis
The eye-tracker produced a video for each participant for each condition of fixation target – four videos per participant and 40 videos in total. Each video was edited so that it began when the condition test began, and ended as soon as the test came to an end, with a frame rate of 10 frames per second. This matches the standard assumption for the minimum duration of a likely fixation (100 ms) to distinguish between fixations and saccades between fixations. 23 Each frame was coded to note in which of the two AOIs the gaze was located (Figure 2). If the gaze marker was not located on the video frame, it was classed as a missing frame (this could be due the observer looking somewhere off the scene captured by the forward-facing camera, or a loss of tracking). The mean total number of frames in each video was 2117. The mean proportion of missing frames was 6.0%.
Figure 3 shows the median proportion of frames that were classed as having the gaze marker in the obstacle area for each fixation target condition. Analysis of the distribution of AOI scores did not suggest that they were drawn from a normally distributed population. It illustrates that the amount of time spent looking down at the obstacle and its immediate area was very small, with the mean proportion of frames not extending beyond 0.9% for any of the conditions. The average duration of a fixation is 300 ms.
24
If participants were to look down and fixate the obstacle just once each time it rose, this would theoretically result in around 5400 ms looking time at the obstacle, or 54 frames of the eye-tracking video. Given an average video length of 2117 frames, this would represent around 2.6% of all frames in the video, which is much higher than the proportions found from the eye-tracking videos. Friedman’s ANOVA does not suggest differences between the four conditions to be statistically significant (p = 0.38).
Area of Interest (AOI) analysis: Median proportion of eye-tracking video frames in which gaze position was in obstacle area, by fixation target condition. Error bars show the interquartile range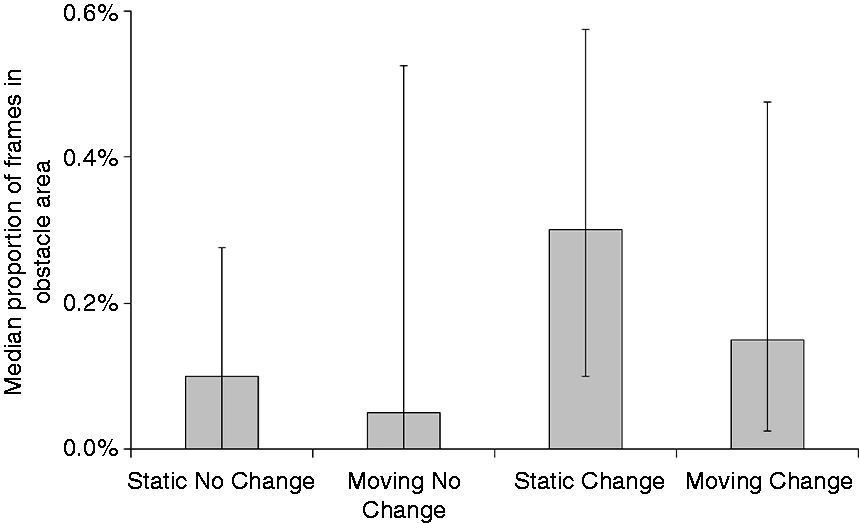
3.4 Saccade analysis
To assess how successfully the different fixation targets prevented downward saccades, the number of these saccades was counted. Software available with the eye-tracking glasses (BeGaze 3) provided data about saccades for each test, which included the start and end eye position in terms of x and y pixel coordinates relative to the top left corner of the eye-tracking video. A downward saccade was defined as any saccade whose end position was below its start position (i.e. the y coordinate was larger for the start position than for the end position). A threshold amplitude size of downward saccade is required to avoid including saccades that were not intended to move the eyes closer to the obstacle or that are unlikely to have improved potential obstacle detection significantly. It should also be noted that the moving fixation target is likely to produce more saccades in all directions compared with the static fixation target, as the eyes are moving around to follow the target. To avoid including saccades that were actually due to tracking the fixation target in the moving target conditions, a suitably large threshold is required. As it is not known what an appropriate threshold should be, a number of different thresholds have been examined. These thresholds are in the units of video pixels, as this is the unit used to quantify saccade sizes by the eye-tracking analysis software. Ten video pixels is equal to 0.43° visual angle. Threshold sizes of 200, 250, 300 and 400 pixels were used in the analysis (i.e. if a saccade had moved in a downwards direction equal to or more than one of these thresholds, it was included). These pixel thresholds equate to approximate visual angles of 8.6°, 10.8°, 12.9° and 17.2°. For reference, the visual angle from the obstacle to the fixation target when at the top, centre or bottom of its ellipse of possible positions is approximately 38°, 30° and 22°, respectively (exact visual angles for each participant may differ very slightly from these values depending on the participant’s height).
Figure 4 shows the median number of downward saccades equal to or greater than the four size thresholds, for each of the fixation target conditions. Analysis of the distribution of saccade data did not suggest they were drawn from a normally distributed population. Friedman’s ANOVA does not suggest the differences between conditions to be statistically significant (p > 0.57).
Saccade analysis: Median number of downward saccades in each fixation target, for four minimum pixel threshold sizes. Error bars show the interquartile range. Note that for the 400 pixel saccades, the medians were 0 for all four conditions; for SN, the IQR was zero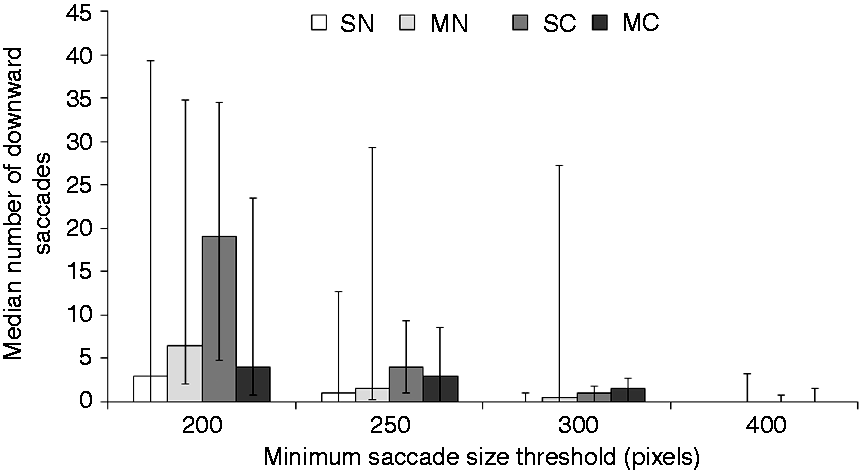
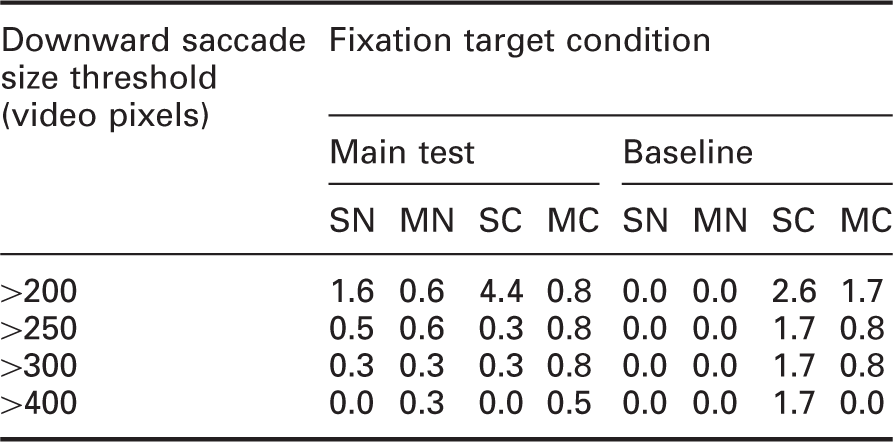
To better interpret the results from this saccade analysis, baseline saccade measurements were taken from 5 of the 10 participants for each condition. For these baseline measurements, participants wore the eye-tracker whilst being presented sequentially with the four conditions of fixation target, in the order of SN, MN, SC and MC. Each condition was displayed for 30 s before moving immediately on to the next condition without interruption. Participants were instructed to keep watching the target, and read out the number each time it changed (in the SC and MC conditions). However, as the important variation from the fixation targets used in the main test, participants were also told that the obstacle would not appear throughout this baseline test. There should therefore have been no reason for the participants to glance downwards during these baseline measurements and this would give a general indication of how many downward saccades may be made even without a peripheral detection task. The number of downward saccades was calculated for each of the conditions on this baseline test and compared with the results from the main test by converting each measure to the number of downward saccades per minute. It was necessary to standardise the measures in this way as the length of time participants were looking at the fixation target during the baseline test and main test was different.
Median number of downward saccades per minute by fixation target condition and saccade size threshold, for baseline measurement and main test.
3.5 Obstacle detection
Figure 5 shows the median rate of detection for the different obstacle heights under the four fixation target conditions. Analysis of the distribution of the obstacle detection probability rates did not suggest that they were drawn from a normally distributed population. These show the expected pattern of increased detection as the obstacle height increases. The increasing rates of detection were confirmed using Friedman’s test which suggested statistically significant differences between detection rates across the obstacle heights for all four conditions (p < 0.001 in all cases). There are no apparent differences in detection rates between the four conditions, and Friedman’s ANOVAs comparing detection rates between the four conditions on each of the six obstacle heights did not suggest any statistically significant differences, with p ≥ 0.20 in all cases.
Median detection rates for obstacles of varying size, under different fixation target conditions. Error bars show the interquartile range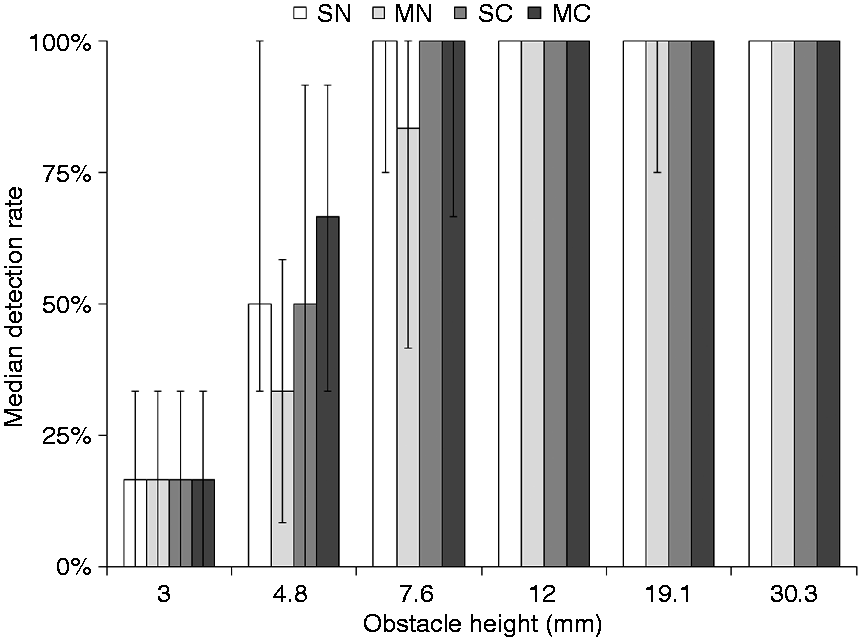
Figure 6 shows median reaction times to detection for each fixation target condition for the six obstacle heights. There is a general pattern of decreasing reaction times as the obstacle size increases, indicating increasing ease of detection. This trend was confirmed by Friedman’s ANOVAs comparing reaction times across the obstacle heights for each of the conditions (p < 0.01 in all conditions). Comparing reaction times between each condition suggests that there may be differences, with the MC condition standing out as having the largest reaction times across all obstacle heights. However, Friedman’s test suggested differences between the four fixation conditions to be statistically significant (p = 0.025) with the 19.1 mm obstacle, but did not suggest it to be statistically significant (p > 0.18) for the other five obstacle heights. In all six obstacle height conditions, the MC task has a greater median reaction time than did the SN task. In the MC task, the fixation mark was not in a static position and changed from a cross to a digit at random intervals: in the SN task, the fixation mark was static and did not change. This suggests that the MC task was more cognitively demanding and led to a slower response to detection of the peripheral obstacle.
27
Median reaction times to detect obstacle heights of varying size, by fixation target condition. Error bars show the interquartile range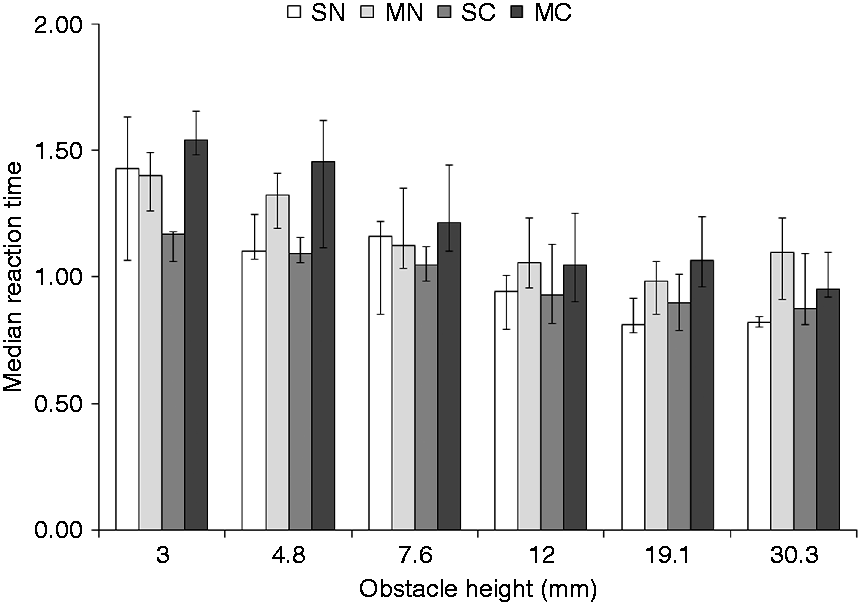
It might be the case that reaction times are shorter in those instances when test participants were (incorrectly) looking directly at the peripheral target than when fixating upon the fixation mark as instructed. Lingard and Rea 10 examined detection at four peripheral locations from 12° to 29° and concluded that off-axis reaction time increased only at the outermost location. He et al. 9 examined detection at on-axis and off-axis (15°) locations: a comparison of the reaction times for these locations (determined from their Figures 2 and 3) did not suggest a difference in reaction times.
If observers were tending to fixate less well in some conditions (e.g. SN) than in others (e.g. MC) and instead look towards the peripheral obstacle, then the detection rate would have been higher (and similarly a shorter reaction time) for SN compared with MC. Thus, the obstacle detection data offer the potential of supplementary data to support that of the eye tracking data, a converging operations approach. It can be seen that the eye tracking and obstacle detection data do agree in that neither suggests differences between the four modes of fixation task to be statistically significant.
4. Conclusion
This work examined the degree to which test participants maintain foveal fixation on a target during experiments measuring peripheral detection. In the AOI analysis, in less than 0.9% of frames was fixation directed towards the peripheral target, which suggests a tendency to follow the test instruction of looking at the fixation mark rather than the peripheral target. The fixation task was introduced to promote fixation, and provide a measure of the degree to which fixation was maintained. In 98% of cases, the fixation digit was correctly identified, which suggests that it was being fixated.
In the current experiment, the data suggest that test participants maintained a high degree of foveal fixation on the fixation mark, an assumption that has not been investigated in past studies of peripheral detection. While extension of this conclusion to other experiments depends in part on the cooperation of test participants, it provides some confidence that in studies of peripheral detection where test participants are instructed to look at a fixation mark, the test does measure peripheral detection. Without the current work, there is no basis on which to place such confidence: If an experimenter wants to be certain that an observer is maintaining fixation towards a specific point, there is no alternative other than to monitor the observer's fixation, but that has not been done in past work.
Neither the eye tracking data nor the obstacle detection results suggest a statistically significant difference between trials with the static, non-changing fixation mark, the conventional approach, and the dynamic fixation marker examined in this study. Thus, in the current situation, there was little benefit in introducing the dynamic fixation task. In the current experiment, the peripheral environment was neutral, uniform and devoid of distraction, as was the case in previous work.7–9 The dynamic task may prove to have greater benefit in maintaining fixation when observers are faced with more interesting events in the visual periphery.
Footnotes
Funding
This work was carried out with support from EPSRC (EP/H050817) as part of the MERLIN project and the EPSRC-funded E-Futures Doctoral Training Centre for Interdisciplinary Energy Research, University of Sheffield.
Acknowledgements
The eye tracking apparatus used in this work was borrowed from Megan Freeth, Department of Psychology, University of Sheffield.