



Abstract
A recent study examined how luminance and spectral power distribution affect recognition of facial expression, a proxy for pedestrians' judgements concerning the apparent intent of other people. This paper describes a repeat study which included a greater number of test luminances, a third type of lamp, and an additional, shorter duration of observation (500 ms). Luminance and distance had significant effects on expression recognition; the effect of lamp was not significant and the effect of duration was suggested to be significant only within the escarpment region of the performance versus luminance relationship. The results were used to estimate appropriate light levels for outdoor lighting. A luminance of 1.0 cd/m2 permits facial expressions to be identified with a 50% probability of correct identification at a distance of 15 m.
1. Introduction
A recent paper 1 reported an experiment that was carried out to investigate how variations in luminance and spectral power distribution (SPD) affect the ability to evaluate the emotion conveyed by facial expressions, a proxy for judgements of the intent of other people which is considered to be a critical task for pedestrians. This paper reports a second experiment carried out with additional test luminances and SPDs to better characterise the relationship between performance and lighting.
Lighting in residential roads is intended to enhance the safety and perceived safety of pedestrians, with one aim being to assist recognition whether another person is likely to be friendly, indifferent or aggressive in time to make an appropriate response. 2 Past studies tended to target facial recognition rather than judgements of intent. Lin and Fotios 3 examined the methods used in these studies and suggested that an effect of SPD on facial recognition is expected when the task is difficult; for example, when the duration of observation is brief and/or the target is small. While this task difficulty proposal remains to be validated, supporting evidence is available from two studies. First, colour photographs have been found to provide significantly better recognition of celebrities than grey scale versions when facial information is made less visible by blurring, an effect not found when using non-blurred targets. 4 Second, investigation of visual acuity at photopic levels of adaptation demonstrates that lamp SPD can affect foveal acuity when the task is small and test participants are encouraged to guess the smaller sizes not otherwise clearly visible to ensure they attempt the difficult targets. 5
There is evidence that facial expression and body posture contribute to social judgements that are related to evaluation of threat.6–8 Willis et al. 8 found that faces exhibiting angry expressions were less approachable than those with happy expressions, and similarly so for emotions conveyed by body posture. Approachability was defined as the willingness to approach a stranger in a crowded street to ask for directions, which might be considered the polar opposite of a judgement of threat intent and the resulting motivation to avoid.
Fotios et al.,
1
therefore, carried out an experiment to investigate how lighting affects a pedestrian's perceptions of another person's emotional state determined from facial expression, body posture, and observation of gaze direction, extending investigation of the relationship between lighting and interpersonal judgements beyond consideration of facial recognition. The results (Figure 1) suggested that task performance was affected by luminance and interpersonal distance, with targets of higher luminance and larger visual size (i.e. shorter distances) tending to lead to a higher frequency of correct identification.
Results of facial expression identification from Fotios et al.
1
In these data, a frequency of 4 represents the probability of giving the correct response by chance, and a frequency of 24 is the maximum score.
Target size was varied to represent distances of 4, 10 and 15 m. For trials at 4 m, Figure 1 indicates a plateau–escarpment relationship between performance and luminance, with data at the higher luminance approaching the maximum expected performance of 81.3%. 9 At 10 m and 15 m, the plateau is still approached. This relationship offers an approach to estimating appropriate light levels. For example, for recognition at 4 m the transition to plateau occurs in the range 0.1–1.0 cd/m2: higher luminances would produce negligible further benefit but a lower luminance would lead to a rapid decline in performance. However, with only three levels of luminance, this relationship is not well defined.
Lamp type (SPD) did not affect recognition of facial expression. In trials involving recognition of body posture and gaze direction, however, there was a significant effect of SPD in those conditions lying in an apparent escarpment region, near the middle of the range of luminance and distance combinations.
This paper reports a second experiment carried out to further investigate how lighting might influence judgements of emotions conveyed by facial expressions, with the conditions used in previous work
1
being extended. These changes were:
The number of test luminances was increased from three to six to better define the relationship between luminance and performance. A third type of lamp (SPD) was included. An observation duration of 500 ms was used in addition to the 1000 ms duration of the previous work, this better representing pedestrian behaviour.
10
It was anticipated that this shorter duration would make the task more difficult and thus more likely to reveal an effect of SPD.
2. Method
2.1. Apparatus
The apparatus and procedure employed in this experiment were as used in the first study.
1
Target images were photographs of actors expressing a range of facial expressions. These were obtained with permission from the FACES database, a set of images of naturalistic faces of younger, middle-aged and older women and men, displaying each of six facial expressions described as anger, disgust, fear, happiness, neutrality and sadness.
9
Twenty-four images were used, these being six expressions from each of four target people: a young male, a young female, an old male and an old female. Figure 2 shows the examples of these images.
Sample of facial expressions from the FACES database.
9
These are of a younger female with expressions (from left to right) of angry, disgust, fear, happy, neutral and sadness. Website for image database: http://faces.mpdl.mpg.de/faces/
Target images were presented on a non-self-luminous screen (Pixel Qi® PQ3Qi-01, 10.1-inch display) having a resolution of 1024 × 600 pixels. Self-luminous screens are those that require an internal light source (back light) to present screen images, and thus emit light to their surroundings: non-self-luminous screens do not have an internal light source and instead require ambient light for display images to be seen. The non-self-luminous status was used to avoid the confound of screen-generated light combining with the test light conditions. While the facial expression photographs provided by the databases are in colour, at the low light levels of the current study, the target images showed very little colour. The difference between achromatic and coloured target images is being explored in parallel work.
The screen was located inside a test booth (Figure 3) permitting changes in luminance (by adjustment of an iris) and SPD (by changing lamp type) with negligible changes in spatial distribution. The screen was placed on the floor of the booth and lit from overhead: it was observed from a distance of 0.65 m which was maintained using a chin rest with forehead restraint.
Section through the apparatus used to observe target faces/bodies under different light settings.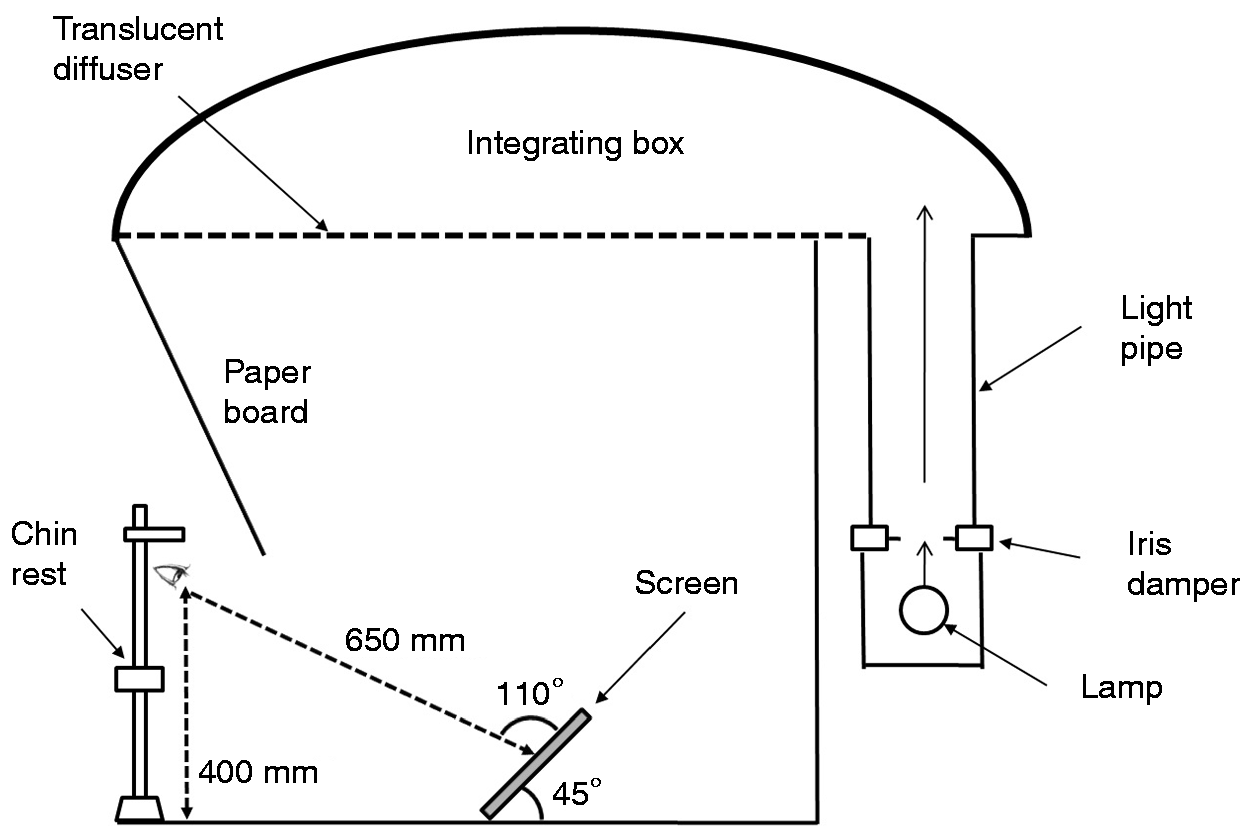
2.2 Test variables
Eighteen lighting conditions were used. There were three types of lamps: High-pressure sodium (HPS: 2000K, S/P = 0.57, Ra = 25) and two types of metal halide (MH: 4200K, S/P = 1.77, Ra = 92, and CPO: 2868K, S/P = 1.22, Ra = 70). Six light levels were used: Screen luminances of 0.01 cd/m2, 0.03 cd/m2, 0.10 cd/m2, 0.33 cd/m2, 1.00 cd/m2 and 3.33 cd/m2, as measured using a Konica-Minolta LS100 luminance meter. Note, however, that for the MH lamp, limitation of the apparatus meant that the highest luminance used was 2.50 cd/m2 rather than 3.33 cd/m2. This range of luminances represented illuminances of approximately 0.2 lux, 0.6 lux, 2.0 lux, 6.0 lux, 20 lux and 60 lux at the surface of the screen, covering the range of light levels expected in residential streets in the UK, and with a range of greater than two log-units giving reasonable expectation of detecting an effect of light level. Luminance of the floor to the immediate side of the screen was higher than that of the screen, and luminance of the rear wall visible immediately above the screen was lower, giving luminance ratios (surface/screen) of approximately 1.5 and 0.65, respectively.
The sizes of target images were manipulated to represent two observation distances, 4 m and 15 m. The shorter distance was included as it is a foundation of current standards, 11 the longer distance because this is a better estimate of the distance at which pedestrians desire to look at other people in a natural outdoor setting.10,12 These two distances were used in previous work, 1 a comparison hence enabling a measure of repeatability, and according to these past results should present a range of performance from equal-to-chance level to a plateau of maximum performance. At the 0.65 m viewing distance the targets sized to present equivalent distances of 4 m and 15 m subtended visual angles of 172 min and 46 min, respectively.
While the past studies of facial recognition tend to prescribe continuous fixation on the target, evidence from eye tracking suggests this is unrealistic with fixations on other people showing unfamiliar behaviour being typically approximately 500 ms. 10 In the current experiment, two observation durations were included, 500 ms and 1000 ms, the latter being included to enable comparison with results from the first study.
2.3 Procedure
Each test session started with 20 minutes for adaptation to the low light level. A series of practice trials were used to present and confirm understanding of the response options. Initially, the available options (e.g. six different facial expressions) were shown simultaneously to illustrate all possible options. Twenty-four example face targets (the six expressions for four actors not used as targets in trials) were shown in random order under office lighting conditions and without time limit to allow these expressions to be learned.
The responses sought were judgements of emotions conveyed through facial expression (anger, disgust, fear, happiness, neutrality or sadness). Each target was presented for one of two durations (500 ms and 1000 ms) with no time limit for input of the subsequent response. Responses were given using a button box, with one button for each of the six available responses.
Experiments using the three different lamps were carried out in separate blocks, and lamp order was balanced. For a given lamp, the six luminances were carried out as separate blocks, with luminance order being balanced. For a given combination of lamp type and luminance, the target images (faces of different expression, size, and duration) were presented in a random order.
This was a repeated measures design and each participant carried out 1728 trials, this being every combination of lamp (three), luminance (six), duration (two) and distance (two) for the 24 target images. To reduce target fatigue, the experiment also included three blocks of trials with body posture targets, one block per lamp type, but these data were not analysed.
Twenty test participants were recruited from staff and students of the University of Sheffield, and other residents of Sheffield. They were paid a small fee for their contribution. The sample included 11 males and nine females and their ages ranged from 18 to 50 years with an approximate mean age of 27 years. All test participants had normal or corrected-to-normal visual acuity as tested using a Landolt-ring test, and all had normal colour vision according to their performance on the Ishihara test carried out under a daylight-simulating source.
3. Results
For each trial, data were recorded as ‘1’ for correct identification or ‘0’ for incorrect identification. For each combination of luminance and size and lamp there were 24 facial expression targets, and for each test participant their score was the number of correct identifications from these 24 targets, hence leading to a distribution of 20 scores (across the 20 test participants) from which statistical measures were derived. The results are shown in Figure 4 and Table 1. These are the median frequencies and interquartile ranges for correctly identifying emotion from facial expression. The six facial expressions per target lead to a 1/6 probability of correctly identifying the expressed emotion by chance, a frequency of 4 in Figure 4.
Median frequencies for correct identification of emotion from facial expression. The legends show lamp type (HPS, MH or CPO lamp), simulated target distance and duration of presentation. *For MH lamp, the highest luminance used was 2.50 cd/m2 rather than 3.33 cd/m2 due to a limitation of the apparatus. Median frequency (and interquartile range: 25th to 75th percentile) of correct identification of emotion conveyed by facial expression Note: for these data, maximum frequency is 24; chance frequency is 4. Note: for MH lamp, the maximum luminance used was 2.50 cd/m2 rather than 3.33 cd/m2 due to a limitation of the apparatus.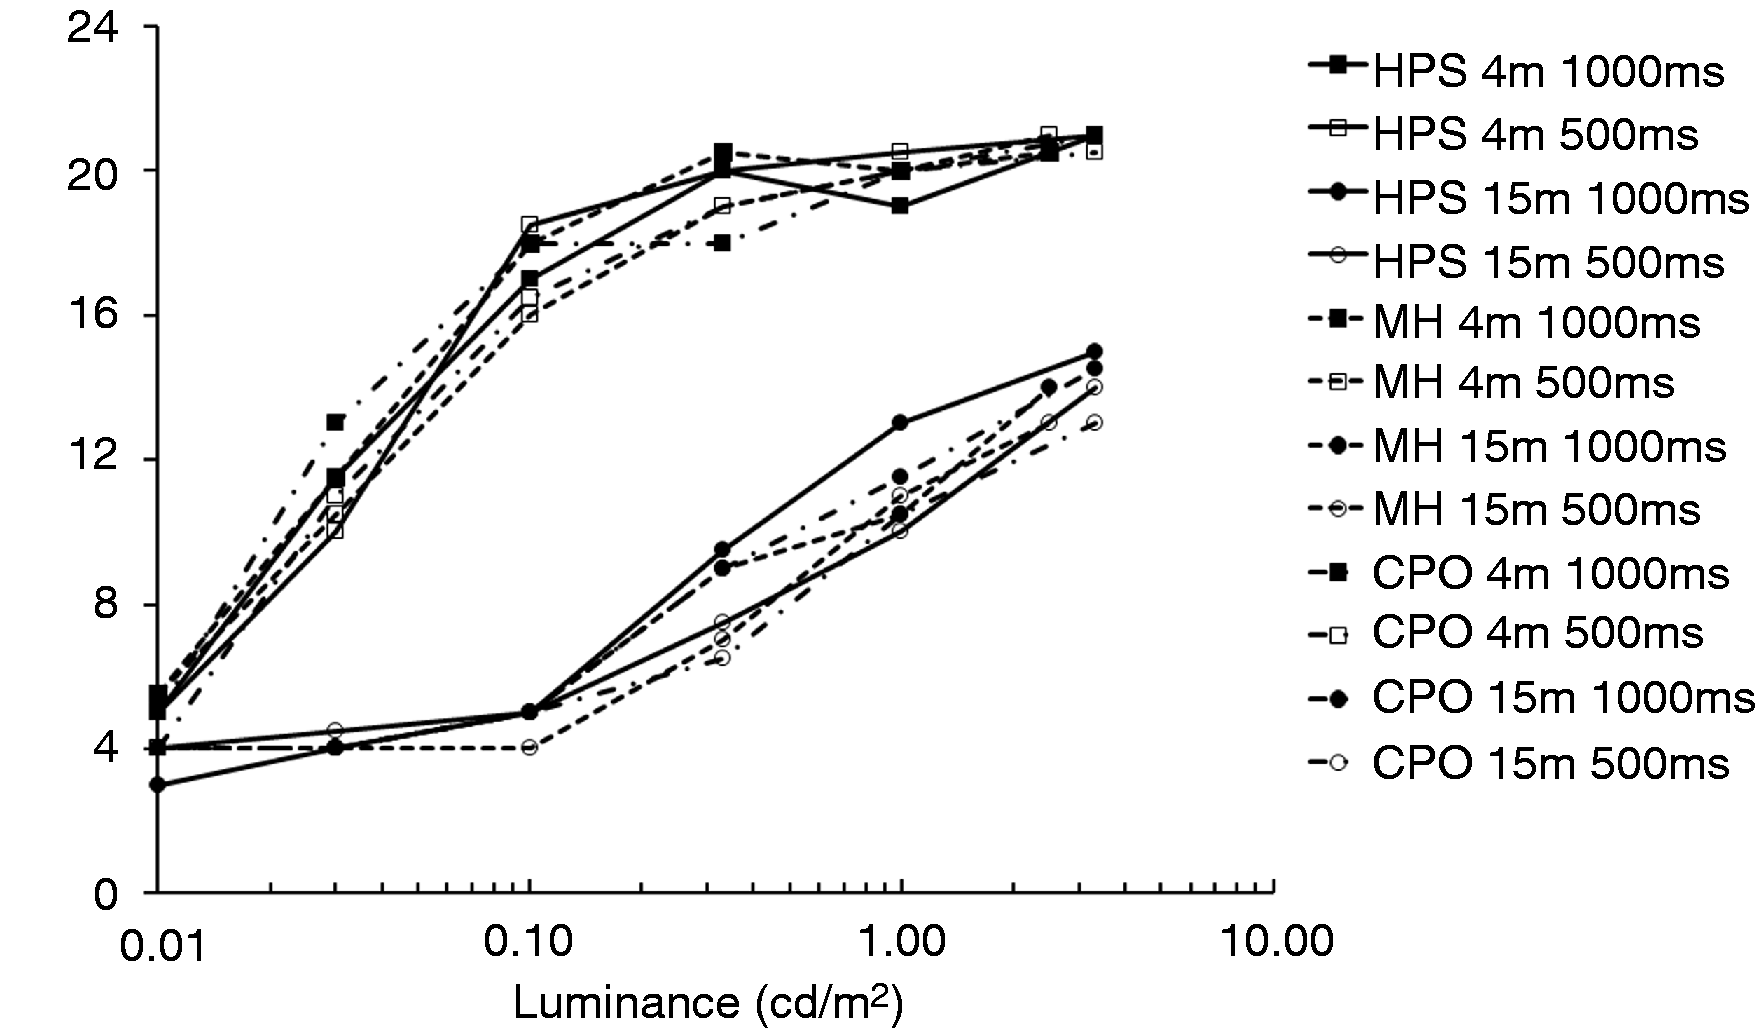

As luminance increases, there is an apparent increase in the probability of correctly identifying emotions conveyed by facial expression. Little effect of observation duration can be seen when the frequencies of correct identification were higher than 16 or lower than 8. However, in the range of 8–16, the frequencies of correct identification with longer duration (1000 ms) were slightly higher than trials with the shorter duration (500 ms). Shorter interpersonal distances increased the probability of correctly identifying emotions conveyed by facial expression, which may be due to the larger visual size subtended. There appears to be little difference in task performance between the HPS, MH and CPO lamps.
Figure 4 suggests a plateau–escarpment relationship between light level and correct judgement such as characterises visual performance. 13 At higher target luminances, performance reaches a plateau above which increasing luminance gives diminishing returns in terms of increased probability of correct identification. At low target luminance, performance is at chance level and further reductions in luminance do not reduce performance. In the intermediate range, the escarpment, a change in light level can affect performance more appreciably.
At luminances in the range 0.01–0.10 cd/m2, facial expression recognition at 15 m was no better than chance level. At 4 m, for luminances of 0.33 cd/m2 or above, frequencies of correct identification of facial expression reached a plateau of approximately 20 (83.3%), similar to that found when the FACES database was validated under good lighting conditions with unlimited exposure durations (81.3%). 9
4. Analysis
Four variables are examined: Luminance, lamp type, equivalent distance and duration of observation. Determination as to whether these data (the frequency distributions) were drawn from a normally distributed population was carried out using a range of metrics (including skewness, kurtosis, Kolmogorov–Smirnov test and Shapiro–Wilks test). The results were not conclusive. Statistical analyses were therefore carried out using non-parametric tests. For confirmation, these analyses were subsequently repeated using parametric tests and these led to the same conclusions being drawn.
Analyses of these data required multiple application of the statistical tests, and thus to reduce the risk of capitalising on chance (a type I error) the results were interpreted with reference to a threshold of p ≤ 0.01 (rather than the standard p ≤ 0.05) and with observation of the overall pattern rather than the result of any one single test.
The effect of target size (simulated distance) is suggested by the Friedman test to be significant (p < 0.001) with the target's larger size leading to a greater frequency of correct recognition. Application of the Wilcoxon test to compare results for the 4 m and 15 m distances in each of the 36 test conditions (six luminance levels, three lamps, two durations) suggests that the differences are significant (p < 0.001), except for five cases, these results being at chance level at the lowest light level of 0.01 cd/m2.
The Friedman test does not suggest that lamp type has a significant effect on categorical judgement of facial expression for any luminance or target size with any duration of observation (p > 0.20 for all 24 combinations of duration, luminance and distance).
Since the effect of lamp type was not significant, subsequent analyses were carried out using the mean result across lamp type for each participant for each combination of duration, distance and luminance.
The Wilcoxon test suggests a significant effect of duration (p < 0.01) in four of the 12 conditions, these being for luminances of 3.33 cd/m2 and1.00 cd/m2 at 15 m, and for luminances of 0.33 cd/m2 and 0.03 cd/m2 at 4 m, with performance at 1000 ms being higher than at 500 ms. Three of these cases lie in the escarpment region of the performance curve.
Results of Wilcoxon tests on the effect of luminance for adjacent pairs

When the five adjacent pairs of six luminances are considered separately using the Wilcoxon test, significant differences (p < 0.01) were found for 13 cases. For seven cases, the differences were not suggested to be significant (the shaded cells in Table 2). These cases are those whose frequencies of correct identification are on the plateau rather than the escarpment of the performance curve, i.e. when task difficulty is either at a maximum and where extra luminance does not lead to better performance, or at a minimum where judgements are at chance level.
5. Discussion
5.1. Repeated trials
One aim of this work was to validate by repetition the results of a previous study.
1
The conditions common to both experiments are a duration of 1000 ms, distances of 4 m and 15 m, the MH and HPS lamps, and luminances of 0.01 cd/m2, 0.10 cd/m2 and 1.0 cd/m2. The samples compared are the 20 participants in the current study, who were aged less than 50 years, and the 15 participants from younger group (aged less than 45 years old) in the previous work. Figure 5 shows these data, with correct expression recognition frequencies being averaged across lamp type. For trials at 15 m, results of the two studies coincide: for trials at 4 m, the current experiment found slightly higher performance than did the previous experiment. The Mann–Whitney test for independent samples was used to compare results from the two studies for each combination of distance, luminance and lamp type. This did not suggest any difference between the two studies to be significant in 10 cases (p > 0.12) but for two cases (HPS, 0.01 cd/m2, 15 m and MH, 0.10 cd/m2, 4 m) the difference was close to significance (p = 0.08 and p = 0.06, respectively). It was therefore concluded that, for similar test conditions, the original and repeat experiments led to similar results.
Median frequencies of correct identification of facial expression with duration of 1000 ms from young group plotted against luminance. These data are for observers aged <50 years with a presentation duration of 1000 ms, averaged across lamp type, for the current study and from previous work.
1
Error bars show the interquartile range. Note that for clarity the data points for the first study have been translated slightly to luminances of 0.0105 cd/m2, 0.105 cd/m2 and 1.05 cd/m2 rather than 0.01 cd/m2, 0.10 cd/m2 and 1.0 cd/m2.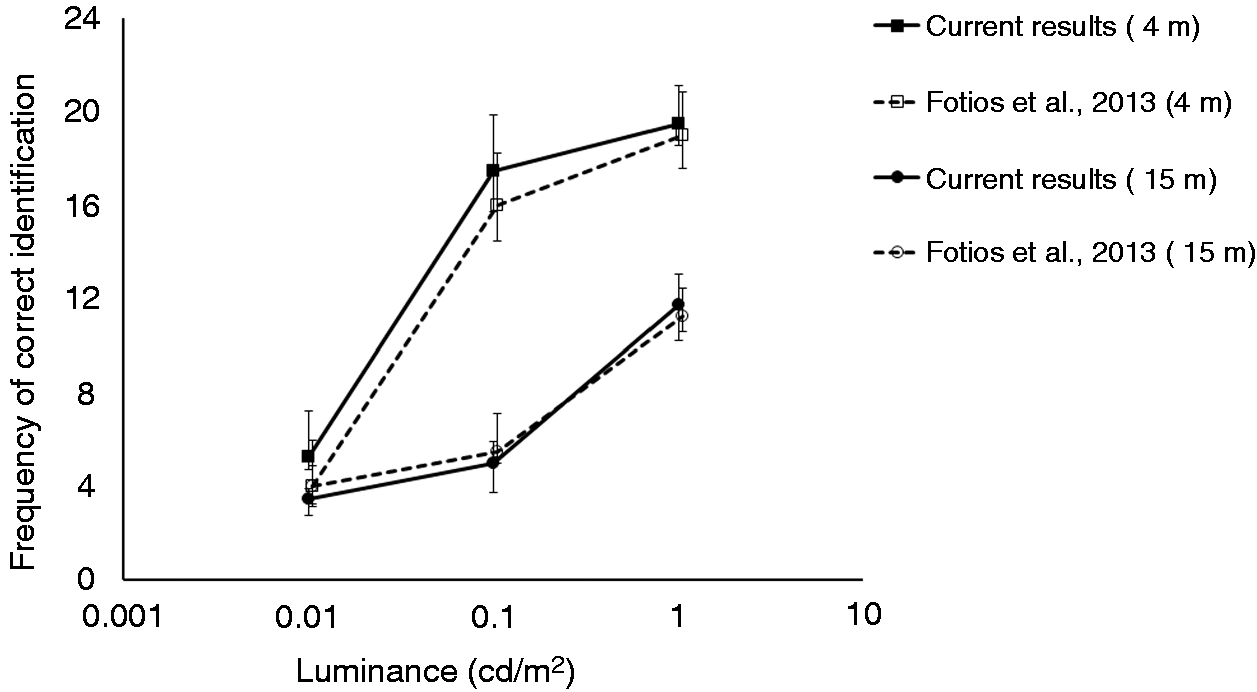
5.2. Optimum luminance
These results demonstrate that the ability to recognise emotions conveyed by facial expression is affected by luminance and target size: Higher luminances and shorter distances (i.e. subtending a larger visual size) tend to increase the frequency of correct judgements. The three additional luminances used in the current study better define the relationship between luminance and performance than did the first study. 1 In particular, the plateau–escarpment relationship is exhibited more clearly: with a diminishing increase in performance after a certain high luminance and/or short distance is reached, and reducing to chance performance at low levels of luminance and/or large distances.
An effect of duration was found in judgements of facial expression for those conditions lying on the apparent escarpment, but not in the plateau regions. No effect of lamp type was found for any condition.
According to the escarpment–plateau relationship, the knee in the curves provides one estimate of an appropriate light level. Figure 4 indicates an optimum luminance of 0.33 cd/m2 for recognition at 4 m. The first study suggested a minimum luminance in the range 0.1–1.0 cd/m2 if facial expressions were to be identified accurately at 4 m: the conclusion interpreted from the current data is within that range.
The data for 15 m do not appear to have yet reached a plateau, with the apparent trend being that luminances greater than 3.33 cd/m2 would bring further increase in recognition ability. However, it is not known whether the plateau of maximum performance would be at the same frequency of correct response as for the 4 m task since the 15 m targets subtend a smaller visual size than at the observer's eye than do the 4 m targets; this may result in a plateau of maximum performance at a lower level of performance.
Linear extrapolation was carried out for the 15 m data by extending the trend exhibited by luminances from 0.1 cd/m2 to 3.3 cd/m2 and for results averaged across lamp type and duration. The frequency plateau for the 4 m distance (81%) is reached at a luminance of 44 cd/m2, while a lower frequency of correct response (f = 16: 66%) is reached at a luminance of 7.5 cd/m2. Further tests at a higher luminance would be required to confirm these estimates.
An alternative approach to identifying the optimum luminance is to set the probability of correct recognition expected and interpolate the luminance required to provide this for a given task. For a 50% probability of correct identification, the current data suggest luminances of approximately 0.03 cd/m2 at 4 m, and 1.0 cd/m2 at 15 m. Further research is required to establish what the correct probability of recognition should be and whether this changes with distance.
5.3. Individual expressions
Proportion of correct identifications of unique facial expressions as reported by Ebner et al. 9 and as found in the current study

The expressions are listed in descending order as defined by the results of Ebner et al. 9
Under good visual conditions, Table 3 suggests differences in the ability to recognise different facial expressions. Figure 6 shows the experimental results of Figure 4 broken down by facial expression, with these data being averaged across lamp type and duration. Past studies1,3 have suggested that an effect of SPD is more likely to occur when the task is difficult, identified here as conditions falling in the escarpment region of Figure 6. The effect of SPD and duration were investigated at two such conditions: (i) the fear expression at 1.0 cd/m2, 15 m and (ii) the happy expression at 0.33 cd/m2, 15 m. For control a third case was also examined, (iii) the happy expression at 0.33 cd/m2, 4 m, this being an apparently easy condition where an effect of SPD and duration would not be expected.
Median frequencies for correct identification of emotion from facial expression for the six expressions at the two test distances (as identified in the legend). These data are averaged across presentation duration and lamp type. *For convenience, data for the for MH lamp at 2.50 cd/m2 are merged with data for the CPO and HPS lamps at 3.33 cd/m2.
Within each of these three cases there were six conditions, these being the six combinations of the three lamp types and the two durations. The Friedman test did not suggest differences between these conditions to be significant for cases (ii) and (iii), but was close to significance for case (i) (p = 0.08). The Wilcoxon Signed Ranks test was used to examine individual pairs within cases (i) and (ii): This did not suggest the effect of SPD to be significant, but did suggest the effect of duration to be significant in two situations (fear, 1.0 cd/m2, 15 m, p < 0.01; happy, 0.33 cd/m2, 15 m, p < 0.05) with a lower frequency of correct expression recognition at the shorter duration (500 ms).
5.4 Further work
This work is reported to better understand the relationship between lighting and expression recognition through understanding of how performances changes with variation in parameters of lighting and the task. The optimum luminances described should not be taken as recommendations. Before doing so, better understanding is needed of further parameters including glare, luminance uniformity, three-dimensional targets rather than images, and the influence of target contrast and colour.
Six facial expressions were used in this work, of which one might be considered a positive emotion (happy), one ambivalent (neutral) and four to be negative (angry, disgust, fear and sad). Further experimental work might consider whether it is appropriate to use all six expressions, or whether it might be interesting to pick the most salient for interpersonal evaluations (e.g. fear) or to balance the number of positive and negative emotions presented during trials.
6. Conclusion
This paper reported an experiment carried out to investigate the influences of luminance, SPD, duration and distance on recognition of facial expression.
For those conditions common to both experiments, the results matched those found in previous work, suggesting the results to be repeatable.
It was found that both luminance and distance (visual size of target) had a significant effect on the ability to recognise facial expressions: The difference between observation durations of 500 ms and 1000 ms was significant in the middle of the range of conditions between chance level and the plateau of maximum performance; SPD did not have a significant effect.
Optimum luminances were interpolated from these data to explore how this might be done pending investigation of other influences such as target colour and glare. For a 50% probability of correct identification, the current data suggest luminances of approximately 0.03 cd/m2 at 4 m, and 1.0 cd/m2 at 15 m.
Footnotes
Acknowledgements
Images used in these trials were taken, with permission, from the FACES database developed by the Max Planck Institute for Human Development.
Funding
This work was carried out through funding received from the Engineering and Physical Sciences Research Council (EPSRC) grant number EP/H050817.