
Abstract
Light sources are available in a variety of spectral power distributions (SPDs) and this affects spatial brightness in a manner not predicted by quantities such as illuminance. Tuning light source SPD to better match the sensitivity of visual perception may allow the same spatial brightness but at lower illuminance with potential reductions in energy consumption. Consideration of experimental design was used to review 70 studies of spatial brightness. Of these, the 19 studies considered to provide credible evidence of SPD effects were used to explore metrics for predicting the effect of SPD but did not provide conclusive evidence of a suitable metric, in part because of incomplete reporting of SPD characteristics. For future work, these data provide an independent database for validating proposed metrics.
1. Introduction
The lighting designer can manipulate four variables of lighting: the spatial distribution of light, the temporal distribution of light, the quantity of light and the spectral power distribution (SPD) of the light. Different types of light source are available with a wide variety of SPD, these giving variations in the colour appearance of the light and the colour rendition of illuminated surfaces, alongside differences in luminous efficacy and cost. Many past studies 1 – 66 have investigated how SPD affects the brightness of an illuminated space, or, spatial brightness. These studies have tended to find that SPD does affect spatial brightness and that this is not accurately predicted by measures derived from V(λ), the CIE Standard Photopic Observer, such as illuminance and luminance.
Consider, for example, a finding repeated across several studies where one of two separate scenes lit by sources of equal illumination but different SPD is considered significantly brighter than the other. If this is a persistent and significant effect, there are two implications. First, it would show that a photometric measure of ‘how much light?’ based solely on V(λ) is not appropriate to characterise the brightness of a space under different types of light source. Second, for the lighting designer, lamp choice offers the opportunity to increase the brightness of a space and/or to reduce the energy consumed by the lighting. 67 Knowledge of the spectral response of human vision is of practical significance because light sources developed for commercial use are usually developed to meet human visual needs: if photometry built solely on V(λ) fails to faithfully characterise the brightness response to lit spaces, then light sources optimised for high luminous efficacy consistent with V(λ) should not be expected to yield the highest brightness per watt of optical radiation.
Past studies have tended to use unique sets of experimental conditions, including the SPDs, experimental procedure, evaluation mode, visual objective and size subtended by the visual scene. This raises a question as to whether the experimental design matters. For example, is discrimination of the brighter scene from sequential evaluation of lighting from two different light sources 30 comparable with category rating of their brightness when evaluated separately? 44 These two particular studies disagree in their conclusions as to whether SPD affects brightness and one possible explanation is the differences in the particular procedures employed.
A review of results from different studies is needed in order to infer general conclusions and to make recommendations for design practice and for future research. Achieving these objectives is complicated, however, because there has been scant evidence to substantiate how experimental conditions have affected the results reported. Several studies carried out in recent years to address this problem have investigated how experimental procedures, evaluation mode and visual objective affect judgments of brightness. 68 – 78
The intended application of this research is measurement of the perceived amount of light in a space, a focus on the ambient lighting of a space (rather than lighting of objects or surfaces) identified here as spatial brightness. It describes a visual sensation of the magnitude of the ambient lighting within an environment, such as a room or lighted street. Generally, the ambient lighting creates atmosphere and facilitates larger visual tasks such as safe circulation and visual communication. This brightness percept encompasses the overall sensation based on the response of a large part of the visual field extending beyond the fovea. It may be sensed or perceived while immersed within a space or when observing a separate space that fills a large part of the visual field. Spatial brightness does not necessarily relate to the brightness of any individual objects or surfaces in the environment, or any directly visible light sources, but it may be influenced by the brightness of these individual items.
Many previous studies have used the term brightness, which is usually defined as the attribute of a visual sensation according to which a given visual stimulus appears to be more or less intense. 79 It is apparent, however, from the manner in which visual judgements were made in previous studies that the evaluation carried out is one which may be better identified as spatial brightness, i.e. that the evaluations concerned lighting in a room rather than small-field light patches, that vision was not restrained by devices such as head restraint or artificial pupils and that the test instructions encouraged appraisal of the whole test environment. Consider for example, the studies by Boyce and Cuttle 44 and by Flynn and Spencer, 46 both of which sought ratings of the brightness rather than the spatial brightness of the lighting in test rooms. Boyce and Cuttle 44 included separate ratings of bright and dim along five-point response ranges labelled ‘very much so’ to ‘not at all so’ and these were made following instruction to test participants to ‘describe the lighting of the room in their own words’, a prompt to consider the whole environment. Flynn and Spencer 46 sought rating of bright-dim along a seven-point semantic differential scale and their test participants were ‘asked to rate the space’, again a prompt to consider the whole environment whilst making the evaluation.
Some previous studies have addressed the effect of SPD on visual clarity, for example, the work carried out by Aston and Bellchambers.
7
It is not clear what visual clarity is nor whether it is interpreted to be anything other than a proxy for brightness. Flynn et al.
80
used factor analysis to group their rating data and suggested that their perceptual clarity factor could also have been named spatial brightness since it seemed to relate to variations in illuminance and the factor included ratings of both clear-hazy and bright-dim. Hashimoto and Nayatani
10
suggested the term brightness sensation to have the same meaning as visual clarity. Perhaps the most direct definition is that from Lynes:
81
It is well known that, for a given illuminance, lamps having good colour rendering properties tend to make an interior look brighter than lamps having poorer colour rendition. This effect is known as ‘visual clarity’.
This paper has two aims. First, to review studies of spatial brightness, updating Fotios’ previous review 82 of 21 studies to include approximately 50 additional studies since located and to consider the findings of recent studies of experimental methodology, 68 – 77 these updating an earlier review of methodology. 78 This review leads to the identification of credible evidence for the effect of SPD. The second aim is to use these data to explore potential metrics for predicting spatial brightness under light sources of different SPD at photopic levels.
2. Selection and review criteria
2.1. General requirements
The aim of this paper is to identify appropriate data that may inform the development of a metric (or metrics) to characterise the effect of lamp spectrum on spatial brightness. A step toward that goal, therefore, is to create objective criteria that can be used to guide the assessments of past studies.
Many of the past studies examined are investigations where the primary focus was to study spatial brightness under lighting of different SPDs. In some other studies included in this review, the relationship between SPD and brightness is a subsidiary issue, or the tests were carried out using a procedure and apparatus not directly relevant to spatial brightness: these studies are included because others have presented them as evidence during discussion of the relationship between SPD and spatial brightness. Some readers may consider that this review does not use the researchers’ work in the intended and original context. Still, we believe it is relevant to include a discussion of these studies to avoid future erroneous application. We have evaluated studies based solely on the merit of what is reported in the manuscripts and have included studies from both peer-reviewed and non-peer-reviewed publications.
Performance in psychophysical experiments depends on both sensory and decision processes. To reliably measure sensitivity of the sensory process, there is a need to ensure that the decision process and psychophysical methods do not distort the measurements. 83 In the current review, a study was considered to provide credible evidence of the effect of lamp SPD on spatial brightness if it met the requirements of three criteria pertaining to the experimental design and the information reported. This is not a complete list of requirements for credible data but a first stage of screening.
Method: The test should follow an acceptable procedure including appropriate stages of counterbalancing and randomisation and these requirements are identified below. In side-by-side matching studies, for example, this would include confirmation that stimulus locations had been counterbalanced between the left and right positions. Studies were rejected if a potential source of bias could be identified that would suggest an incorrect estimate of lamp SPD effects, or which offered no counter to the bias. Some studies do not sufficiently describe the procedure that was used and these were also rejected. Null condition trials are desirable as these can provide quantitative evidence as to the magnitude of bias, but their absence was not used as a sole reason for rejection.
Quantitative data: It is required that test results are reported in sufficient detail to enable independent interpretation of the trends. In the absence of raw data from each trial, these being rarely reported other than in Masters and PhD theses, measures of central tendency and dispersion are needed. Statistical analyses should be carried out using an appropriate test to indicate whether differences were real, or sufficient data reported to allow subsequent statistical analysis. Studies were rejected which did not present sufficient quantitative data to support conclusions regarding SPD effects.
Complete reporting: The report should present sufficient information to enable the work to be understood, reviewed and generalised. For example, ideally lamp SPD are presented, or at least sufficient colour metrics are reported, rather than defining lamps solely by name or abbreviation, and in tests using category rating the questions and response scales should be reported. Studies were rejected which did not report the work in sufficient detail to enable reasonable confidence about the experimental design and results.
We use the term credible to indicate data offering reasonable grounds for being believed, in that the effect of known procedural biases are offset by counterbalancing or randomisation and that sufficient data are reported to describe the apparatus, procedure and results. Credible data might also be considered to be data of good validity, in that they measure to a high degree what they are intended to measure.
2.2. Defining SPD
The aim of this work is to better understand how SPD affects spatial brightness. SPD is an unconstrained independent variable because it can be manipulated in an infinite number of ways (i.e. optical radiation can be placed in different proportions at any wavelength). Derived measures such as correlated colour temperature (CCT), colour rendering index (CRI), chromaticity and gamut area are frequently employed to reduce SPDs to small sets of numbers. This reductionist approach is convenient for analysis, but it is also intrinsically problematic because important characteristics of the independent variable may not be captured in the derived measures. For example, many SPDs will produce the same CCT, but those SPDs may not yield the same perceptions of spatial brightness.4,31,33
Very few past studies report the SPDs of their test light sources, but instead report one or more (or none, in some cases) of the derived measures, most commonly CCT. That does not mean that they have not investigated SPD, but what they may not have done is to provide sufficient characterisation of their test light sources to define the precise SPD used. While failure to report SPD constitutes incomplete reporting, albeit for limitations imposed by the journal or conference proceedings, it still may be possible to test the derived measures that the authors do report. We recommend that SPD are reported in all future studies of this topic. In this paper, we discuss the independent variable of spectrum as SPD – rather than using a derived measure – since SPD is the most basic aspect of spectrum.
2.3. Characteristics of the visual scene
Previous studies have been carried out using a variety of visual scenes, ranging from flat, uniform, neutral surfaces to interior spaces; there have been achromatic and coloured surfaces and some interior spaces have contained objects. The results of four studies in which these variables were manipulated did not suggest a significant effect on the results obtained when using matching or rating procedures.1,28,44,74 Therefore, the illuminated field in spatial brightness experiments has not been used as a criterion by which to screen or collate past research.
The focus of spatial brightness is the ambient lighting in a space rather than lighting on a specific task and while this frequently implies full-field vision, and thus stimulation of the whole retina, fields smaller than full field are also pertinent. Previous studies have used different methods to enable full-field stimulation:
In two studies, Boyce had participants sit with their heads inside scale models of a room.1,28 Houser et al.31,32 had participants sit immediately in front of two adjacent rooms giving very near full-field stimulation. Berman et al.
30
had their participants sit within the space whose illumination was being judged as did Houser et al.
32
Royer and Houser
33
had participants sit in front of a single booth that enveloped nearly the full field-of-view.
Many studies have used visual scenes subtending smaller angles at the eye, from two degrees of visual arc
5
to 10 degrees
11
and further to booths presenting larger fields.
48
This may be for practical purposes, as small fields are easier to set up than real rooms, and it is easier to control extraneous variables such as spatial distribution to help ensure SPD is the only independent variable. Rea et al.
84
used a field of size 18° × 18° and their comment in discussion following the article reveals they considered this a satisfactory approximation of a large visual field. The magnitude of any difference in brightness judgements between full field and smaller fields is open to question. It is therefore desirable to identify the minimum field size that can be employed in spatial brightness research that maintains a visual response representative of full field.
One reason why stimulus size would matter would be if there were significant changes across the retina. As the size of the field of view changes, there is a change in the relative proportions of the three cone types and rods which are stimulated. The maximum density of cones occurs in the fovea, around 105 mm−2. From 1° to 10° eccentricity, the density of cones decreases as eccentricity from the fovea increases. 85 Whilst there is a further progressive decrease in cone density beyond 10°, the rate of change is much smaller, with very little change of cone density in peripheral regions beyond 20°, being approximately 5500 mm−2 at 20° and decreasing to around 4500 mm−2 in the 40° to 100° region. 86 Neither macular pigment optical density nor cone optical density nor cone type distribution vary considerably beyond a 7° diameter disk centred on the fovea. 87
If photoreceptor distribution affects brightness judgements, the distribution of cones in the human retina suggests that for field sizes up to approximately 20°, field size will affect brightness judgements, but beyond that any differences would be small. Kokoschka and Adrian 88 carried out brightness matching using field sizes of 3° to 64°. They present results for three field sizes, 3°, 9° and 64°, and their data suggest the difference between the 9° and 64° fields is small relative to the difference between the 3° and 9° fields.
We tentatively suggest that visual fields of approximately 20° or more will give adequate representation of large field vision, although this remains to be validated. Past studies using fields smaller than 20° were not considered to provide appropriate data for investigation of spatial brightness. Further data are required to characterise the influence of field size on evaluations of spatial brightness.
In studies investigating SPD, good research will isolate other independent variables such as the spatial distribution of light to avoid confounding an effect of SPD. The apparent brightness or lightness of a given stimulus varies greatly as a function of the probable contribution of illumination and reflectance to the luminance of targets. 89 Different spatial distributions leading to scenes with different shadows can thus make surfaces of identical luminance appear different in brightness. Good research should isolate SPD from spatial distribution by using uniform distribution from diffuse sources and thus shadows should be constant between scenes of different SPD: if that were not the case, then the data would not be considered credible. In separate evaluations, this would mean using luminaires of similar optics for different types of lamp; in simultaneous evaluations of side-by-side visual scenes such as rooms or scale models, this would mean using identical spatial distributions in both sides.
2.4. Experimental procedures
Past studies of spatial brightness are discussed here according to the experimental procedures employed. For a single trial involving an explicit measurement of a specific perceptual attribute of a given stimulus, there are four basic procedures: adjustment, matching, discrimination and category rating. The relationships between these procedures are shown in Figure 1. Further methods for evaluating visual scenes, such as magnitude estimation, have been used rarely, if at all, in past research of spatial brightness.
Basic procedures for measurement of spatial brightness.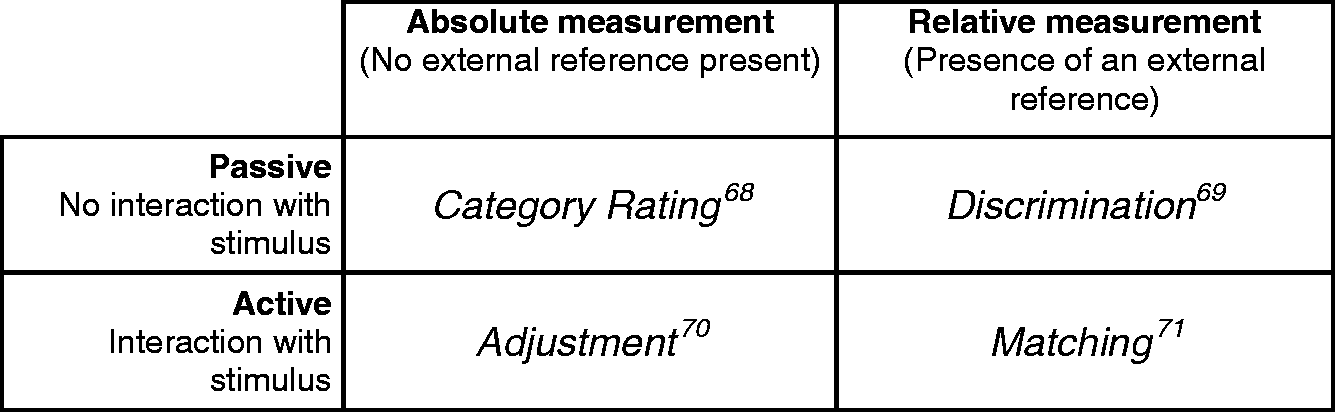
Brightness evaluations using matching, rating, adjustment or discrimination procedures are all explicit measurements of brightness. Implicit measurements may provide radically alternative means to evaluate spatial brightness. For example, Wenzel et al. 90 recorded gross muscle potential around the eye in a study of photophobia (making the assumption that sufficiently intense light would compel test participants to squint in order to limit the amount of light entering the eye) in order to validate evaluations of discomfort measured using a category rating scale. Further discussions of psychophysical methodologies and requirements for good data can be found in Gescheider, 91 Jäkel and Wichmann 92 and Flynn et al. 93
2.4.1. Matching
Matching is a two-alternative adjustment task. Test participants observe two visual scenes of which one is the reference lit with a constant luminance (This paper is phrased in terms of luminance and illuminance. Horizontal illuminance is the variable reported in the majority of studies; it is easy to characterise and it directly relates to lighting design practice. It is more correct, however, to measure illuminance at the plane of the observer’s eyes, or to measure average luminance over the observer’s visual field.) In a matching task, participants are instructed to adjust the amount of light in the second (test) visual scene until its brightness matches, as near as possible, that of the reference scene, at which point the luminances are recorded. This adjustment is usually carried out directly by the test participant but may also be carried out by the experimenter following verbal command from the participant. The output is the ratio of luminances of the two visual scenes at equal (i.e. matched) brightness. Some studies have used matching criteria other than brightness, e.g. equal clarity or equal appearance: Following Fotios and Gado, 2 it is assumed that the results are a suitable proxy for judgements of equal brightness.
Fotios et al. 71 reviewed the brightness matching procedure, in particular the outcomes of null condition trials, and suggested ways to avoid bias that might otherwise significantly affect the luminance ratio for equal brightness. These are given below:
Position bias: Exchange light sources between both spatial locations (e.g. left-hand and right-hand booths) on successive trials, unless evidence from null condition trials suggest position bias is not significant.
Conservative adjustment: Apply the test participant’s control mechanism to vary illuminance to alternate stimuli on successive trials, unless evidence from null condition trials does not suggest conservative adjustment to be significant.
Quantitative data: Report numeric data to show the central tendency (e.g. mean illuminance ratio at equal brightness), a measure of dispersion (e.g. standard deviation) and sample size. To determine whether an apparent difference is real then statistical analysis is needed or sufficient data are reported to enable such analysis.
Two investigations32,76 carried out brightness matching experiments to compare the results gained from simultaneous and sequential evaluations. Following previous studies of spatial brightness, the sequential evaluation employed durations of 5 s per interval and three or more alternations of the two stimuli. The results gained from these tests did not suggest that there were differences in either the illuminance ratio required for equal brightness or the precision of this estimate between simultaneous and sequential evaluations. Further data are desirable to confirm the findings from only these two studies. Both modes of evaluation were considered acceptable in the current review.
In trials, the variable scene is likely to have a starting brightness either higher or lower than that of the reference scene. Empirical data show that this can affect the outcome, but the direction of the effect is not consistent. 71 As a precaution, the starting illuminances should be set to produce higher and lower brightness than the reference equally frequently. This has not been used to reject data in the current review because it is rarely reported in past studies, if at all, and because the direction and magnitude of the effect is not well defined.
Four studies 1 – 4 using a matching procedure are suggested to provide credible estimates of the illuminance ratio for equal brightness: these studies accounted for stimulus position and application of dimming control to each stimulus in each pair, they included null condition trials and they report quantitative data including the mean and standard deviation.
The reports of 11 studies 5 – 15 reveal that they did not balance stimulus position nor application of dimming, only one study included null condition trials, and they tended to incompletely report the results, e.g. the mean illuminance ratio is reported but not the standard deviation. Vidovsky-Németh and Schanda 16 used a variation of matching: Test participants reported which visual scene appeared brighter and the experimenter slowly increased/decreased the illuminance in the test booth until the participant signalled a reversal of the brightness relationship, this being repeated several times with gradually smaller steps to target equal brightness. While this procedure may have overcome conservative adjustment, otherwise expected because dimming control was applied only to the test visual scene, position bias is clearly evident from the test procedure. Results of a null condition trial suggested that differences between their two booths were small, although these were only few trials using one observer and there is no statistical analysis.
Incomplete reporting in six studies 17 – 22 means it is not possible to identify whether stimulus position and dimming application were balanced and/or the results are incompletely reported, and thus these studies are not considered to provide credible estimates of illuminance ratio for equal brightness.
2.4.2. Adjustment
Adjustment is a single-interval task. Participants are instructed to adjust the amount of light in a space to a preferred or optimum level. This may be through direct control of illuminance, e.g. by using a rotary control dial, or by giving commands (e.g. higher or lower) to an experimenter who carries out the action. The output is the illuminance or luminance at the preferred or optimum level. Different visual scenes (e.g. lighting of different SPD) are evaluated separately and the task is carried out in isolation from an external reference.
The adjustment procedure has been used to compare lighting of different SPD in five studies. 23 – 27 While these studies did not ask directly for adjustment to a preferred level of brightness, the findings from studies of visual criteria2,73 suggest that the results could be considered as a proxy for preferred or optimum brightness.
Fotios and Cheal 70 reviewed studies using illuminance adjustment and noted that, in those studies where the illuminance range was reported or could be estimated, the reported mean preferred illuminances tended to fall near the centre of the available range of illuminances. Tests using different ranges of illuminance would therefore lead to different estimates of preferred illuminance – a stimulus range bias. An experiment was carried out in which participants were asked to set the preferred illuminance using a dimming control, not knowing that the experimenter changed the range of illuminances available on successive trials. Three different ranges were used and each range resulted in a different mean preferred illuminance and thus confirmed the presence of stimulus range bias. 70 Stimulus range bias was subsequently confirmed in further trials investigating illuminance adjustment24,94 and colour appearance adjustment. 77
These studies also investigated anchors, the setting of the variable stimulus immediately before adjustment by the test participant, and these were set near the bottom, middle and top of the stimulus ranges.24,77 The results demonstrated that final settings were influenced by the anchor, with low anchors leading to low estimates of preference and high anchors lead to high estimates. Such conservatism in adjustment is a common psychological tendency to adjust insufficiently and is manifest in a variety of sensory responses. 95
Because the preferred value set using an adjustment procedure appears to depend on the stimulus range and anchor this raises doubt as to whether the single interval adjustment method has validity as a means for identifying the preferred (or optimum) brightness, and thus for comparing brightness under lighting of different SPD. It is not known, for example, whether the test participant is responding to the visual stimulus or to the control device. Furthermore, it should also be questioned whether the magnitude desired by the respondent is available within the stimulus range provided.
Therefore, we cannot yet be certain whether the previous studies provide a credible estimate of illuminance for equal brightness under lighting of different SPD. There are also additional reasons why some of these studies were not considered credible: in the Juslen et al. 23 study, the general lighting in the room was simultaneously in use whilst the local task lighting was adjusted; Luckiesh and Moss 25 did not report variance data nor statistical analysis; Qiao 26 did not report sample size, sufficient results nor statistical analyses.
Two further studies28,29 used a variation of the adjustment procedure in which the adjustment was carried out by the experimenter in response to evaluations from the test participant (e.g. too dim, too bright or just sufficient). This is not the same task as adjustment but the requirement for continuous judgements of the stimulus at different illuminances is suspected to suffer from the same range bias. There are no statistical analyses of the Kanaya et al. data and the lack of standard deviation means this is not possible.
In summary, there is some doubt as to whether the single-interval adjustment procedure provides credible evidence to compare preferred brightness under lighting of different SPD. It is suggested that future researchers investigating this procedure consider the following for good practice:
Stimulus range: Report the upper and lower limits of the range and use different ranges in successive trials. Consider the possibility that the ‘preferred’ value may be outside of the range of magnitudes available to the test participants.
Anchors: Lower anchors lead to lower preferred illuminances, higher anchors lead to higher preferred illuminances. If the relationship between control setting and illuminance is linear, a mid-range anchor is appropriate to estimate preferences within ranges; 77 if the relationship is non-linear, then low and high anchors should be used in successive trials and the mean illuminance of these trials be used to give an estimate of preference for each test participant within the available range.
Presentation order: The sequence of lamps, stimulus ranges and anchors is randomised or counterbalanced.
2.4.3. Discrimination
In the discrimination procedure (also known as brightness ranking in past studies 75 ) test participants are presented with two visual scenes in spatial or temporal juxtaposition. The luminances of both remain constant and the participant is instructed to report which scene is brighter. This is usually a forced choice task, in which the response ‘equally bright’ is not allowed. The output is the frequency of responses by which a scene is considered to be the brighter.
Fotios and Houser 69 reviewed the brightness discrimination procedure and suggested procedures required to avoid bias that might otherwise have a significant effect on the illuminance ratio for equal brightness.
Position bias: In simultaneous evaluations, visual scenes are presented at both spatial locations (e.g. left and right for a side-by-side presentation) on successive trials, or, evidence presented from null condition trials suggests that position bias was not significant. Similarly for sequential evaluations (stimuli presented one after another at the same spatial location), stimulus order (i.e. first or second) should be balanced to counter interval bias.
All possible pairs: The use of a single reference stimulus may lead to stimulus range bias or to stimulus frequency bias. This can be countered by making discrimination judgements between all possible pairs of the stimulus magnitudes.
Presentation order: The sequence of lamp-pairs is randomised or counterbalanced.
Quantitative data: Numeric data are needed to show the central tendency (e.g. frequency for a particular stimulus in each pair to be reported brighter) and sample size. To determine whether an apparent difference is real, statistical analysis is needed or sufficient data must be reported to enable such analysis.
Temporal and spatial juxtaposition (e.g. side-by-side and successive or sequential presentations) have all been used in past studies. Side-by-side is the most typical mode for spatial juxtaposition, viewing either booths or full-scale rooms. Temporal juxtaposition takes one of two modes: successive and sequential. In the successive mode, each stimulus is presented only once and then a judgment is made. In the sequential mode, each stimulus is alternated back-and-forth, thus refreshing the participant’s memory and allowing for a more considered response that is less reliant on memory or on an initial reaction.
Yeshurun et al. 83 suggest that two-interval forced-choice tasks are not simple, are not bias free and are potentially difficult to interpret. Interval bias is a consistent asymmetry in the direction of a certain response, for example, a ‘brighter’ response for one interval which appears with a greater frequency than is expected. 83 In successive evaluations, observers have to retain their sensory impression of the preceding stimulus in mind while waiting for and then judging the current stimulus. 92 Thus, a possible explanation of interval bias is memory limitation: The observer either cannot or does not record an accurate sensory intensity in the first stimulus when making comparison with the second stimulus. 83 Mental representations of previously encountered physical stimuli tend to be lower (e.g. shorter in length, or less bright) than were the original stimuli 95 as was found in the Uchikawa and Ikeda 96 brightness matching results where stimuli were recalled as being darker with successive evaluation than with simultaneous evaluation. In their detection task, Jäkel and Wichmann 92 found a strong bias to the second interval with successive evaluations whilst the simultaneous evaluation was virtually unbiased. Past studies of spatial brightness have used sequential evaluations, the repeated presentation of both visual scenes, and this may alleviate interval bias because the repeated presentation of both visual scenes provides a constant refreshment of the mental reference, but further data are required to confirm this.
In previous spatial brightness studies using temporal juxtaposition stimulus, durations of 3 s and 5 s have been used. Sequential discrimination evaluations using such durations do not appear to lead to different judgements than do simultaneous evaluations.32,76
Five studies 30 – 34 using a discrimination procedure to investigate spatial brightness followed these criteria and are therefore considered to provide credible evidence of lamp spectrum effects. Of the three studies that employed sequential evaluation, one 32 reported that stimulus intervals were counterbalanced: The other two studies30,34 did not report this information and it is assumed that the continuous alternation of the two stimuli in each pair countered the interval bias otherwise expected in successive evaluations.
Seven studies 35 – 41 are not considered to provide credible evidence for lamp spectrum and spatial brightness because of incomplete reporting of the results, 37 position bias,35,41 small fields35,41 and insufficient description of the test procedure to demonstrate what actually took place.38,39 In the study by Pracejus, 40 who compared preference for two rooms lit using different types of lamp, of the seven types of lamp used only 17 of the possible 21 combinations appear to have been used, the precise combinations not being reported, and it is not clear how the reported proportional preferences for each lamp were established. In their pilot study, Cockram et al. 36 asked for the lighting in four different rooms at night to be placed in rank order, essentially a four-alternative forced-choice discrimination task. These were judgements of preference rather than of brightness. The results are not considered to be credible for four reasons. First, different types of lamps were compared on the basis of an equal number of lamps rather than equal illuminance and these differences in illuminance explain the results. Second, the highest preference score was given to a warm white lamp that was normally used in the building the field study was carried out in, suggesting an adaptation effect. Third, there is an apparent error in the results: The total preference scores for all four stimuli should sum to 400, but the reported results sum to only 372. Finally, there are insufficient data to test whether differences between stimuli are significant.
2.4.4. Category rating
Category rating is a frequently used procedure in previous work. It is a single-interval task in which the participant is presented with an illuminated space and instructed to use rating scales to describe the appearance of the visual scene. Different scenes (e.g. lighting of different SPD and illuminance) tend to be evaluated separately, in isolation from external visual references, and multiple scenes for repeated measures designs are observed in succession.
There are two approaches to gaining an opinion of brightness using category rating. Semantic differential scaling presents a scale of brightness along a scale representing a bright-dim axis, for example, a four-point response range with intervals labelled very bright (1), bright (2), dim (3) and very dim (4). Likert scales present a scale of agreement; the question may ask if the lighting in a space is too bright, with a response range of, for example, 1 (strongly agree) to 6 (strongly disagree).
Fotios and Houser 68 offered recommendations to reduce bias when using the category rating procedure to examine spatial brightness. Two of these criteria are considered to be essential in the current review. The first pertains to repeated measures designs where each test participant provides judgements for a number of stimuli – these should be presented in a randomised or balanced order, providing a well-mixed order of stimuli. The second essential criterion is that the number of stimuli and the number of response categories should be approximately similar to avoid a grouping bias. 68 One of their recommendations was that the response range should be anchored to the stimulus range using pre-experimental visual demonstration: While this should be considered desirable, the influence of anchors on category rating judgements of brightness has yet to be established and strict enforcement would lead to the rejection within the current review of nearly all past studies using the category rating procedure.
Fotios and Houser 68 also recommended that response scales should use an even number of points to avoid a middle category, e.g. a six-point range rather than a seven-point range, as there are data suggesting that an odd number of response points can enhance response contraction bias. 97 Monfared 98 reported a significant but small difference in ratings of thermal comfort when using four-, five- and seven-point response scales. Dawes 99 used judgements of price consciousness to demonstrate that changing the number of response categories (five-, seven- and 10-point response ranges) had significant effects on the mean rating. The minimum number of categories is two, for example, the Yes or No response options to the question The light in this room is too bright as was used by Boyce et al. 43 A two-point scale is sufficient to measure attitude direction: Longer response scales add information regarding intensity but may also encourage rating scale biases. 100 A brief study using response ranges of five-, six-, seven- and eight-points found that these different scale formats did not lead to significant differences in central tendency – the same conclusion as to population opinion about the environment would be drawn with any of these scales. 72 With respect to these mixed results, the number of points in the response range was not used to screen previous studies in the current review.
Many different items have been rated in previous work, including appearance items such as brightness, clarity and colourfulness, emotion items such as cool, active, soft, calm, spaciousness and comfort, and purposefully nonsensical items such as boulder. It must be questioned whether items rated in previous work can be meaningfully rated (as opposed to rated without understanding to please the experimenter) and furthermore whether they relate to changes in lighting.101,102
Past category rating studies have commonly included brightness and clarity judgements. The brightness judgements tended to be ratings of a large interior space along a bright-dim dimension and may thus be considered ratings of spatial brightness. The clarity judgements tended to be ratings along a clear-hazy dimension and these are assumed to be ratings of visual clarity. Fotios and Atli 73 reviewed past studies rating spatial brightness and visual clarity to question the similarity of these phenomena. A review of definitions reported by researchers suggests an intention by some that brightness and clarity are different phenomena. For example, Vrabel et al. 34 provided different definitions for brightness and clarity, implying them to be different, whereas Flynn et al. 80 infer that perceptual clarity and spatial brightness relate to the same visual impression and Hashimoto and Nayatani 10 suggested the term brightness sensation to have the same meaning as visual clarity. A comparison of the results of brightness and clarity evaluations, however, suggests that test participants give similar judgements for brightness and clarity when these are not defined in the test procedure. 73
It was concluded that 10 studies1,28,34,42,43,45– 48 including the second experiment in Boyce and Cuttle 44 present credible evidence of SPD and spatial brightness using a category rating procedure. These studies tended to use a randomised or balanced sequence of stimulus presentation (or used independent samples), the number of stimuli did not greatly exceed the number of points in the response range and sufficient quantitative data are reported.
For 20 studies12,36,40,49– 64 including the first experiment in Boyce and Cuttle, 44 it was concluded that they did not present credible evidence of SPD and spatial brightness. The reasons for omitting these studies included failure to randomise, or report whether presentation sequences were randomised,12,53,56,58– 60 having a large number of stimuli relative to the number of response options thus leading to a suspected grouping bias,44,53,56,58–60,62 not reporting sufficient quantitative data or procedural design,12,36,40,49–59,61– 64 and not reporting clearly the precise items for which ratings were sought.52,58,61,64
2.4.5. Studies where the method is not clear
In two studies, the procedure used is not clearly defined. One of the most widely known studies of lamp spectrum and perception is that of Kruithof. 65 While this was not a study of spatial brightness, but rather whether the lighting was considered pleasing, it addresses the relationship between SPD and illuminance. Unfortunately, the article does not clearly identify the experimental procedure, the number of test participants, or the results that were gained, and therefore it is not possible to understand how the resulting Kruithof curves were generated.
Manav et al. 66 compared illuminances and SPD but the procedures used are not clear: it is possible they recorded preference judgements (% preferences are reported) and used a five-point rating scale of suitability. The results are not clearly identified, with no statistical analyses of differences and insufficient data (i.e. standard deviation) to enable this to be carried out.
3. Discussion
3.1. Lamp SPD and brightness
Summary of studies considered to provide credible evidence of lamp spectrum and spatial brightness by using procedures that meet suggested recommendations for best practise.

Berman et al. 30 originally promoted a rod contribution to spatial brightness, and hence the S/P (scotopic to photopic) ratio. Following new findings in vision this was amended to a contribution from the intrinsically photosensitive retinal ganglion cells. 105
In some studies the metric may be more safely stated as lamp type rather than a particular metric, for example, the study by Piper 47 who compared HPS and CW fluorescent lamps.
Boyce et al. 43 report a trend but the effect is not significant: they suggest it to be ‘an effect masked by noise’.
The results of some studies suggest that lighting of higher CCT is brighter than lighting of lower CCT,28,42,44,48 a chromatic contribution to brightness. It may be that CCT is the reported variable because it is a widely known attribute of lamp spectrum and differences in CCT are visually notable, but as a single number index of a complex lamp spectrum it cannot be assumed to be the most appropriate metric. Further studies have demonstrated that CCT is not a valid metric for spatial brightness.1,4,31,33,44,45
One limitation of past work is that while one attribute of lamp SPD is reported, such as CCT, other attributes are not reported: The variance of these attributes is unknown and may be hiding a more relevant metric for spatial brightness.
One study 30 associates the scotopic to photopic (S/P) ratio with spatial brightness, and purposefully presented two lighting conditions of near-identical chromaticity (and hence equal cone excitation) but different S/P ratio. The results suggested that lighting of higher S/P ratio appears brighter. Following new findings in vision, this was amended to a contribution from the intrinsically photosensitive retinal ganglion cells (ipRGC) 105 and there is some independent evidence for this. 106 What is not yet known is the relative importance of the chromatic and pupil size contributions to spatial brightness and their interaction in particular when comparing lighting of different chromaticity.
Two studies in particular have sought, through careful lamp selection, to test metrics for spatial brightness. Boyce 1 used a set of lamps to compare brightness predictions using standard colour characteristics and found that CCT and Ra did not consistently predict brightness whilst gamut area did. Royer and Houser 33 used an LED array in which the red or the blue primary of an RGB LED mixture could be systematically varied: Their results indicated that light stimuli of equal illuminance and chromaticity do not appear equally bright, and that the rank-order of brightness was not predicted by potential metrics for brightness perception including the S/P ratio, CCT, prime colour theory, colour quality metrics, linear brightness models or colour appearance models. It is clear that further work is needed to establish a metric that provides a consistent prediction for lamp spectrum and spatial brightness.
The studies identified in Table 1 might be used as the database for a mathematical modelling exercise towards screening potential metrics for SPD and spatial brightness. To do that requires that the SPD of the lamps used in the experiments are available. Unfortunately, numeric SPD data are rarely reported in journal articles and conference proceedings, typically only in works such as PhD theses. For recent studies, direct communication with the authors may enable the SPD to be gained. For older studies, this is likely to be difficult if not impossible.
One study 107 attempted to establish the SPD of lamps used in past research. For example, for Boyce’s 1977 article 1 estimates of SPD were obtained by matching the lamp name and CCT reported by Boyce with the typical fluorescent lamps described in the 1972 edition of Lamps and Lighting 108 which provided graphs of SPD. These graphs were digitised and the SPD estimated at 1 nm intervals. To check validity, values of CCT and Ra determined using the estimated SPD were compared with the values reported by Boyce and were found to approximately match.
3.2. Methodology
The review process has identified guidance for best-practice in the matching, discrimination and category rating procedures. It was concluded that we cannot be certain whether the adjustment procedure yields credible estimates of illuminances for equal brightness. Each procedure has its own limitations and different procedures should be expected to yield different results. Therefore, evidence should be gathered using two or more procedures comparing the same stimuli. If these yield highly similar results from the same stimuli presented under the same conditions, we may place some reliability in the results. If not, then an investigation of the differences will improve understanding of methodology. While a few studies have done this,1,32,34,42 and one study at mesopic levels, 109 most do not.
It is recommended to include null condition trials as these can detect and quantify the effects of bias. In joint evaluations, identical SPDs and illuminances neutralise the effects of these variables and thus any apparent differences in the dependent variable may reveal experimental bias. In separate evaluations, a null condition might involve repeated presentation of the same scene to examine whether the same response is given on both occasions. Null condition trials provide some evidence as to whether a procedure can avoid misidentifying an independent variable such as SPD as being significant. It is also good practice to include in the stimulus group one which is very likely to be very different in brightness, such as a high illuminance, in order to confirm that the procedure has sufficient sensitivity to reveal clear differences.
3.3. Alternative approaches
In any experiment of lighting and subjective evaluation, it is expected that observers’ responses will be biased to some extent by the apparatus and procedure. The approach used in the current study was to identify past research offering a credible estimate of the effect of SPD on spatial brightness (e.g. illuminance ratio at equal spatial brightness) as needed for quantitative analysis, and this was done using a review of procedures to identify the factors that would bias the estimate. For example, using a side-by-side matching procedure to compare two scenes, position bias can lead to an illuminance ratio that incorrectly values the relative brightnesses. 71 Many studies using side-by-side matching did not counterbalance position and therefore lead to potentially erroneous estimates of illuminance ratio at equal brightness: Many other studies failed to report whether or not position was counterbalanced, giving no clue as to the likelihood of a bias. In both cases, the current review did not consider such work to be credible. We do not claim that this is the only or best approach to utilisation of past studies. What we have essentially done is to take from each experiment only those aspects we consider to be tenable: other researchers may prefer to also acknowledge those aspects that are less certain (which might be appropriate when discussing whether an effect exists but not so when conducting a quantitative analysis of an effect).
In order to investigate the effect of SPD on spatial brightness, the current paper has reviewed past studies using one or more of four common psychophysical procedures. An alternative approach would be to use Fourier analysis to describe the transmission of spatial information through the visual system following the proposal by Blakemore and Campbell 110 that the neurons in the visual cortex might process spatial frequencies instead of particular features of the visual world. The spatial-frequency theory of vision is based on two physical principles: First, that any visual stimulus can be represented by plotting the intensity of the light along lines running through it; and second, that any curve, no matter how irregular, can be broken down into constituent sine waves by Fourier analysis. 111 Early work used Fourier analysis to describe psychophysical responses to stimuli such as gratings. 110 Subsequent work has examined discomfort and more complex images from art and nature and has found that artificial scenes of higher colour contrast and lower luminance contrast than typical of natural scenes, or excessive energy at medium spatial frequencies, tend to appear uncomfortable.112,113 It is likely that the feeling of discomfort gained from an image is related to judgments of brightness and it would therefore be interesting to investigate using Fourier analysis to study SPD and spatial brightness.
4. Conclusion
This paper reports a review of evidence for the effect of lamp SPD on spatial brightness at photopic levels, adding approximately 50 additional studies to those included in an earlier review. 82 Nineteen studies were considered to provide credible estimates of relative spatial brightness under lighting of different SPD (Table 1), these being four studies using matching, 1 – 4 five studies using discrimination, 30 – 34 and 10 studies using category rating1,28,34,42,43,45– 48 including the second experiment in Boyce and Cuttle. 44
In 17 of these 19 studies, the test results suggest a significant effect of lamp spectrum on either illuminances needed for equal spatial brightness, or, significantly different ratings of spatial brightness at equal illuminances. There is however no agreement within these studies as to a metric for spatial brightness: Further work is required. One approach to establishing a metric for spatial brightness is to use these data to screen potential metrics. However, a problem with this approach is that past studies did not tend to report lamp spectral data.
Footnotes
Funding
This research received no specific grant from any funding agency in the public, commercial, or not-for-profit sectors
Acknowledgements
The authors acknowledge the members of the IESNA Visual Effects of Lamp Spectral Distribution Committee and CIE Technical Committee TC1.80 Research Methods for Psychophysical Studies of Brightness Judgements who may have influenced this work through committee discussions.