
Abstract
An investigation of the level of disturbance caused by reflections from a variety of display screens, including interactive whiteboards, has been carried out using three test methods: Luminance adjustment, category rating and reading. The results from the luminance adjustment test and the category rating test were consistent, both showing similar significant effects of lighting-display parameters on the disturbance caused by screen reflections. In contrast, the objective measure of task performance in the reading test was barely responsive to reflections on the screens. Two models have been developed, one to predict the luminaire luminance at which 95% of observers were not disturbed by the reflections and the other to predict the rating of disturbance caused by reflections from the screens. Both models are based on lighting-display parameters including the size and luminance of the reflected light source and the specular reflectance, the effect of haze reflection and the background luminance of the display screen. These models can be used generally, to guide lighting recommendations and, specifically, to identify suitable luminaires to be used with given set of display screens or suitable display screens to be used with a given lighting installation.
1. Introduction
The introduction of computers has transformed the visual environment of offices since the 1970s. In the 21st century, the same transformation is taking place in classrooms. This paper develops methods for judging the acceptability of lighting for use in classrooms where a variety of display screen equipment is in use. The reason why lighting in classrooms needs to be judged is the potential for reflections to occur in display screens. Such reflections are disturbing when they produce a high luminance contrast between the reflected object and the screen background.
1
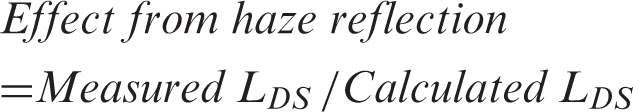
The magnitude and form of these reflections depends on the reflection properties of the display screens,2,3 which are characterised by three components; diffuse, specular and haze (Figure 1).
4
Diffuse reflection occurs when the reflected light is scattered equally in all possible directions; it produces a uniform luminance that decreases the contrast between the displayed material and its background. Specular reflection produces a distinct reflected image in the mirrored direction which can easily draw attention from the intended tasks. Haze reflection combines the characteristics of specular and diffuse reflection, giving a blurred edge to the image caused by specular reflection. Display screens using different technologies and surface treatments have these reflection components in different proportions.
Diffuse, specular and haze components of screen reflection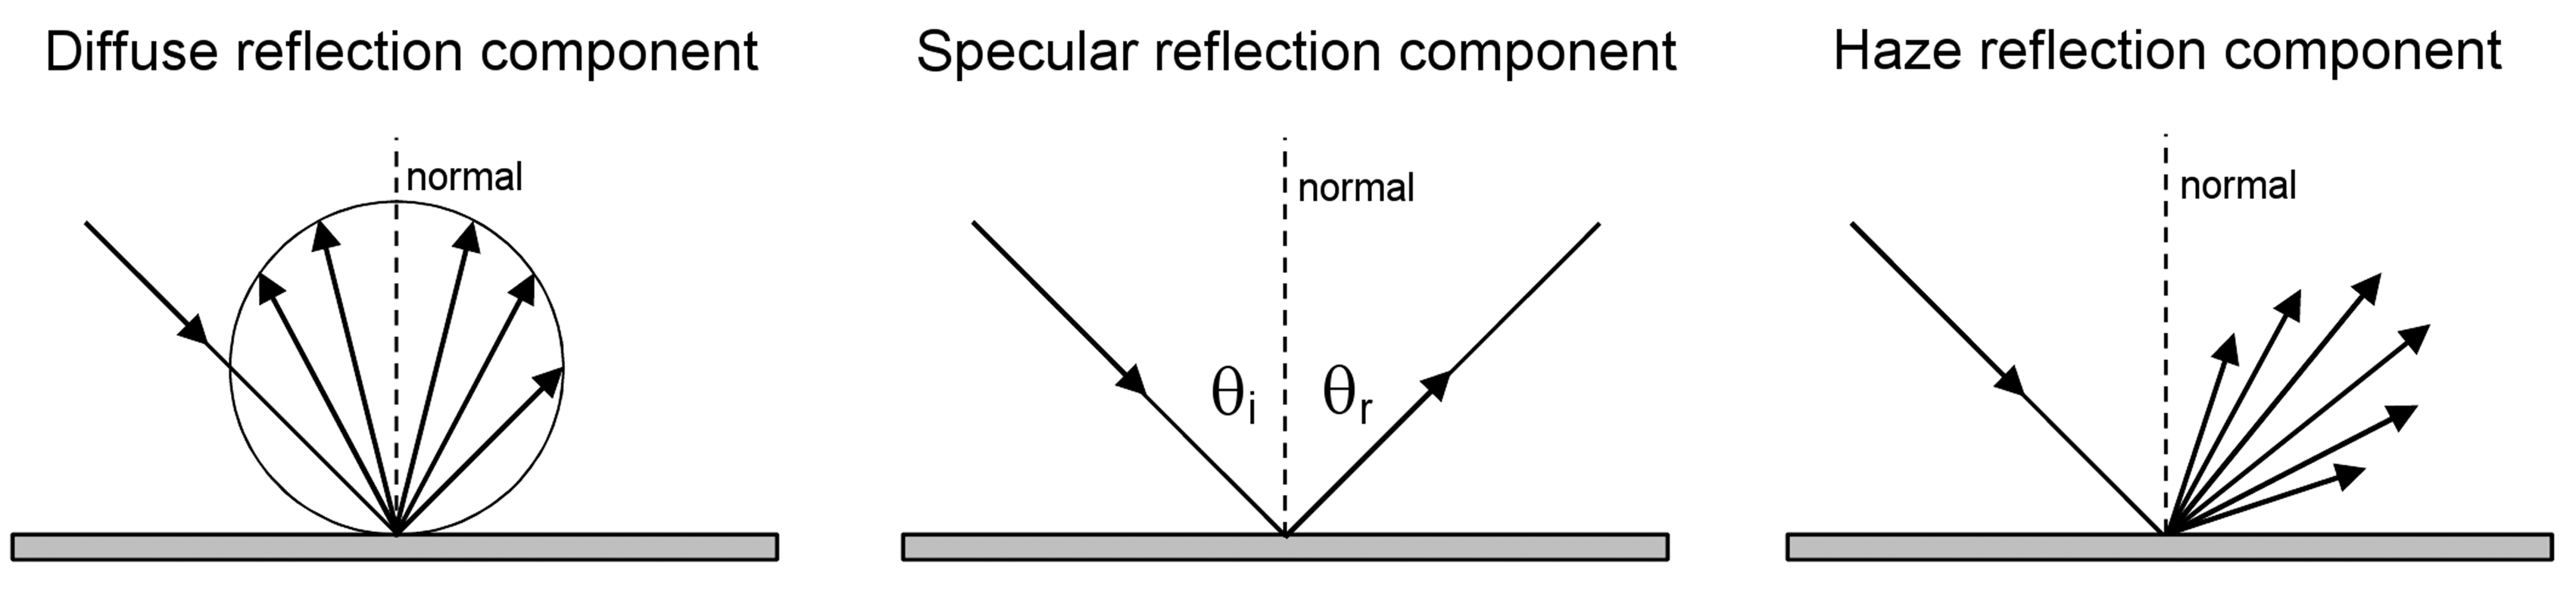
Disturbing reflections are typically caused by the presence of light sources within the reflected scene on a display screen. Therefore, the common recommendation in lighting guides is to eliminate such reflections by controlling the geometry between the display screen, light source and user. This is usually achieved by changing the position and orientation of the display screen. However, control of geometry between lighting, display screen and user is not always possible in real-world applications, particularly for big screens like interactive whiteboards which are viewed by multiple users at the same time. Therefore, many lighting guides have found it necessary to give quantitative guidance for luminaires and surfaces reflecting light, these being the main sources of disturbing reflections in display screens.
Quantitative guidance for limiting disturbing reflections on display screens takes the form of luminance maxima. For direct lighting, a maximum luminaire luminance is prescribed together with the angle of elevation from vertical where this limit is applicable. For indirect lighting, average and maximum luminances for major reflecting surfaces such as ceilings and the upper parts of walls are prescribed. For lighting with direct and indirect components, both direct and indirect lighting luminance limit criteria are applied. Guidance documents that use this approach include the SLL Lighting Guide 7: Office Lighting, British Standard BS EN 12464-1:2002 Lighting of Work Places and RP-1-04 American National Standard Practice for Office Lighting.
5
–
7
Although this approach is rational, it may be outdated because display screen technology changes rapidly. Over the last few years, there has been a rapid move from CRT displays to LCD displays. Further, classrooms have seen the widespread introduction of interactive whiteboards and large screen displays as well as individual monitors. These new technologies have different reflection properties and different screen luminances and are viewed at different distances. For this reason, a study has been carried out using a range of screens likely to be found in classrooms. The key objectives of this work were:
To determine the maximum acceptable luminance of a light source visible by reflection from display screens representative of those used in classrooms. To identify the screen and lighting parameters that affect the acceptability of reflections. To measure the effect of screen reflections on visual performance. To develop models to predict the maximum luminaire luminance and the level of disturbance felt at different luminances based on known properties of the display and the lighting.
2. Methods
Two psychophysical test methods were used for the subjective assessment of screen reflections: Adjustment and category rating. These methods have been used in previous studies including those upon which current guidance is based.2,3,8– 12 Both methods can be used to identify the conditions when reflections on the display are just starting to be unacceptable for users. Agreement between the two methods suggests the results are robust. In addition to psychophysical tests, the influence of screen reflections on reading was examined.
The adjustment measurements were made separately from the category rating and reading measurements, using two different panels of observers. However, the test environment, light box, display screens and viewing angles were identical in both sets of measurements.
2.1. Test environment
The test took place in a room 3.4 m wide × 3.9 m long × 3.2 m high (Figure 2). The windows were sealed to prevent daylight entering the room. The surface reflectances were 0.60 to 0.80 (walls and window blinds), 0.69 (ceiling) and 0.17 (floor). Ambient light was provided by two ceiling-mounted louvre luminaires. Each luminaire contained two T8 70 W fluorescent lamps with a correlated colour temperature (CCT) of 3450 K and a colour rendering index (CRI) of 54. The display screens and the observer's seat were positioned so that no direct reflection from the ceiling luminaires was visible on any screen during the tests. The illuminance on the surface of display screens from the room lighting ranged between 180 lux and 231 lux.
Plan of the test environment showing the arrangement of the apparatus (DSE = Display Screen Equipment)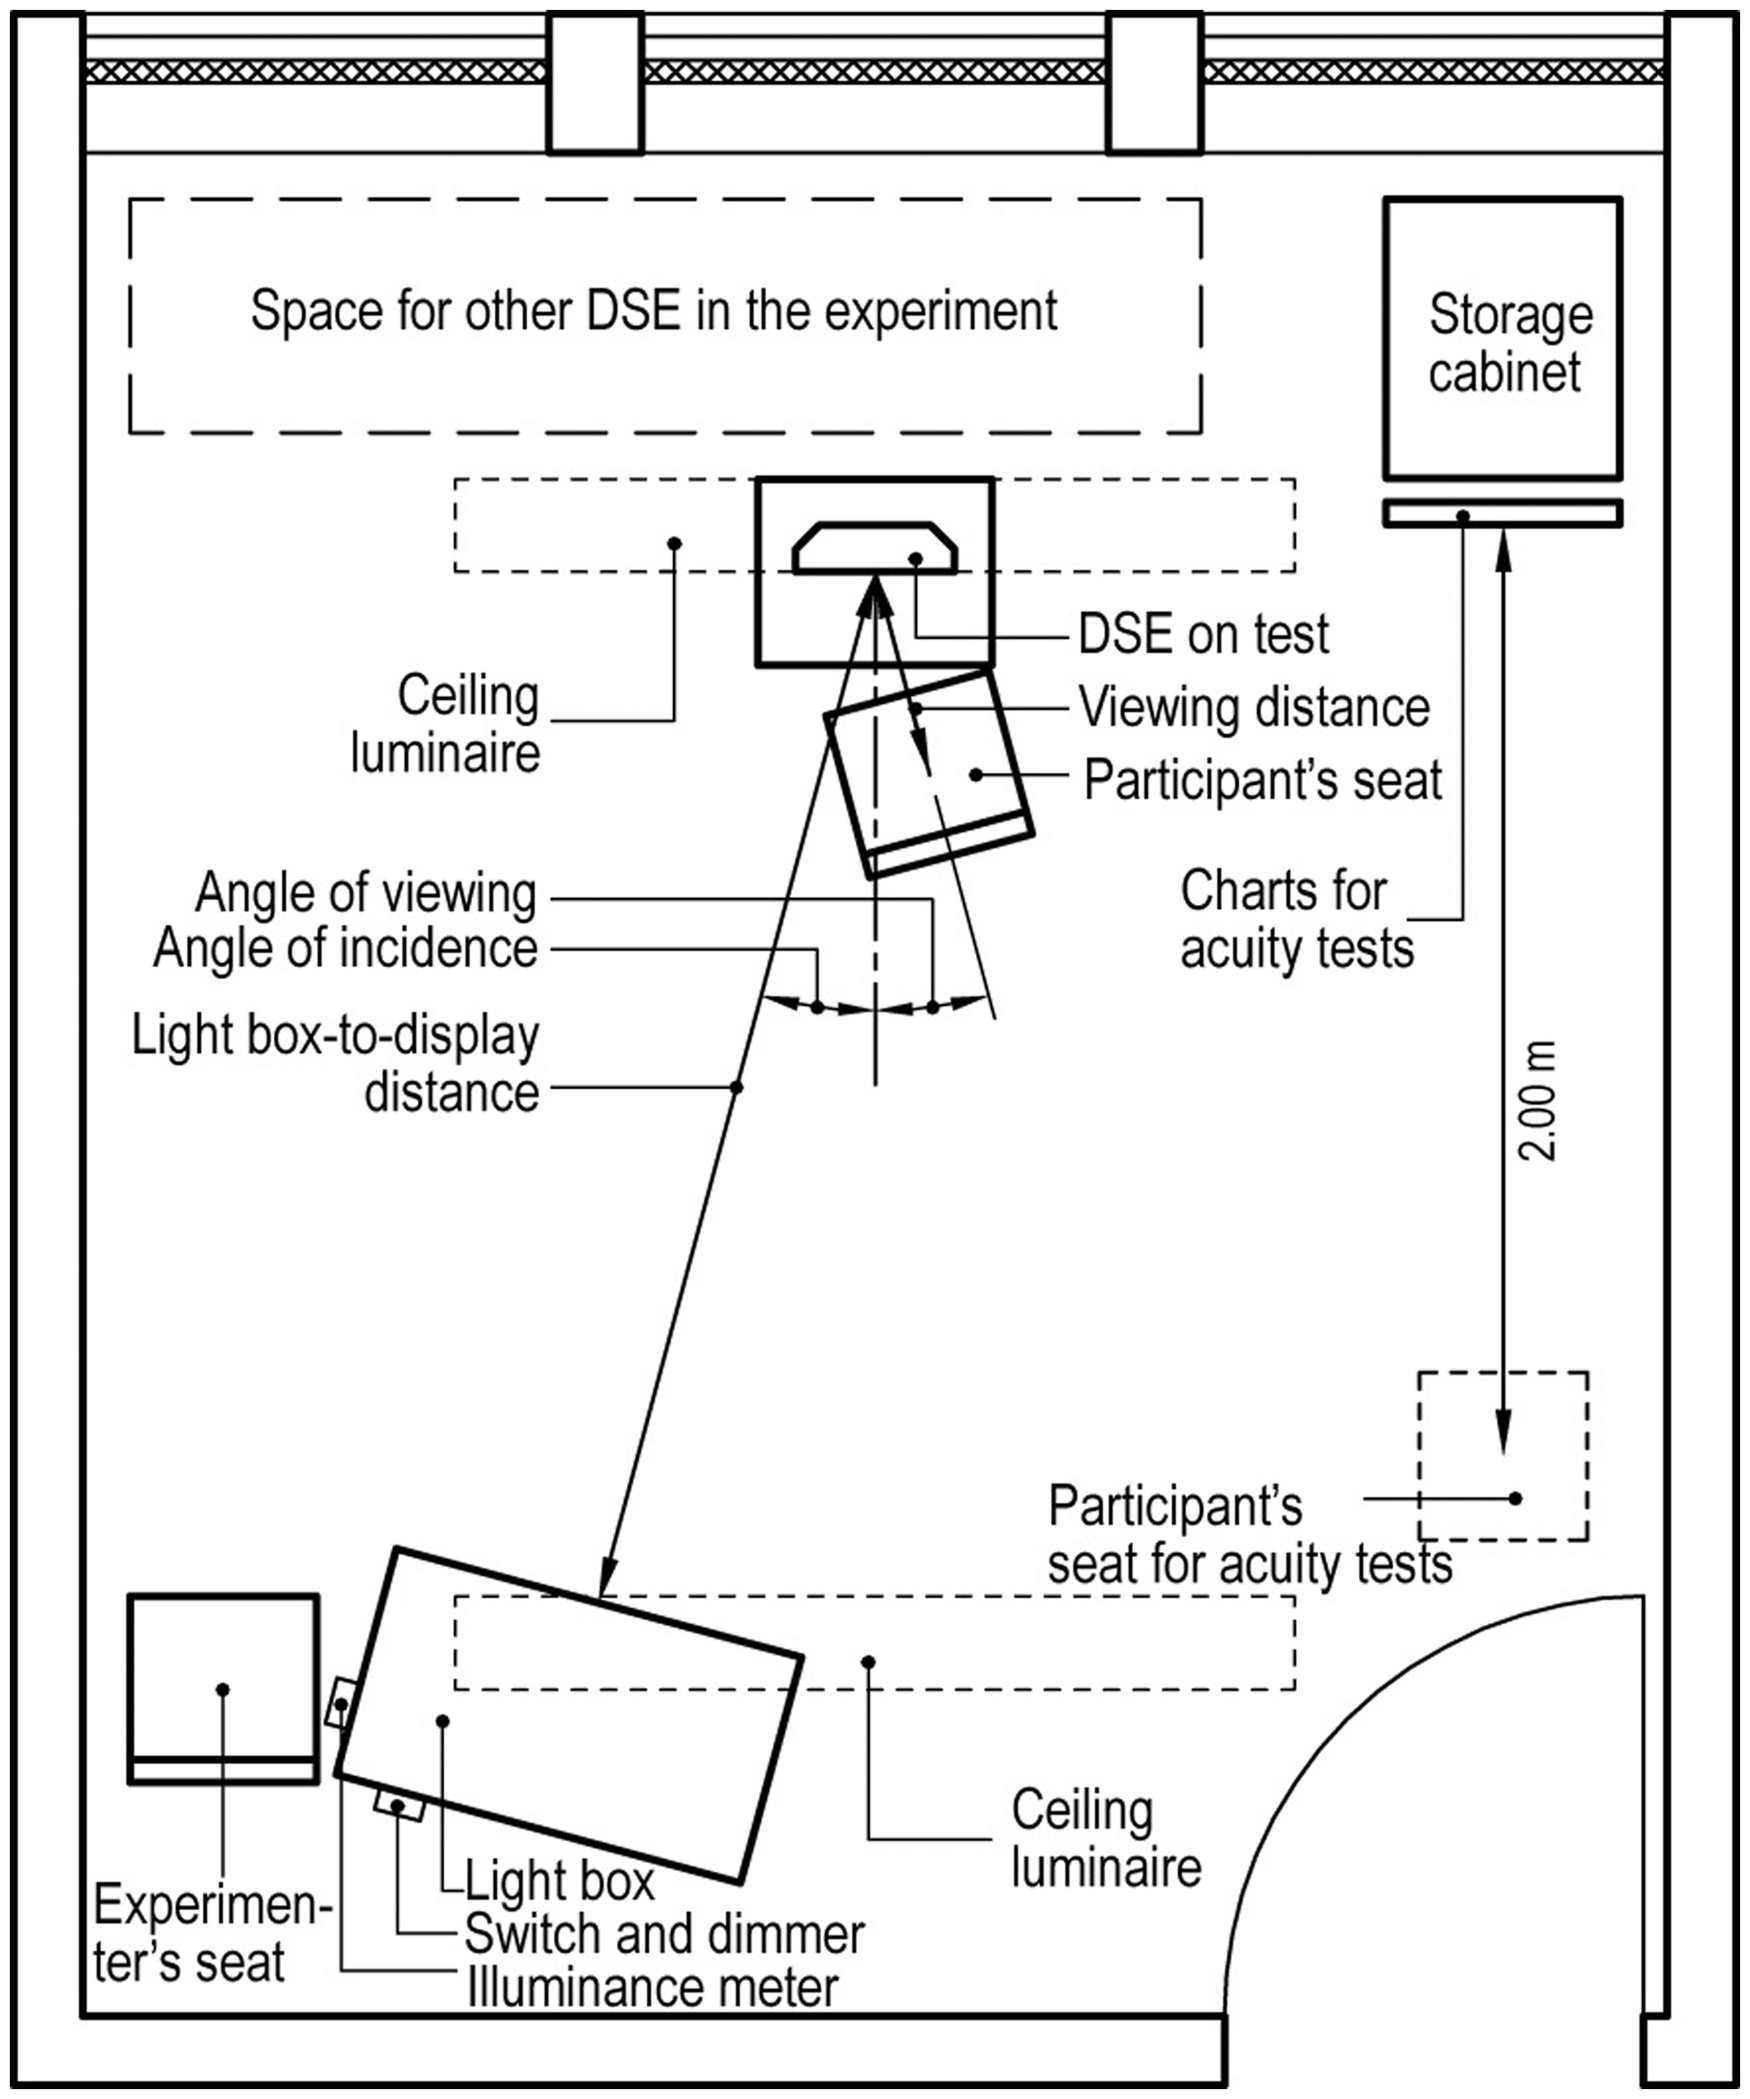
2.2. Light box
Reflections on display screens were generated using a purpose-made light box (590 mm length × 900 mm width × 400 mm depth). Inside the box there were eight fluorescent battens operating from dimming electronic ballasts (Figure 3). Each batten held two T5 21 W fluorescent lamps with a CCT of 4000 K and a CRI of 85. These lamps were dimmed with a three-turn potentiometer to reduce the possibility of giving a positional cue when it was used by an observer. The interior of the light box was painted with matt white emulsion. Light was emitted from the light box through a circular aperture fitted with an acrylic diffusing filter (transmittance 0.70 and diffusion factor 0.46) to improve the uniformity of the luminance distribution (±5% over the central 80% diameter).
Section through the light box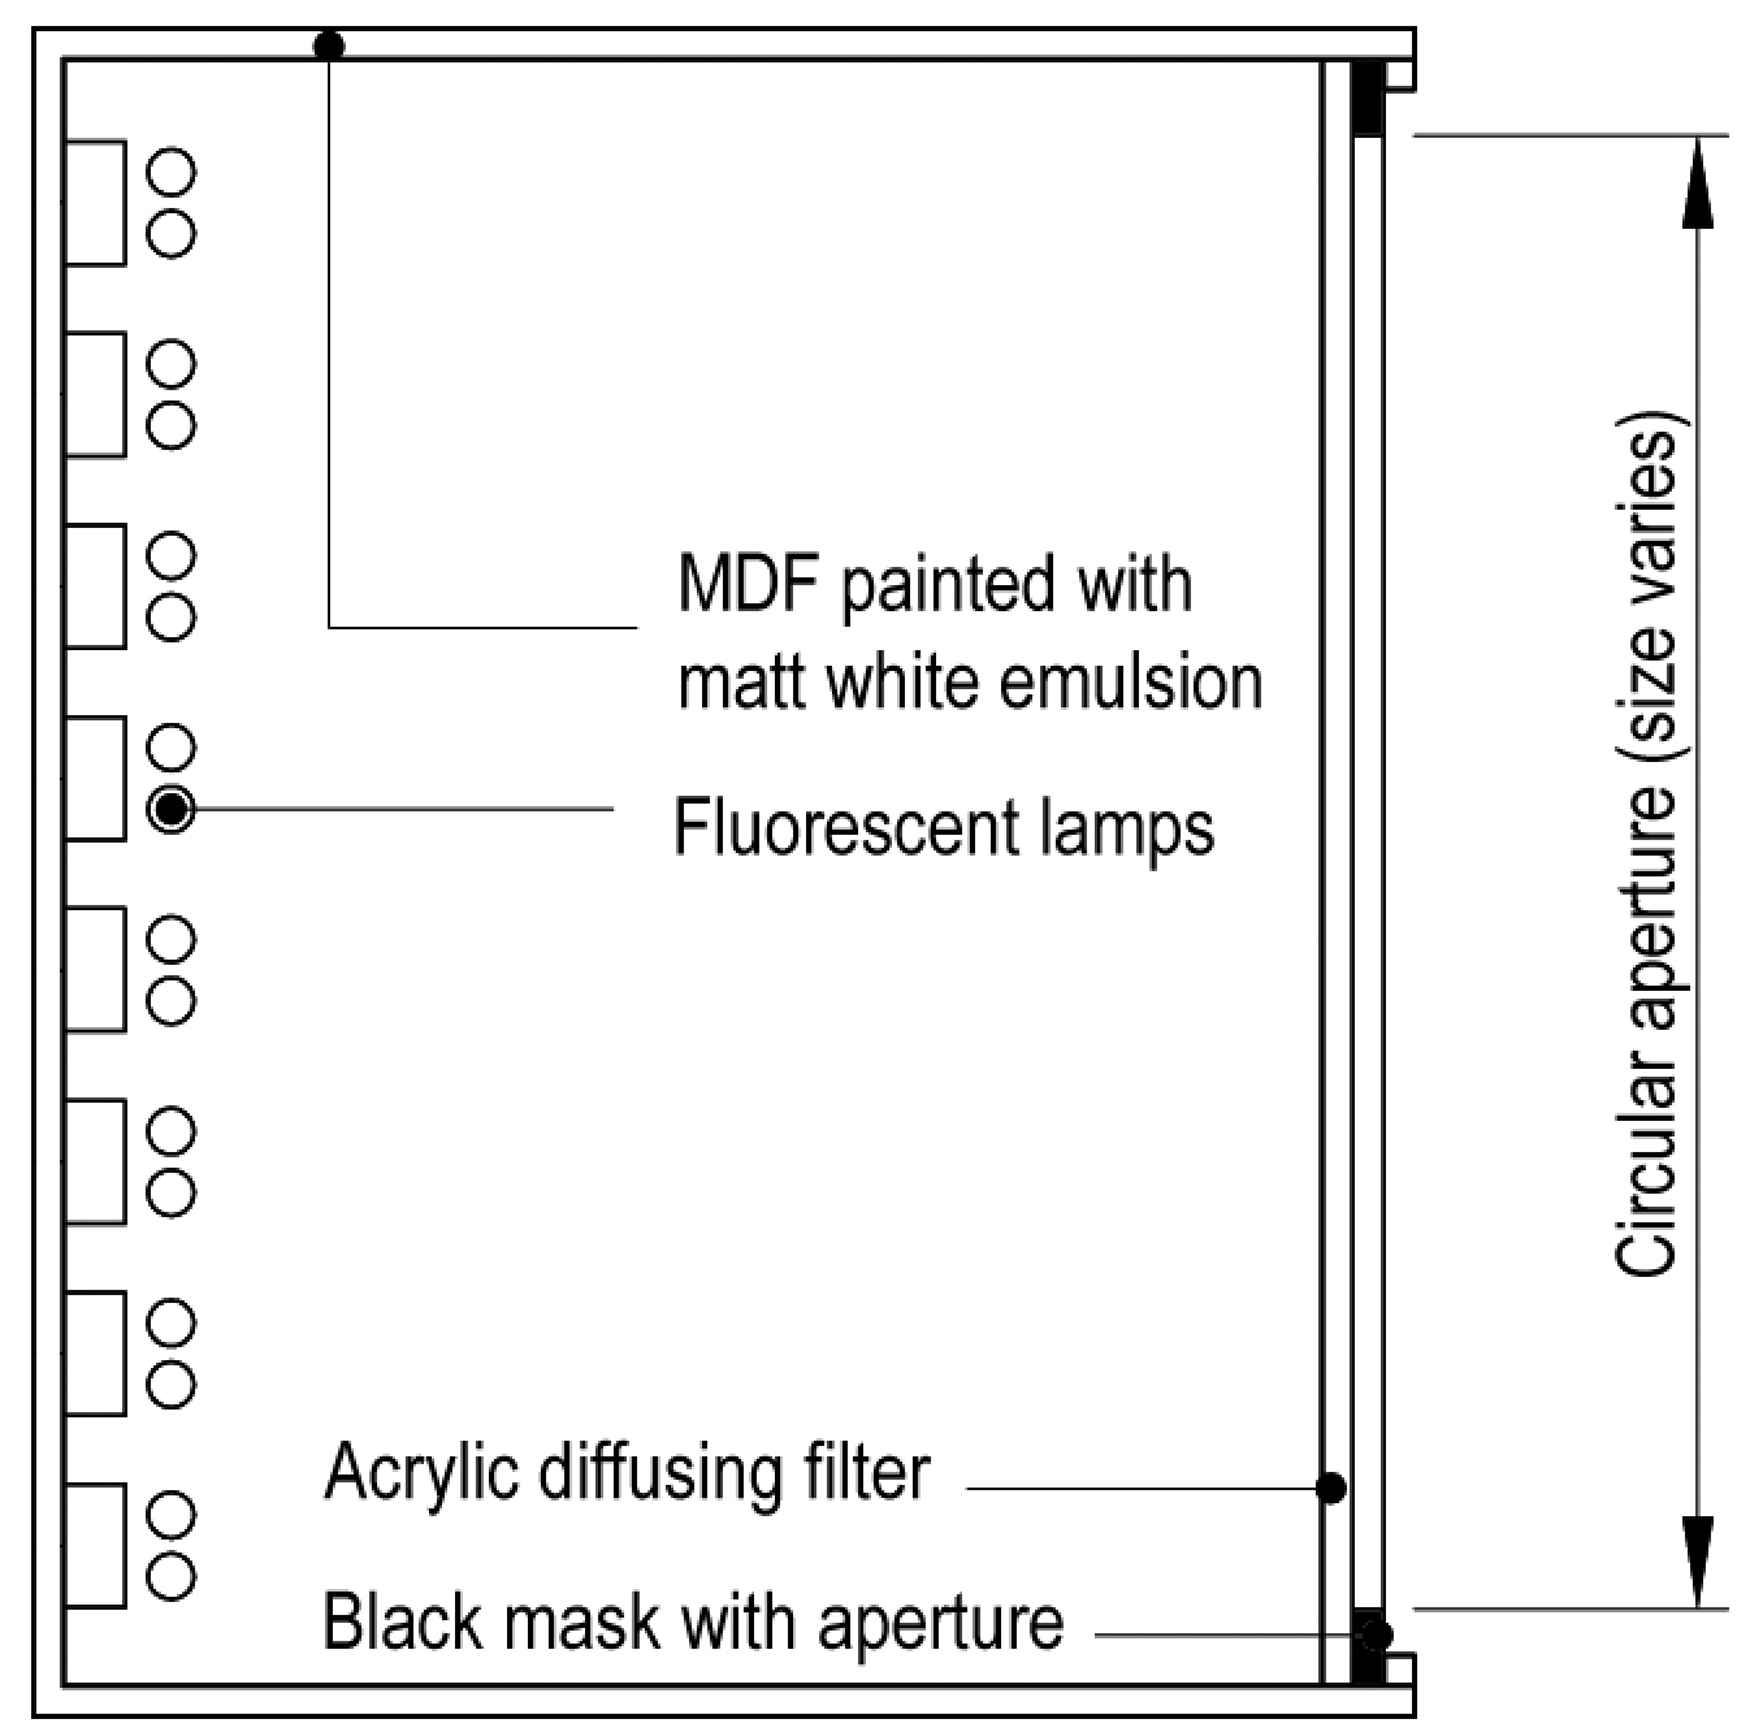
Two sizes of aperture were used, 48 mm and 480 mm diameter. With these apertures and by moving the light box to various positions to suit different screens and test conditions, three angular sizes of light source were produced subtending 1°, 10° and 15° at the eye of the observer. A pilot survey of lighting in classrooms suggested that the visual size of luminaires reflected from screens is typically less than 5° and that of windows ranges 5°–40°. The aperture subtense of 1° was taken to represent the reflection caused by a small source (luminaire) and the aperture size of 10° was chosen to represent reflection caused by a large source (window). The 15° subtense was chosen as it was one of the sizes used for the compliance test for screen reflection according to BS EN ISO 9241-7:1998 1 3 and BS EN ISO 13406-2:2001 1 4 the other being the 1° subtense.
2.3. Display screens
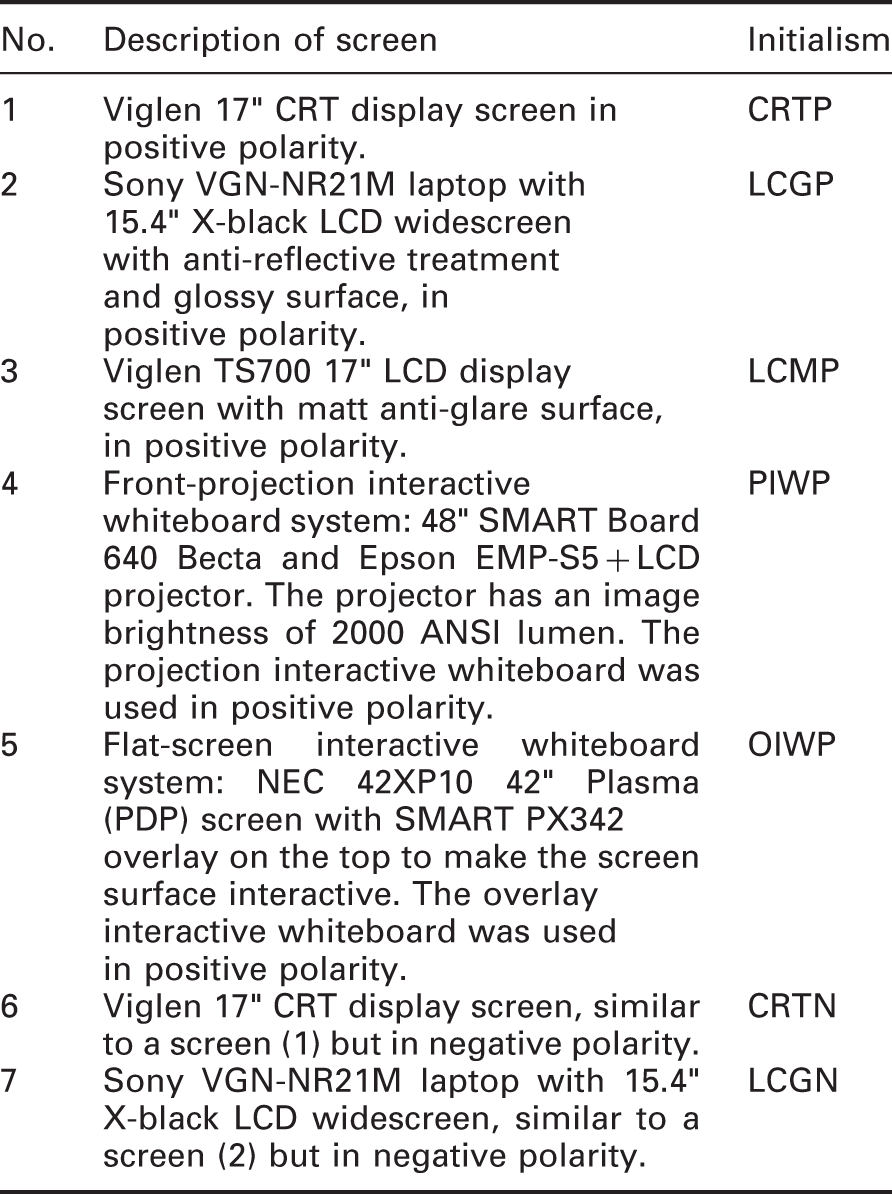
Description of the display screens and polarity conditions used
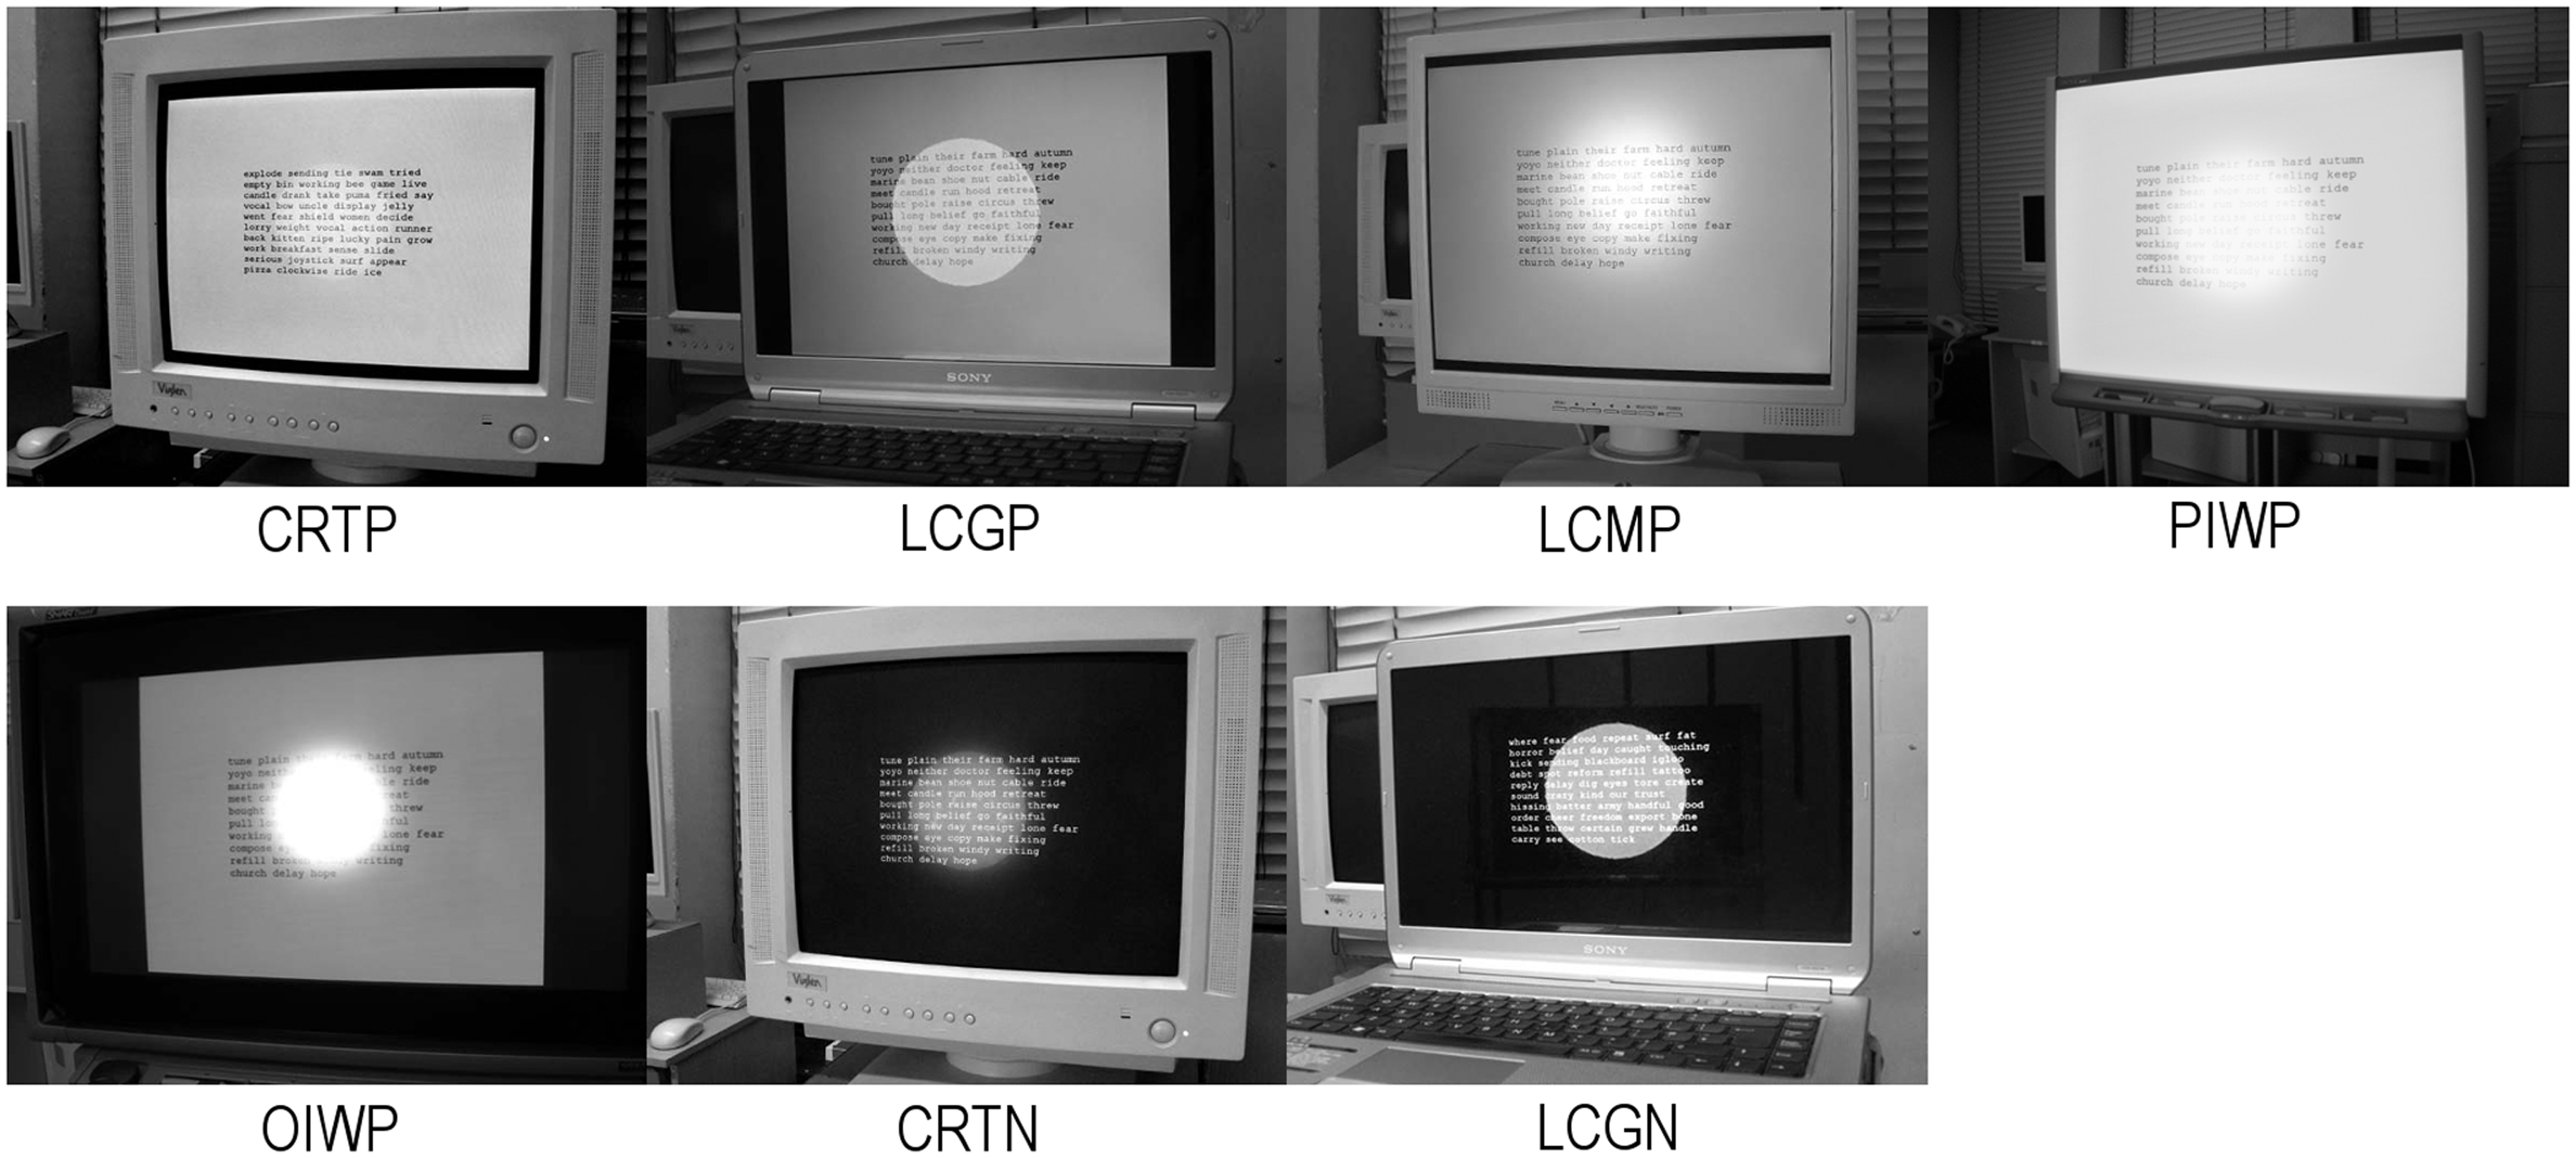
The display screens used in the tests. The reflection in these images is that from the light box with a 10° aperture


Diffuse reflectance
Summary of the display screen reflection properties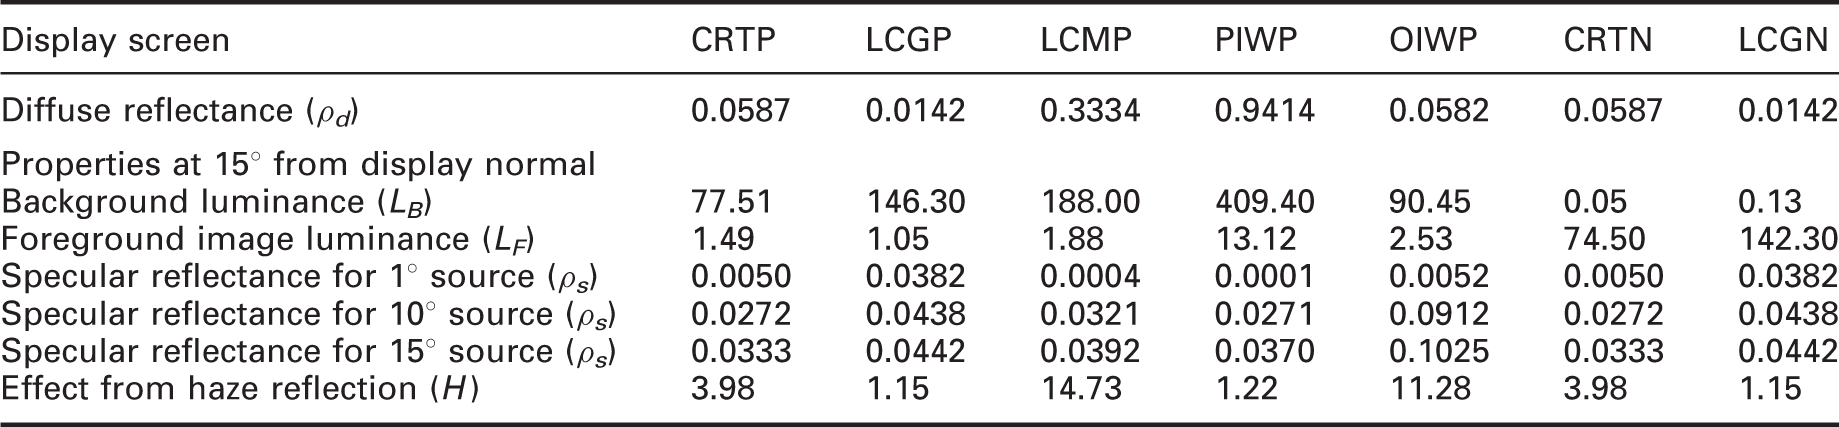
Reflectometer value for diffuse reflection
Illuminance on the display surface
Diffuse reflected luminance
Specular reflectance
Reflectometer value for specular reflection
Specular reflected luminance of the display
Specular light source luminance
Total reflected luminance due to the 15° light source
Total diffuse plus specular reflected luminance
Illuminance on the display surface due to the 15° light source
Specular reflectance for the 1° light source
Average luminance of the 15° light source
In addition to the reflection characteristics it is necessary to consider the image polarity of the display. Image polarity is the term used to describe the screen condition; negative polarity is where lighter characters are displayed on a darker background (i.e. positive contrast), while positive polarity is where darker characters are displayed on a lighter background (i.e. negative contrast). 14 While the majority of software used in classrooms tends to use positive polarity, there are some applications that feature a darker background. Such negative polarity images were expected to be more sensitive to ambient lighting so the tests were carried out for all five display screens in positive polarity and on two display screens with glossy surfaces in negative polarity. The two glossier screens were intended to represent the worse cases for comparison. Hence, there were seven display screen conditions in total (Tables 1 and 2 and Figure 4).
2.4. Viewing angles
During the experiment, the test apparatus (light box, display screen and participant's seat) was arranged so that the angle of viewing (or the angle of reflection) was equal to the angle of incidence formed by the projected line from the centre of the light box aperture to the centre of display surface and the normal of display surface (Figure 2). In ICT classrooms, some display screens, interactive whiteboards in particular, are viewed from various directions which may affect the acceptability of reflections on display screens. Two viewing angles were used: 15° and 30° from the normal to the display surface.
3. Adjustment measurements
3.1. Visual task
The adjustment test was carried out with one participant and one screen at a time. During the test, the participant sat facing the display screen on test at a designated angle (15° or 30° from normal to the screen) as shown in Figure 2. The viewing distance for each test screen was calculated so that the angular sizes of the displayed characters were the same for all screens. The display screen on test was turned on and adjusted to its maximum luminance and maximum contrast. Presented at the centre of the screen was a slide of 50 unrelated English words in Courier font. On the text on the screen was superimposed a circular reflection of the light box positioned at the angle equal to the viewing angle but on the opposite side of the screen. The distance between the light box and the display screen was varied so that the reflections were of the required size from the participant's viewing position and in the middle of the screen. The centre of the display screen on test, the centre of the aperture of the light box and the eye level of the participant were aligned at a similar height above the floor (1.10 m).
3.2. Participants
Forty participants were recruited to do the repeated-measures adjustment test, twenty aged 30 years or younger (mean age 27 years) and twenty aged 50 years old or older (mean age 63 years). The sample included female and male participants in equal proportion. Participants who normally wore spectacles or contact lenses were instructed to wear them during the experiment.
3.3. Procedure
The adjustment test was divided into 38 blocks, corresponding to the 38 combinations of display screen (7 levels), size of light box aperture (3 levels) and viewing angle (2 levels). All display screens were tested with 1° and 10° apertures of the light box. The 15° aperture was tested with the 5 PC screens only (CRTP, LCGP, LCMP, CRTN and LCGN). All pairs of display screen and aperture size were tested with both the 15° and 30° viewing angle. The order of these combinations was randomised.
The adjustment procedure was adapted from the methods used in previous studies to find the disturbance borderline of subjects8,10 by adjusting the luminance of the screen reflection. In this study, there are three visual criteria used in the luminance adjustment: Disturbance, contrast and clarity borderlines. The disturbance borderline was defined as the level of discomfort that would be just disturbing and could be tolerated for 15 to 30 minutes but that would require a change in lighting condition for any longer period. This criterion is similar to that used in previous studies by Hentschel et al. 8 and Pawlak and Roll 10 the latter being the referenced basis of BS EN ISO 9241-7:1998 and BS EN ISO 13406-2:2001.13,14 The contrast borderline was defined as the minimum luminance contrast of the text that would allow confident, immediate letter recognition without prolonged scrutiny. The clarity borderline was defined as the clarity of the text outline that would allow confident, immediate letter recognition without prolonged scrutiny. When assessing contrast or clarity of the text, the participants were told to base their judgement on the area of the text that coincided with the reflection.
At the beginning of each adjustment trial the light box luminance was set at either the highest or the lowest level permitted by the dimming mechanism. This starting level was counterbalanced. The experimenter stated the visual criterion used for that trial and then asked the participant to read the text on the screen with the reflection superimposed and use his/her judgement to increase or reduce the light box luminance until the borderline was found. Having recorded the borderline level, the experimenter asked the participant to reset the light box luminance to the starting level and begin the trial for the next visual criterion. This process was repeated until all three adjustment trials were done. The test combination was then changed and the experimenter instructed the participant to begin another session of three adjustment trials. The process was repeated until all 38 combinations were completed.
3.4. Results
Disturbance borderline luminances of seven display screens
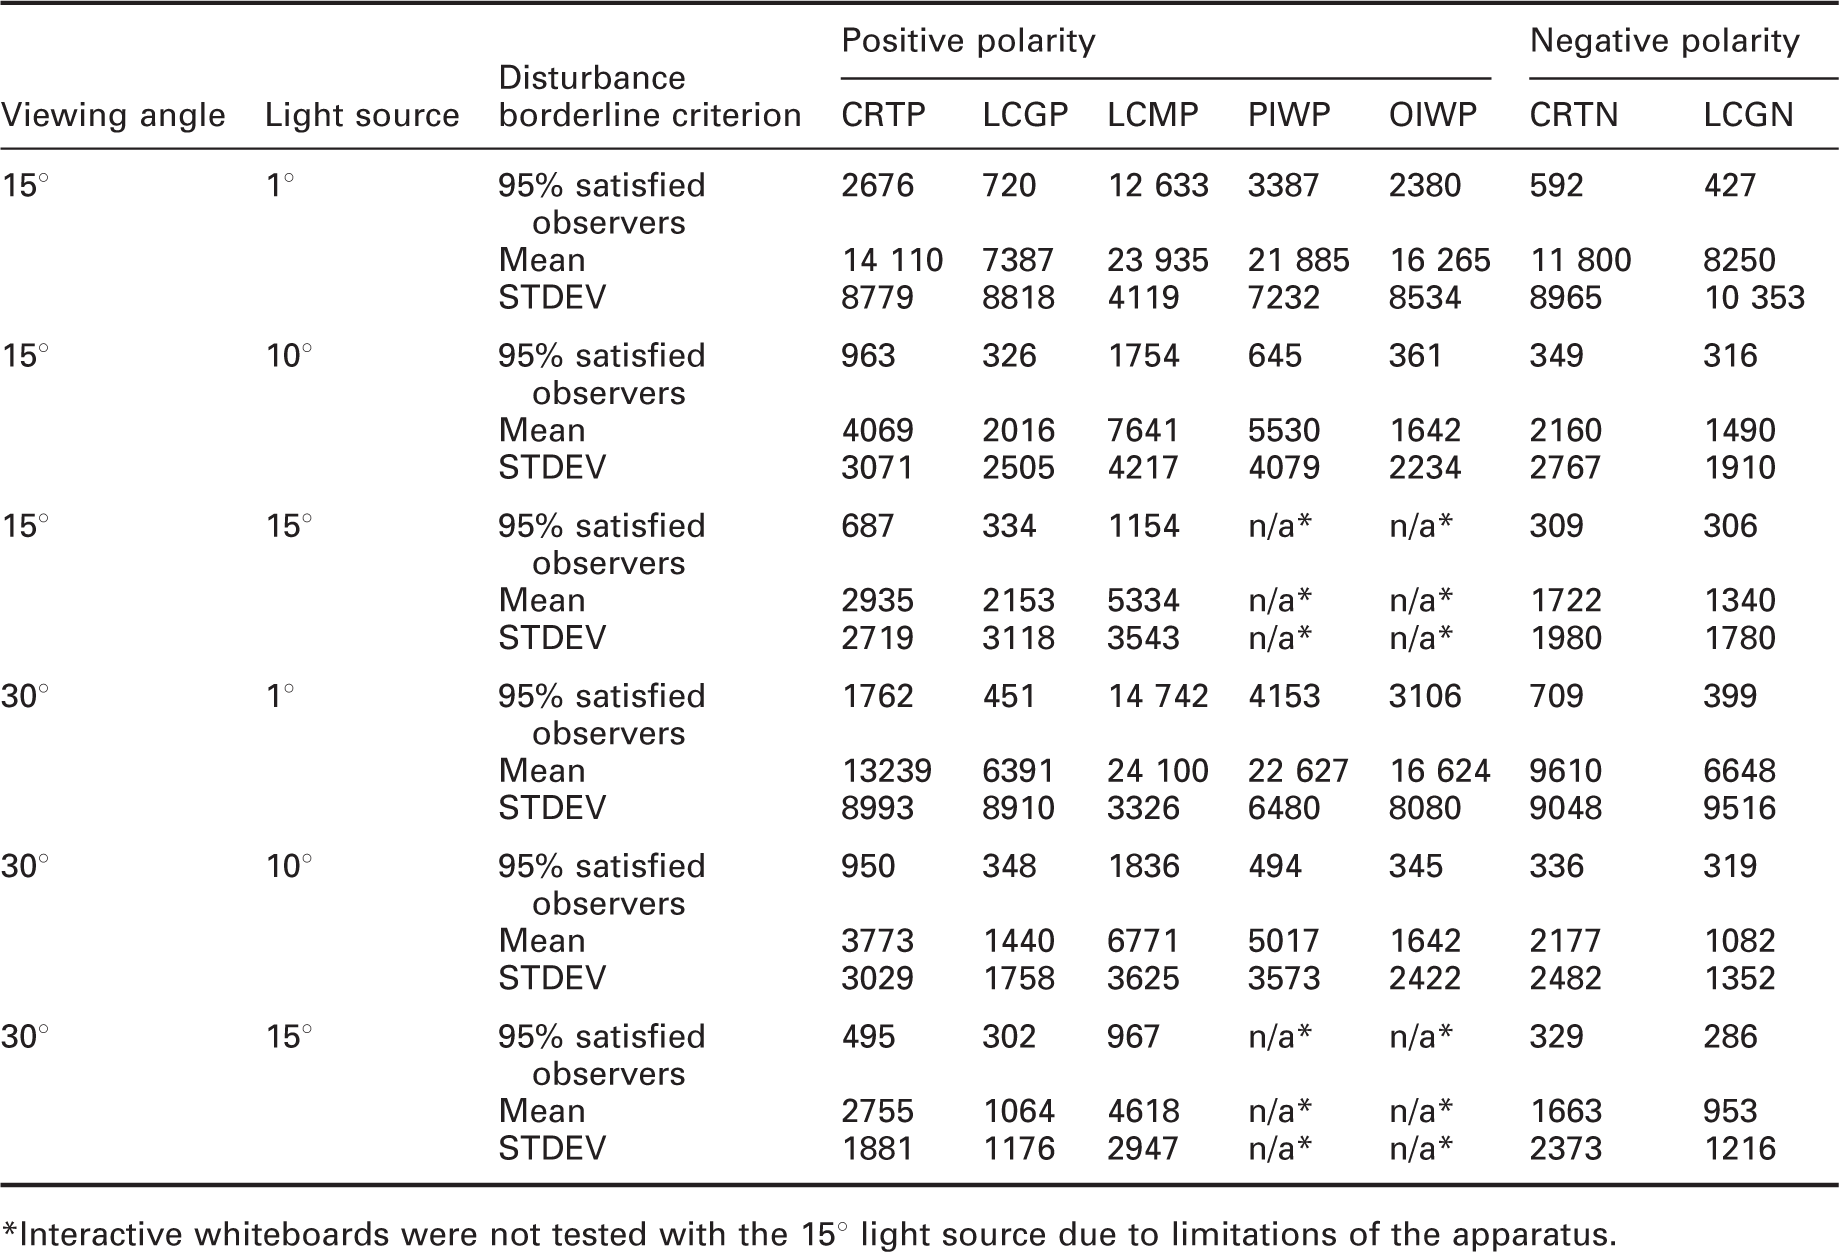
Interactive whiteboards were not tested with the 15° light source due to limitations of the apparatus.
Figure 5 compares the luminances at the disturbance, contrast and clarity borderlines of the seven display screens, satisfactory to 95% of the participants, for the 10° source at the 15° viewing angle. The overall trend evident is that the disturbance borderline luminances were typically lower than those of the contrast and clarity borderlines. This means that as the light source luminance increases, the screen reflection will become disturbing before the contrast and clarity of the displayed text become unacceptable. The three borderlines were also strongly positively correlated; there were significant correlations between the disturbance and contrast borderlines (r = 0.86, p < 0.01), between the disturbance and clarity borderlines (r = 0.87, p < 0.01), and between the contrast and clarity borderlines (r = 0.90, p < 0.01). This means that it is likely that a display-lighting combination with a high disturbance borderline also has a high contrast borderline and a high clarity borderline. This suggests that the disturbance borderline should be the critical criterion in determining the limit of luminaire luminance. If the light source luminance is restricted to below the disturbance borderline, it is likely that the contrast and the clarity of the displayed text will still be acceptable to the observers.
Luminances at the disturbance, contrast and clarity borderlines tested with the 10° light source at 15° viewing angle, showing the luminances satisfactory to 95% of participants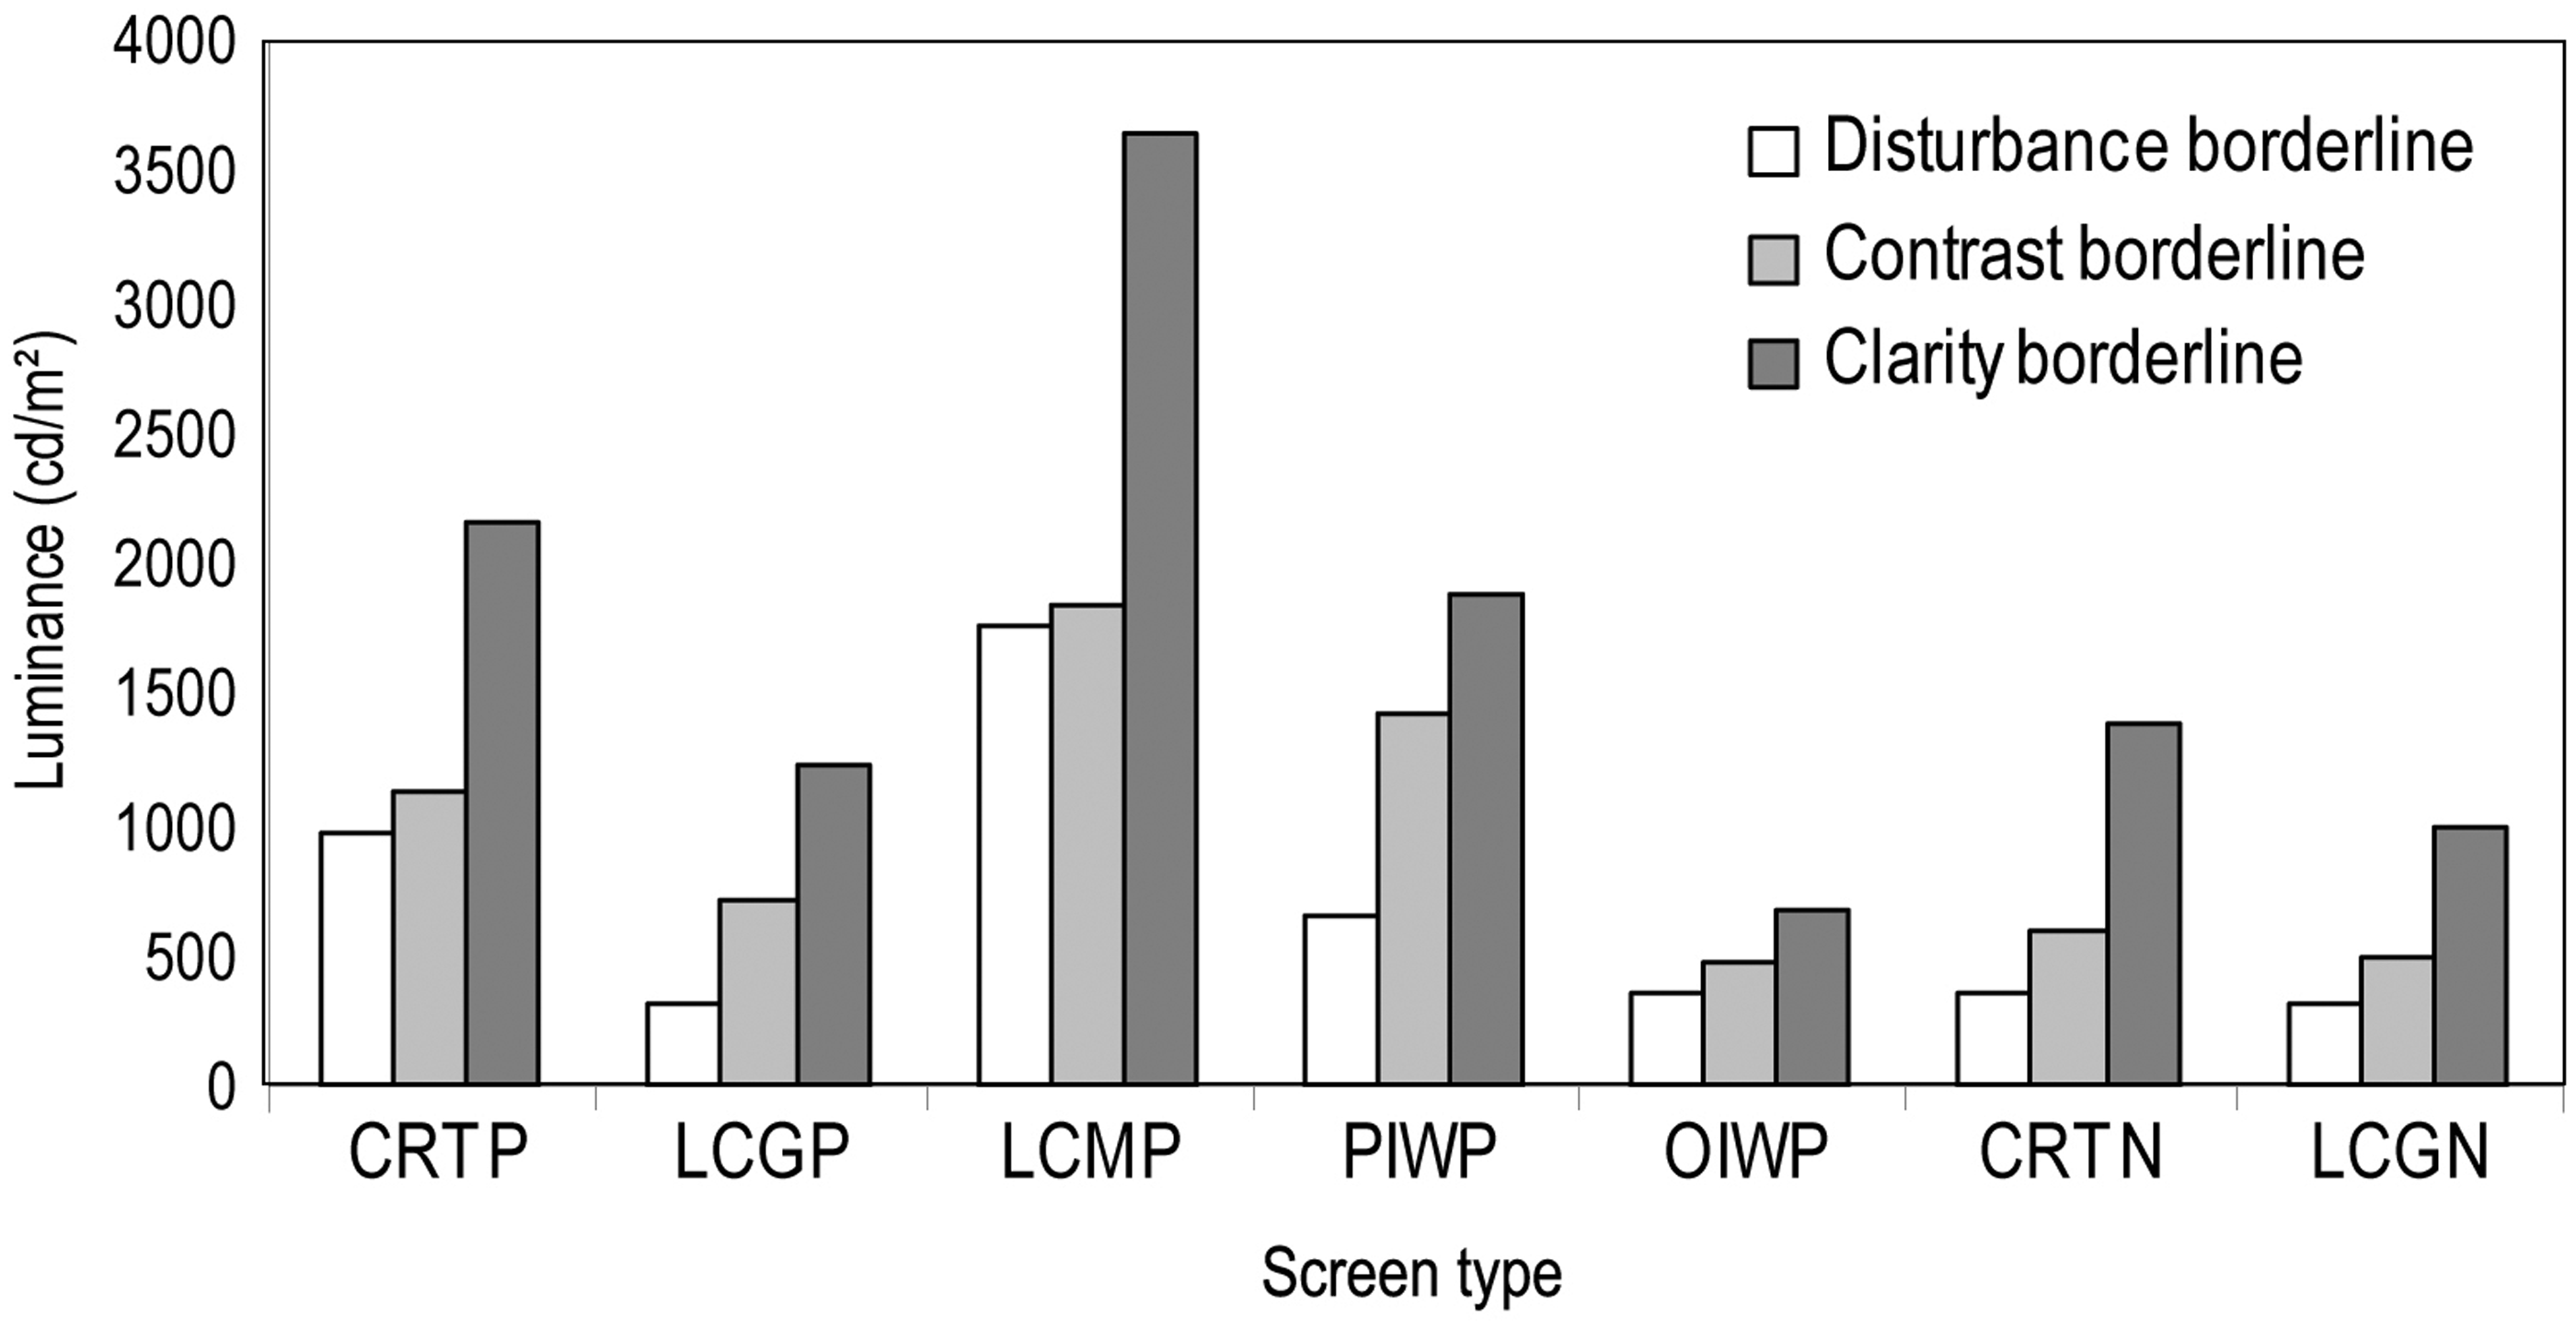
It can also be seen from Figure 5 that the luminances at the disturbance borderline for the seven different display screens are different. The borderline levels of the negative polarity screens (CRTN, LCGN) are lower than those for the low gloss, positive polarity screens (CRTP, LCMP and PIWP). Among the positive polarity screens, the borderline luminances for the high gloss screens (LCGP, OIWP) are lower than those for the low gloss screens (CRTP, LCMP, PIWP). The disturbance borderline luminances obtained at the 15° and 30° viewing angles follow the same trend. Table 3 also shows that the borderline luminances for all display screens decreased as the size of the source of reflection increased.
These observations are supported by statistical analysis. A repeated-measures ANOVA was performed to determine the effect of display screen type, light source size and viewing angle on the disturbance borderline. Since the data were highly scattered, it was decided to apply a log transform to the luminances to reduce the effect of the extreme values. The analysis with seven screens, two viewing angles and two sizes of light source revealed statistically significant main effects of display screen type (p < 0.01), light source size (p < 0.01) and viewing angle (p < 0.01). There were also significant interactions between the type of screen and the size of light source (p < 0.01) and between the screen type and the viewing angle (p < 0.01). It was interesting that the effect of viewing angle seems to be less sensitive than all other variables. There was no significant interaction between the viewing angle and the size of light source (p = 0.77).
A mixed design ANOVA was also carried out to determine the effect of age group ondisturbance borderline. The analysis with seven screens, two viewing angles, two sizes of light source and two age groups showed that the main effect of age group was not statistically significant (p = 0.87). In addition, there were no significant interactions involving age group. These results clearly indicated that the age group of the participants did not significantly affect their disturbance borderlines.
4. Category rating and reading measurements
4.1. Visual task
During the category rating and reading measurements, the screen being assessed displayed a set of 50 random words for participants to read. Random words have been used in a number of studies in vision to provide a reliable and context-free measure of visual capacity.17,18 In all, ten sets of 50 words were used. The words in each set were randomly chosen from the ‘Spelling Bank: Lists of words and activities for KS2 spelling objectives, the Natural Literacy Strategy’, 19 which was designed for pupils aged between 8 and 11 years. To determine if the different sets of words influenced reading capacity, a pilot study was carried out with 20 participants reading the 10 sets of words in randomised order. Statistical analysis (ANOVA) did not suggest that the reading speed was significantly affected by the set of the words used (p = 0.92).
4.2. Participants
Forty participants were recruited to do therepeated-measures category rating and reading tests, these being carried out simultaneously. Around three quarters of participantswere university students. The age of participants ranged from 18 to 70 years (mean 35 years). The sample included similar proportions of female (45%) and male (55%) participants. Nineteen participants wore corrective lenses during the trial.
4.3. Procedure
The arrangement of apparatus for the category rating and reading measurements was the same as for the adjustment test (Figure 2). The category rating and reading measurements were carried out together in the same experimental session. The experiment was divided into 16 blocks, corresponding to the 16 combinations of display screen, size of light source and viewing angle. The measurements were made for seven display screens, each screen being examined for two sizes of light source (1° and 10°). These 14 combinations were examined at a 15° viewing angle. Two more combinations using a 30° viewing angle were added in order to study the effect of viewing angle on the two interactive whiteboards. The order of test condition combinations seen by the participants was counterbalanced. In each block, a participant was required to complete four trials of reading and rating tests with the reflection at four different luminances. These luminances were 2000, 5000, 10 000 and 20 000 cd/m2 for the 1° source and 500, 1000, 3000 and 5000 cd/m2 for the 10° source. The order of the four luminances was also counterbalanced. The test was then repeated with other combinations until all sessions were done. There were 16 blocks or 64 (16 × 4) trials in total which took about 2 hours to complete.
To start the reading measurement, the experimenter set the light box luminance to a predetermined level. Once the participant was ready, he or she was instructed to click a mouse connected to a computer controlling the screen under test. Three countdown slides appeared, followed by a slide of the 50 words cued with a ‘beep’ sound. The participant then started reading aloud through the words as quickly as he or she could. If any word was read incorrectly, the experimenter gave an immediate signal that the participant must re-read the word again. Reading time for the set of 50 words was measured using a stopwatch.
After reading the 50 words, the participant was required to do the category rating test. For each combination of light source size, viewing angle and display screen, participants gave their assessments about the conditions seen on the display screen by answering one question and giving three ratings, each along a 6-point scale.
Can you see any reflection on the screen? Yes/No.
Participants reported whether they could see a reflection on the screen on test. If the reflection outline was not well-defined but the participants could notice that there was a brighter area on the display screen, they were instructed to answer ‘Yes'.
Please rate the disturbance of the reflection while reading the text.
Participants gave a ‘Disturbance’ rating from 1 (very disturbing) to 6 (not at all disturbing).
Please rate the acceptability of the contrast of the text shown on the screen.
Participants gave a ‘Contrast’ rating from 1 (highly unacceptable or poor to read) to 6 (highly acceptable or good to read). Participants were told to base their contrast ratings only onthe part of the text that coincided with reflection.
Please rate the clarity or distinctness of the text shown on the screen.
Participants gave a ‘Clarity’ rating from 1 (hazy or very blurred) to 6 (focused or very sharp). Participants were told to base their clarity ratings only on the part of the text that coincided with reflection.
Note that in a pilot test it was found that the reflection caused by the 1° light source was too small for an accurate assessment of the contrast and clarity of the text to be made. Therefore, for the combinations including the 1° source, the participants were required to give a rating for disturbance of the reflection only.
Having finished the reading speed measurement, answered the Yes/No question and given the category ratings, the participant informed the experimenter who then adjusted the light box luminance to the next predetermined level and let the participant click a mouse to start a new trial. This procedure was repeated until the reading and rating measurements were completed at four luminances for the given combination of light source size, viewing angle and display screen. After that the experimenter told the participant to rest their eyes while another block of trials was prepared. This process was repeated until all the experimental combinations had been examined.
4.4. Reading speed results
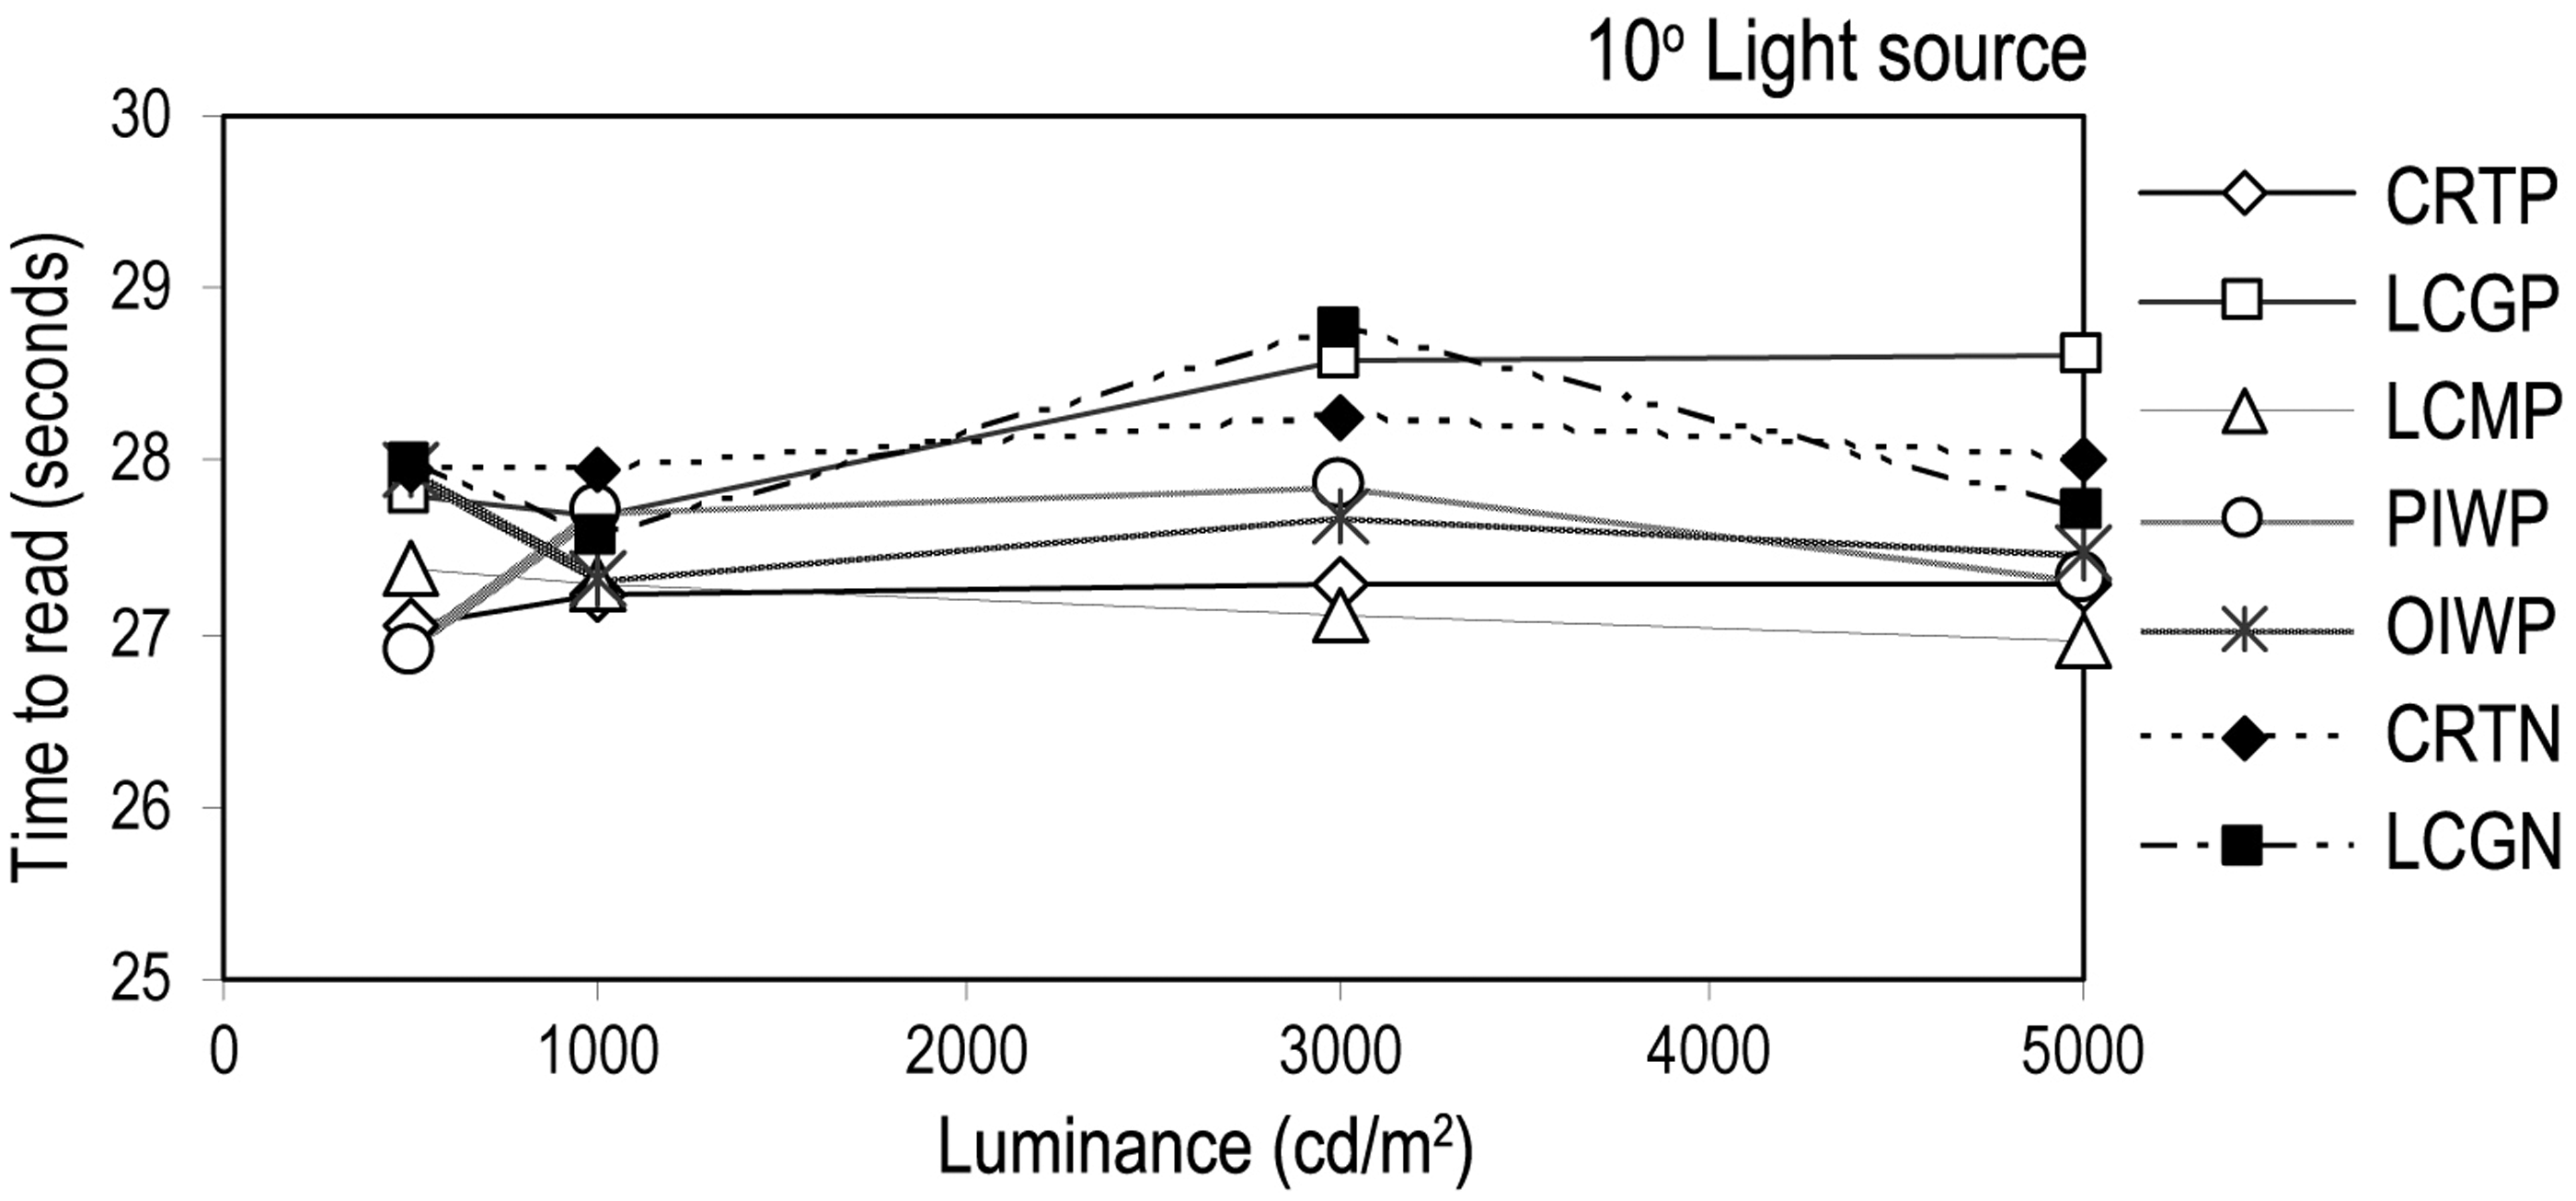
In the reading test, the participants' responses to screen reflections were measured by the time taken to read aloud 50 random words. Figures 6 and 7 show the mean reading times for the different screens plotted against the luminances for the 1° and 10° light sources, respectively. It can be seen that as the luminance of the reflected light source increased, the mean reading times changed only slightly over a wide range of luminances for both sizes of light source and all screen types. Statistical analyses using ANOVA for the effects of screen types and luminance were carried out for the 1° and 10° light sources separately because different sets of four luminances were used for the two sizes of light source. The only statistically significant effect found was a main effect of luminance for the 1° source (p < 0.01), this effect being a tendency to shorter reading times with higher luminances.
Mean time taken by participant to read aloud 50 random words on seven display screens, tested with the 1° light source Mean time taken by participant to read aloud 50 random words on seven display screens, tested with the 10° light source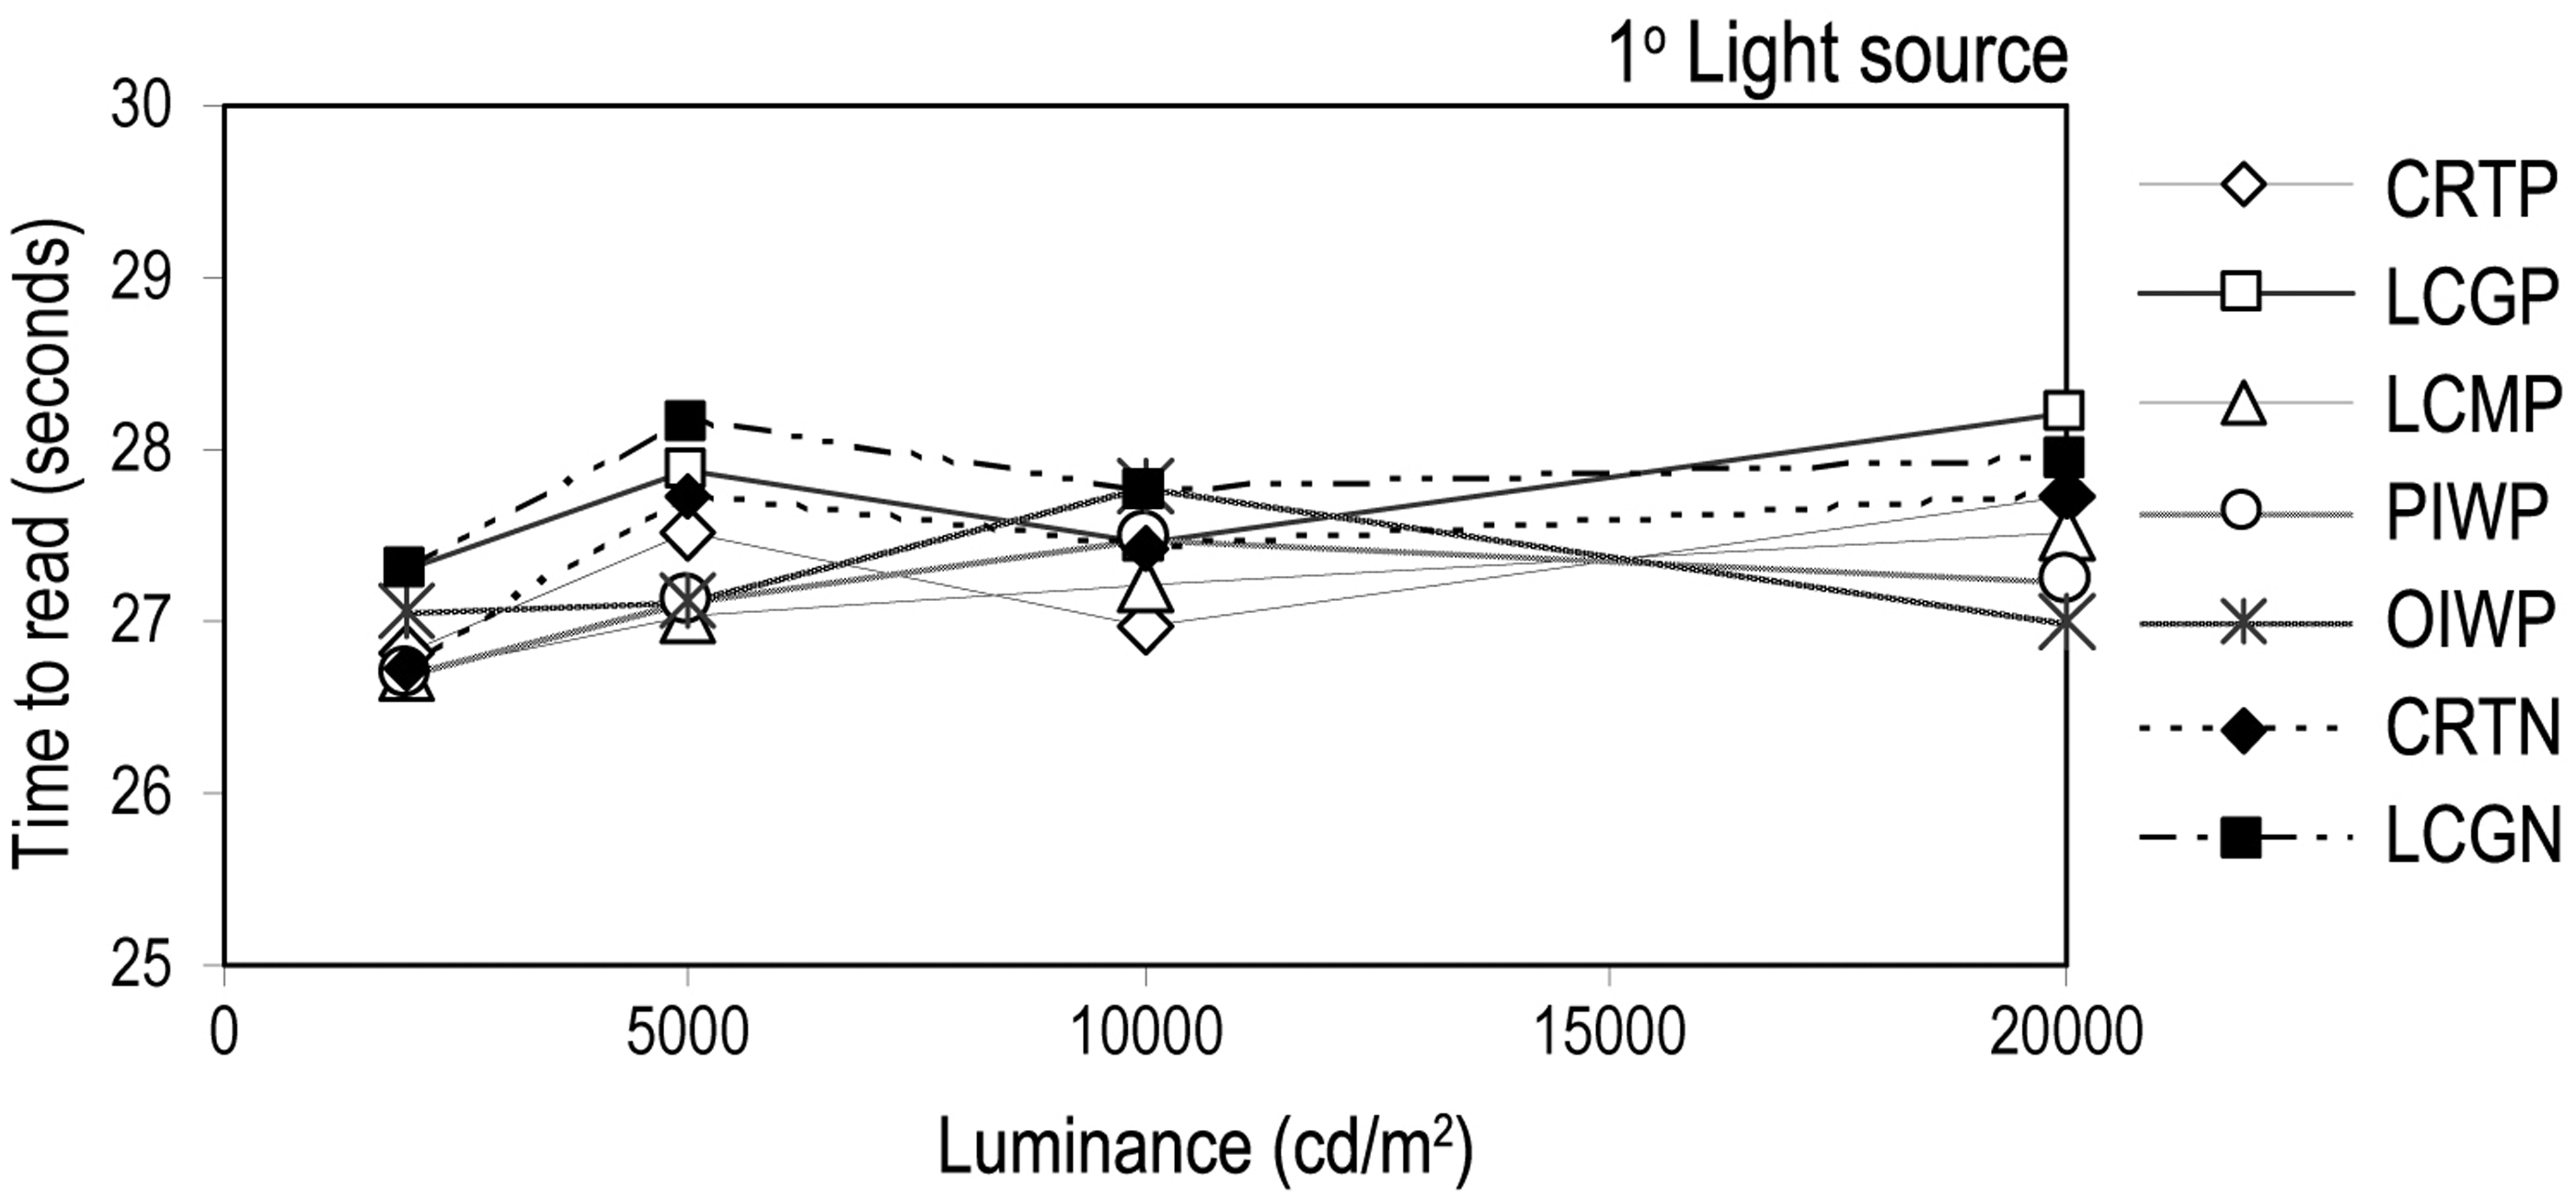
For the interactive whiteboards which are normally viewed from a variety of angles, the effect of viewing angle on reading time was investigated using a repeated measures ANOVA with three independent variables of screen type (2 levels), angles of viewing (2 levels) and luminance (4 levels). The only statistically significant effect was a main effect of viewing angle (p < 0.01). Specifically, the mean time taken to read the words when the screen was viewed at 15° was significantly less than the mean reading time when the screen was viewed at 30° from the normal to the screen. In other words, the reading speed was higher at the smaller viewing angle. It maybe that this effect was caused by the increase in difficulty of reading text as the angle from the display normal increased rather than any effect of disturbing reflections.
4.5. Category rating results
In general, the percentage of participants noticing reflections on seven test screens increased with luminance of the reflected light source. In most test conditions, 90–100% of participants reported that they could notice reflections on the test screens, the exceptions being the LCMP and PIWP screens. For the LCMP screen, 5–10% of the participants noticed reflections when the 1° light source was used, this percentage increasing when the 10° light source was used. For PIWP screen, the percentage of participants noticing reflections ranged 60%–80%, depending on the size and the luminance of the light source.
Figures 8 and 9 show the mean ratings of disturbance for all the screens plotted against luminance, for the 1° and 10° light sources, respectively. Figures 10 and 11 shown the mean ratings of contrast and clarity, respectively, for all the screens, plotted against luminance for the 10° light source. All these figures have a common trend: The mean ratings decrease in a non-linear manner as the luminance of the reflected light source increases. Wang observed a similar non-linear trend in his study which also used the category rating method.
11
Mean disturbance rating of seven display screens, tested with the 1° light source Mean disturbance rating of seven display screens, tested with the 10° light source Mean contrast rating of seven display screens, tested with the 10° light source Mean clarity rating of seven display screens, tested with the 10° light source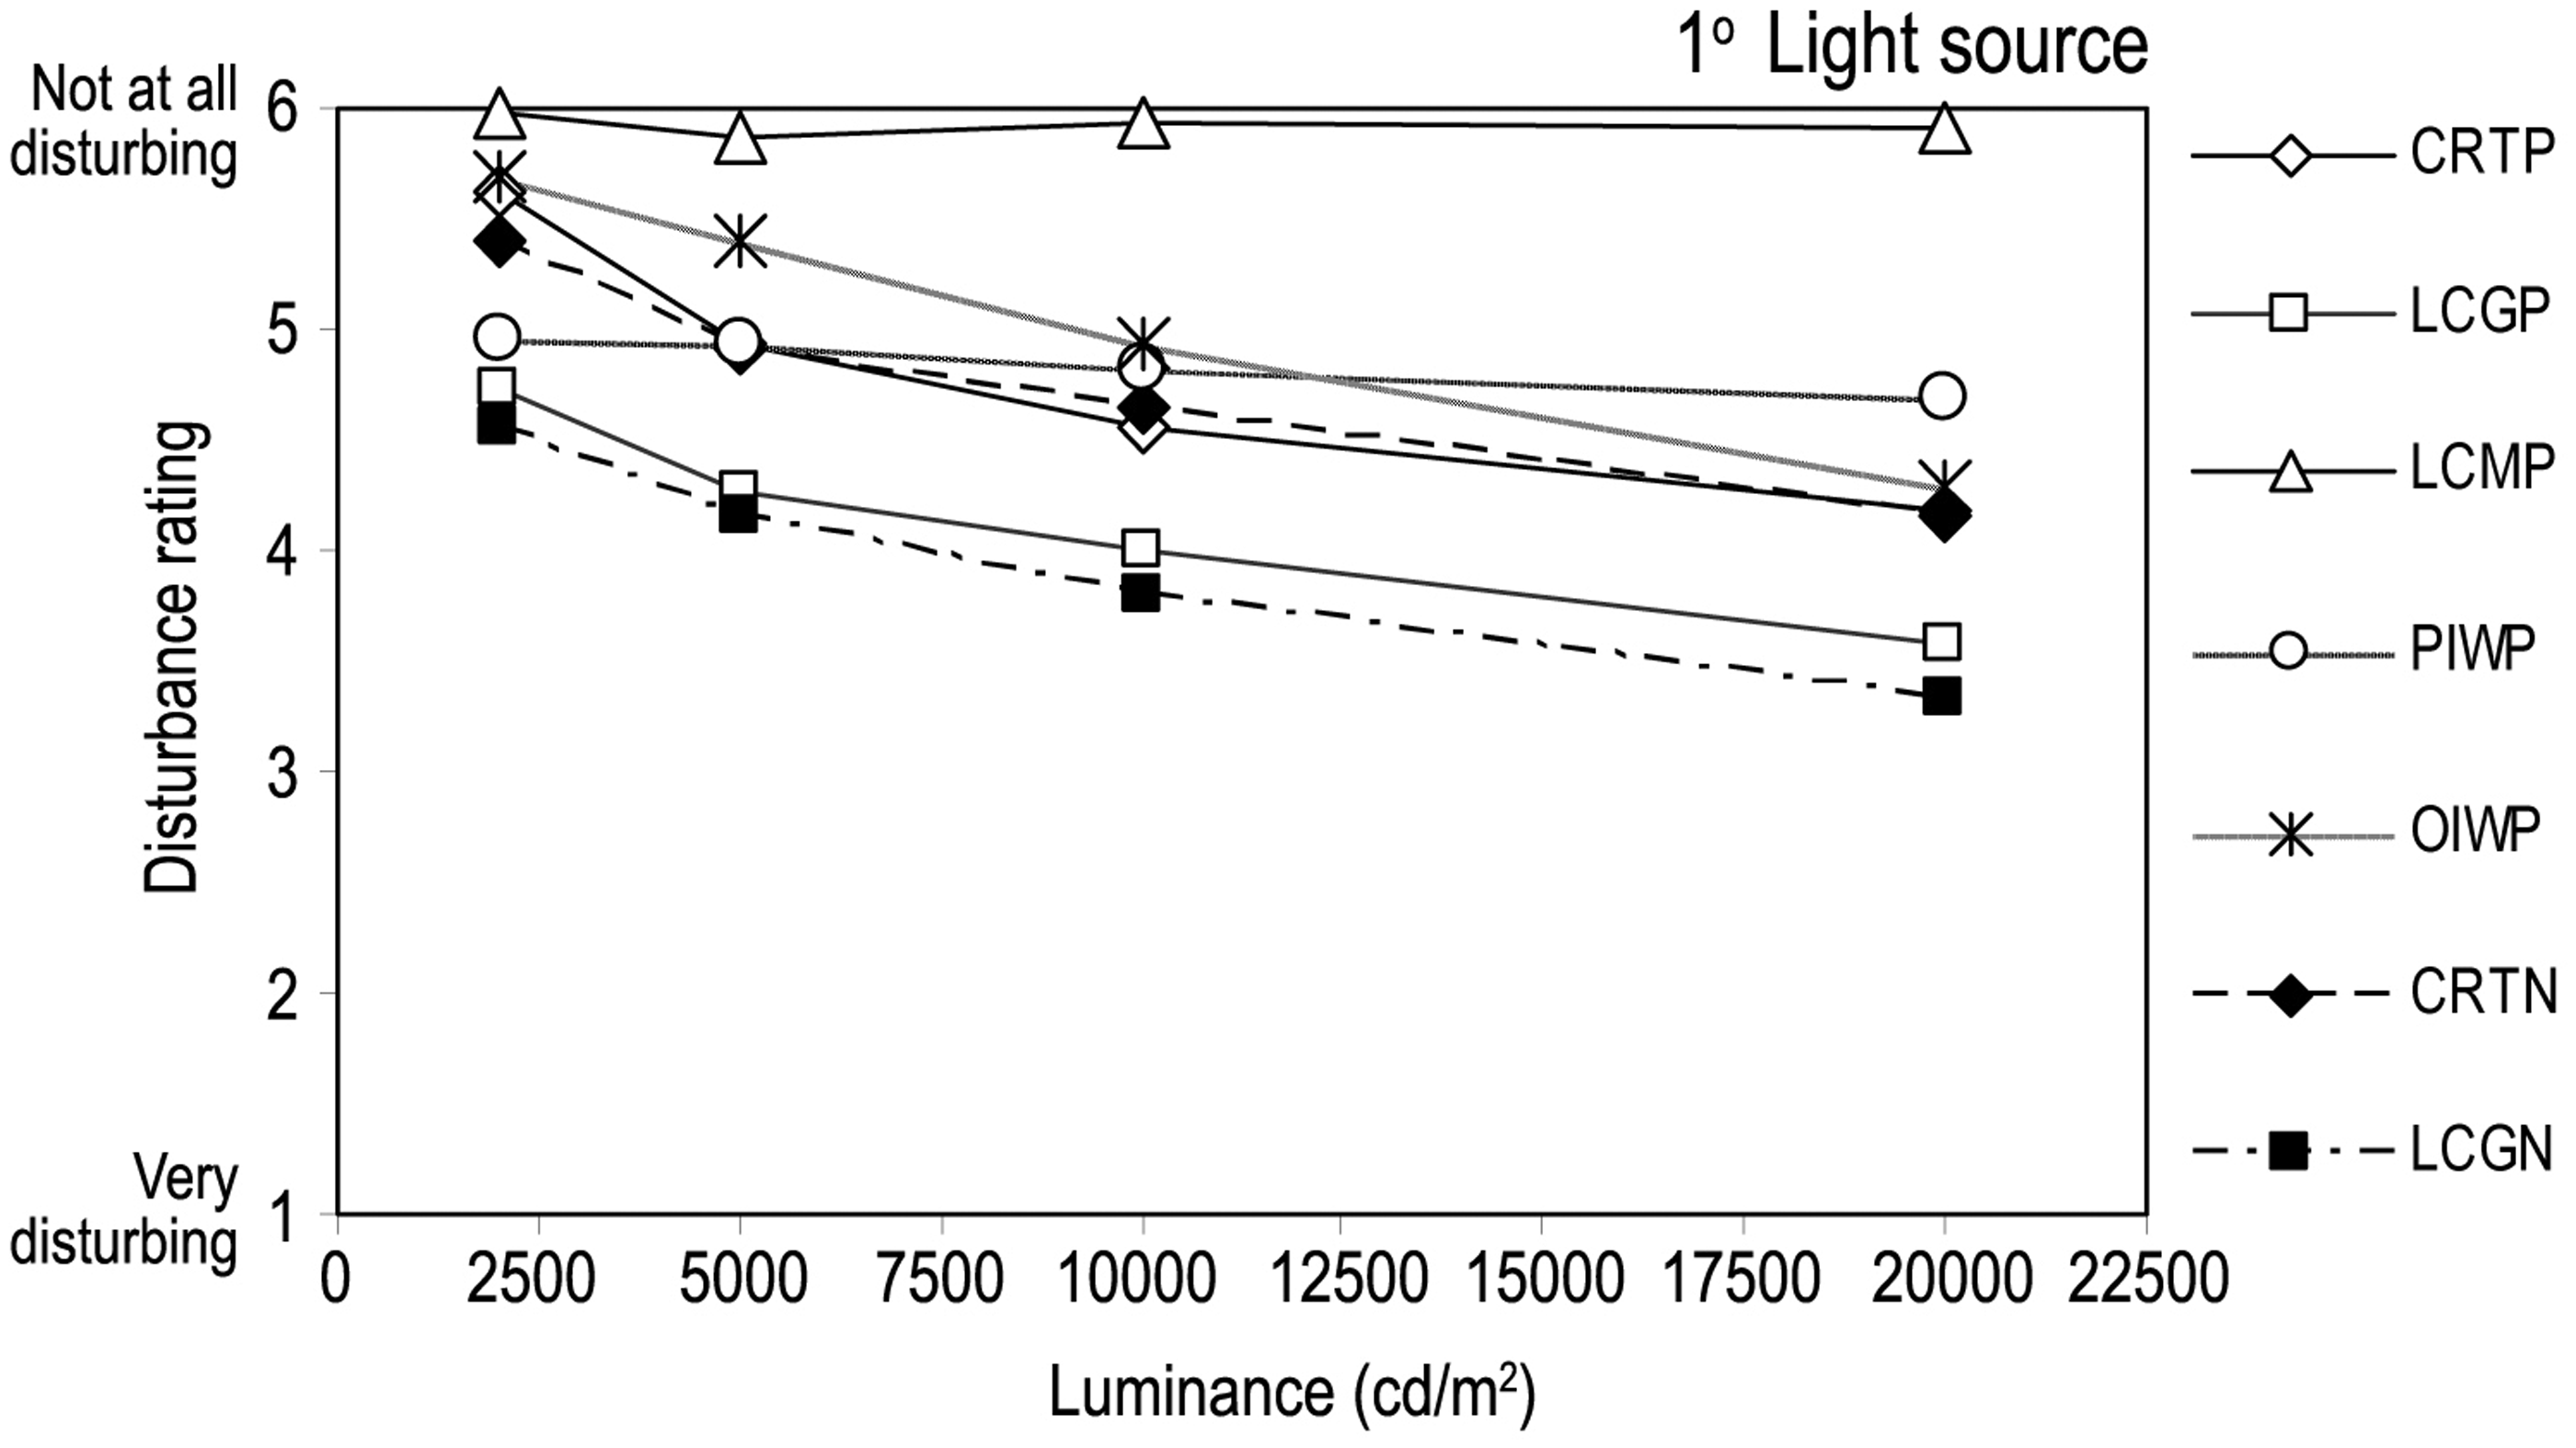
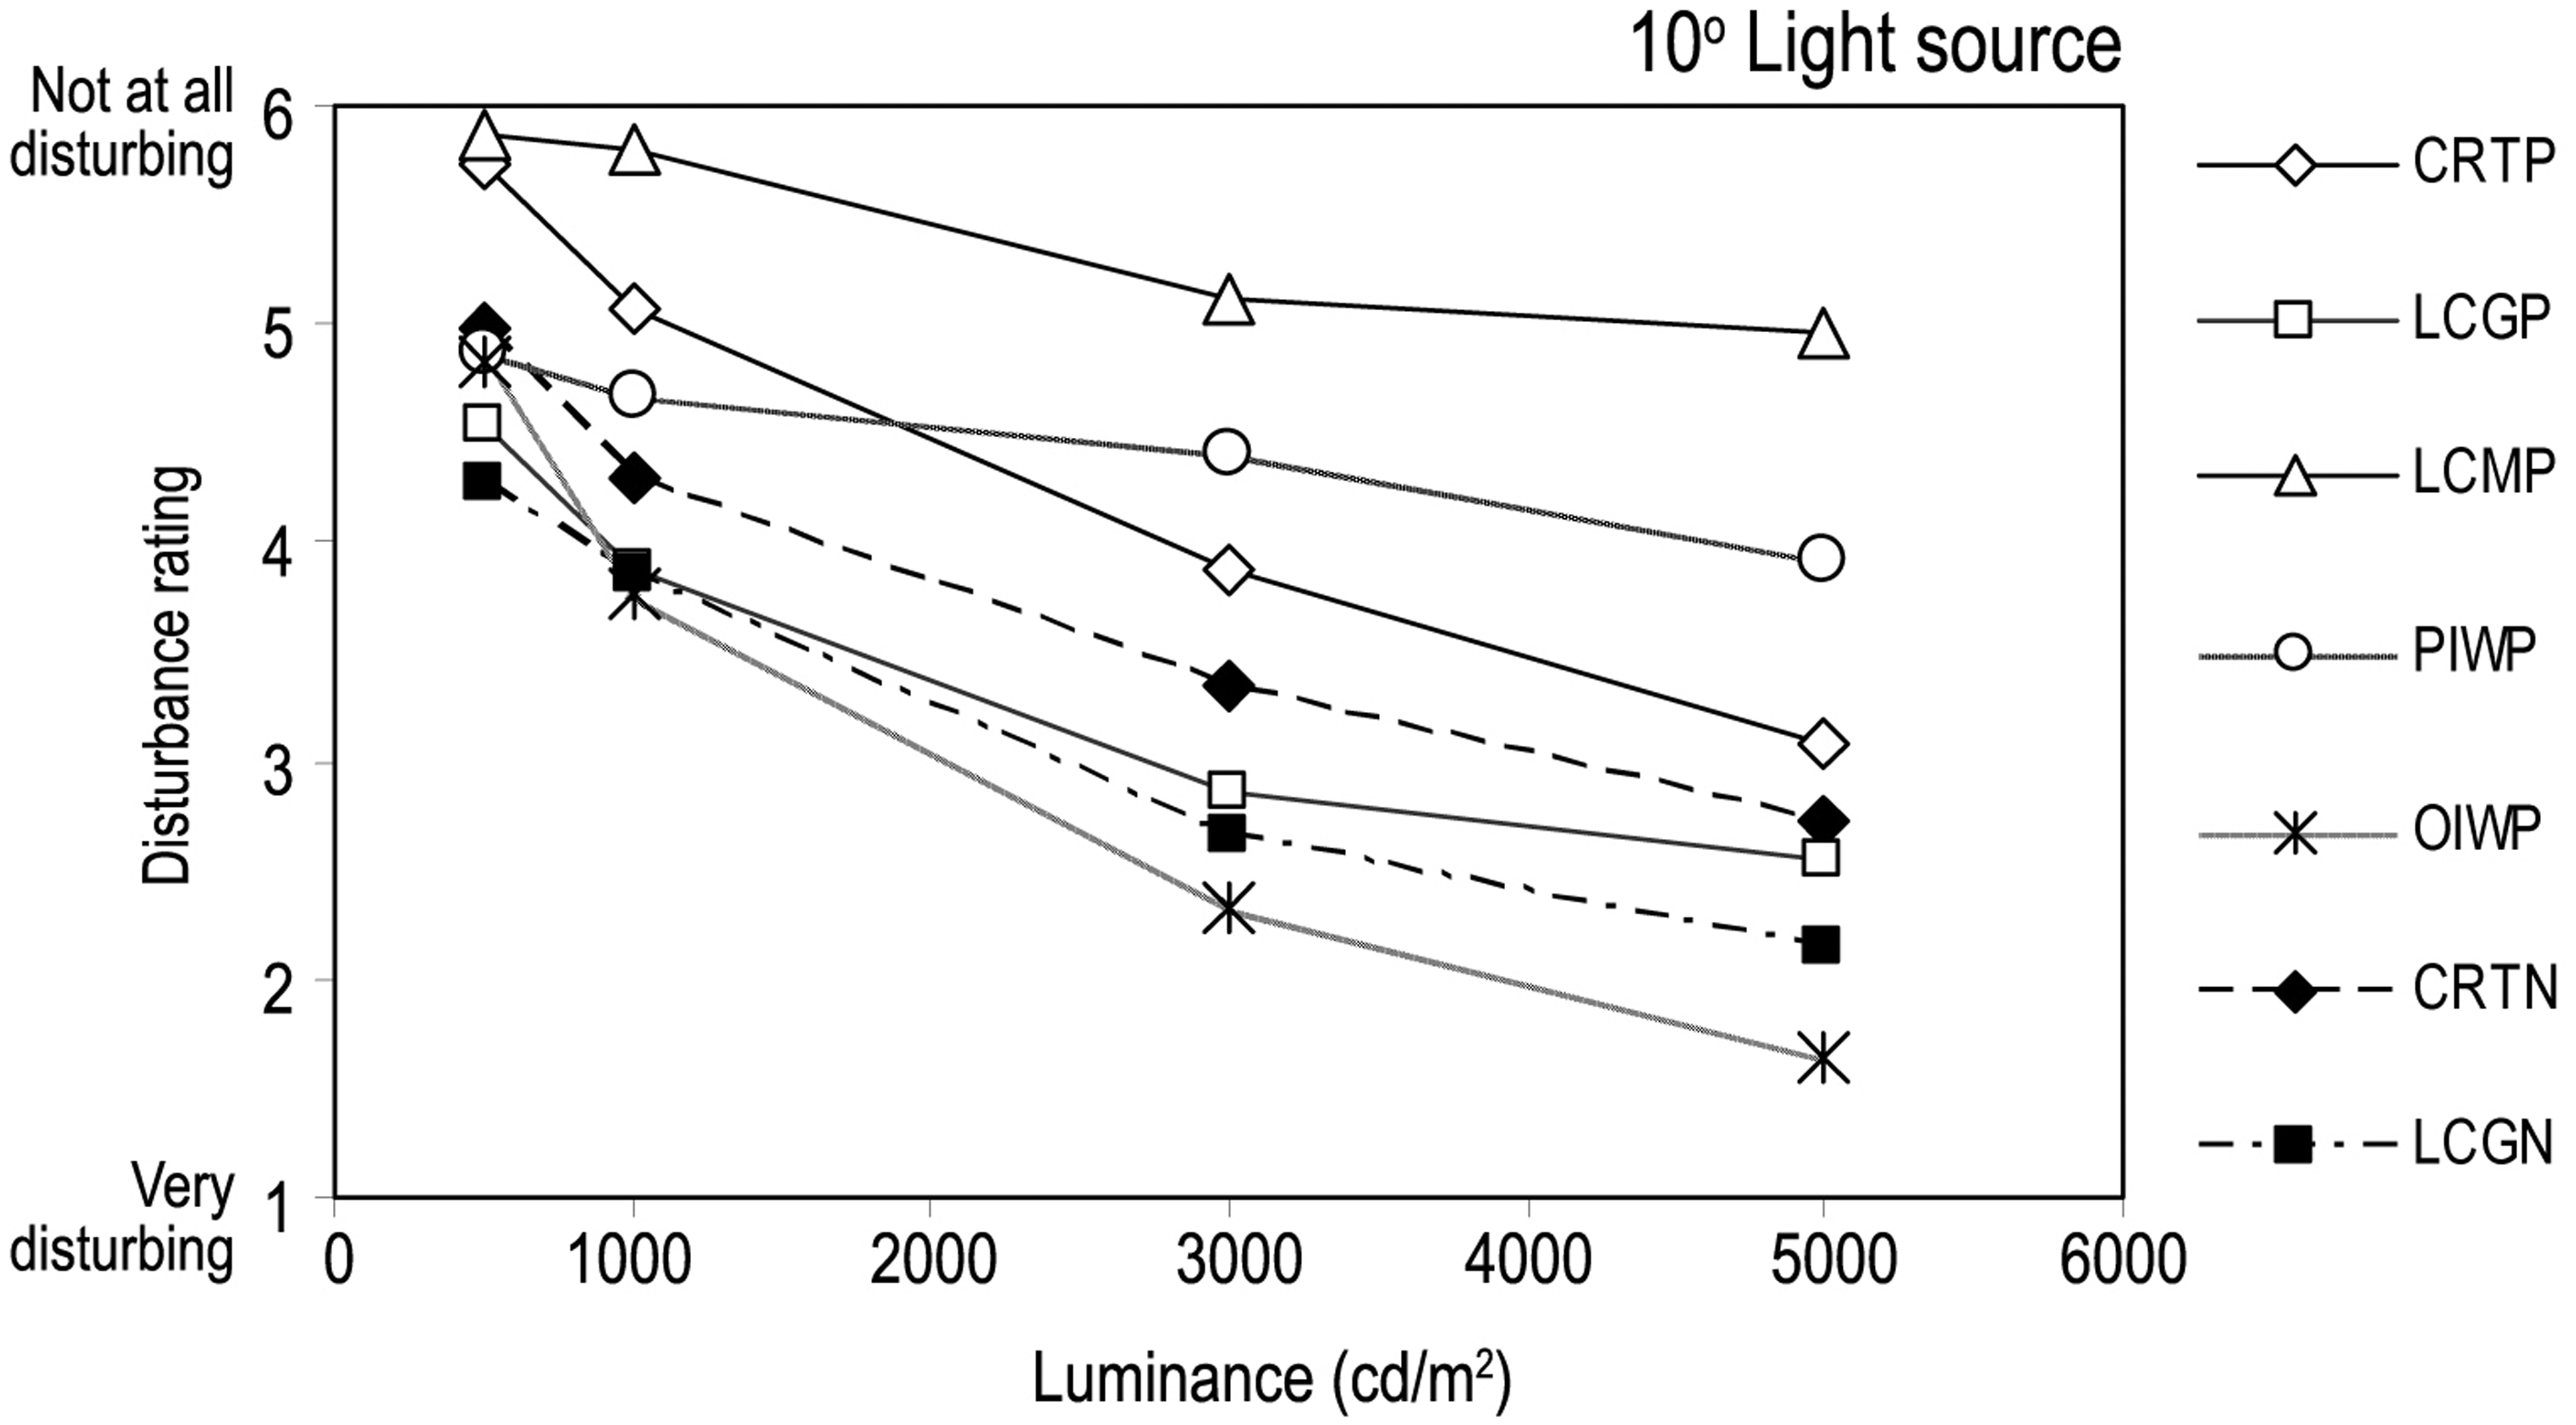
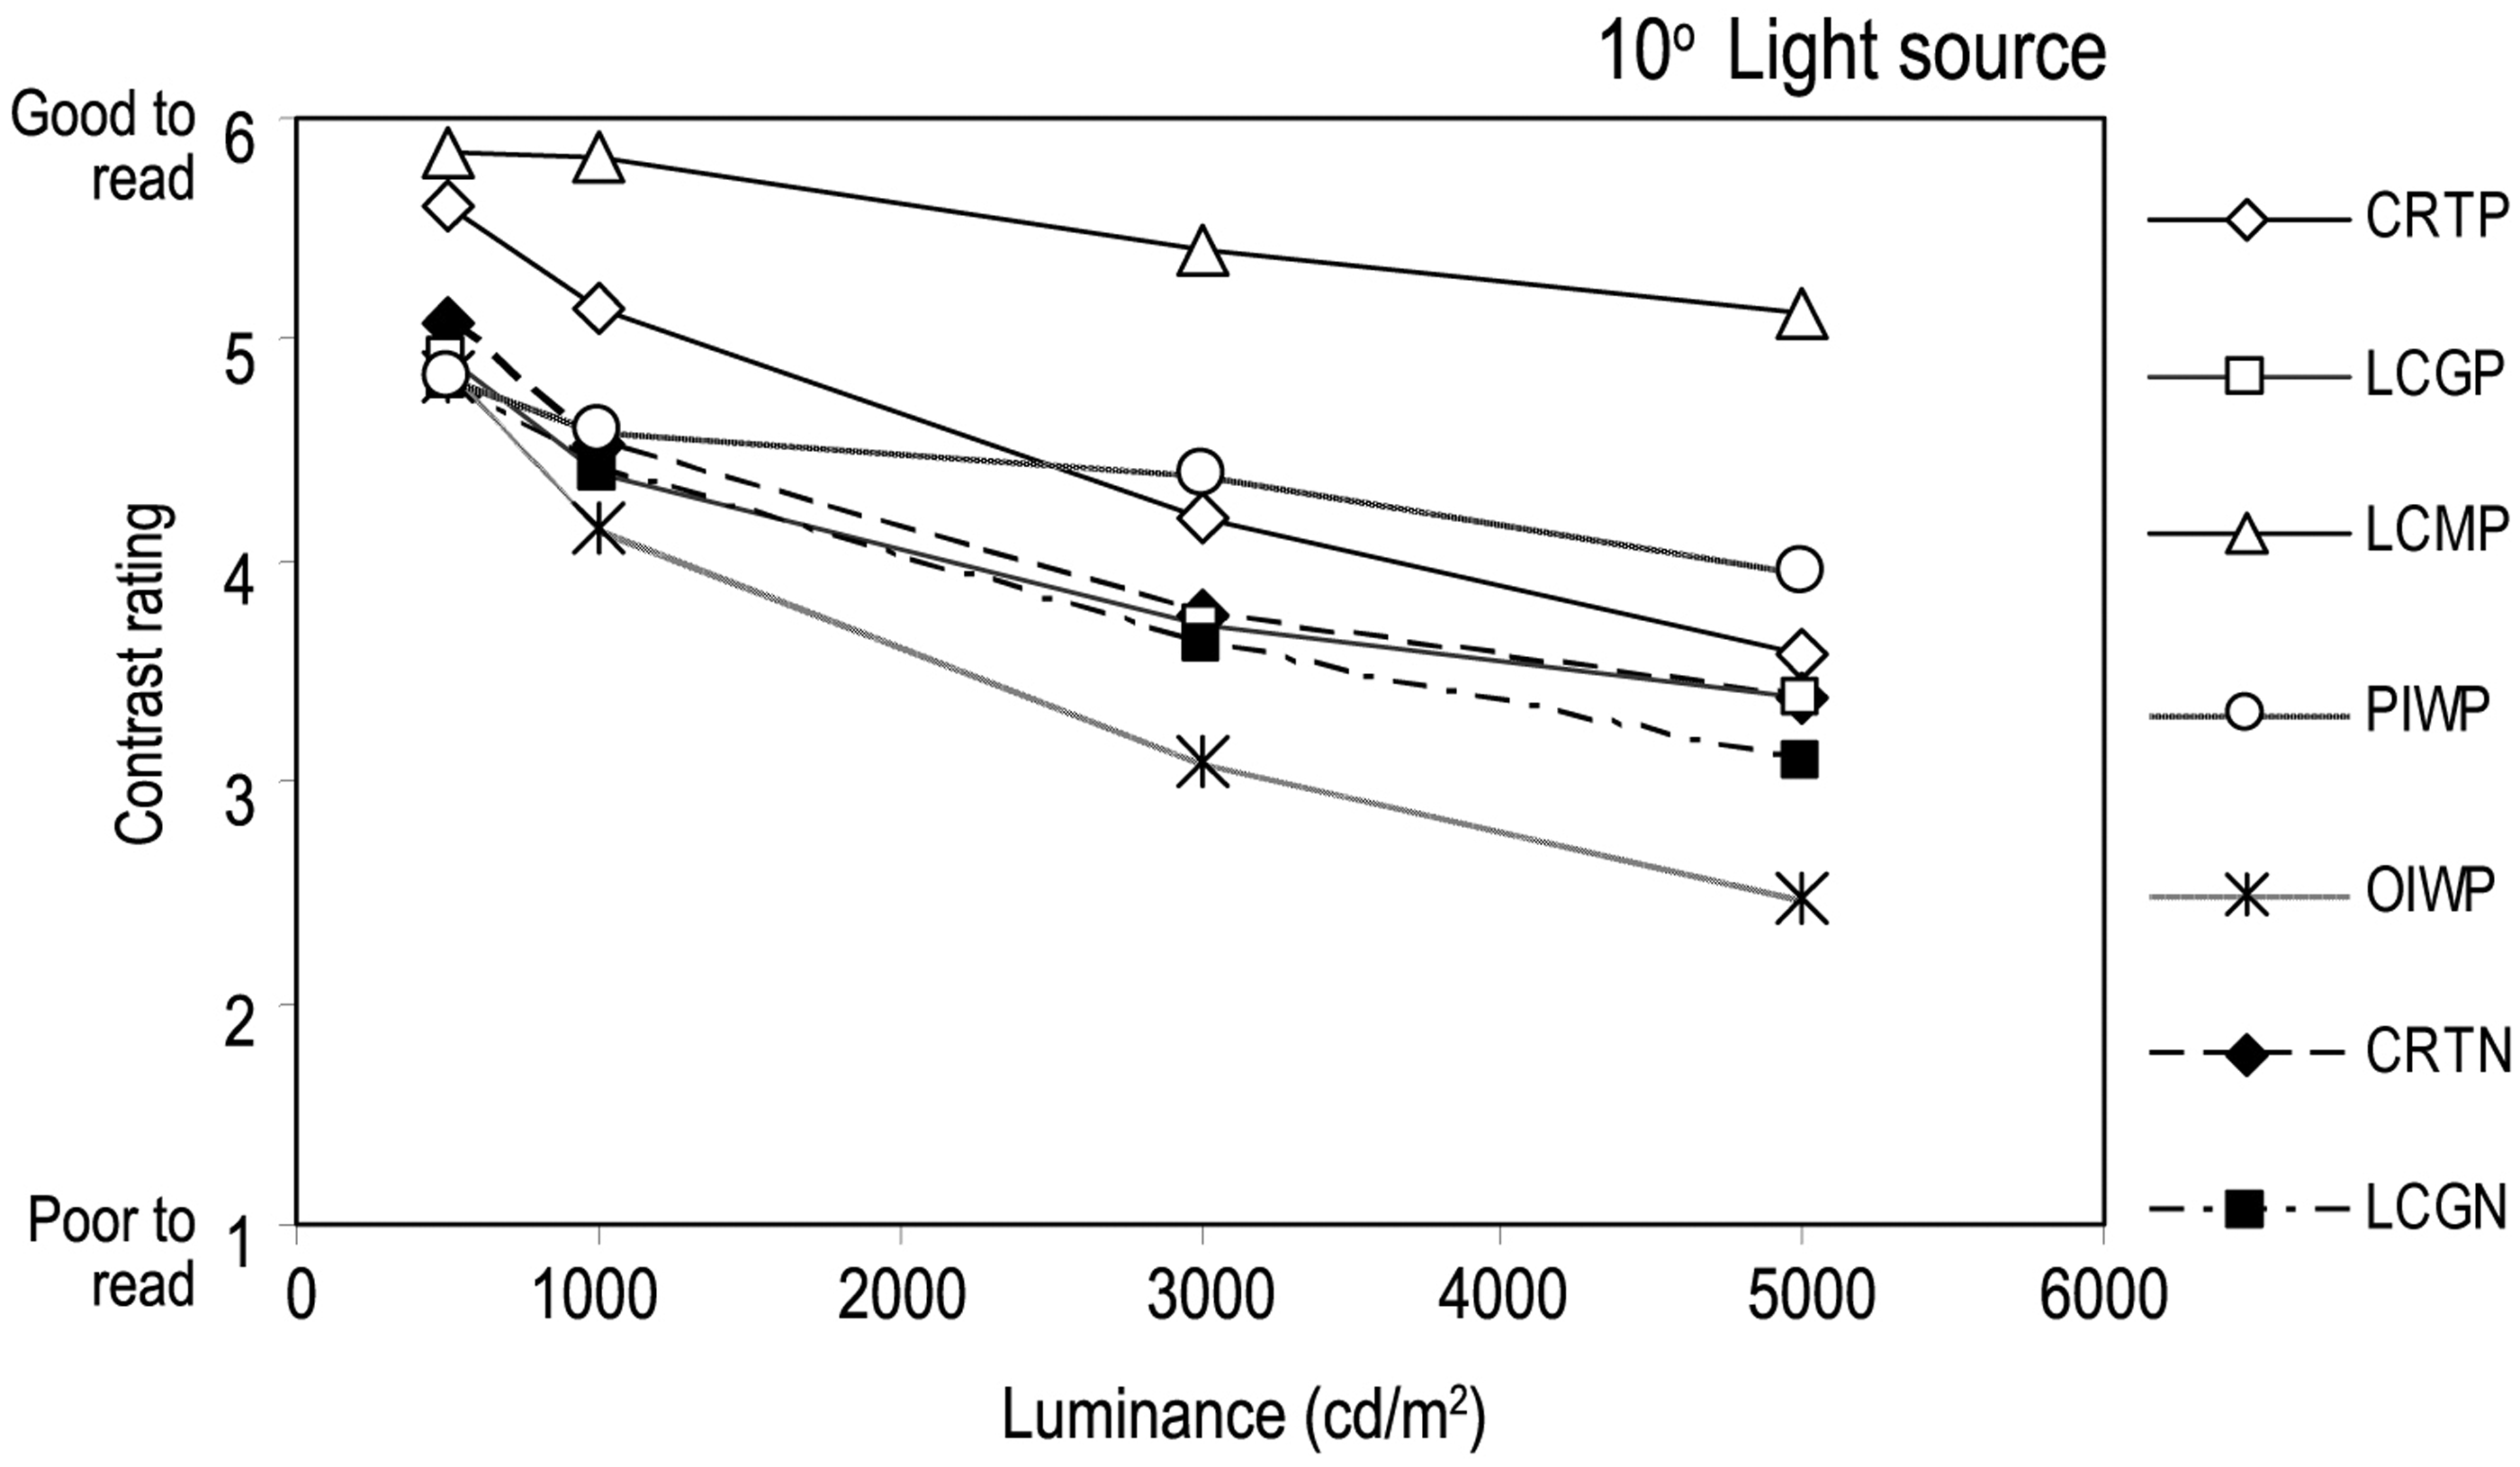
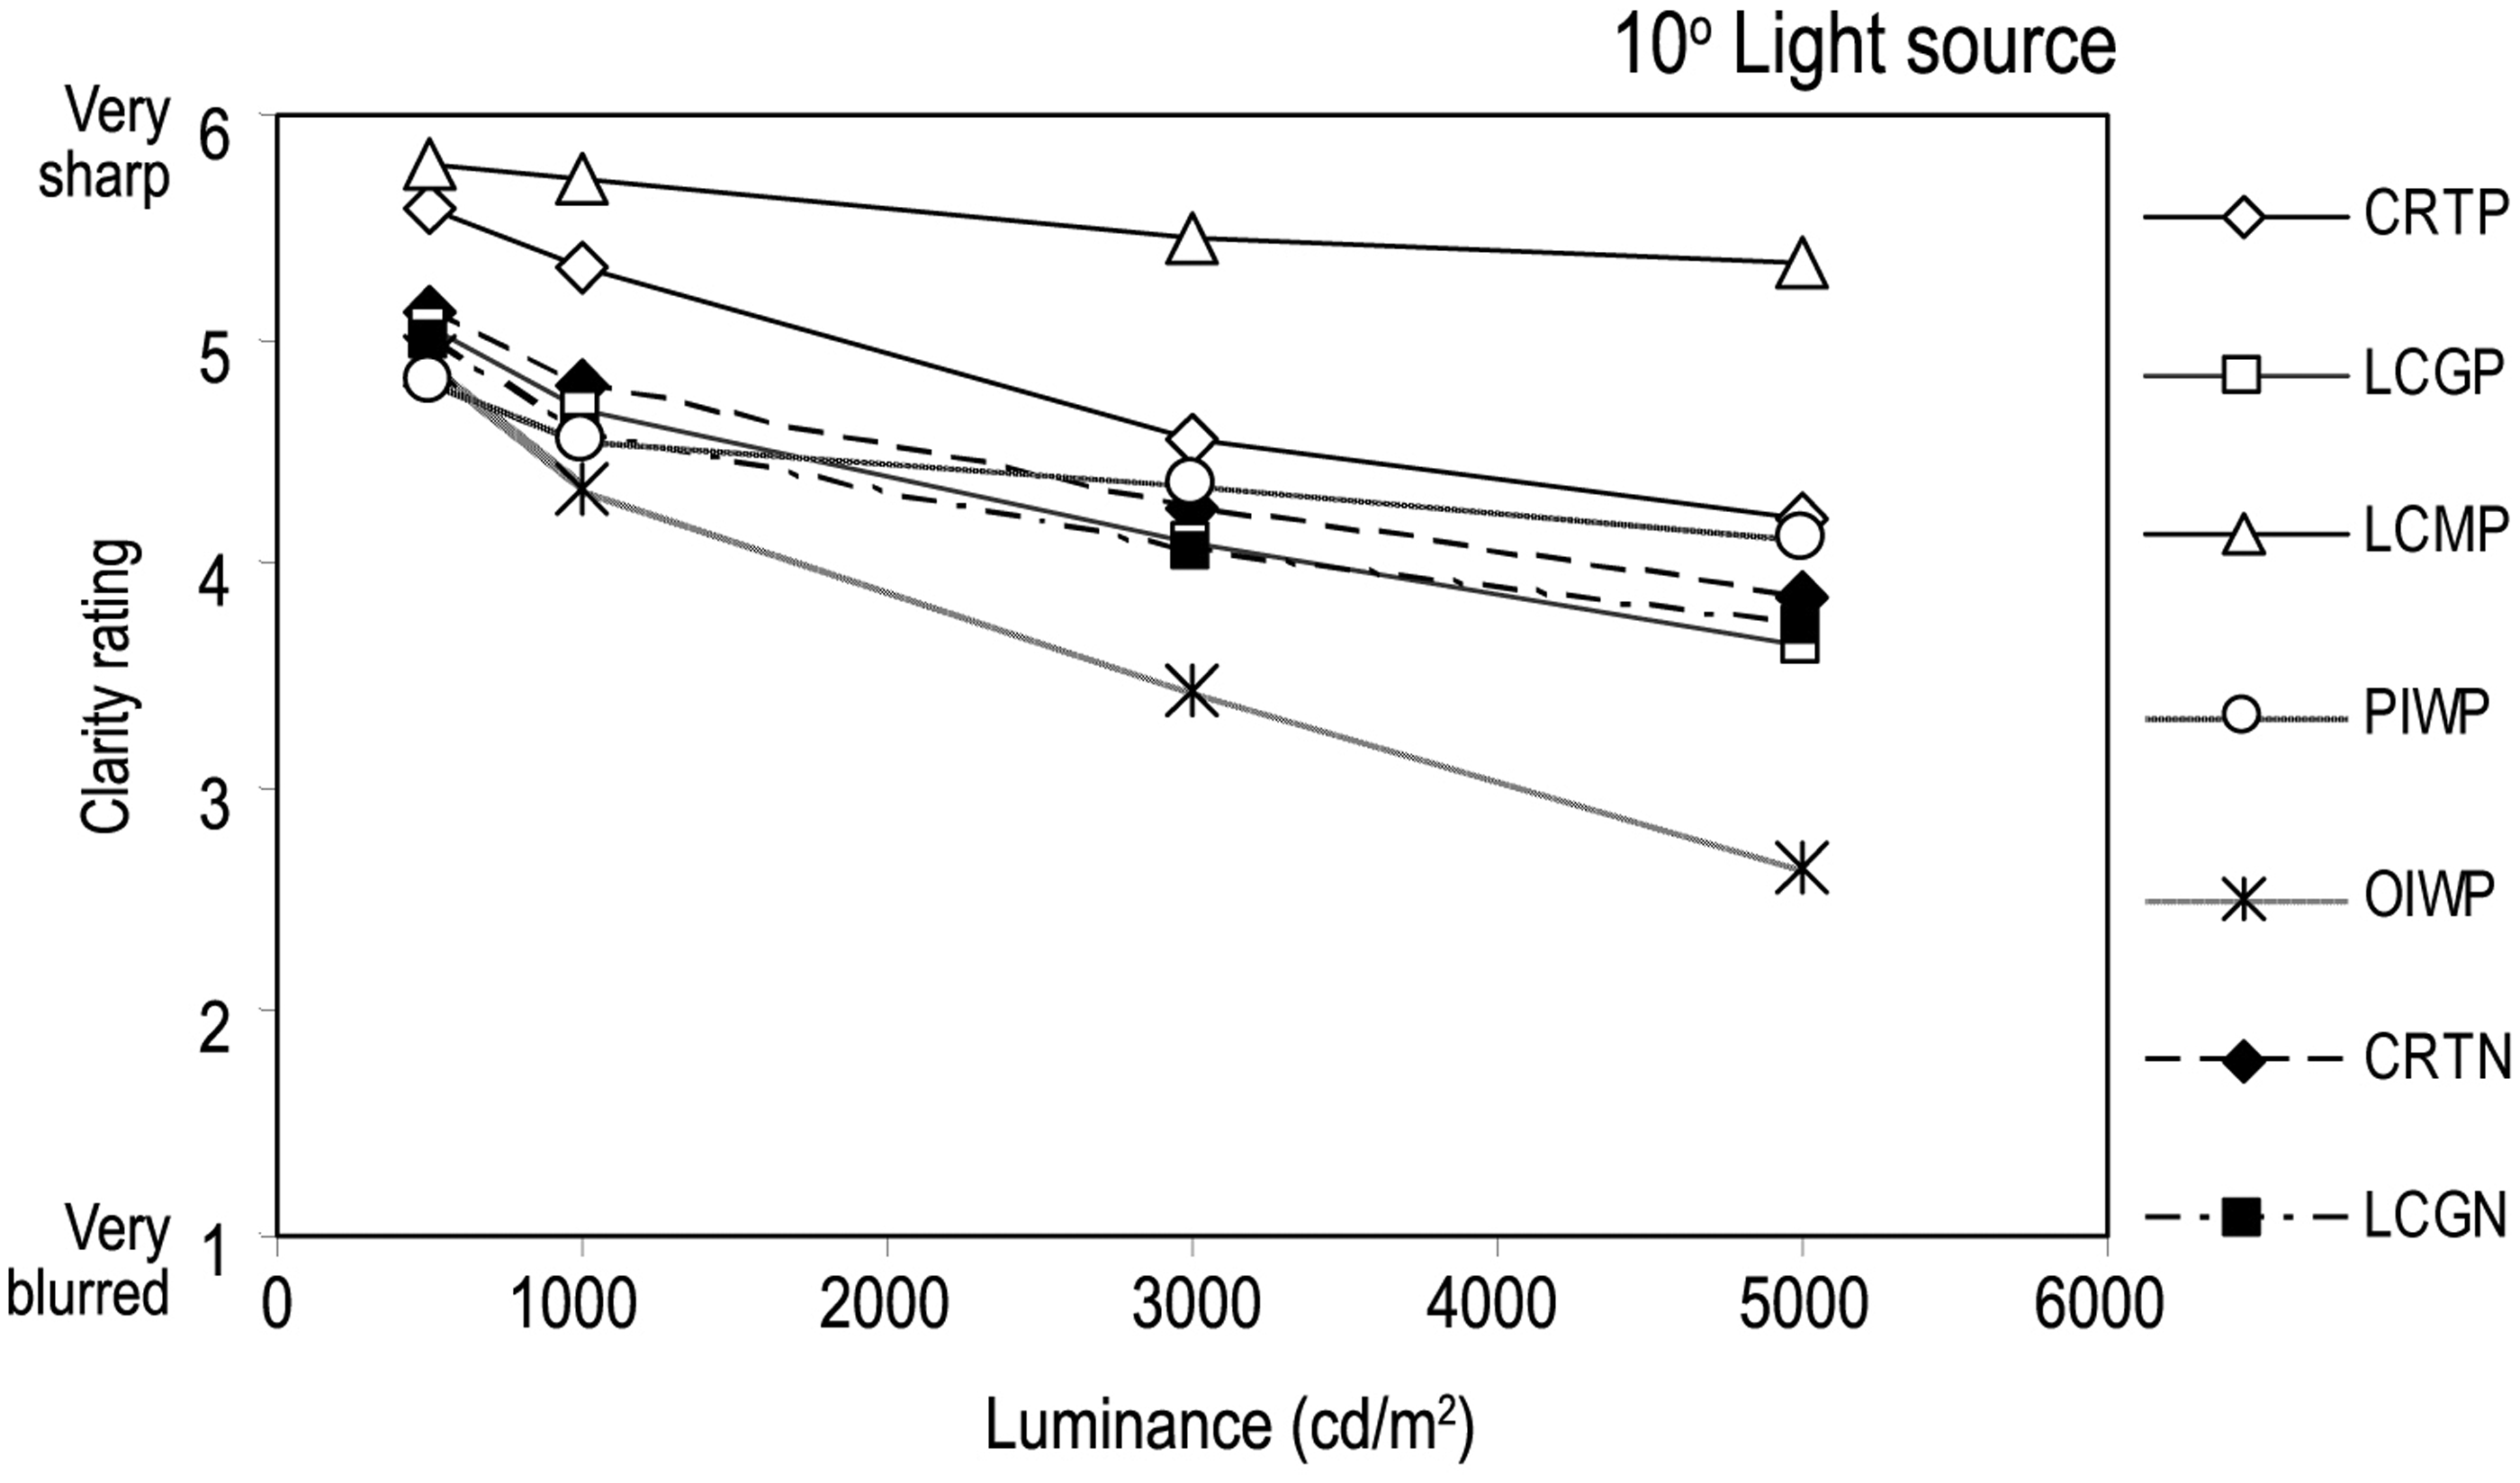
It is apparent from Figures 8 to 11 that mean ratings of screens with different optical properties declined at different rates with increasing luminance. For screens with a more matt finish (LCMP, PIWP), the mean ratings decreased only a little with increasing luminance but screens with a gloss finish (CRTP, LCGP, OIWP, CRTN, LCGN), showed a greater decline in mean ratings with increasing luminances. This suggests that the relationship between the mean ratings and the luminance of the light source is associated with the reflection characteristics of display screens. For screens with similar reflection properties but different display polarities (i.e. CRTP vs. CRTN or LCGP vs. LCGN), the reduction in mean ratings for the different polarities showed a similar trend but when seen in positive polarity the mean ratings were better than for the same screens seen in negative polarity, under the same lighting conditions. This also suggests the influences of reflection properties as well as display polarity on acceptability of visual conditions at display screens.
Figure 12 compares the mean disturbance ratings obtained using two different sizes of light source, both at 5000 cd/m2. It can be seen that the mean disturbance ratings for all screens decreased as the size of the reflected light source increased.
Mean disturbance rating of seven display screens tested with different sizes of light source at 5000 cd/m2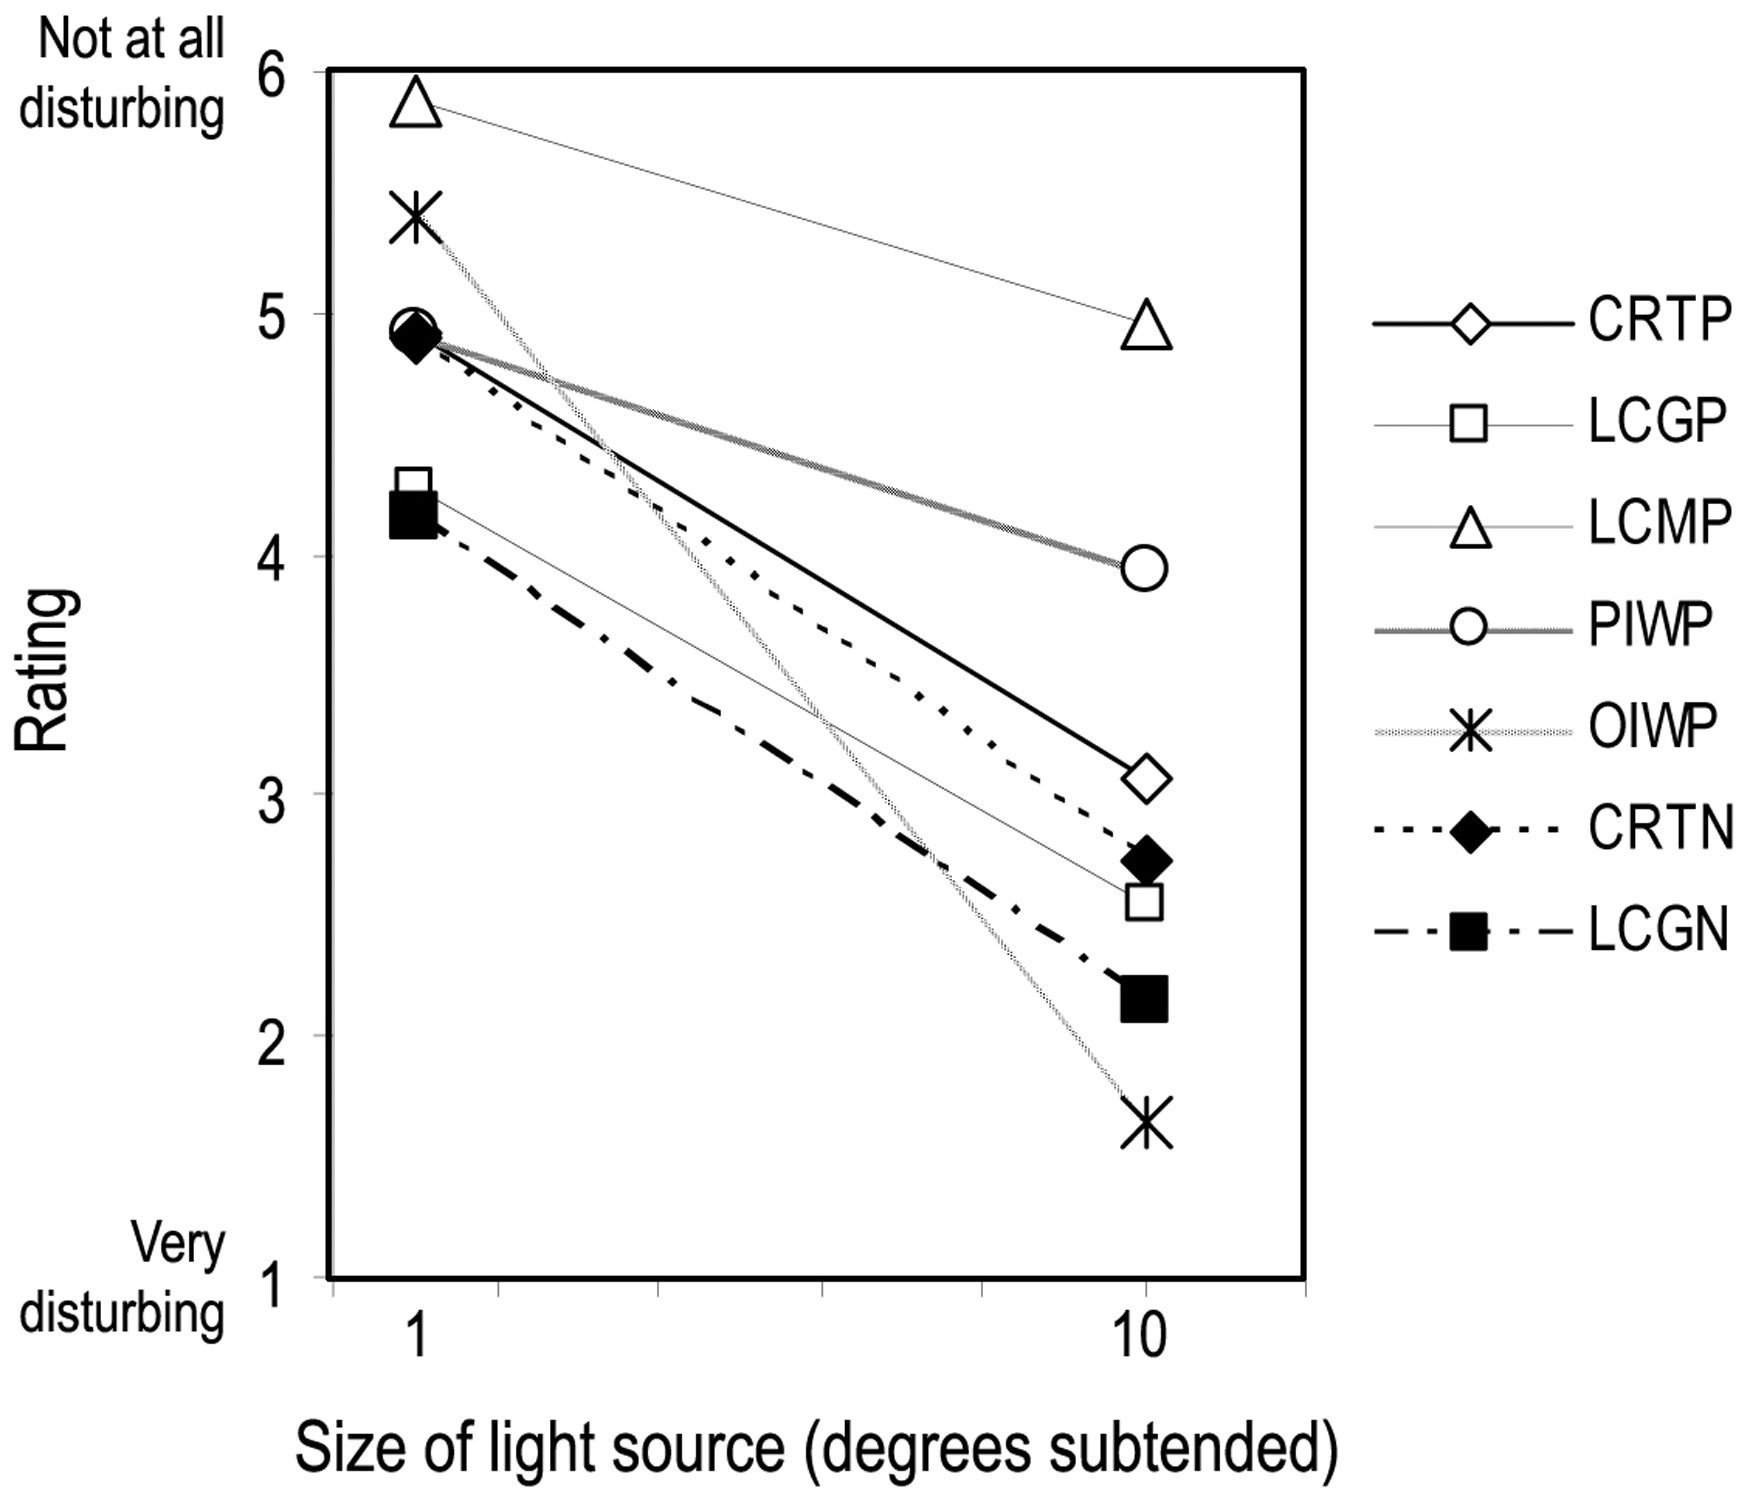
Figure 13 shows the mean disturbance ratings for the 10° light source reflected on the two interactive whiteboards (PIWP, OIWP), which were tested at two viewing angles (15° and 30°). It can be seen that the mean disturbance ratings at 15° and 30° angles for the same whiteboard are close but there is a large difference between the two whiteboards.
Mean disturbance ratings of two types of interactive whiteboard at two different viewing angles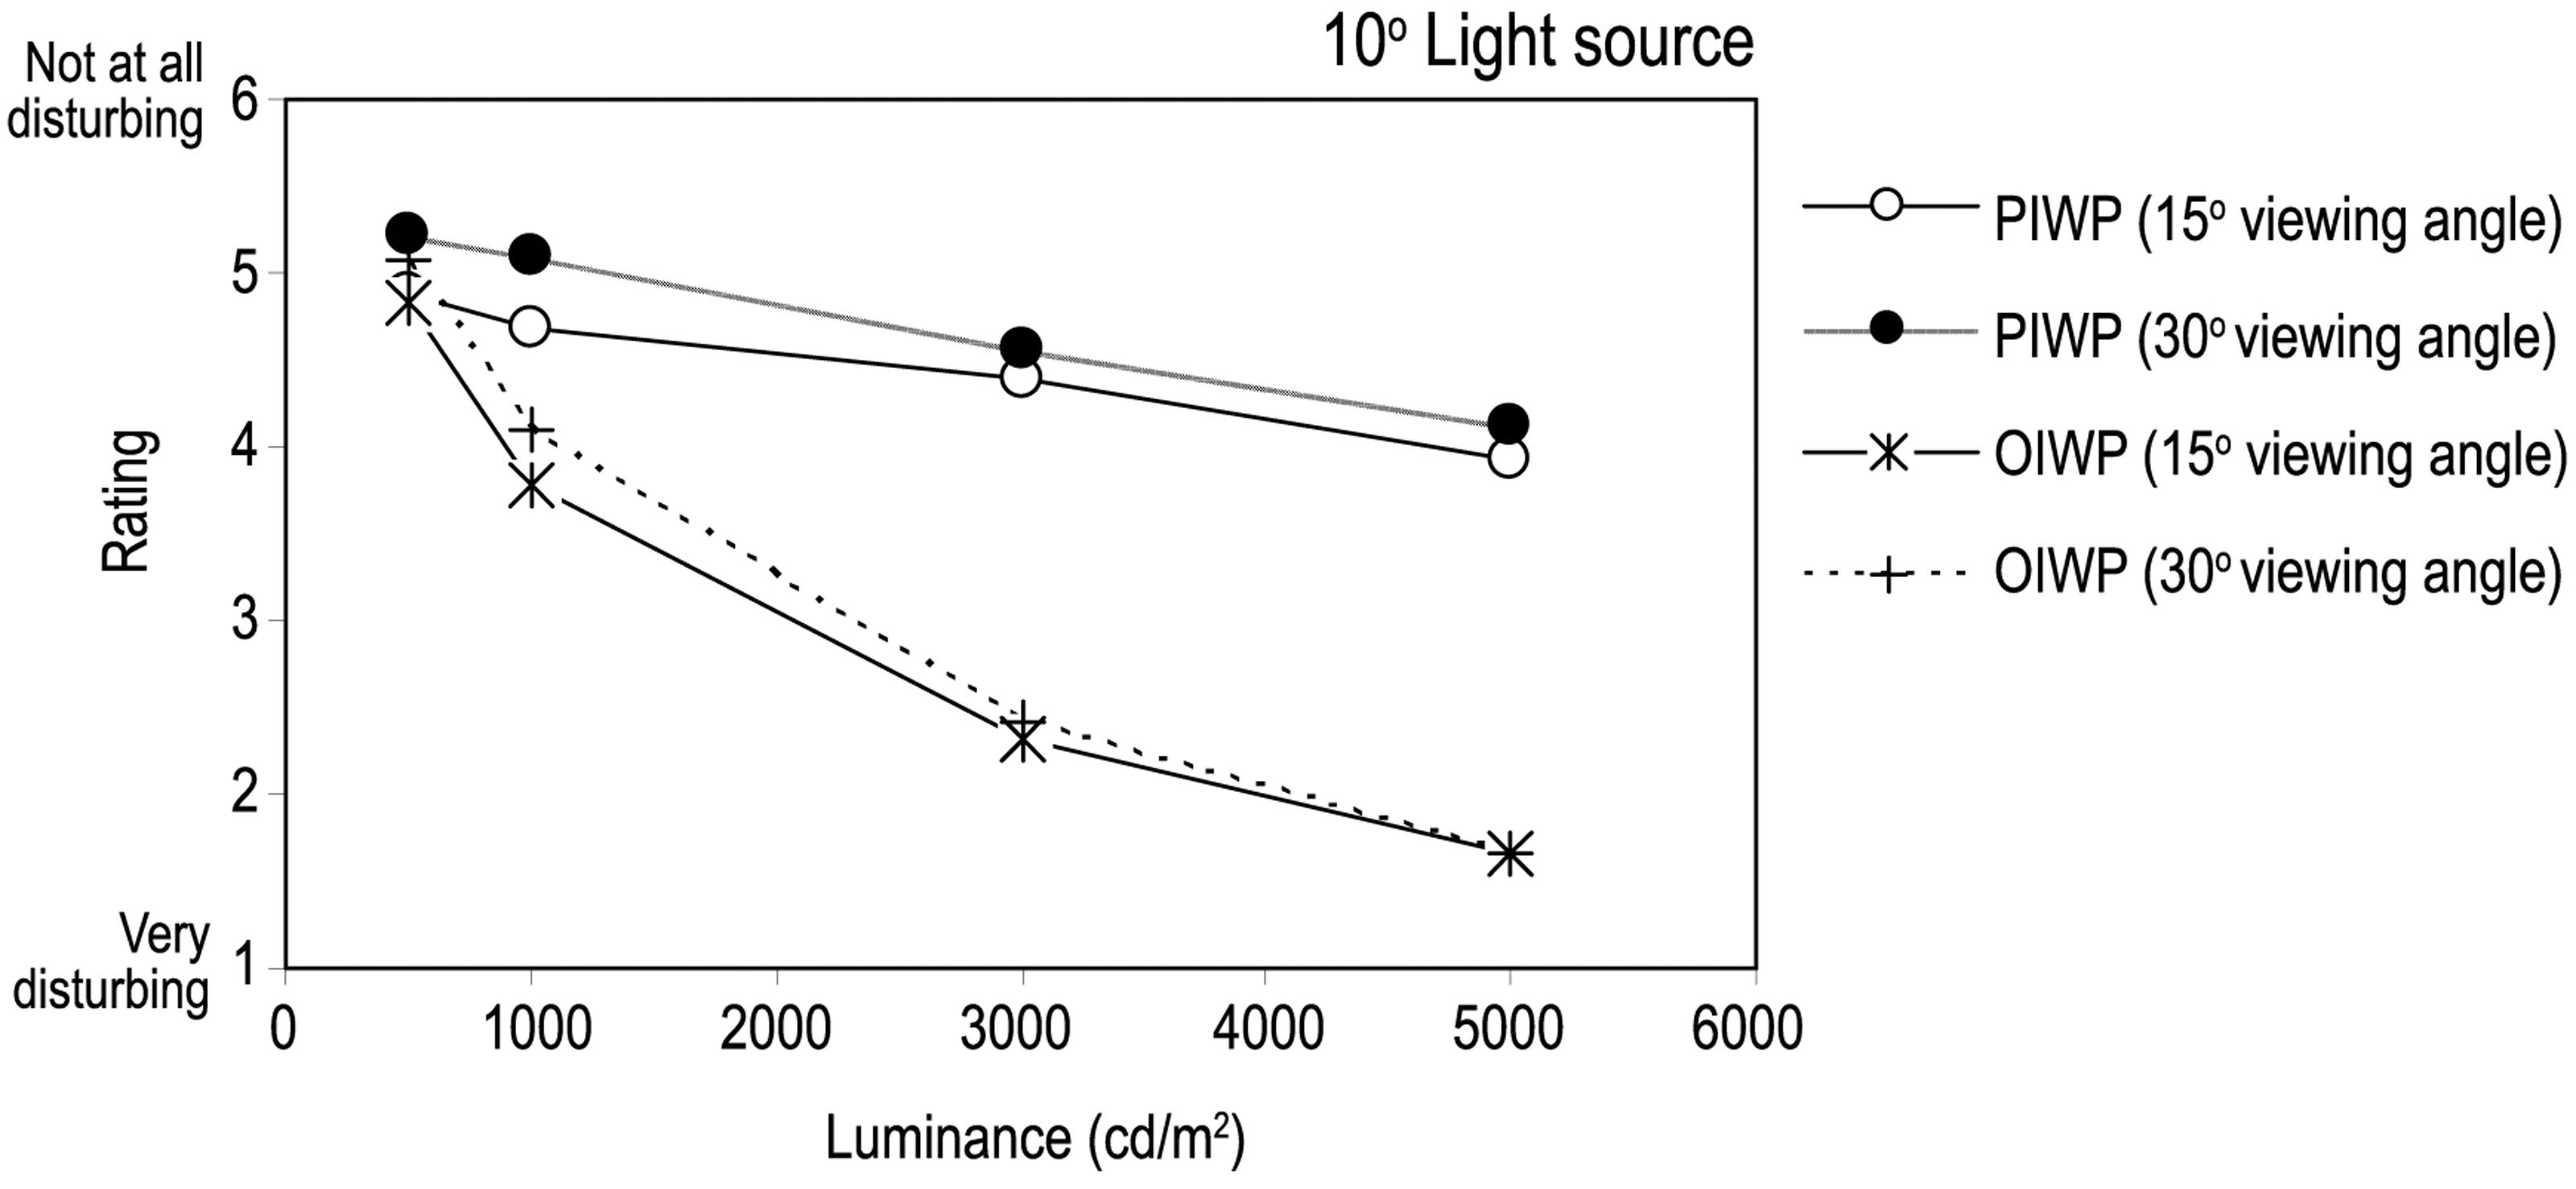
Figure 14 compares the mean disturbance, contrast and clarity ratings for the seven screens using the 10° light source at four different luminances. It can be seen that at the lowest luminance (500 cd/m2), where the mean disturbance, contrast and clarity ratings were high on the 6-point scales, the three ratings were very similar. As the luminance increased, differences between the disturbance, contrast and clarity ratings became apparent for all seven display screens but it is obvious that the disturbance rating was typically lower than the contrast and clarity ratings.
The mean disturbance, contrast and clarity ratings for 7 display screens, using the 10° light source at 4 different luminances (500, 1000, 3000 and 5000 cd/m2)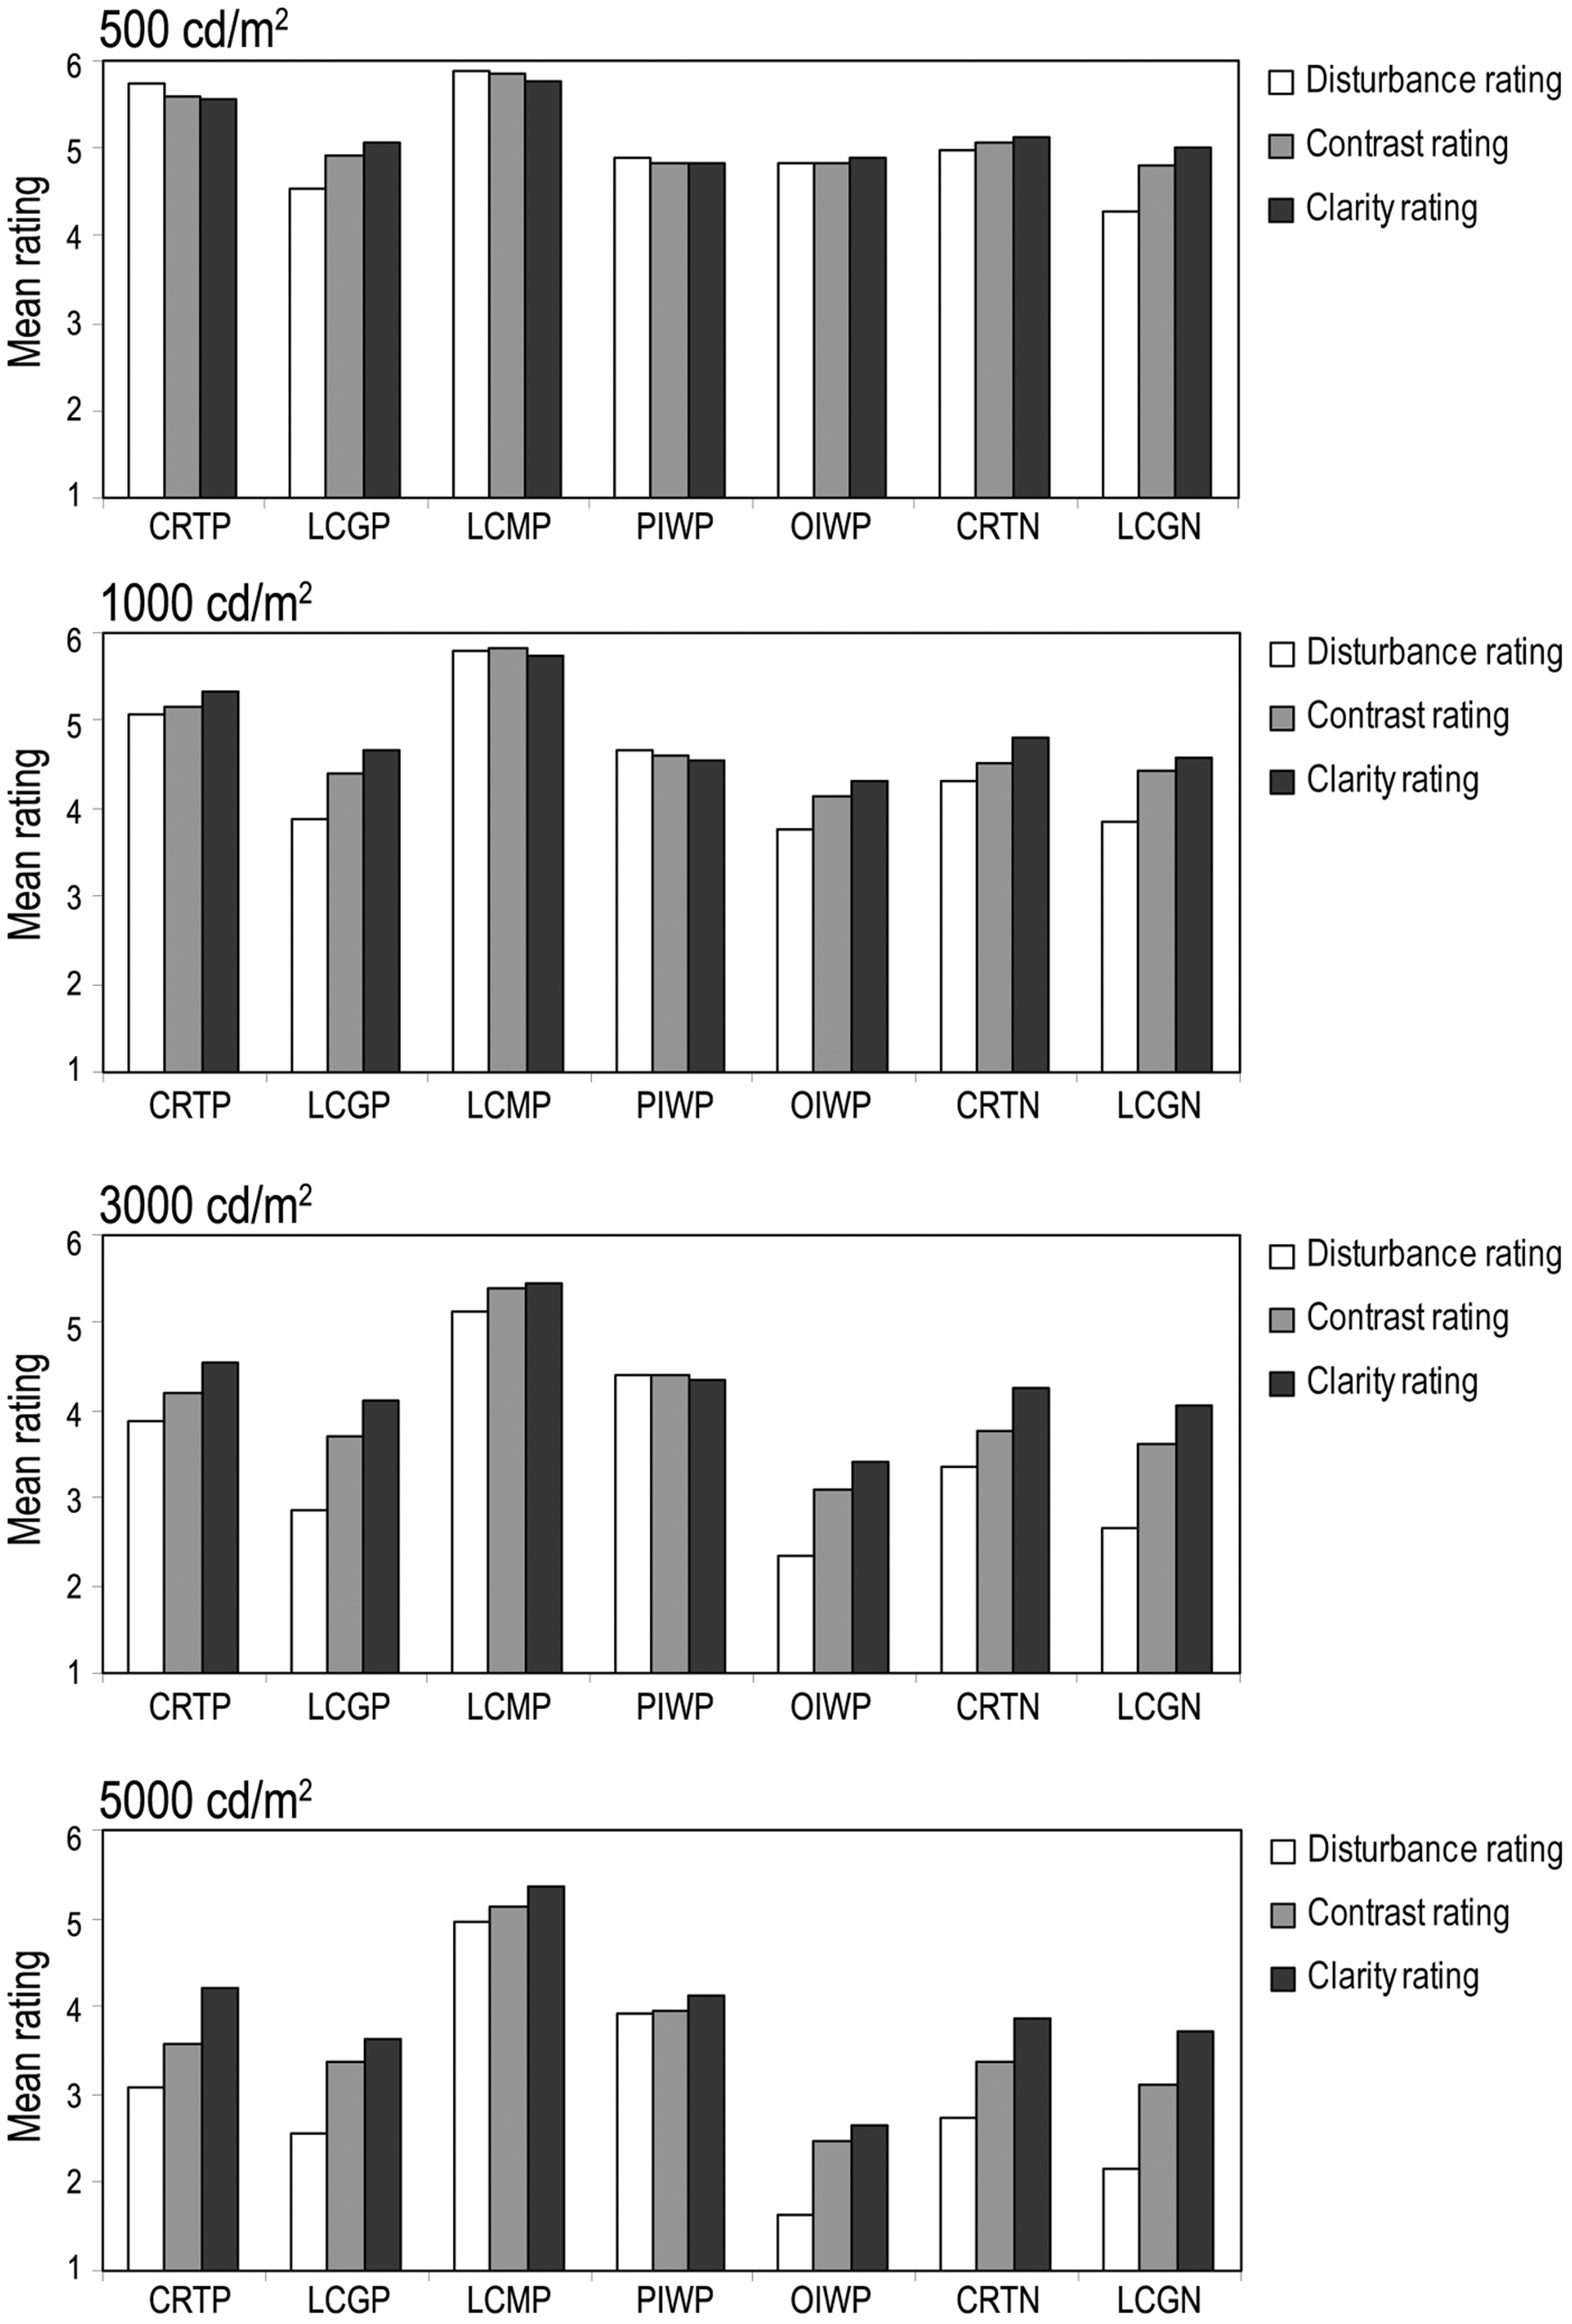
Analysis using Pearson's correlation coefficient found very strong correlations between the disturbance and contrast rating (r = 0.98, p < 0.01), the disturbance and clarity ratings (r = 0.95, p < 0.01) and the contrast and clarity ratings (r = 0.98, p < 0.01). The significant correlations between the three category ratings suggest that it should be possible to use just one category rating (e.g. disturbance) to predict the other two ratings (e.g. contrast and clarity) with reasonable accuracy. Since the rating results suggest that the disturbance was the most sensitive criterion, it is likely that in the condition where the screen reflection becomes just disturbing, the contrast and clarity of the text would still be acceptable to users. This finding is consistent with that from the adjustment test which supports the idea of using the disturbance of the reflection as the main criterion to determine the luminance limit of the light source for environments where display screens are used. For this reason, it was decided to use the mean disturbance ratings to study the statistical significance of lighting and display variables on subjective responses.
A repeated-measures ANOVA was used to study the effects of screen type (7 levels) and luminance level (4 levels). Since the category ratings used different sets of four luminances for the two sizes of light source, the results of the tests with 1° and 10° light sources were analysed separately. Both analyses showed the same pattern of statistical significance. There were significant main effects of screen type (p < 0.01) and light source luminance (p < 0.01). Also, there was a significant interaction between screen type and luminance (p < 0.01) in that, the effect of luminance depended on the type of display screen used. In order to determine the effect from light source size, a two-way ANOVA was carried out using the disturbance ratings at a fixed luminance of 5000 cd/m2 for two sizes of light source and seven screens. There were significant main effects of the light source size (p < 0.01) and screen type (p < 0.01) as well as a significant interaction between the light source size and screen type (p < 0.01). This interaction shows that the disturbance rating of the various screen types was affected differently by the size of light source. The effect of viewing angle on the disturbance rating was investigated using results from the two interactive whiteboards which were tested at two viewing angles. An ANOVA using the three independent variables of screen type (2 levels), angle of viewing (2 levels) and luminance (4 levels) was carried out. The results showed that there was a significant effect of viewing angle on the disturbance rating (p < 0.01) but there were no statistically significant interactions. This indicates that the influence of the angle of viewing on disturbance rating did not change when varying other variables.
5. Discussion
The results presented above raise a number of issues. First, it is necessary to consider why there is the obvious effect of reflections on the two measures of disturbance, but very little effect on reading time. Second, the extent to which the two measures of disturbance show similar patterns of effects for the same variables needs to be assessed. Third, the performance of the interactive whiteboards relative to the conventional computer display screens is of interest. Fourth, it is useful to examine what levels of disturbance would be achieved for the various screen types if the recommended luminaire luminance limits were to be applied.
5.1. Disturbance and reading time
Both the luminance adjustment method and the category rating method revealed statistically significant differences in disturbance caused by the various screen types and light source sizes but neither of these variables had a statistically significant effect on reading time. There are two plausible explanations for the lack of effect on reading time. First, reading time is a measure of the performance of a task that includes visual, cognitive and motor components. It is possible that the size of the visual component in this reading task was small compared to the cognitive and motor components. Second, the stimulus presented by the text might have been on the plateau of visual performance, even in the presence of reflections. The Relative Visual Performance model shows that visual performance changes very little across a wide range of visual conditions until one or other of these variables reaches a low level where the visual performance decreases rapidly.20,21 The reading materials used were representative of the sizes and luminance contrasts of materials found in classrooms. It is likely that although the luminance contrast of the text was affected by screen reflections, it remained within the range where visual performance was relatively stable. Hence, the change in reading time was minimal.
The lack of effect of screen reflections on reading are consistent with the results of Wang 11 and Kubota and Takahashi 9 who found that some lighting-display parameters that explained subjective responses to disturbing reflections were not significantly associated with task performance in the presence of screen reflections. These factors included area, edge length and number of screen reflections 11 and display polarity. 9 It is likely that the influences of screen reflections on observer responses are more subjective than objective. The observer may find screen reflections unacceptable before there is any reduction in task performance. For example, the rating test results suggested that for the 10° light source at a luminance of 5000 cd/m2 (Figure 12), reflections on some screens (CRTP, CRTN, LCGP, LCGN, OIWP) were, on average, considered disturbing. Yet, at this luminance, the difference in task performance was barely noticeable. This suggests that lighting recommendations with regards to screen reflection should be based on the disturbance felt by users rather than task performance which is less sensitive to lighting-display conditions.
5.2. Category ratings and adjustment luminances
The results from the category rating method and the luminance adjustment method are mutually supportive. The rated disturbance and the maximum acceptable source luminance are both influenced by the same lighting and the display screen parameters, namely; the type of display screen, size and the luminance of the reflected light source. The rated disturbance was also affected by the angle of viewing, though this variable did not seem to significantly interact with the other lighting-display variables. Further, the effect of light source size was consistent using both methods. The disturbance for the 10° light source was greater than for the 1° light source (Figure 12) and the source luminance considered acceptable by 95% of participants was lower for the 10° light source than for the 1° light source (Table 3).
5.3. Comparison of whiteboards
One of the reasons for reopening the question of reflections from display screens was the increased use of interactive whiteboards in classrooms. The two interactive whiteboards examined (PIWP and OIWP) were both seen in positive polarity but were widely separated in the amount of disturbance they caused. The PIWP screen was consistently better than the OIWP screen in that, for the same visual conditions, it caused less disturbance (Figure 13) and had a higher light source luminance acceptable to 95% of participants (Table 3). This difference can be explained by the reflection characteristics of the two screens. The PIWP screen has a much higher diffuse reflectance, much higher background luminance, lower specular reflectance and lower haze effect (Table 2). In fact, the diffuse reflectance of the OIWP screen is so low that it might more accurately be called a blackboard rather than a whiteboard. Despite this, it is worth noting that the levels of disturbance and acceptable luminances for the two whiteboard screens fall within the values found for the conventional computer screens. There are conventional screens that are better and worse than either of the two whiteboards (see Table 3 and Figure 12).
5.4. Comparison with recommendations
The SLL Lighting Guide 7: Office Lighting recommends luminaire luminance limits of ≤ 1000 cd/m2 for class I and II screens and ≤ 200 cd/m2 for class III screens when seen in negative polarity and ≤ 1500 cd/m2 for class I and class II screens and ≤ 500 cd/m2 for class III screens when seen in positive polarity. 5 A class I screen is defined as a screen suitable for general office use. A class II screen is suitable for most, but not all office environments. A class III screen requires a specially controlled luminous environment. These recommendations can be compared with the borderline luminances obtained by the adjustment method for the 1° light source since this source is about the same visual size as ceiling luminaires when reflected from the display screen. Based on these recommended limits, for positive polarity displays, there were four display screens (CRTP, LCMP, PIWP and OIWP) with disturbance borderline luminances much higher than the prescribed limit for class I and class II screens (≤1500 cd/m2). In particular, the disturbance borderline luminance of LCMP at around 12 000 cd/m2 was more than eight times the recommended limit. In contrast, the LCGP screen (class II), was found to have a disturbance borderline luminance lower than the recommended limit. For displays in negative polarity, it was found that while the disturbance borderline of the class III CRTN screen was well above its prescribed luminance limit(≤200 cd/m2), the actual disturbance borderline of the class II LCGN screen was less than its prescribed limit (≤1000 cd/m2).
The results of the adjustment test can also be used to estimate the percentage of the people who would not be disturbed by reflections of luminaires at the LG7 recommended luminaire luminance limits. From the results obtained at the 15° viewing angle, it can be shown that at the LG7 recommended luminaire luminance limits, all or nearly all people would not be disturbed by the luminaire reflections in the following screens: CRTP (100%), LCMP (100%), PIWP (98%), OIWP (100%) and CRTN (100%). On the other hand, only about 65% of people would not be disturbed by reflections in the LCGP and LCGN screens. This means that following the LG7 luminaire luminance limits would lead to more than one third of the people using these two screens being disturbed.
For all display screens, Lighting Guide 7 recommends that the average luminance of surfaces facing the display screen is ≤500cd/m2 with a peak surface luminance at ≤1500 cd/m2. The 10° and 15° sources in the experiment can be considered as being of similar visual size to the bright surfaces reflected in display screen such as walls, ceiling or windows. Based on these average surface luminance limits, the disturbance borderline levels of the LCGP, OIWP, CRTN and LCGP screens were lower than the recommended limit. Therefore, reflections on these screens may still be disturbing to observers even though the luminance of the bright surface was in accordance with the LG7 recommendations. For the remaining screens (CRTP, LCMP and PIWP), the disturbance borderline luminances were higher than or just about the prescribed average surface luminance (≤500 cd/m2). From the results obtained at the 15° viewing angle for the 10° light source, it can be shown that at the LG7 surface luminance limit (500 cd/m2), 100% of the people would not be disturbed by reflections in the CRTP, LCMP and PIWP screens. At the same surface luminance limit, around 80% of the people would not be disturbed by the reflections in the OIWP and CRTN screens. For the LCGP and LCGN screens which have high gloss surface, the percentage of people who would not be disturbed by the reflections at the LG7 limit reduces to around 65–75%.
These results demonstrate that although current lighting recommendations attempt to prescribe various luminance limits to suit different screen reflection classes, the limits do not match actual observer responses to disturbing reflections on display screens. For display screens with a low-gloss surface, the disturbance borderline luminances were higher than the guidance suggests which indicates that the luminance limit can be raised. Yet, for display screens with a high gloss surface, the current luminance limits were found to be too high to prevent disturbing reflections. This suggests that the current recommended luminance limits need to be revised to take account of developments in the optical characteristics of display screens.
6. Modelling maximum source luminances
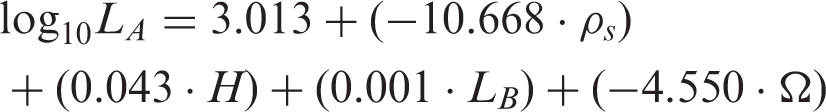
The results of the adjustment method allow the development of a model to predict luminaire luminance at the disturbance borderline. To select the parameters to be used in the model, a large number of lighting–display variables were studied for their relationship with the luminaire luminance at the disturbance borderline for 95% of users (LA). Some of these parameters were taken from other studies of the relationship between screen reflections and disturbance.2,12 The parameters examined included specular reflectance, diffuse reflectance, blur width, effect of haze reflection, foreground luminance, background luminance, space-averaged luminance, luminance ratio, luminance contrast, display screen modulation, visual size of the reflected light source and viewing angle from normal. Stepwise regression was used to construct the model. It was suspected that the relationship between lighting-display parameters and the luminance at borderline may not be linear. Therefore, a number of the stepwiseregressions were carried out using the base-10 logarithm of the borderline luminance (log10LA) as the dependent variable, as well as the borderline luminance.
Three criteria were used to identify the best model. First, the chosen model should explain the most variance in the borderline luminance using the fewest variables. Second, the direction of the relationship between each variable in the model and the outcome should not contradict the results without a logical explanation. Third, the model should work for all the screen types and for both display polarities. Based on these three criteria, a model using four variables was found. The four variables were:
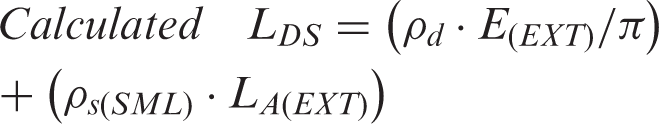
Specular reflectance of the display surface for the particular size of light source (ρs). The effect of haze reflection (H). Haze reflection is the third component of reflection that causes blurry reflection that can be seen surrounding the specular component. The effect of haze reflection (H) parameter is adapted from the blur effect parameter proposed by Howlett.
15
The effect of haze reflection can be calculated using the parameters obtained when measuring the reflection on display screens according to British Standards BS EN ISO 9241-7:1998 which uses 1° and 15° light sources. Background luminance of the display screen in cd/m2 (LB). Background luminance of display screen gives information on the screen brightness as well as the display polarity of the display screen. This parameter can be measured following the method in BS EN ISO 9241-7:1998.
13
Size (angular area) of the reflected light source subtended at the viewing position (Ω). This parameter determines the size of the light source from how it appears in reflection on the display screen to the observer. The area is calculated as a solid angle in units of steradians.
Disturbance borderline luminance (cd/m2)
Summary of the stepwise regression process of the models to predict luminaire luminance at the disturbance borderline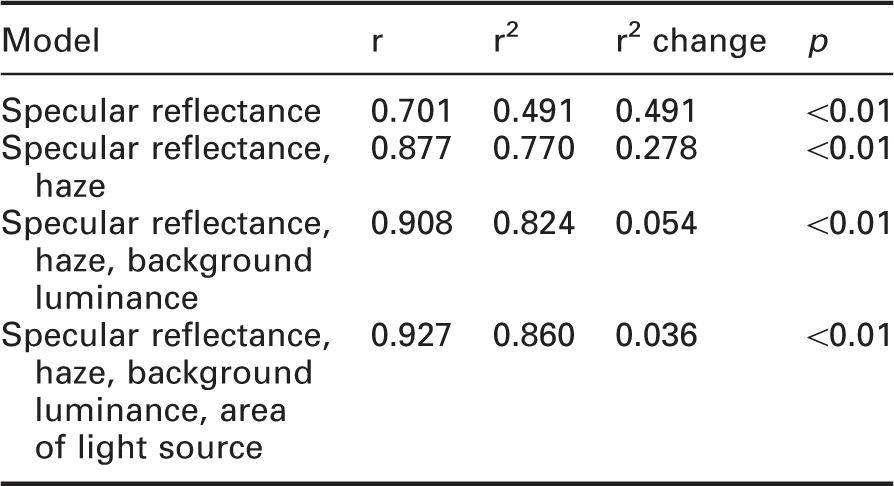
Specular reflectance for the particular size of light source
Effect of haze reflection
Background luminance of the display screen (cd/m2)
Area that the reflected light source subtends at the viewing position (sr)
This model can explain 86% of the variance in log10LA. The effects of the four variables are consistent with what is known about visibility. In order to be seen, the reflection on a display screen must have a luminous contrast with its background above threshold, the threshold depending on the size of the object and the adaptation luminance. The visibility of a reflection also depends on the sharpness of the edges. Blurred edges mean the luminance profile of the reflection changes gradually, thereby reducing its perceived or subjective contrast and making it less conspicuous.
1
The predictors in the models affect the luminance contrast and the edge sharpness of the reflections in ways that makes them logical determinants of the disturbance caused by reflections on display screens.
Specular reflectance has a negative relationship with log10LA (Figure 15) because the specular reflection contributes to the brightness (and luminance contrast) of the reflections and the distinctness of their edges. When the reflection is more distinct, the minimum luminance needed to notice and be disturbed by the reflection is therefore lower. The effect from haze reflection relates positively to log10LA (Figure 15) because the haze reflection helps blur the edge and lower the peak luminance of the reflection. Both actions contribute to the reduction of perceived contrast. With less perceived contrast and blurred edges, the source of reflection can have a higher luminance before being considered disturbing. Background luminance of the display screen has a positive relationship with log10LA (Figure 16) because the increased background luminance reduces the luminance contrast between the reflection and the background which makes the reflection less conspicuous and disturbing. The luminance of the source of the reflection therefore can be higher. The behaviour of the background luminance in the model justifies how display screens in positive polarity with higher background luminance (e.g. 100 cd/m2) are less sensitive to reflections than the display screens in negative polarity with lower background luminance (e.g. 0.1 cd/m2). The size (area) of the reflected light source relates negatively with log10LA (Figure 16). Increasing the size of the reflection reduces the contrast threshold for seeing the reflection. This in effect lowers the luminance of the reflected source that the observers find disturbing. Specular reflectance plotted against the predicted luminance at the disturbance borderline for two sizes of light source, 2.39 × 10⁻⁴ sr and 2.39 × 10⁻² sr. Each curve is for different values of haze effect, H = 1, H = 4 and H = 8. The display background luminance is fixed at 200 cd/m2 Area of the reflected light source plotted against predicted luminance at the disturbance borderline for two specular reflectances, ρs = 0.005 and ρs = 0.01. Each curve is for different background luminance of display screen, LB = 0.1 cd/m2, LB = 100 cd/m2 and LB = 200 cd/m2. The effect of haze reflection is fixed at H = 4
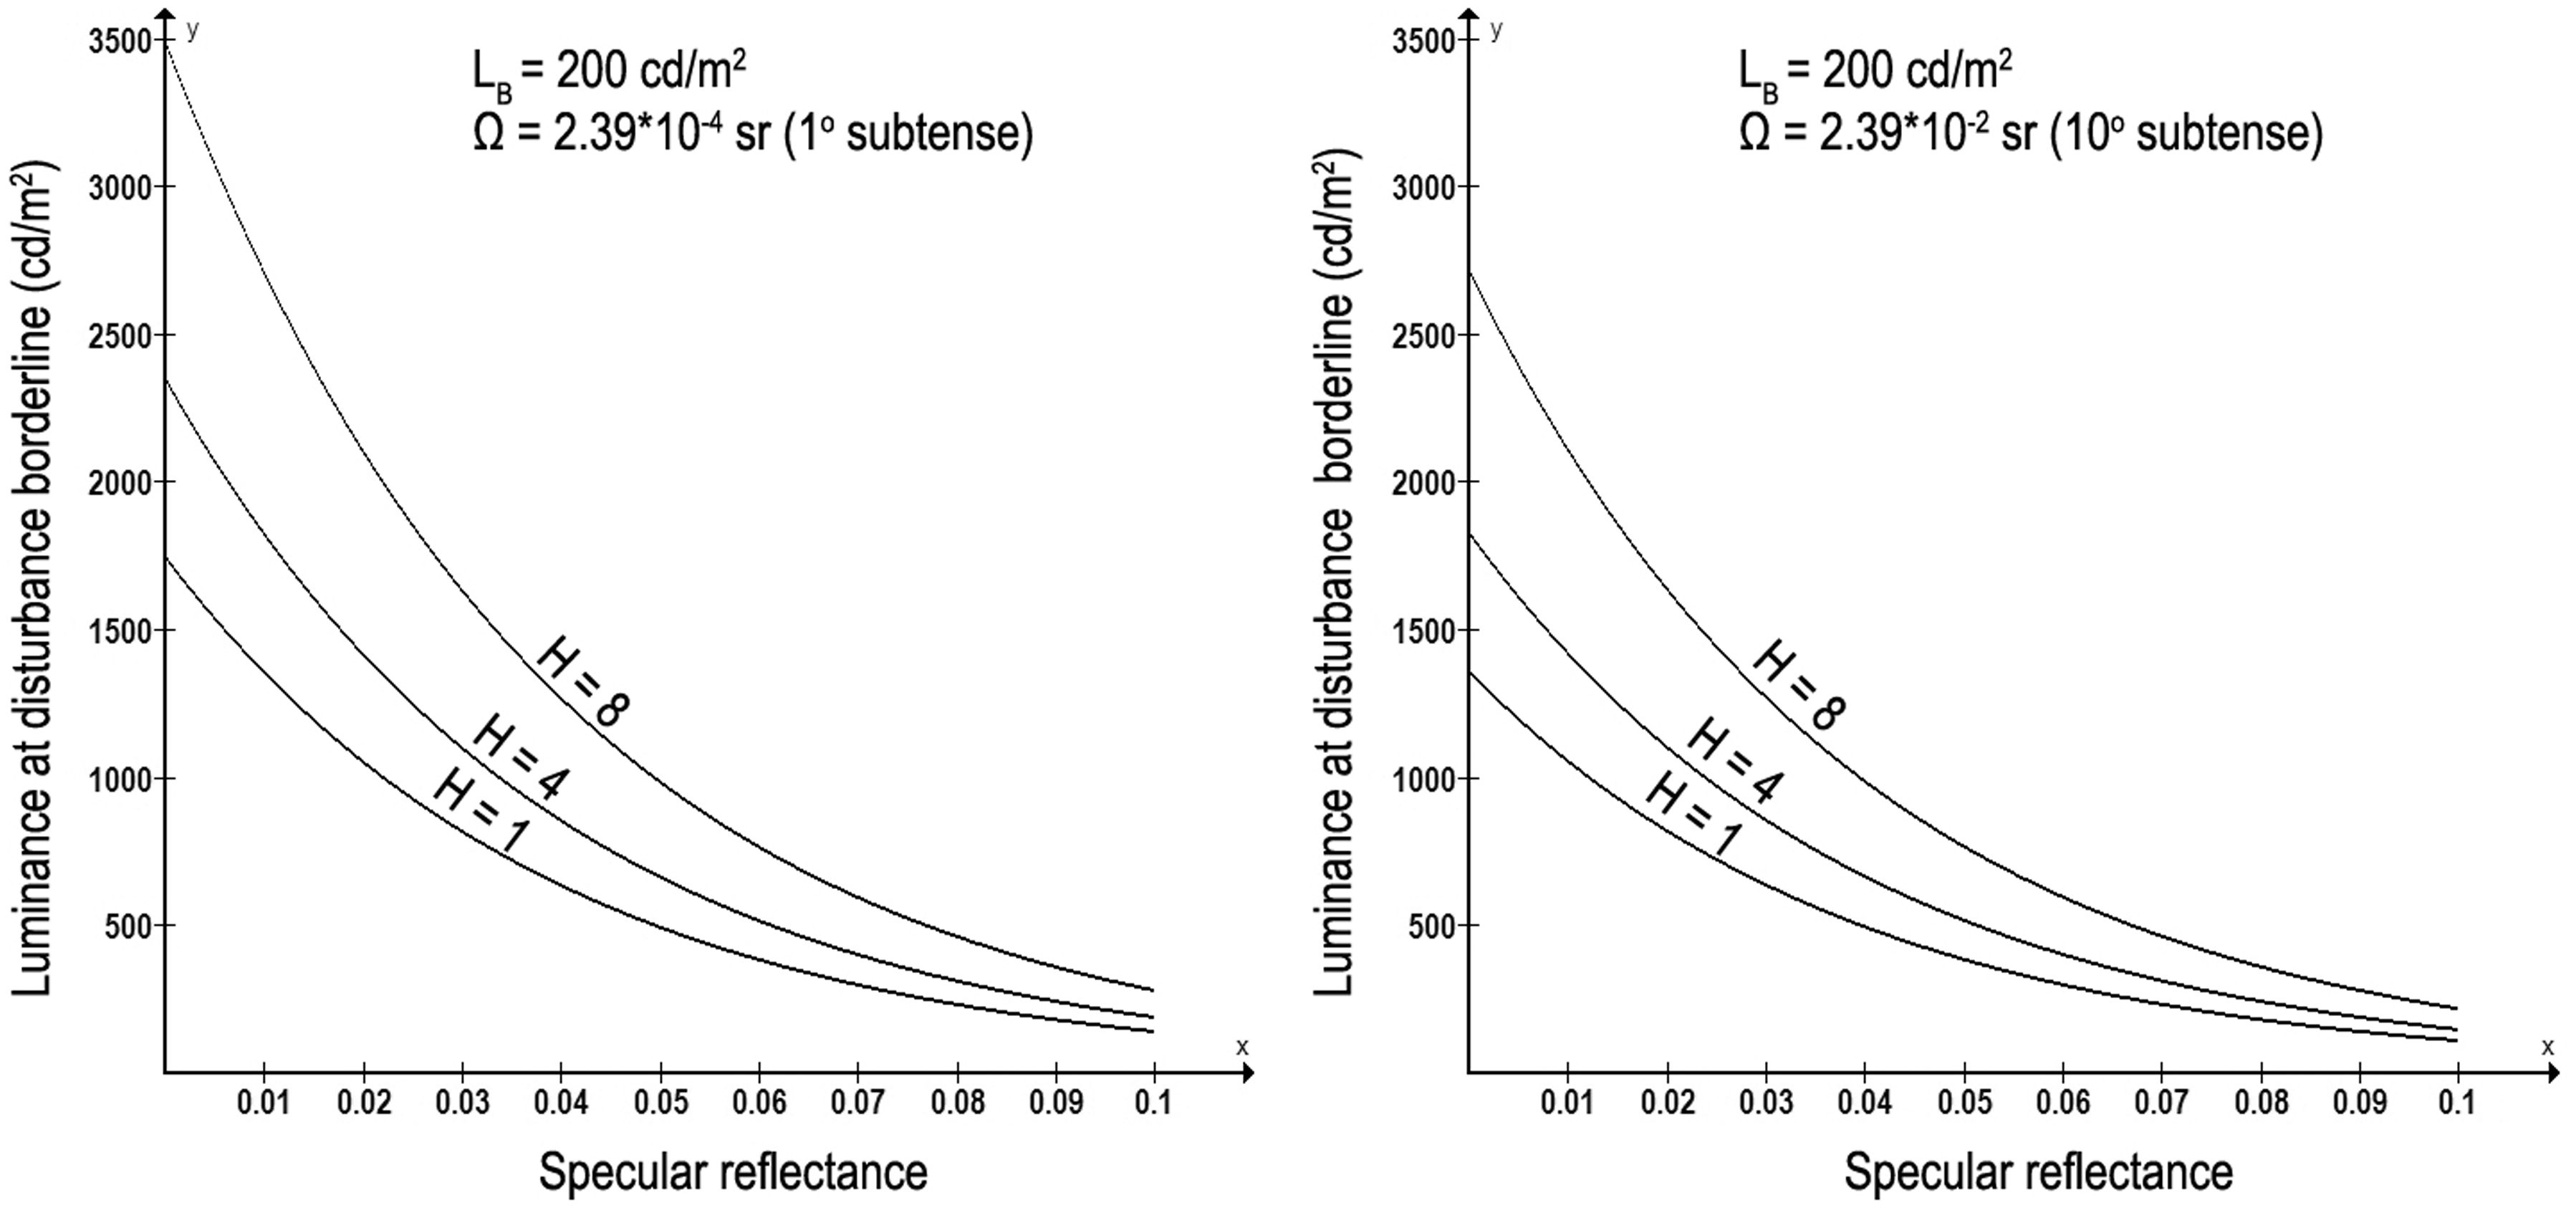
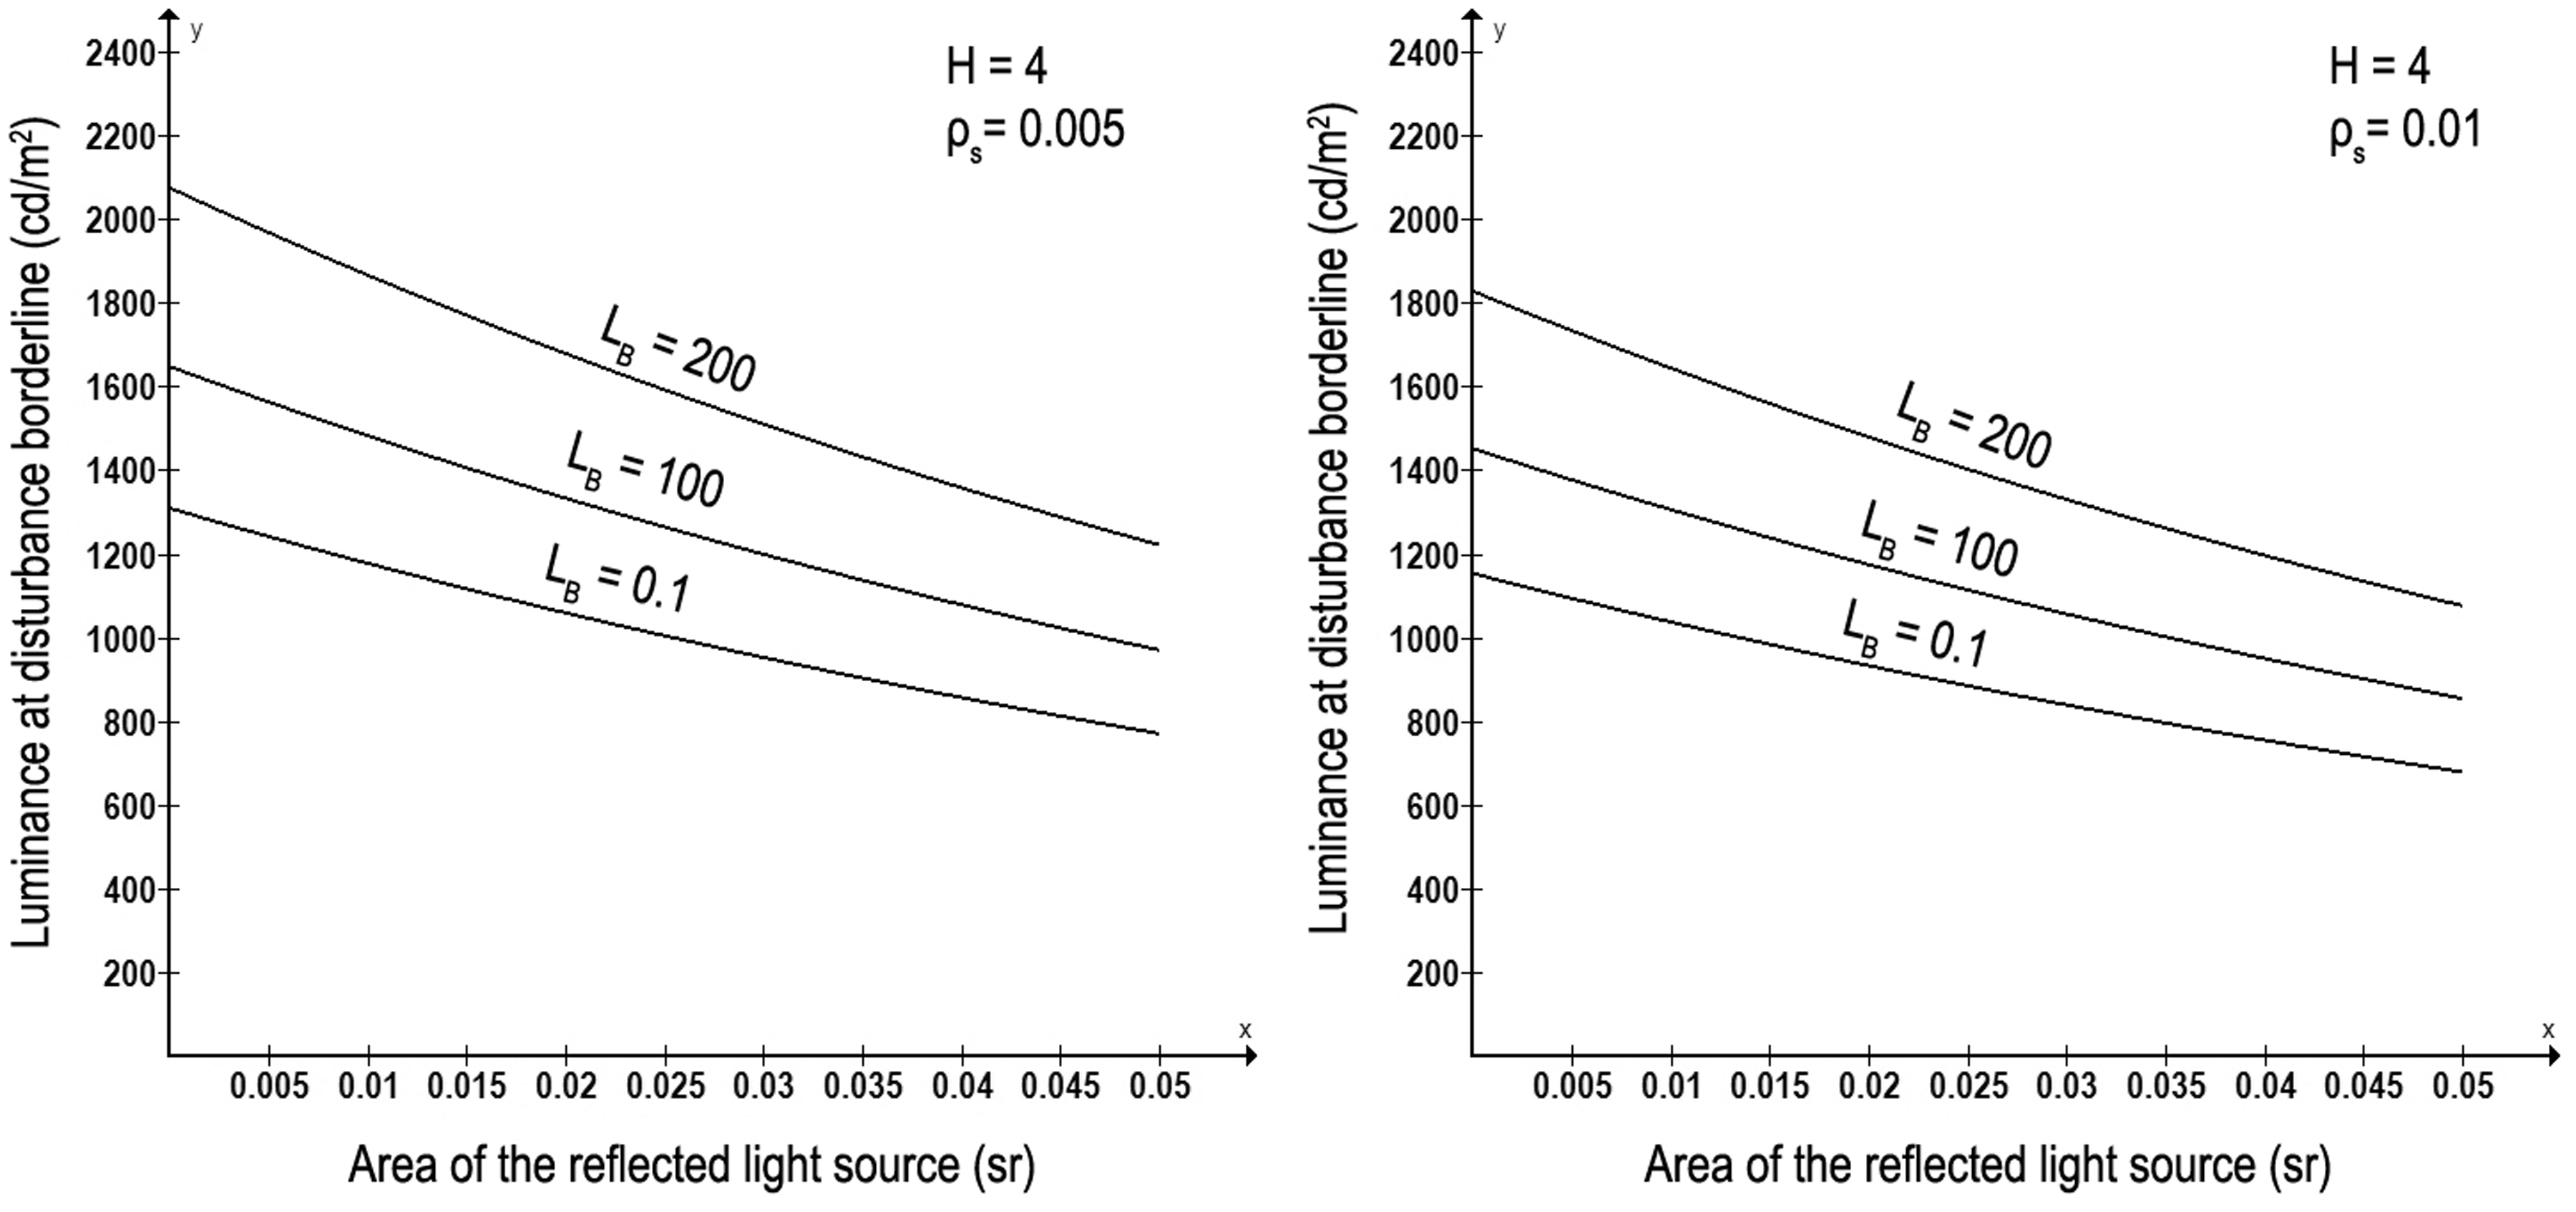
Figure 17 shows the predicted log luminance at disturbance borderline plotted against the actual log luminance at disturbance borderline satisfied by 95% of participants in the adjustment test. The model is able to predict the luminance at the disturbance borderline for a variety of screens in our test with high accuracy (r2 = 0.86). The r2 values for individual screens vary between 0.73 and 0.99.
Predicted log10LA plotted against actual log10LA that satisfied 95% of participants in the adjustment test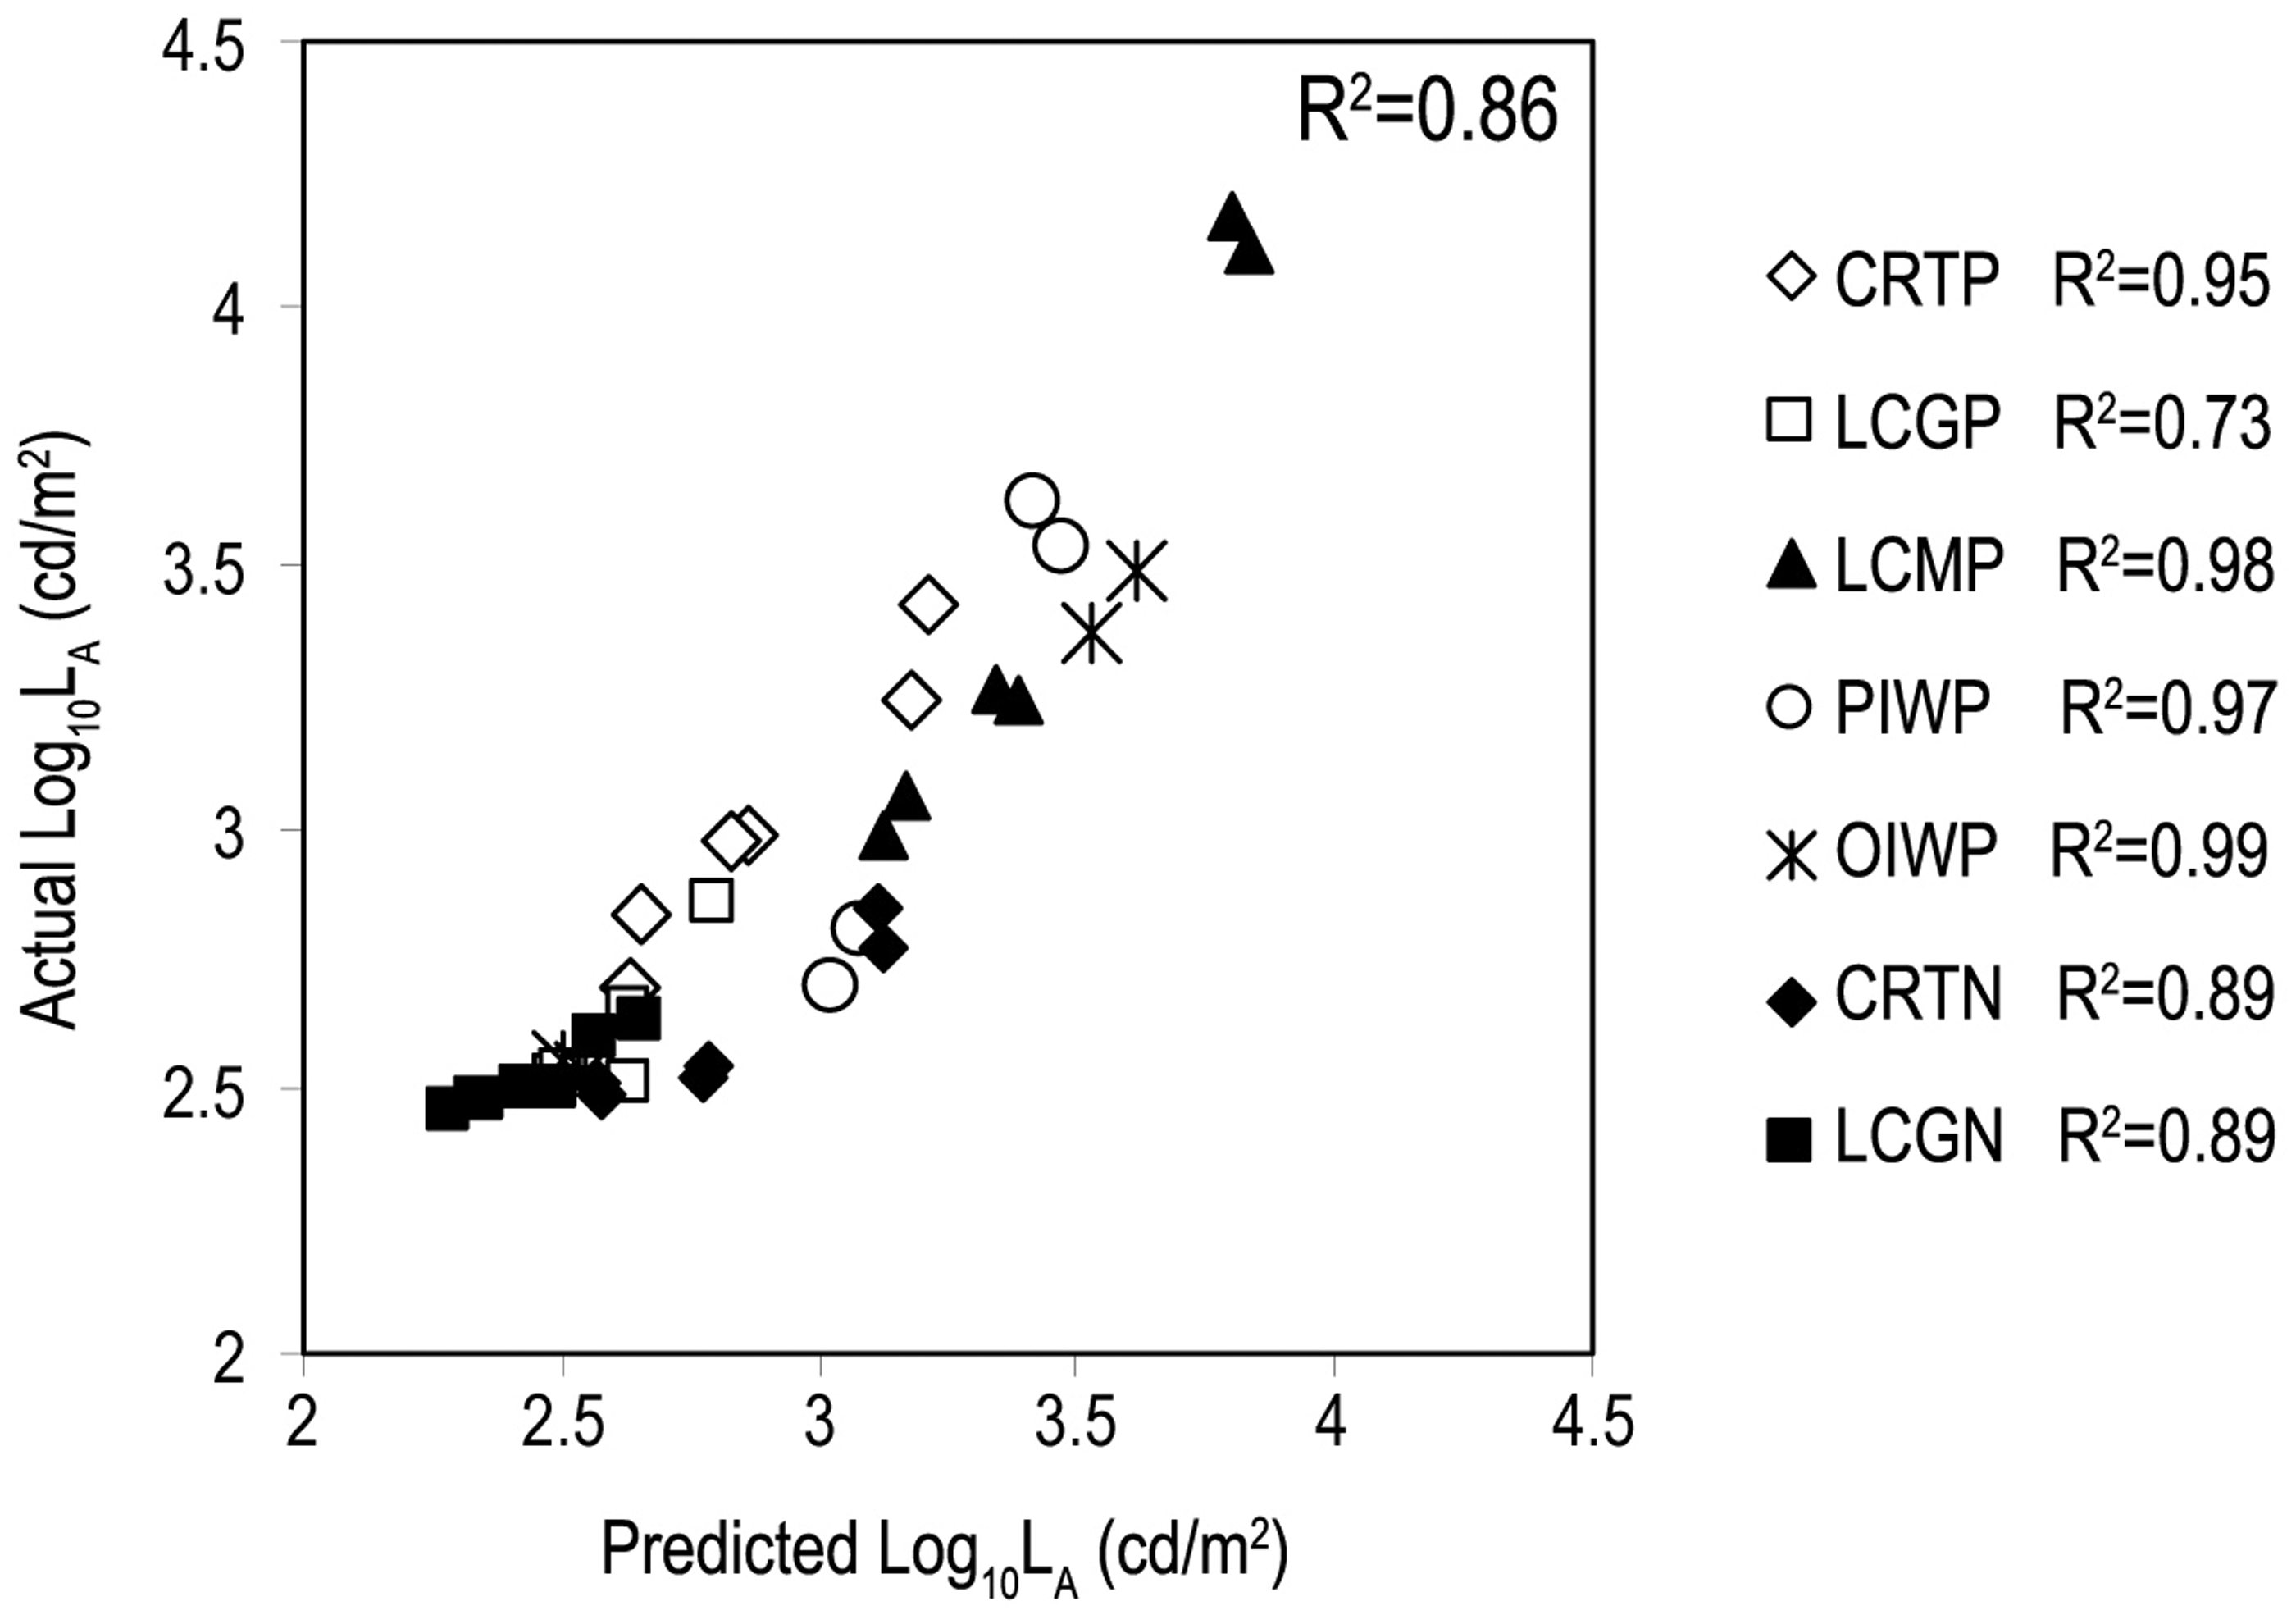
7. Modelling disturbance rating
Summary of the stepwise regression process of the model to predict the disturbance rating
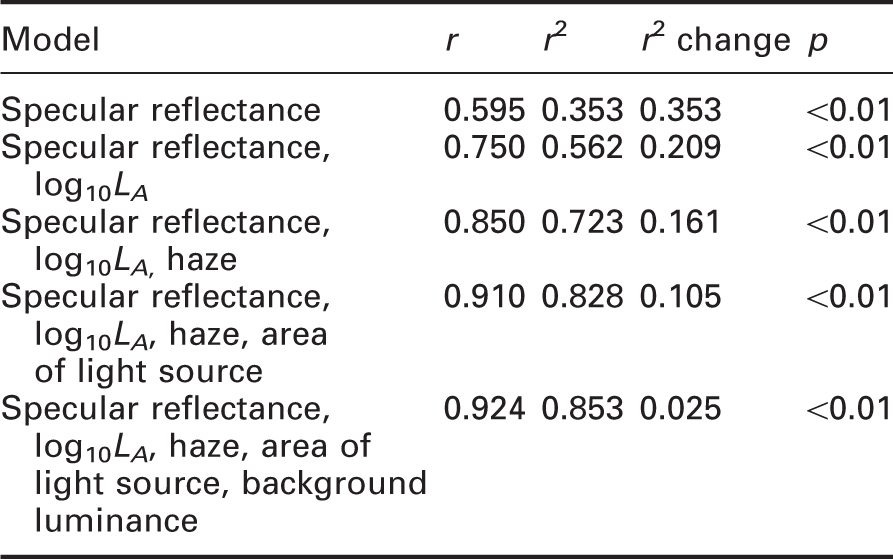
It can be seen that the inclusion of each successive variable significantly improves the variance of the disturbance rating accounted for by the model. With five predictors (specular reflectance, logarithm of the luminance of the light source, haze, area of the light source and background luminance), the goodness-of-fit of the model was r2 = 0.85. The model is given by Equation (6). Note that a higher disturbance rating means a less disturbing screen reflection:
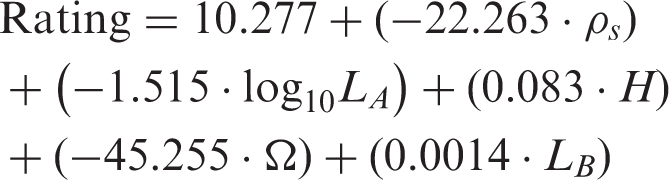
Figure 18 shows the predicted disturbance rating plotted against the actual mean disturbance rating obtained from the experiment. The variance explained is r2 = 0.85 for the analysis with all screens included. For individual display screens, r2 values vary between 0.71 and 0.93.
Predicted disturbance ratings plotted against the actual disturbance ratings for all screen types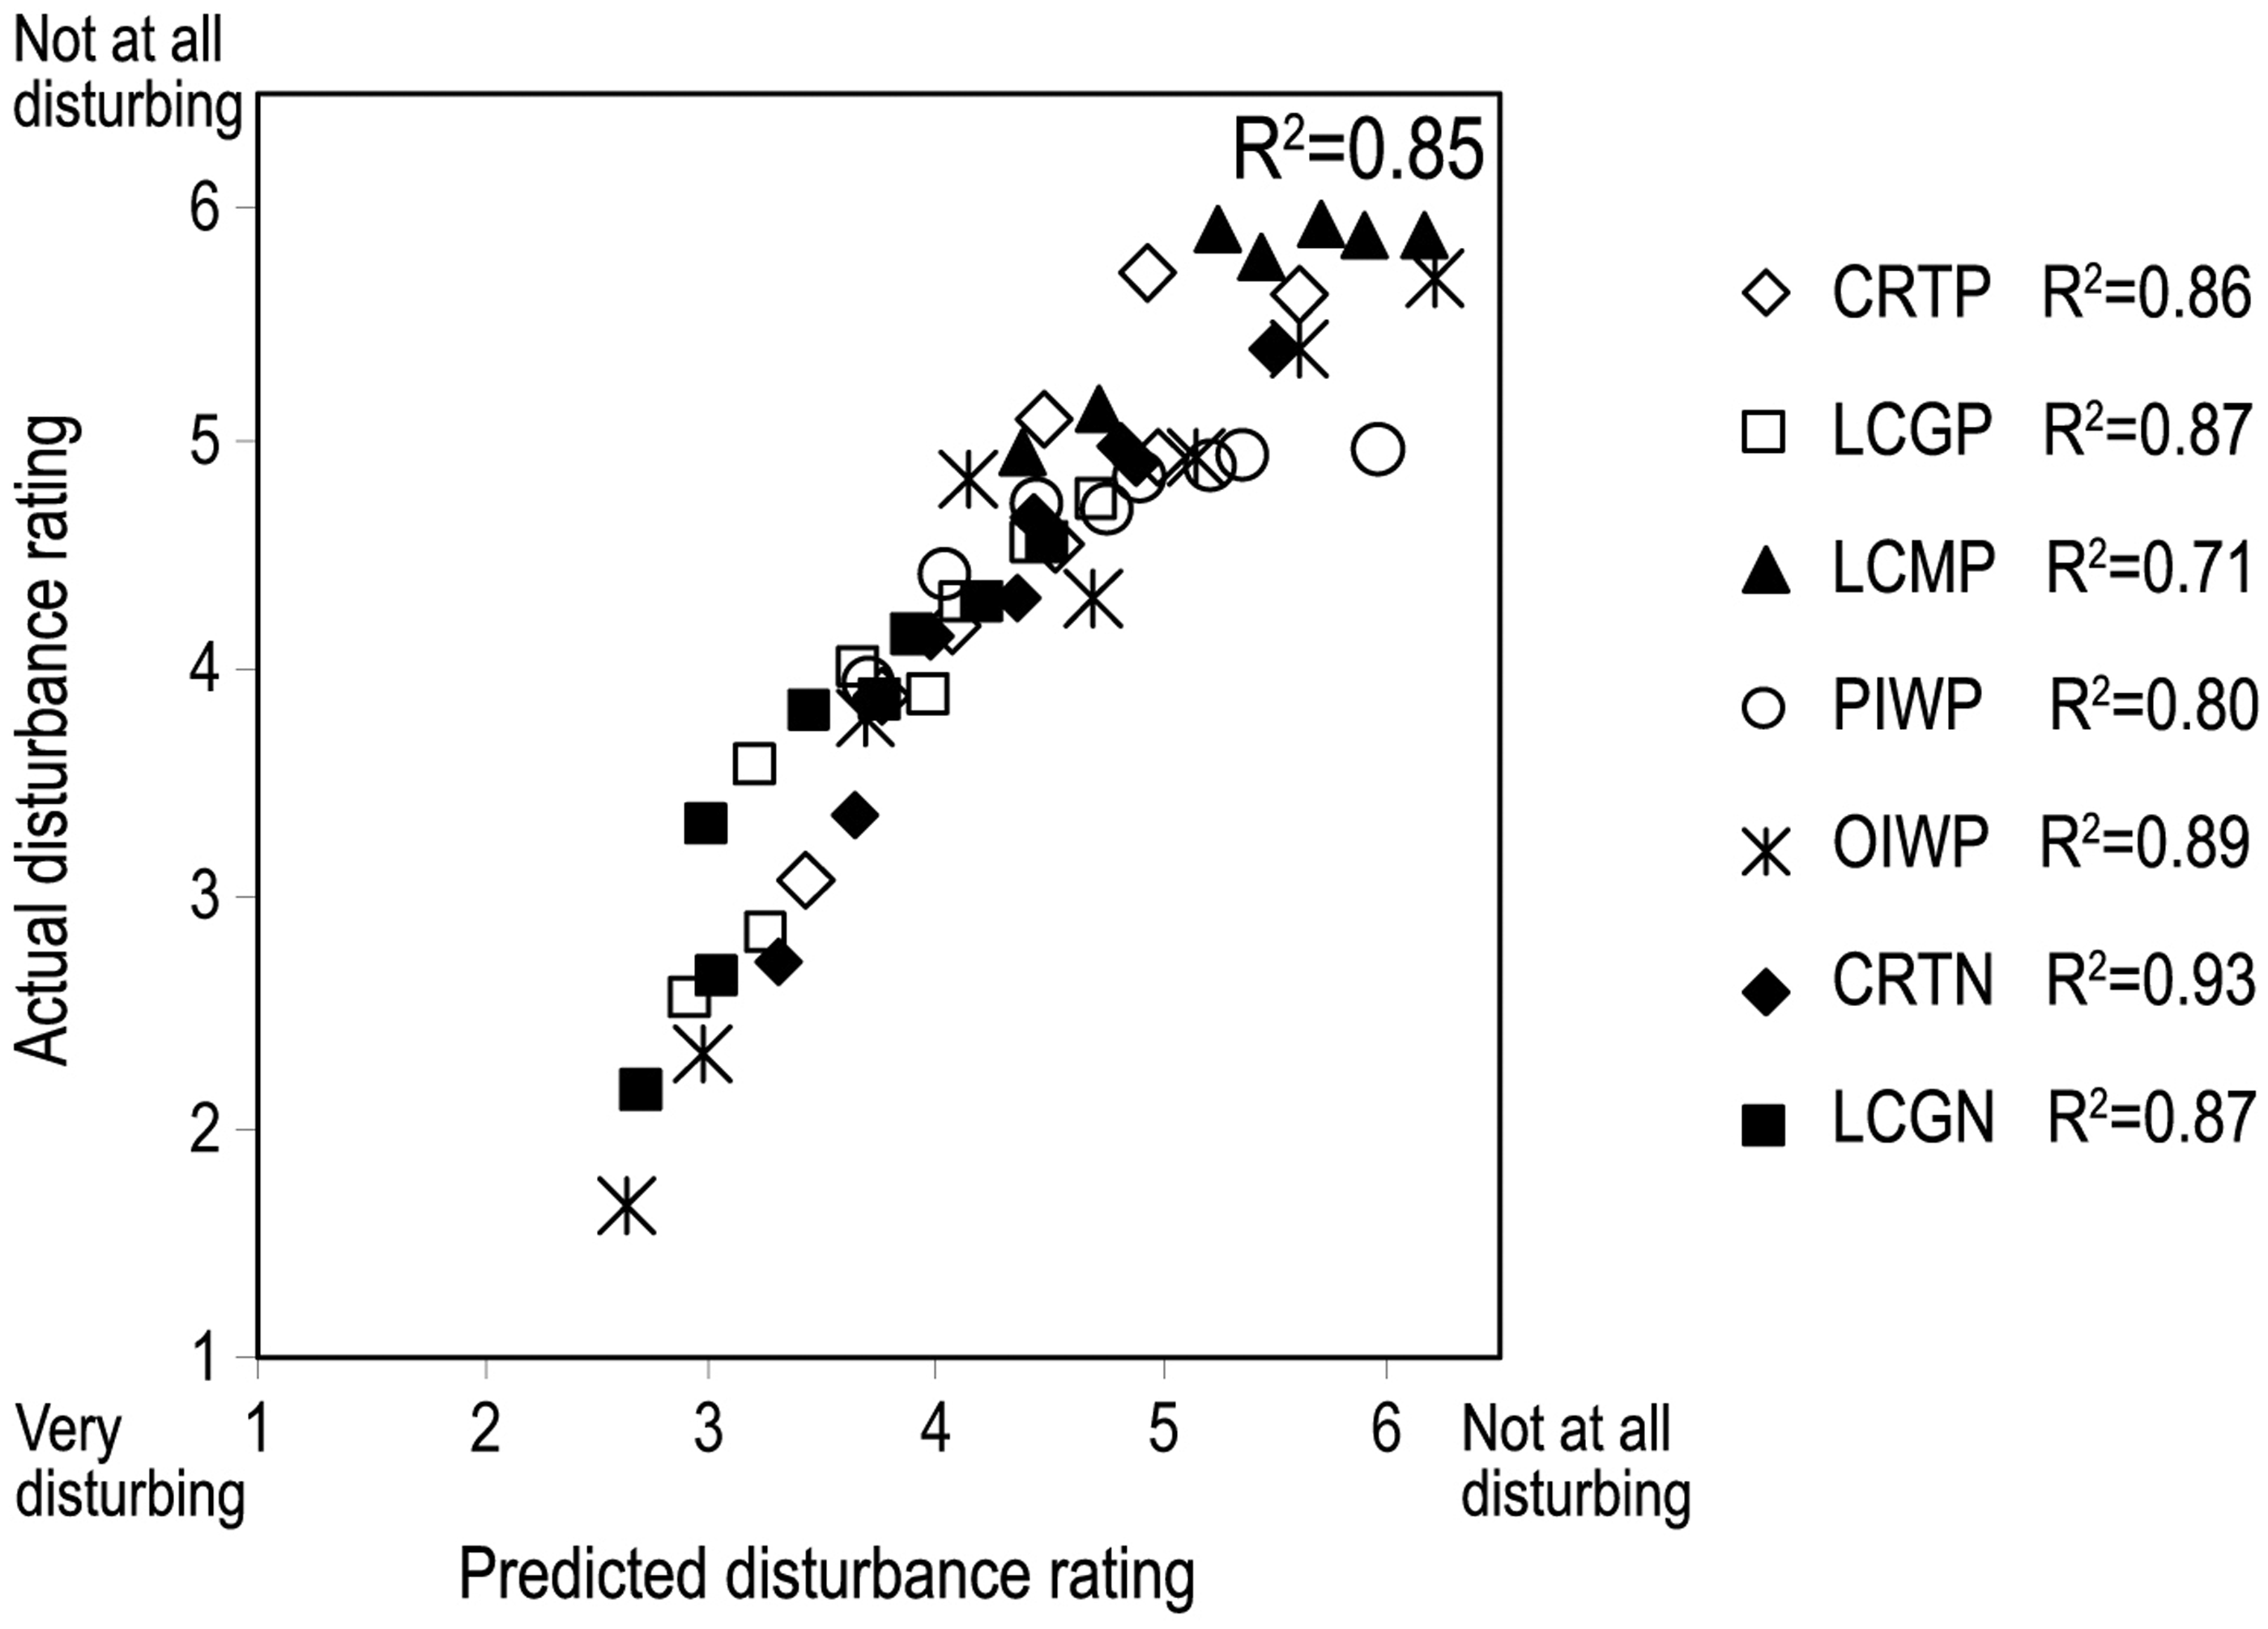
8. Applications of the models
There are a number of applications for the models in lighting design, both specific and general. An obvious specific use of the models is identification of the appropriate lighting to match chosen or existing display screens. If the optical properties of the display screens are known or can be measured, for a given specular reflectance (ρs), effect of haze reflection (H) and background luminance (LB), the models can be used to determine the limit of luminaire luminance (LA) that can be used without producing disturbing reflections, for a given size of light source (Ω). For example, for a glossy LCD with ρs of 0.033, H of 1.31 and LB of 250 cd/m2, the permissible luminance for a circular luminaire with a diameter subtending 1° (Ω = 2.39 × 10⁻⁴ sr) is around 884 cd/m2. It is worth noting that both models can be used in this way; the maximum luminance model can be used directly while the category rating model can be used indirectly by assuming an acceptable value of the mean disturbance rating. For guidance, a comparison between the results from the luminance adjustment test and the category rating test revealed that, at thedisturbance borderline where 95% of the people were not disturbed by the reflection, the disturbance rating was between 5 and 5.5, depending on the size of the light source. 22 The standard rating can be set lower on the scale but the percentage of people disturbed by thereflection will be increased.
One benefit of these models is that they allow a trade-off between the luminaire luminance limit and the size of the light source. Therefore on the condition that the luminaire has a high luminance, the appropriate size of the luminaire can be calculated in order to keep the reflection from being disturbing. Reduction of the apparent size of the luminaire can be achieved by locating it further away from the display screen, using appropriate louvres or by shielding the luminaire. Alternatively, if the visual size of the luminaire is fixed, the model can work out the borderline luminaire luminance so that the lamps are dimmed accordingly and disturbing reflections are avoided. It should be noted that the models were developed in experimental settings using a luminaire with uniform luminance, as is required by BS EN ISO 9241-7:1998 13 and BS EN ISO 13406-2:2002 14 to test screen reflection, whereas real luminaires often have a range of luminances. In order to ensure that disturbing reflections are avoided, it is recommended to consider the worst case and apply the model on that basis. That is, when using the model to determine thepermissible luminaire luminance (LA), the outcome should be treated as the maximum or the peak luminance of the luminaire that can be used for the specified screen. The most disturbing reflection comes from the light source with largest visual size and highest luminance. If the reflection coming from this light source isnot disturbing, the reflections of other sources with smaller visual sizes and lower luminances are unlikely to be disturbing.
Another specific application of the models is the identification of the appropriate display screens to match existing lighting: For a given average luminance and size of light source, the models can be used to determine suitable combinations of display screen properties. Since the models are based on luminance, it is a relatively easy task to quantify any existing luminous environment using a luminance meter or a HDR camera system. The light source in the models does not have to be a luminaire, but may be generalised to other bright surfaces seen reflected in the display screen or even windows. Again, it should be noted that the models were developed based on a single luminaire of a certain size whereas a real room often has more than one light source and their visual sizes vary. To apply the models to a real room, it is recommended to consider the worst case and then use the model to find out display screen properties to suit that situation. The most disturbing reflection will be experienced when looking at a screen with a low background luminance and a high specular reflection and little haze effect. If the reflection seen with this screen is not disturbing, it is unlikely that reflections from other screens will cause disturbance.
A general application of the models is to assist in the setting of lighting standards and recommendations. By making measurements of a number of screen types representative of those in widespread use, it would be possible to identify the luminaire luminance limits to be recommended for each screen type. In principle, these recommendations could be easily updated as screen technology changes. An alternative general approach in which the models would be useful would be to identify what screen types are most suitable for use with particular types of lighting.
9. Conclusions
The results presented in this paper have shown that the recommended luminaire luminance limits in current lighting guidance cannot ensure that disturbing screen reflections are prevented in all types of screen. For some screen types, including the interactive whiteboards now widely used in classrooms, the current recommendations for luminaires are too strict whilst for others, they are too lax. Partly, this is because of the rapid development in screen technology and partly because of the need for recommendations to be simple to understand. To rectify this situation, the results have been used to construct two empirical models. One model expresses the relationship between four variables related to the lighting and the screen characteristics (size of light source and specular reflectance, effect of haze reflection and background luminance of the screen) and the luminance of the light source that would be acceptable to 95% of observers when reflected in the screen. The other expresses the relationship between five variables (luminance, size of light source, specular reflectance, effect of haze reflection and background luminance of the screen) and the level of disturbance expressed by observers on a six point rating scale. Both models can be used to assign luminaire luminance limits to ensure disturbing reflections are not seen in specific screens or to identify which screens can be used with specific lighting without disturbing reflections. Given information about a range screen types currently in use, the models could also be used as the basis for generating more general recommendations on luminaire luminance limits, that could easily be updated as display technology changes.
However, before any of this can be done there is a need for independent testing and hopefully, validation of the models. The models have been developed from the data reported; so they can be expected to fit these data well. What is necessary is for the models to be used to make predictions for other screen types than those tested here and for those predictions to be compared with actual measurements of the 95% disturbance borderline or the mean rating of disturbance made by other observers. Some validation of the disturbance rating model was carried out by using the model to predict the conspicuous rating of screen reflection collected in a previous study by Miller. 23 To do this estimation of the effect of haze reflection (H) from the blur width of the test screens measured by Miller was required. It was found that the r2 between the predicted disturbance rating and the actual conspicuous rating varied between 0.70 and 0.90 depending on the type and polarity of the screen. This suggests that the predictors used in the model can actually predict subjective responses to reflections on display screens in an independent set of data, although further tests are needed that actually use measured values of the variables rather than estimated values.
As well as different screen types, the predictions of the models should be tested with more people and for real luminaires with non-uniform luminances. This latter factor might indicate how to determine the effective size of the luminaire as regards the luminances likely to cause disturbing reflections when the luminaire luminance is not uniform. At the very least it would suggest whether or not further work is needed to establish how to quantify the effective area of a luminaire as a source of disturbing reflections.
Footnotes
Acknowledgements
This project was carried out with support from EPSRC (grant ref. EP/F029276/1) and a PhD scholarship from the Royal Thai Government. We would like to thank Peter Boyce for his advice.