
Abstract
In this article, we advocate a theoretical perspective that views the firm’s ego-network as a configuration of multiple interdependent attributes, each granting resource advantages that may complement or substitute one another. Collecting empirical data from the German energy industry and using fuzzy-set Qualitative Comparative Analysis (fsQCA), we explore how five major network attributes (size, diversity, strength, innovativeness, and complementarity) combine to impact firm-level innovation. Based on the empirical results, we specify the orchestrating themes that constitute the “internal” and “external” fit of network configurations. Concerning internal fit, we identify a distinct pattern of complementing and substituting relations between network attributes. Specifically, we find that innovation performance results from the firm’s network combining network size or partner diversity or tie strength, and partner innovativeness or partner complementarity. Concerning external fit, we demonstrate that depending on firm size and internal intellectual capital, there are different “optimal” network configurations for different types of firms.
Introduction
Management scholars have long noted that the firm’s ego-network (i.e. its portfolio of direct ties to partner firms) affects a variety of performance outcomes, especially innovation. The strategic network perspective emphasizes that depending on the structural, compositional, and relational attributes of their ego-networks, firms can acquire valuable external resources that allow them to gain an advantage over their competitors (Gulati et al., 2000). Among others, research found that size (e.g. Ahuja, 2000), innovativeness (e.g. Stuart, 2000), and diversity of the firm’s ego-network (e.g. Jiang et al., 2010) positively impact innovation performance.
While past studies treated the effects of such network attributes as independent from one another, currently, this independence assumption has become subject of criticism. In particular, scholars noted that “(1) real-life organizations and networks consist of multiple characteristics simultaneously; and (2) the combined effect of these characteristics might be to some extent different from analyzing characteristics separately” (Pullen et al., 2012a: 921). In addition to the interplay between network attributes, existing literature only sparsely discussed how different firms might profit from different network types. Past research has been criticized for perceiving firms as “black boxes” and treating firm-level differences merely as a source of empirical noise (Phelps et al., 2012). Especially in the contexts of innovation and knowledge transfer, only few studies have examined how differences in firm characteristics influence the performance effects of network attributes (Pittaway et al., 2004).
To remedy those shortcomings, a growing number of scholars call for a perspective of “systemic fit,” understood as the multivariate interaction between network attributes, that explains if and how those attributes complement or substitute one another (e.g. Andrevski et al., 2016; Koka and Prescott, 2002; Wassmer, 2010). Rather than examining the net effects of individual network attributes, those scholars shift the focus to the joint effects of network configurations, that is, specific attribute combinations (Pullen et al., 2012a). At this juncture, however, the configurational perspective on strategic networks is still in its infancy. In particular, little is known about the exact combinations of attributes that constitute high-performing network configurations, as well as on the “orchestrating themes” (Furnari et al., 2021: 9) that underpin the interactions between network attributes.
In this article, we aim to contribute to this emerging stream of research by identifying high-performing network configurations, by analyzing the logics of “fit” underlying those configurations, and by exploring combinatory patterns of network attributes that occur across different types of innovation-enhancing networks. Specifically, we provide answers to the following two research questions:
Research Question 1. What are the combinatory patterns that constitute the “internal fit” of the firm’s network configuration, that is, how do network attributes complement and substitute one another in affecting innovation?
Research Question 2. What are the combinatory patterns that constitute the “external fit” of the firm’s network configuration, that is, how do “optimal” network configurations differ depending on the firm’s internal resources?
Our article starts by reviewing the literature on strategic networks and firm-level innovation. We posit that while network scholars have embraced the concept of network configurations, prevailing theoretical approaches are correlational rather than truly configurational. In response, we propose a (neo-)configurational perspective on firms’ ego-networks and explain the central tenets of such a perspective. Based on those considerations, we develop a research model to explore how various network attributes combine with one another and with firms’ internal resources to affect innovation. In an empirical study in the German energy industry, we draw on fuzzy-set Qualitative Comparative Analysis (fsQCA) and meta-set analysis (Misangyi and Acharya, 2014) to uncover four major types of effective network configurations. Based on the results, we specify combinatory patterns within those configurations and derive theoretical propositions describing those patterns.
Theoretical background
Ego-network attributes and firm-level innovation performance
For long, research has assumed that inter-firm networks have a strong impact on firm-level innovation (e.g. see Phelps et al., 2012, for an overview). The main rationale is that a network of inter-firm ties enables the focal firm to acquire valuable external resources (e.g. Zaheer and Bell, 2005). Such “network resources” are embedded in the relationships and the social structure in which firms operate (Gulati et al., 2000). They add to and enhance their internal resource bases and thus help improve performance outcomes (Lavie, 2007). In the context of innovation, network resources usually encompass intangible assets such as technological or market-related information, know-how, and skills (Ahuja, 2000).
The potential for obtaining resource advantages is particularly determined by the firm’s ego-network, that is, the immediate set of partners (Phelps et al., 2012). Although the global structure of network connections can play an important role (e.g. Ahuja, 2000), the ego-network captures the firm-specific cooperation pattern and thus serves as the “natural” unit of analysis for firm-level outcomes (e.g. Rowley et al., 2000). Furthermore, the ego-network is the basic component of broader systems of inter-firm cooperation, such as industry networks (e.g. Phelps, 2010). Hence, ego-networks “are fundamental to understanding and interpreting the pattern and structure of the overall network” (Carnovale and Yeniyurt, 2014: 2).
Regarding the impact on firm-level outcomes, literature contends that the ego-network “is a complex concept comprising multiple dimensions” (Wassmer, 2010: 150). Namely, ego-networks encompass a range of structural, relational, and compositional attributes that are closely linked to the resource advantages that firms may obtain. Network resources thus do not result from one single attribute but originate in conjunction “from the characteristics of the relationships, from the structure of the ego-network itself, or from alters’ characteristics” (Zaheer et al., 2010: 65). Accounting for this, scholars have recently started to shift the focus toward network configurations that “can simultaneously incorporate various attributes that jointly determine the firm’s access to network resources” (Andrevski et al., 2016: 812).
Research has yielded some first insight on what optimal network configurations might look like. Andrevski et al. (2016) and Pullen et al. (2012a) provide evidence that network attributes on the structural, relational, and partner level complement one another and must appear together for firm-level innovation. Ter Wal et al. (2016) and Xie et al. (2016), in contrast, demonstrate that different network configurations, each encompassing a few selected attributes, can equally result in favorable outcomes. In addition, a larger number of studies investigated bilateral interactions between network attributes. Those works show that some network attributes have mutually reinforcing effects (e.g. Pullen et al., 2012b), whereas others are redundant or even conflicting in their impact on performance (e.g. Gilsing et al., 2008).
In sum, several network constructs have been shown to affect firm-level innovation, with a number of moderating effects added in. Still, more clarity is needed on how network attributes simultaneously and interactively impact innovation. Particularly, previous works have largely been restricted to two-way or at best three-way moderation between network attributes (Andrevski et al., 2016) and thus leave room for efforts to better explain the more complex, multilateral interactions within network configurations. On that note, we argue that strategic network research would profit from an appropriate theoretical lens for capturing causal complexity. In what follows, we thus propose a (neo-)configurational perspective (Misangyi et al., 2017) on firms’ ego-networks and their impact on innovation.
Toward a neo-configurational perspective on firms’ ego-networks
While scholars start to adopt the notion of network configurations, the majority of strategic network literature is based on the correlation-theoretic approaches that traditionally dominate management research. In essence, correlational theories aim to isolate the net effects of explanatory variables (e.g. network attributes) on an outcome of interest (e.g. innovation) (Ragin, 2008). By this, they tend “to perceive the social world mainly in terms of linear relationships that take the correlational form of ‘the more of X, the more of Y’” (Delbridge and Fiss, 2013: 328). While this perspective has proven useful for studying many organizational phenomena, correlational theories are limited in their ability to represent causal complexity, that is, “situations where multiple explanatory factors combine in complex and at times contradictory ways, and where there is equifinality, that is, multiple alternative paths to an outcome” (Furnari et al., 2021: 3).
Configurational theories, in contrast, focus on deriving typologies of distinct combinatory patterns of explanatory variables (Delbridge and Fiss, 2013). Such approaches have a long tradition in strategy literature—including, for instance, Miles and Snow’s (1978) typology of prospector, analyzer, and defender firms. More recently, the introduction of set-theoretic methods of analysis (Ragin, 2008) brought configurational approaches into the broader focus of management scholars, resulting in the emergence of the neo-configurational perspective (Fiss, 2011). This perspective aims to provide a clear theoretical lens and uniform methodological standards to enable researchers “to more adequately theorize and empirically examine causal complexity” (Misangyi et al., 2017: 257).
In this article, we apply the neo-configurational perspective to the field of strategic network research. The basic idea behind this perspective is that organizational settings, such as the firm’s ego-network, follow a logic of conjunctural causation, that is, they are best understood as constellations of interdependent attributes (Furnari et al., 2021). Accordingly, organizational outcomes, such as innovation performance, would result from the systemic fit of the overall configuration rather than from any attribute in isolation (Fiss, 2011).
There are two aspects to this notion of systemic fit. On the one hand, configurations must possess “internal fit,” that is, congruence and consistency between the involved attributes (Grandori and Furnari, 2008). In our case, network attributes that display such consistency may be perceived as “optimal” configurations, that is, “combinations of network characteristics that fit together [. . .] and are related to high performance” (Pullen et al., 2012a: 919). The nature of such optimal configurations depends on how network attributes complement or substitute one another (Andrevski et al., 2016). Some network attributes may represent “alternative ways” to foster innovation (Gilsing et al., 2008: 1722) so that their combination would provide little to none “extra benefits” (Rowley et al., 2000: 372), whereas other network attributes may display mutual enhancement (Gulati et al., 2011).
On the other hand, configurations require “external fit.” In our case, this means that the effectiveness of a particular network configuration depends on the firm’s characteristics and strategic requirements (e.g. Pittaway et al., 2004). Specifically, it can be assumed “that for each set of network characteristics, there exists an ‘ideal’ set of organizational characteristics [. . .] that yields superior performance” (Pullen et al., 2012a: 919). The notion that the effects of network configurations are contingent on firm-level factors further implies equifinality, the second important aspect of causal complexity (Furnari et al., 2021). Equifinality describes that an outcome may be achieved by several different pathways (Misangyi et al., 2017).
In what follows, we employ the lens of the neo-configurational perspective to explore patterns of fit within network configurations, and between those configurations and the characteristics of the firm. In the process, we follow the approach to configurational theorizing proposed by Furnari et al. (2021). They suggest that the development of configurational theories should encompasses three steps: scoping, naming, and linking. As a starting point, the scoping step involves the specification of a conceptual model that includes the key attributes that form the configurations to be examined. For us, this means to select a set of variables that represent the “building blocks” of the firm’s ego-network (Grandori and Furnari, 2008: 460). The naming step then draws on empirical observations to label configurations that lead to an outcome of interest, while the linking step circles back-and-forth between theory and empirical evidence to explain how and why the attributes within those configurations connect and operate together. The result of this procedure is theory in the form of “causal recipes,” that is, “formal statements explaining how the causally relevant elements combine into configurations in ways to produce a target outcome” (Park et al., 2020: 1497).
Conceptual model
Specification of network attributes
Following Furnari et al. (2021), the first step of configurational theorizing is the definition of a theory-guided conceptual model. This model should “describe which elements are important for the outcome of interest to occur and why, as well as which elements are causally not relevant and may be stripped away” (Park et al., 2020: 1498). Greckhamer et al. (2018) proposed three criteria for the selection of attributes. Namely, explanatory attributes should (1) be strongly grounded in extant theory, (2) collectively cover the most relevant theoretical perspectives on the phenomenon, and (3) minimize conceptual overlap with one another.
Up to this point, strategic network research has examined the effects of a broad range of network attributes. Thereby, past studies tend to categorize themselves based on the component of network architecture that they examine, be it the structural characteristics of the network topology (e.g. Ahuja, 2000), the compositional characteristics of the firm’s partner portfolio (e.g. Jiang et al., 2010), or the relational characteristics of network ties (e.g. Tiwana, 2008). As each stream focuses on one individual architectural element, strategic network research is somewhat fragmented and ambiguous regarding the terms, concepts, and variables employed (Wassmer, 2010).
Consequently, there is currently no established uniform framework of network attributes that suits the purposes of our work. In our model building, we therefore decided to take one step back and start by delineating the underlying mechanisms, that is, the different types of resource advantages that firms can obtain from their networks (Gulati et al., 2011). In a second step, we then select specific network attributes that distinctively relate to either one of the defined advantages (for a similar approach, see Andrevski et al., 2016). Following this logic, we arguably can ensure that all three criteria by Greckhamer et al. (2018) are met.
In the main, network scholars somewhat concur on what resource-based mechanisms affect firm-level innovation. Studies tend to explain performance effects of network attributes based on two major types of resource advantage: (1) resource access, that is, “the transfer bandwidth of network resources,” and (2) resource quality, that is, “the value of network resources furnished by the partner” (Gulati et al., 2011: 220). Thereby, the two types of resource advantage are perceived as equally important. Zaheer and Bell (2005), for instance, argue that to understand the effects of firms’ networks, studies should not limit their viewpoints to either resource access or resource quality. Instead, innovation should be explained by the firm “accessing knowledgeable others” (Zaheer and Bell, 2005: 811).
In line with this notion, we argue that a configurational model of the firm’s ego-network should incorporate both attributes that reflect advantages in resource access and attributes that reflect advantages in resource quality. In sum, we propose a five-dimensional framework: “network size,” “partner diversity,” and “tie strength” for capturing access-related resource advantages; “partner innovativeness” and “partner complementarity” for quality-related advantages. Figure 1 illustrates the five attributes and summarizes our theoretical reasoning.
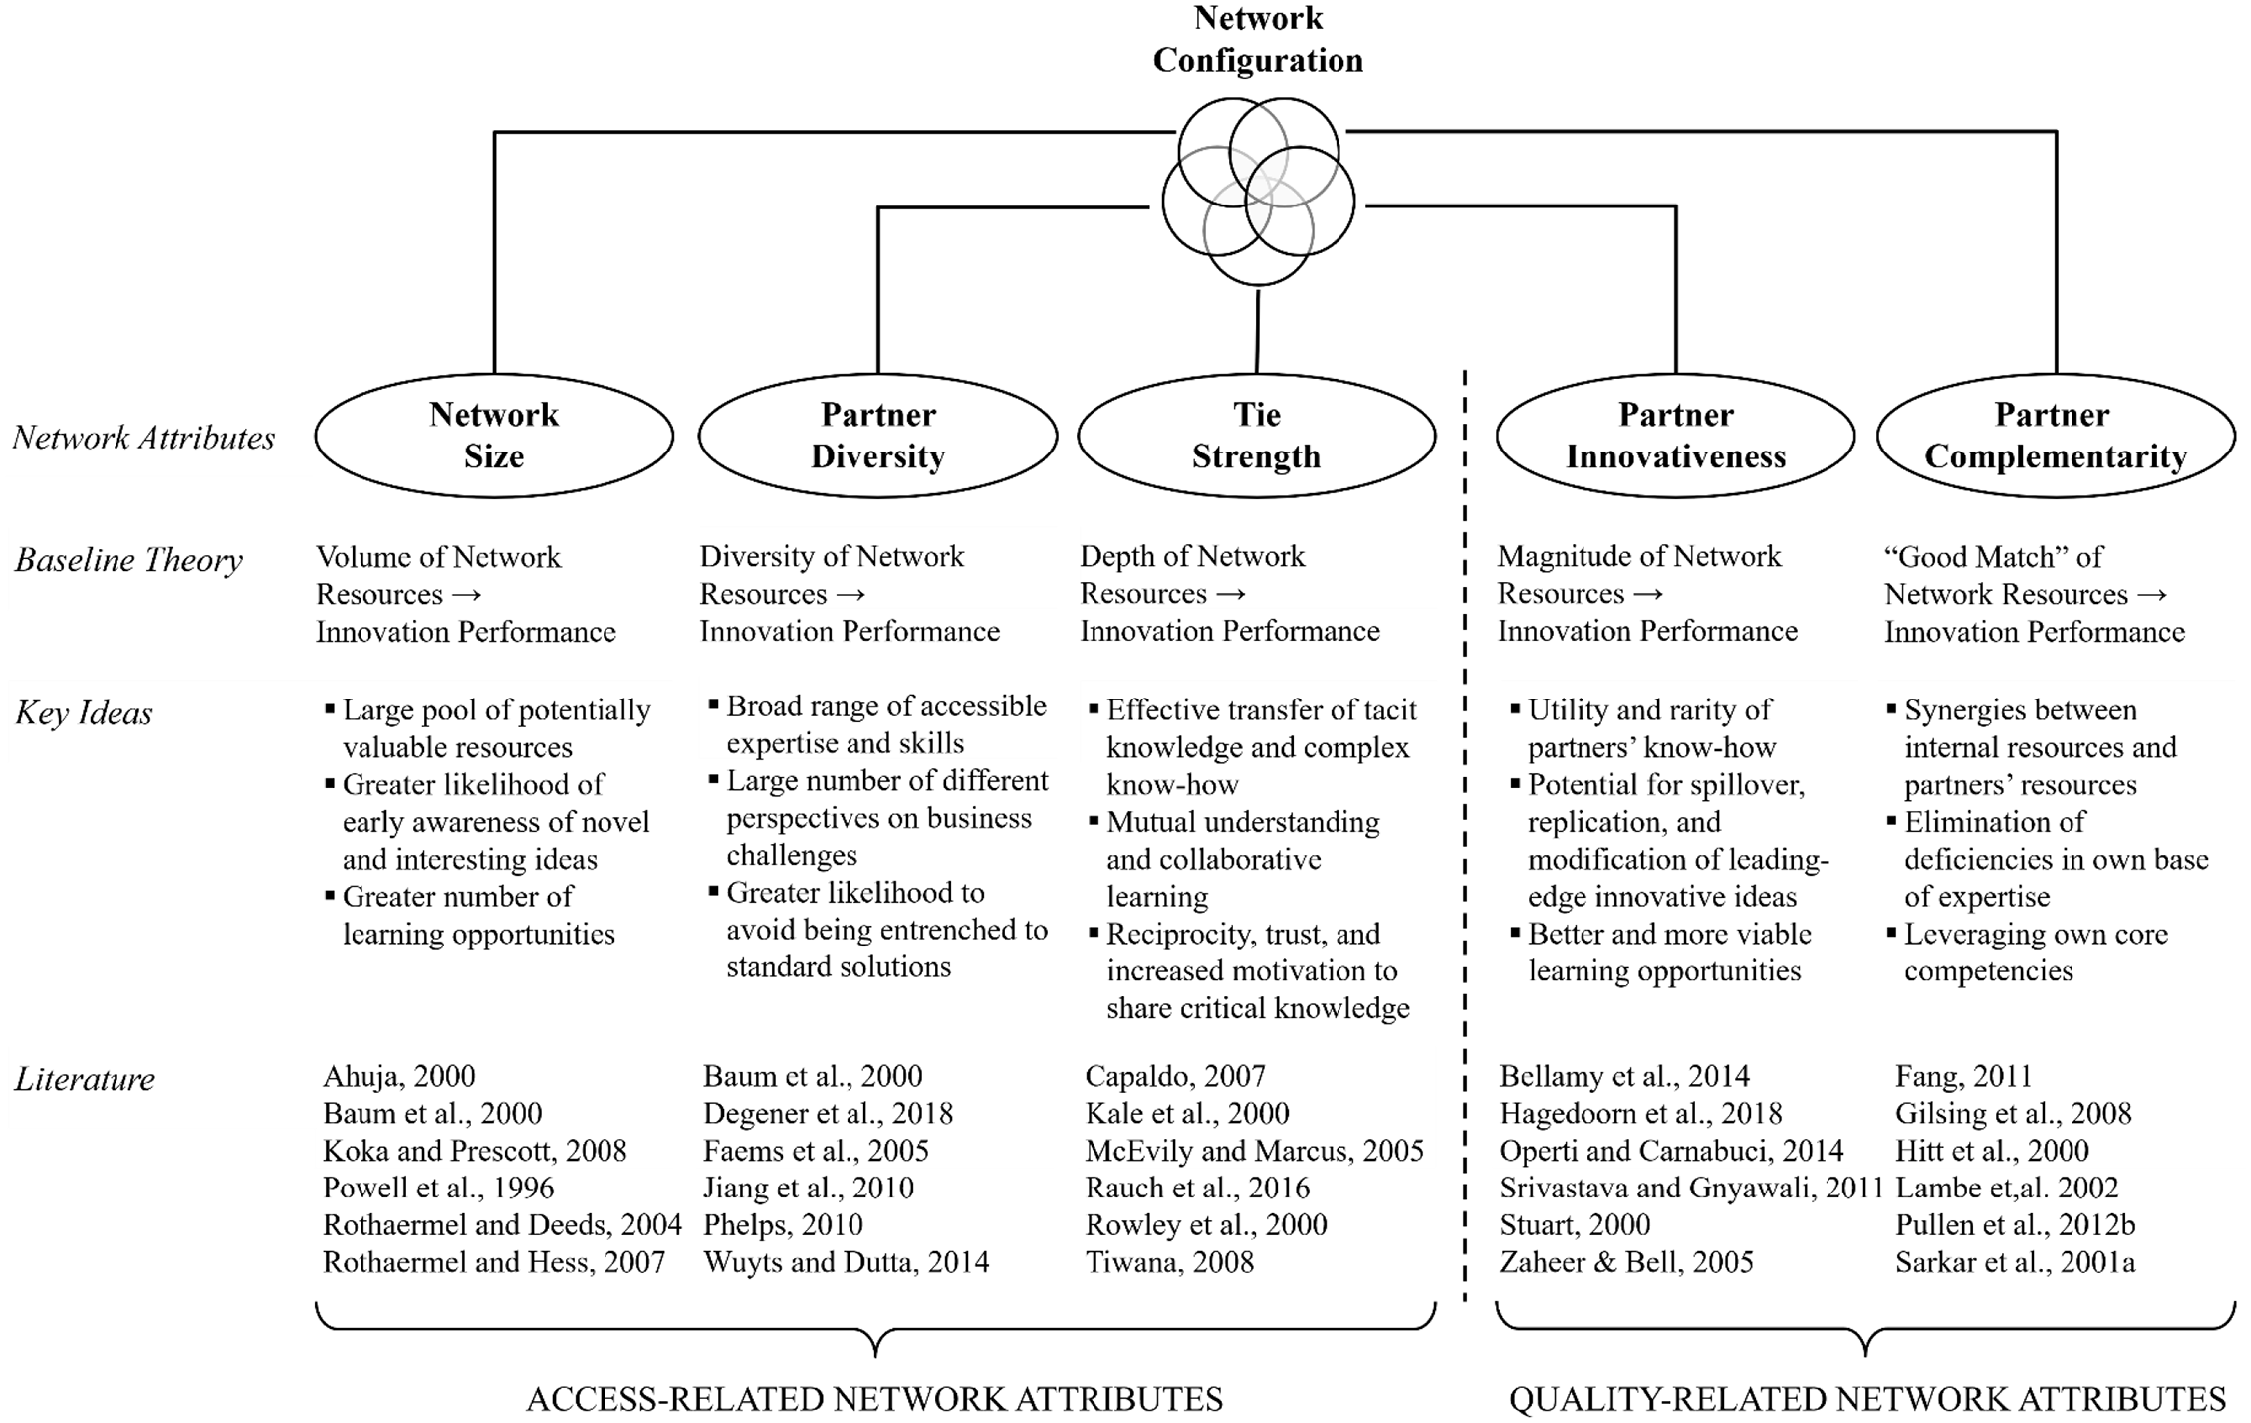
Building blocks of the firm’s network configuration.
Regarding resource access, we followed Koka and Prescott (2002), Gulati et al. (2011), and Phelps et al. (2012) who name three features of network resource access—“volume,” “diversity,” and “depth”—as the main causes of firm-level performance. Each of the access-related attributes included in our model reflects one of those characteristics and thus one specific mechanism of how companies gain innovation advantages from their ego-networks:
1. Network Size: Network size (hereafter “NS”), that is, the number of partners in the firm’s network, is associated with the volume of network resources that the firm can access (Koka and Prescott, 2002). With a larger network, the firm can draw from a larger pool of ideas and expertise to solve innovative problems (Ahuja, 2000). Also, it is more likely to become aware of new solutions and opportunities early (Powell et al., 1996). Although there seems to be some threshold beyond which the benefit of NS diminishes (Rothaermel and Hess, 2007), most literature associates a larger network with higher innovation performance (Wassmer, 2010).
2. Partner Diversity: Innovation further depends on the diversity of know-how that firms can access by their ego-networks. We chose to represent this by the network attribute of partner diversity (hereafter “PD”) which describes the extent to which alters operate in different market segments, use different technologies, or take different roles along the value chain (Degener et al., 2018; Jiang et al., 2010; Rothaermel and Deeds, 2004). A network with high levels of PD opens a larger number of perspectives on innovation challenges. Consequently, the firm obtains more opportunities to learn and experiment, may prevent being entrenched to solutions that reflect the current industry “orthodoxies,” and develop product concepts and designs with substantial degrees of novelty (Faems et al., 2005).
We consider it important to mention that there is another network attribute that has been frequently linked to resource diversity: Burt’s (1992) concept of structural holes, that is, the degree to which the firm’s partners are not connected to one another. Structural holes reduce the redundancy of network contacts and are thus assumed to provide a range of information benefits (e.g. Zaheer and Bell, 2005). On the one hand, bridges across structural holes connect the firm to different clusters within the network and expose it to different kinds of knowledge (e.g. Ahuja, 2000). On the other hand, hole-rich ego-networks indicate that the firm is positioned at a confluence point in the social structure and thus is able to control and mediate various information flows (e.g. Gilsing et al., 2008). This should generally result in greater and more timely access to relevant knowledge (e.g. Phelps, 2010).
As Burt’s (1992) structural hole theory encapsulates a number of information benefits, the concept of structural holes has been deployed in several research models and has been helpful in deriving insight on the overall functioning of networks. However, while the condensed theoretical nature of the structural hole concept is useful for determining the effects of the firm’s network in the aggregate, this same feature makes it difficult to disentangle specific resource mechanisms (Gulati et al., 2011). To minimize conceptual overlap in our model, we thus decided against including structural holes and rather focus on concepts for which the link between network attribute and underlying resource advantage is more clear-cut. In the case of resource diversity, recent works have revealed that while related, structural holes and knowledge diversity in the firm’s network are conceptually and empirically distinct phenomena (e.g. Ahuja, 2000; Gulati et al., 2011; Phelps, 2010). Phelps et al. (2012), for instance, thus suggest that compositional variables are more proximal indicators of access to diverse resources than structural holes. Following this line of reasoning, we include PD into our research model.
3. Tie Strength: Firms can also benefit from tie strength (hereafter “TS”), that is, the degree to which there are proximity of interaction, reciprocity, and trust between the firm and its partners (Capaldo, 2007). TS relates to the depth of resource access, that is, the extent to which firms can draw intensively from individual sources of knowledge (McEvily and Marcus, 2005). In the innovation context, relevant knowledge tends to be “sticky,” that is, difficult to codify and transfer (Tiwana, 2008). Strong ties help the firm overcome transfer problems by providing a context conducive for collaborative learning, joint problem-solving, and sharing of fine-grained knowledge across organizational boundaries (Kale et al., 2000).
Regarding resource quality, literature portrays two different value dimensions for network resources. On the one hand, resource quality can be depicted as a matter of “magnitude” (Bellamy et al., 2014). In this perspective, performance is mainly a function of the absolute value of network resources, that is, the degree to which partners possess the highest level of expertise compared to industry standards (Stuart, 2000). On the other hand, a substantial part of strategic network literature interprets resource quality as a matter of “good match” (Fang, 2011) or “additive fit” (Mindruta et al., 2016). Those works assume that “[t]he same resource may be of greater value to one organization than another” (Gulati et al., 2011: 214). Based on this distinction, we include the following two network attributes in our research model:
4. Partner Innovativeness: Partner innovativeness (hereafter “PI”) describes “the level of technological know-how, unique knowledge, and other innovation-related capabilities a network partner has accumulated over time” (Bellamy et al., 2014: 361). This network attribute is a frequently used indicator in studies that view resource quality as a matter of magnitude (Baum et al., 2000; Lavie, 2007; Zaheer and Bell, 2005). Those works argue that “innovative firms possess the highest quality technological capabilities” (Stuart, 2000: 794). Therefore, high levels of PI provide the firm with the most viable opportunities to learn from partner firms, replicate ideas, and create novel insights from the interaction (Srivastava and Gnyawali, 2011).
5. Partner Complementarity: Partner complementarity (hereafter “PC”) describes the degree to which partners contribute “unique strengths and resources of value to the collaboration” (Sarkar et al., 2001b: 360) and thus “are able to eliminate deficiencies in each other’s portfolio of resources” (Lambe et al., 2002: 144). This network attribute reflects how well the resource bases of the firm and its partners add to each other (Pullen et al., 2012b). Complementary resources from network partners may allow the focal firm to extend its internal resource base and create combinatorial rents by leveraging its core competencies (Hitt et al., 2000).
Selection of firm characteristics
Regarding firm characteristics, literature most prominently highlights the firm’s internal resource base as an essential contingency factor for the performance effect of networks. Phelps et al., (2012), for instance, note, “An organization’s internal resources can moderate the knowledge-creating benefits it receives from its collaborations” (p. 1135). Srivastava and Gnyawali (2011), Wuyts and Dutta (2014), and Zaheer and Bell (2005) also suggest that firms can leverage resource advantages from their networks only if they possess a strong internal capability base. Summing up those insights, Gulati et al. (2011) conclude that “an organization needs sufficient internal resources to create value from its network resources” (p. 221). Here, we focus on two facets of the firm’s internal resource base that are widely considered as theoretically relevant: (1) intellectual capital and (2) firm size. Alongside the five network attributes presented above, we include both variables into our research model (see Figure 2).
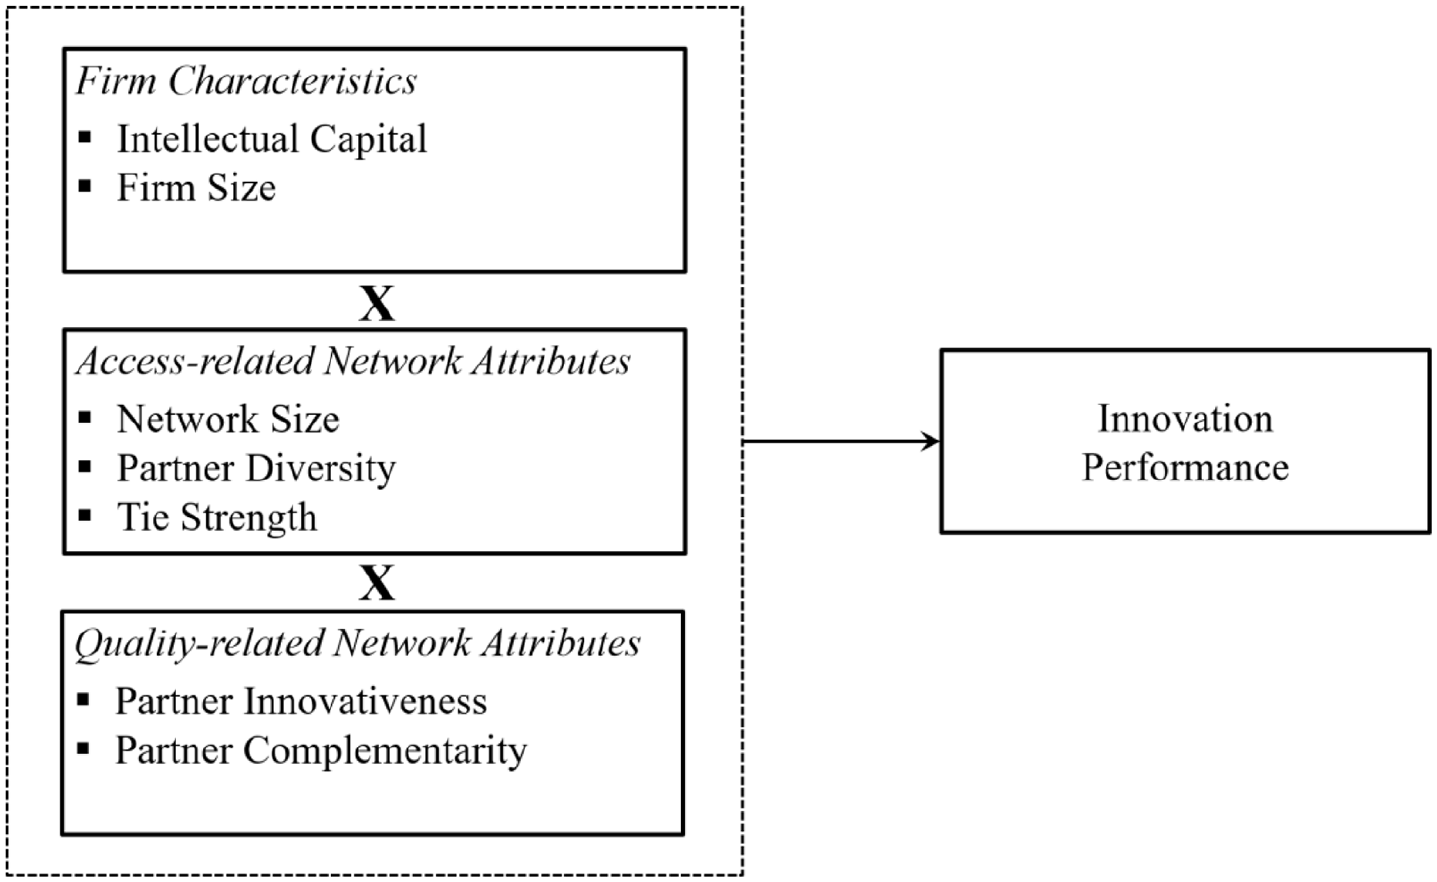
Research model.
First, research has frequently employed concepts such as innovative capabilities (Zaheer and Bell, 2005), R&D intensity (Operti and Carnabuci, 2014), or technological strength (Srivastava and Gnyawali, 2011) to investigate the interaction between firms’ resources and their networks. In essence, all those concepts can be interpreted as intellectual capital, that is, the sum of firm-internal know-how utilized for innovation (Subramaniam and Youndt, 2005). Firms with different levels of intellectual capital might profit from different types of network configurations. For instance, to learn from highly innovative partners, firms might need high levels of internal expertise themselves (Operti and Carnabuci, 2014; Wuyts and Dutta, 2014; Zaheer and Bell, 2005). In contrast, advantages associated with other network attributes might be easier to appropriate. Those network attributes might help the firm innovate successfully even if it lacks profound internal expertise on its own (Hitt et al., 2000).
Firm size is another dimension of the internal resource base that is theoretically relevant (e.g. Rothaermel and Deeds, 2004; Stuart, 2000). Firm size is related to well-elaborated innovation processes and sophisticated collaboration management routines (Demirkan et al., 2013). It also determines the “volume of activity” (Camisón-Zornoza et al., 2004: 337) in which the firm can engage when partnering with others. We thus view firm size “as an important element affecting the collaborations between firms” (Josefy et al., 2015: 770) and as a major contingency factor for the effectiveness of network configurations.
Although relatively few works have examined the interaction between firm size and the firm’s network empirically, there is some evidence that optimal network configurations may differ for large and small firms. Demirkan et al. (2013), for instance, found that large firms are better able to manage larger networks, and take advantage of a broad range of expertise. In contrast, Rauch et al. (2016) found that small firms may be better off with a network of few but closely knit partners since in such networks, costly conflicts may be prevented and deep access to partners’ expertise is ensured. We thus suppose that firms of different size will most likely benefit from different types of networks.
Methodology
As research methods should be consistent with the theoretical lens employed, this work draws on the configurational method of fsQCA (Fiss, 2011). The fsQCA approach relies on a set-theoretic logic to model the empirical relationships between attribute combinations and the outcome of interest. While an in-depth explanation of set theory is beyond the scope of our article (e.g. see Ragin, 2008), our methodology section provides brief explanations of the central features of fsQCA pertinent to our inquiry, namely, set membership, subset relations, and counterfactual analysis (Misangyi et al., 2017). Throughout, our approach follows the best practices for fsQCA in strategic management and organization research suggested by Greckhamer et al. (2018).
Research setting
The initial step in fsQCA studies is the definition of a sample of research cases. In contrast to correlation-theoretic methodologies which sample randomly to ensure representativeness, samples for fsQCA studies should result from purposive selection (Ragin, 2008). Research cases must be “theoretically relevant” to the phenomenon to be explained (Fiss, 2011). Particularly, the sample should adequately represent variation in the outcome of interest and the explanatory attributes (Greckhamer et al., 2018).
As research population, we selected the 300 largest local energy providers in Germany. The energy industry is an attractive contextual setting, especially as the importance of innovation and collaboration between utilities grows continuously. As distributed small-scale systems of energy production increasingly threaten the “centralized model” of traditional energy providers, the industry sector is amid a period of transformation (Eklund and Kapoor, 2019). For incumbents, there is a pressing need to explore new value propositions and engage in the challenging task of developing “a product or service that offers sufficient value to the customer to be attractive, but also generates sufficient value to the utility to be profitable” (Richter, 2013: 1232). On the technology side, this means that energy providers must find viable combinations of renewables, storage systems, and “smart” digital devices; on the business side, they must transition from commodity sellers to energy service providers (Dellermann et al., 2017). In all, the innovation challenge is largely architectural: utilities orchestrate component technologies into product and service bundles that must fulfill market, regulatory, and organizational requirements (Schilling and Esmundo, 2009). Thereby, strategic networks are a major asset (Kolloch and Reck, 2017).
Besides the high relevance for our research topic, there are further reasons for our sample selection. First, the organizational structure of utilities is not overly complex. Past literature argued that multidivisional firms can hardly be viewed as “unitary actors” in their strategic networking (Phelps et al., 2012: 1152). It is generally difficult to validly capture and interpret the networks of such firms. For firms that focus on a single field of business, the assumption of “unitary actors” is much more accurate. Second, our empirical study benefits from an adequate variation regarding the organizational context variables. Our population includes small, medium, and large firms (ranging from about 50 to 9000 employees). Also, German utilities differ considerably in their technological and innovation skills (Richter, 2013). Finally, by focusing on a single industry, we ensure that network indices can be compared meaningfully between firms (Rowley et al., 2000). Furthermore, the industry-specific nature of our sample controls for broader contextual factors that are not captured by our research model.
Data collection
Traditionally, the bulk of empirical studies employed archival data to capture firms’ strategic networks, drawing on alliance databases such as SDC (e.g. Andrevski et al., 2016; Lavie, 2007) and news retrieval sources such as Factiva (e.g. Phelps, 2010; Rowley et al., 2000). While this approach helps avoid the issue of informant biases, the use of archival data also has several shortcomings. In an extensive analysis of archival network data, Schilling (2009) demonstrated, for instance, that available alliance and news databases may suffer from inconsistent coverage, incompleteness, and a systematic overrepresentation of ties between large firms. She concludes that while archival data are still highly valuable and reliable for many study purposes, for some types of network research primary data collection is warranted. Specifically, primary data should be preferred when the analysis is at the firm rather than the industry level, when the sample includes many small and medium firms, and also for studies that require “accurate information about periphery firms” (Schilling, 2009: 257).
Following these notions, we collected data by a survey of key informants. Using key informants to obtain network data on the firm level is a well-established approach in strategy research (e.g. Fonti et al., 2017; Rank and Strenge, 2018; Sammarra and Biggiero, 2008). One of the most important concerns is to determine the appropriate informants within each firm. Taking into account the size and structure of our target firms, we decided to focus on CEOs as main sources of data (e.g. Wincent et al., 2010). Informants approached in other studies such as vice president of alliances or similar (e.g. Fonti et al., 2017) did not exist consistently across firms. This may have resulted in selection problems and the risk of informant role bias.
Following best practices in strategic network research, we aimed to supplement the CEO’s response by further informants wherever possible (e.g. Fonti et al., 2017; Rank and Strenge, 2018; Wincent et al., 2010). We contacted at least one further senior manager per firm, focusing on informants responsible for innovation or related functions such as R&D and Marketing (Sammarra and Biggiero, 2008) and restricting our selection to either members of top management or their direct reports (Rank and Strenge, 2018). By this approach, we assembled a total of 661 contacts.
After pretesting our questionnaire with 26 industry experts, we sent an email with the invite to participate in our online survey to all informants. In all, 128 complete responses were obtained. The data came from 93 firms (response rate: 31.0% at the firm level; 19.2% for the individual respondents). We controlled for non-response bias by comparing several observable characteristics (number of employees, sales, geographical region, firm age) of respondent and non-respondent firms. In general, larger firms (number of employees: t = 2.04, p < .05, sales: t = 2.02, p < .05) seem to be overrepresented in the final data. However, as our sample comprises 57 small (<300 employees), 25 medium (<1000), and 11 large utilities (>1000), variation requirements for fsQCA are clearly fulfilled (Greckhamer et al., 2018).
As configurational theorizing requires researchers to possess in-depth knowledge about the research cases (Fiss, 2011), we collected secondary data on each firm included in the final sample. Following previous works (e.g. Aversa et al., 2015), we assembled a broad range of sources, some publicly available, some provided to us upon request by the respondents. We explicitly focused on information about the firms’ innovation and networking efforts. Overall, we consulted a minimum of 50 documents for each firm, among others, annual reports, project documentations, company websites, blog posts, and articles in specialized and generalist press.
Research variables and construct measurement
Data on most research variables were collected based on item scales with 7-point Likert-type ratings. The outcome variable innovation performance was assessed by three items (Yli-Renko et al., 2001). As the energy industry lacks rich patent data and financial reports rarely include data on innovation performance, we followed the common approach of using managers’ self-report. To ensure the validity of this approach, we drew on objective data for triangulation. Namely, we scanned the winners and runner-ups of the four most important innovation awards in Germany as well as six major industry-specific innovation awards for the 3-year time span between 2016 and 2018. In all, sample firms earned 25 nominations in this period. For each firm, we calculated a count measure that added up nominations earned. The rank correlations between the count measure and the self-ratings were significant and adequately large (Spearman’s ρ = .36, p < .001; Kendall’s τ = .30, p < .001).
To depict the firms’ network, we implemented an egocentric design and employed an exchange-based name generator as the conventional approach “to measure access to resources known or theorized to increase the likelihood of particular outcomes” (Perry et al., 2018: 87). Focusing on knowledge as the key resource in the innovation context, we phrased our name generator item based on Sammarra and Biggiero (2008). Specifically, we provided the respondents with the following instruction:
Please name the firms from which your company received innovation-related knowledge within the last three years. This knowledge receipt may stem from formal exchange, e.g., during joint R&D projects, but also more informal exchange, e.g., from membership in innovation circles, among others.
To minimize recall error and ensure that also weak ties are captured, we explicitly encouraged respondents to include as many partners as they deemed relevant (Rank and Strenge, 2018). Furthermore, we employed additional prompting techniques to improve recall completeness such as probing again for missing alters at the end of the network section of the questionnaire (Perry et al., 2018).
By our name generator, we explicitly focus on the knowledge inflow of the focal firm. This approach takes into account that the networks of knowledge transfer are clearly asymmetric, that is, in any given network tie “knowledge seekers and sources can have different perceptions of the [. . .] interaction” (Sammarra and Biggiero, 2008: 811). In such networks, the self-report of knowledge receipt is considered an accurate indicator for the existence of a network tie as “the knowledge seeker is the best, perhaps the only, judge of the usefulness of knowledge received from a particular source” (Levin and Cross, 2004: 1482). In all, the sample firms reported 944 ties by which they received innovation-related knowledge. The variable NS was calculated as the number of ties that were stated for each firm (Wincent et al., 2010).
As the firms in our sample would unlikely constitute a closed network (i.e., many would cite partners outside of the sample), we had to rely on name interpreter questions to obtain data on the firm’s partners. This “proxy reporting” is widely used in network studies (Perry et al., 2018). As PD, PI, and PC all describe aspects of partners’ knowledge and also imply subjective value (e.g. PC describes the content of partners’ knowledge relative to the firm’s own knowledge), measuring those partner attributes based on the assessment made by the knowledge receiver seems appropriate following the reasons outlined above (Levin and Cross, 2004; Sammarra and Biggiero, 2008).
On that note, we asked the respondent to rate each of their partners on a single item reflecting PD (Jiang et al., 2010), PI (Zaheer and Bell, 2005), and PC (Fang, 2011). The use of single item scales helps reduce respondent burden and proved to yield reliable and valid indices of network composition (Perry et al., 2018). To measure TS, we deployed a three-item scale based on Kale et al. (2000). The reason for this is that strength of inter-firm relations is a construct that comprises several different dimensions and meanings that should be adequately covered by the measurement scales employed (Capaldo, 2007). For all four variables, we aggregated and averaged the respective ratings across all partners to obtain the overall indicator scores for PD, TS, PI, and PC on the level of the ego-network.
To determine firm size, we used data on the number of employees, the size of the domestic distribution area, and sales volume in 2016. The three indicators cover different aspects of firm size and are used in official industry statistics (Berlo and Wagner, 2013). Data were obtained by firms’ annual reports. The variable intellectual capital was computed by the respondents’ ratings on a four-item scale based on Subramaniam and Youndt (2005). For all variables in our study, Table 1 depicts means, standard deviations and correlations; Table 2 summarizes the items used in the scales.
Means, standard deviations, and correlations.
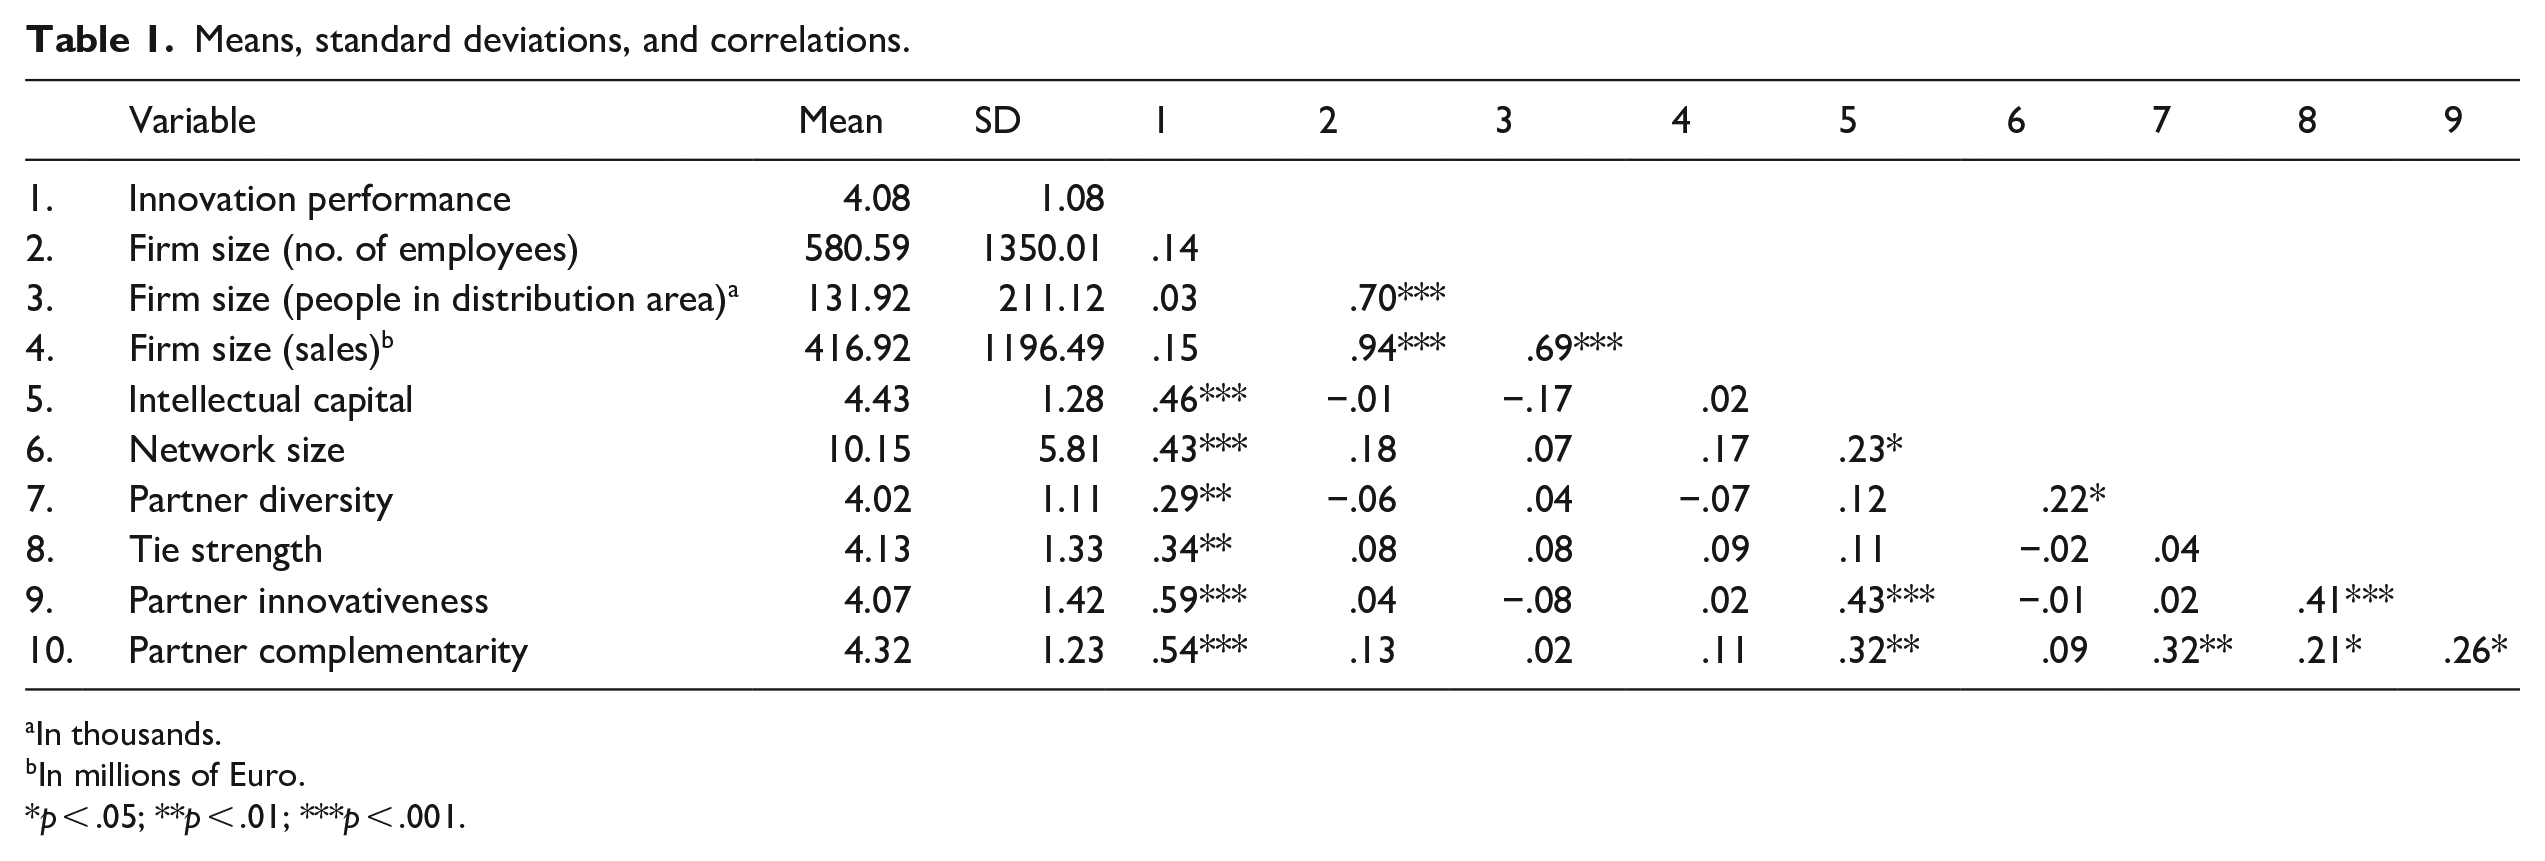
In thousands.
In millions of Euro.
p < .05; **p < .01; ***p < .001.
Construct specifications and item loadings.
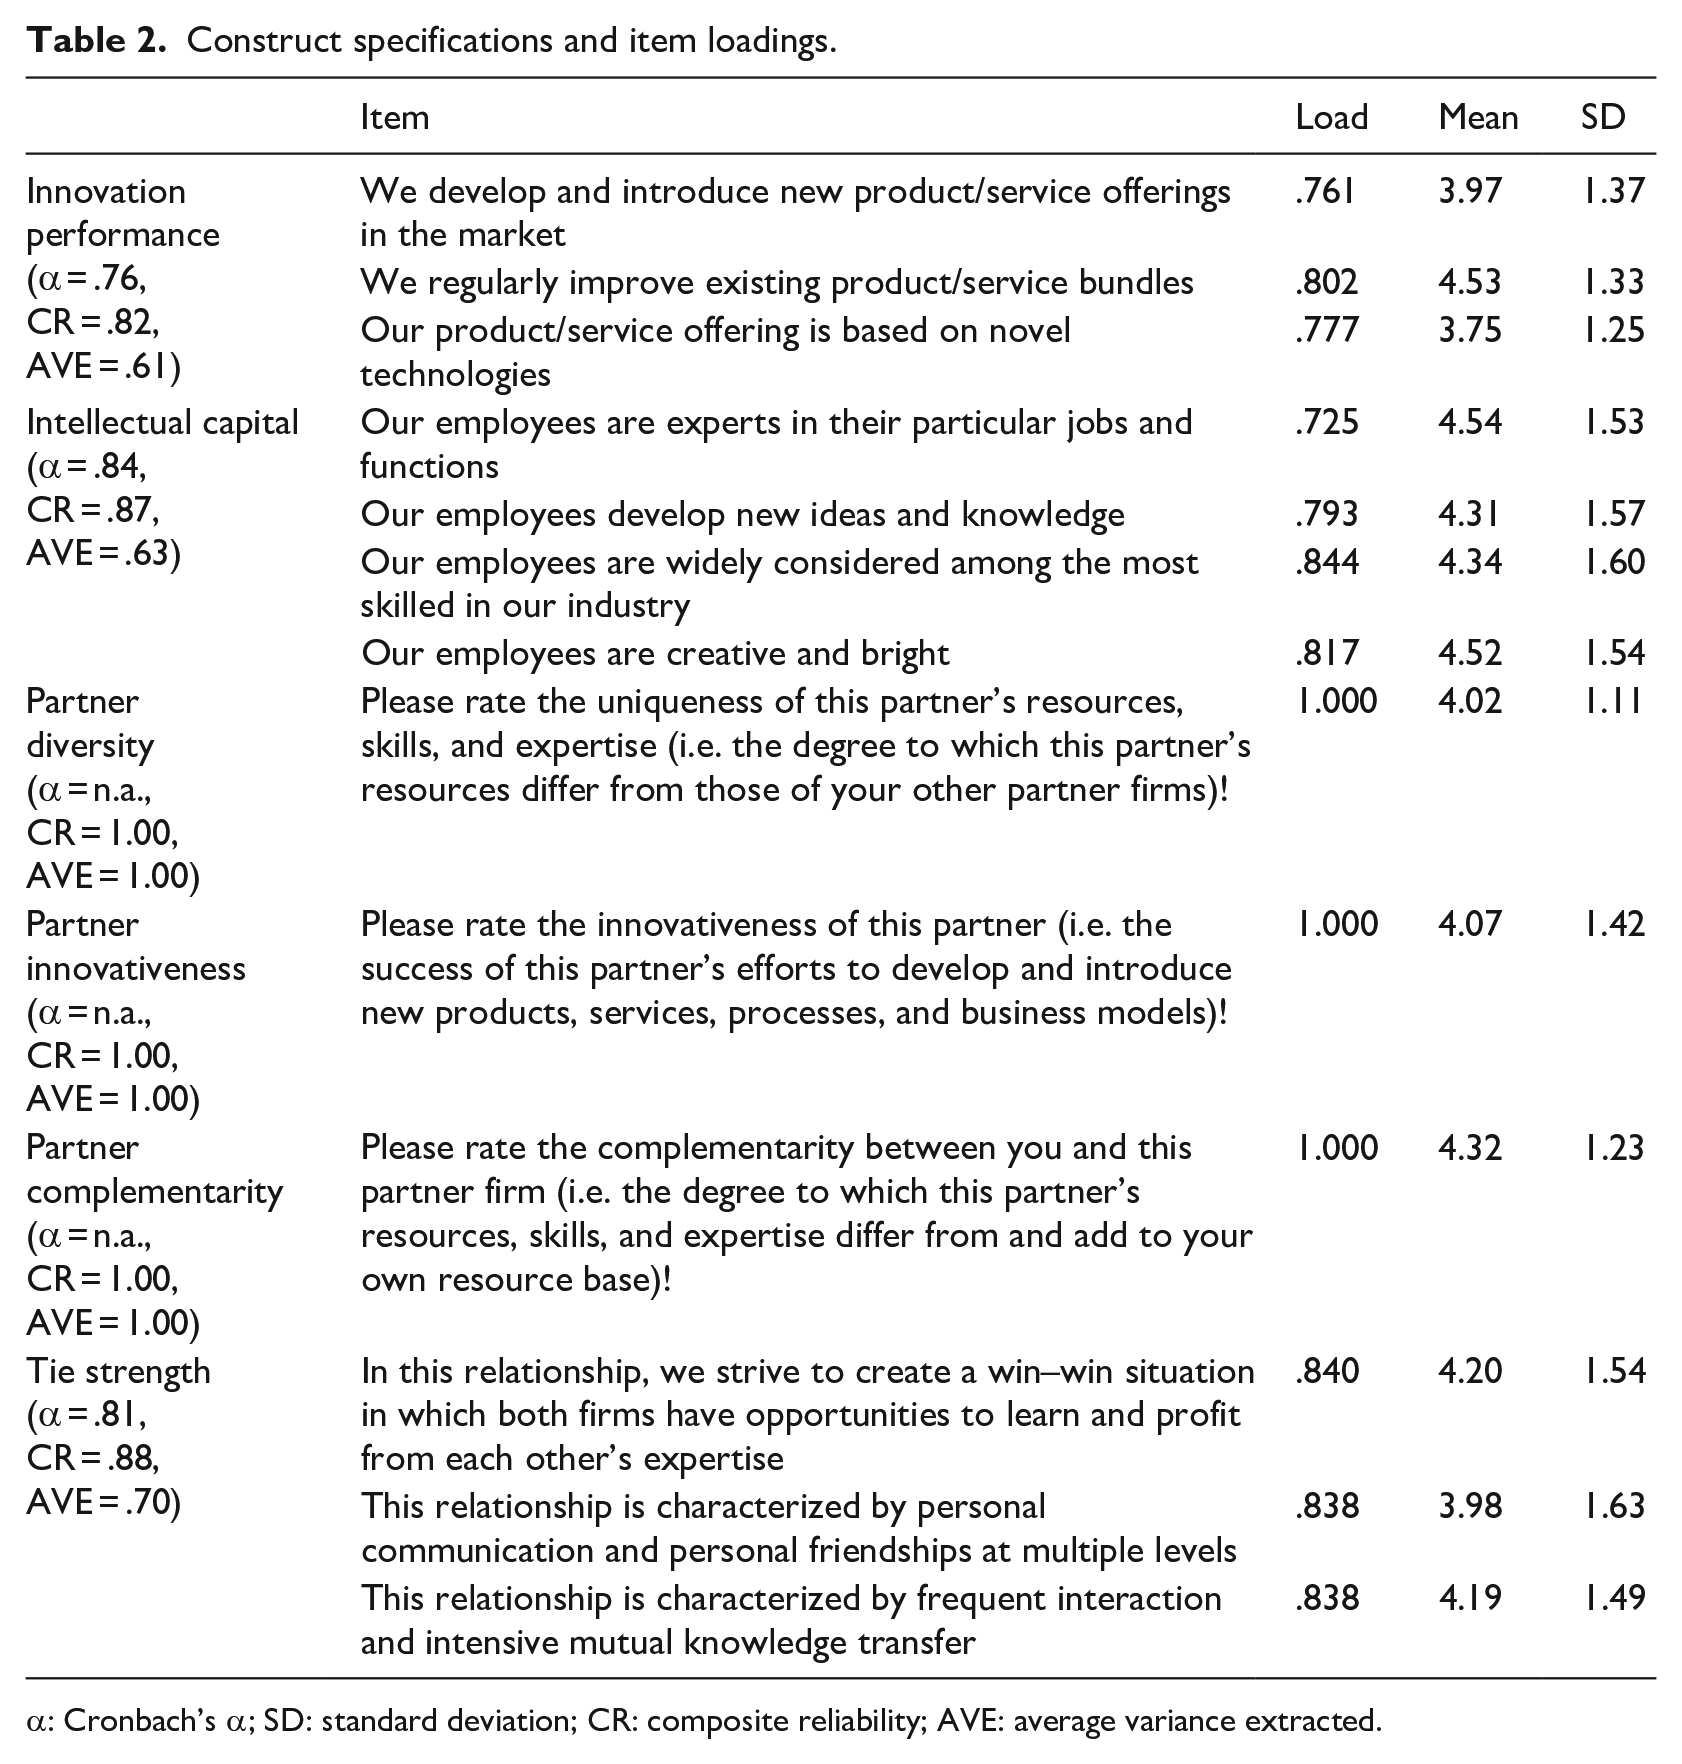
α: Cronbach’s α; SD: standard deviation; CR: composite reliability; AVE: average variance extracted.
We validated our measurement instrument based on conventional criteria. Cronbach’s alpha, composite reliability, average variance extracted (AVE) as well as all factor loadings surpassed the thresholds that are proposed in the literature (Bagozzi and Yi, 1988). To test for common method bias, we conducted Harman’s one-factor test (Podsakoff et al., 2003). The unrotated solution comprises seven factors explaining 68.4% of the variance (30.1% was the largest variance explained by a single factor). Thus, common method bias is unlikely a problem in our empirical data.
For 33 firms, two or more respondents completed the questionnaire (35.5%). This number is well in line with previous survey-based network studies in strategic management that report between 15% (Fonti et al., 2017) and 40% (Rank and Strenge, 2018) of multi-informant firms. We assessed inter-rater reliability by calculating the percentage of item ratings in which a pair of respondents differs one point or less on the 7-point Likert-type scale (78.3% of ratings) (Schilke and Goerzen, 2010). For the relational data, we calculated the mean percentage agreement as proposed by Tsai and Ghoshal (1998), by dividing the number of ties that were named by both respondents by the number of all ties that were reported for the particular firm. The average mean percentage agreement was .78 in our study—a value that is well acceptable. For the Likert-type scale ratings on partners’ innovativeness, complementarity, diversity, and tie strength, inter-rater reliability was 75.5%. Based on these tests, we are confident that for both single- and multi-informant firms the acquired data are robust and valid. For firms with more than one respondent, we thus used the mean ratings.
Calibration of set membership scores
The fsQCA requires all construct measures to be rescaled from interval scales into fuzzy-set membership scores ranging between 0 and 1. Those indicate the degree to which a research case is a member in the set of firms that display the case attribute in question. In our case, for example, the membership score for innovation performance represents the degree to which a utility is “in” or “out” the group of “high-performing firms.” Membership scores should “meaningfully represent differences in kind and differences in degree among cases” (Greckhamer et al., 2018: 488). This is achieved by defining calibration “anchors,” namely, a cross-over point that marks the borderline between “in” and “out” as well as thresholds for full membership and full non-membership (Fiss, 2011).
Our Likert-type measures were calibrated based on existing guidelines for the treatment of multi-item scales in fsQCA (Misangyi and Acharya, 2014). Namely, the minimum, midpoint, and maximum of the 7-point scale served as our calibration anchors (fully-out ≙ 1; cross-over ≙ 4; fully-in ≙ 7). Fuzzy-set membership scores for each research case and research variable were then assigned using the formula developed by Fiss (2011). For instance, a utility with an average value of 5.67 on the Likert-type scale for innovation performance receives a membership score of 0.83, indicating that this case is quite strongly “in” the set of “high-performing firms.” In contrast, a utility with an average Likert-type score of 2.33 receives a membership score of 0.15, indicating that this case is quite strongly “out.”
As neither NS nor firm size is measured on Likert-type scales, we could not rely on this calibration procedure. Following the principle that calibration should be based on anchors that are grounded in theory or contextual insight (Ragin, 2008), we assigned membership scores for the three indicators that measure firm size based on statistical data on the industry structure and the characteristics of local energy providers (e.g. Berlo and Wagner, 2013). For all three indicators of firm size, we used a four-anchor scale (number of employees: 0 ≙ <100 employees, 0.33 ≙ <300, 0.67 ≙ <1000, 1 ≙ >1000; size of distribution area: 0 ≙ <50,000 inhabitants, 0.33 ≙ <200,000, 0.67 ≙ <500,000, 1 ≙ >500,000; sales: 0 ≙ <€100 million, 0.33 ≙ <250, 0.67 ≙ <800, 1 ≙ >800). We assigned the overall membership score when the firm surpassed the respective threshold for at least two of the three indicators.
For NS, we lack congruent statements in literature that determine when a firm’s network is recognized as large and when it is not. Hence, we had to rely on sample statistics for determining reasonable calibration anchors (Verkuilen, 2005). Similar to previous research, the distribution of NS in our sample is skewed, reflecting a power law (Baum et al., 2004). The power law describes that in a typical network, most actors possess a small number of partners (“tail” of the distribution), fewer ones possess a medium number (“body”), and very few popular actors possess a high number of partners (“head”). All three categories of firms are clearly observable in the distribution in our sample (see Figure 3). Hence, we used the transition points to the “tail,” “body,” and “head” category as calibration anchors for network size (fully-out ≙ 1.5; cross-over point ≙ 11.5; fully-in ≙ 19.5). We employed these anchors to compute the fuzzy-set membership scores based on Fiss (2011).
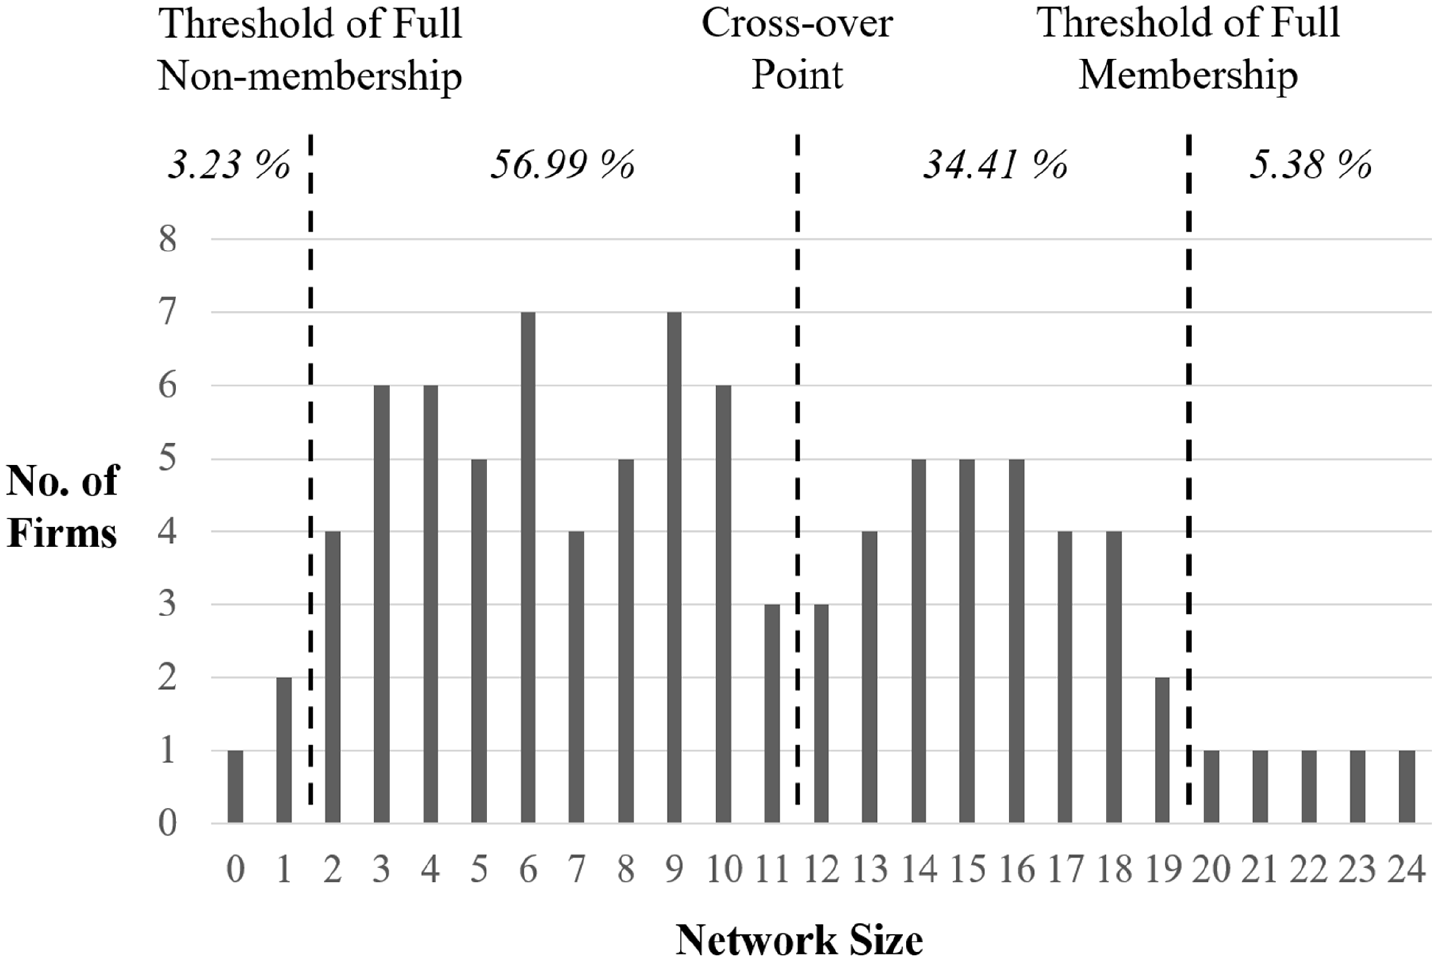
Distribution of network size.
Fuzzy-set analysis
The fsQCA conceptualizes causality in the form of subset relations between case attributes and outcomes (Ragin, 2008). First, if all (or almost all) cases that exhibit an outcome of interest also exhibit a particular configuration of attributes (or, in set-theoretic terms, if the outcome is a consistent subset of the configuration), this indicates a relation of necessity. In our case, for instance, if all highly innovative utilities would possess a large network, this would indicate that NS must be present for innovation performance to occur and thus is a necessary condition. Second, if all (or almost all) cases that exhibit a particular configuration of attributes also exhibit the outcome (or, in set-theoretic terms, if the configuration is a consistent subset of the outcome), this indicates a relation of sufficiency. Put simply, if in our case all utilities with a large network would achieve high levels of innovation performance, this would indicate that NS is a sufficient condition for innovation to occur.
To evaluate relations of necessity and sufficiency, fsQCA employs the set-theoretic measures of consistency and coverage (Fiss, 2011). Consistency serves an analogous purpose to significance in regression analysis. It displays “how closely a perfect subset relation is approximated” between outcome and case attributes (Ragin, 2008: 44). Coverage fulfills a similar purpose as R2 in regression analysis. Coverage measures the proportion of cases that are captured by a configuration of attributes and thus indicates the “empirical relevance or importance” of the configuration (Ragin, 2008: 44).
To analyze empirical data for subset relations, a truth table must be constructed that depicts all potential combinations of the explanatory variables (Ragin, 2008). Subsequently, all research cases are sorted into that truth table before lines with few empirical occurrences are eliminated based on a defined frequency threshold. The performance of the remaining configurations is coded based on a defined consistency threshold. In line with guidelines for handling samples with N < 100, we set the frequency threshold to 1, making sure that all combinations that were observed empirically were also included in the analysis (Greckhamer et al., 2018). Concerning the consistency threshold, we followed the suggestions by Ragin (2008) and used values of .80 for raw consistency and .75 for proportional reduction in inconsistency (PRI) consistency.
Based on this refined truth table, fsQCA extracts high- and low-performing configurations by counterfactual analysis (Fiss, 2011). In this procedure, fsQCA eliminates causally irrelevant attributes and systematically incorporates simplifying assumptions about counterfactual configurations, that is, configurations that lack empirical instances in the data (Ragin, 2008). The counterfactual analysis thereby produces two different solutions, the parsimonious and the intermediate solution. The parsimonious solution incorporates both easy and difficult counterfactuals and displays the “core” attributes of the configurations that lead to the outcome of interest (Fiss, 2011). Those core attributes represent “decisive causal ingredients” (Misangyi et al., 2017: 276) for which there is strong empirical evidence relative to the outcome. The intermediate solution only incorporates easy counterfactuals and indicates the “peripheral” attributes (Fiss, 2011). Those peripheral attributes support the effect of the core attributes but are rather expandable (Greckhamer et al., 2018).
Results
High-performing and low-performing configurations
We first conducted a necessity analysis for all network attributes, intellectual capital, and firm size. Neither those variables nor their negation surpassed the recommended consistency benchmark of .90 (Greckhamer et al., 2018). Hence, none of those attributes is necessary for firm-level innovation. The results of our sufficiency analysis demonstrate that there are eight configurations sufficient for high innovation performance. Those can be further grouped into four major types (i.e. configurations that share the same core conditions). Furthermore, the sufficiency analysis uncovered nine configurations that consistently lead to a low performance outcome. Table 3 reports all high- and low-performing configurations using Ragin and Fiss’ (2008) notation (see the notes below the table). To provide an example of how to interpret the notation, the first configuration (Solution 1) involves the presence of PC and TS as well as the absence of PD as core conditions, along with the absence of NS and PI as peripheral conditions. It is only successful for small firms with low intellectual capital.
FsQCA results.
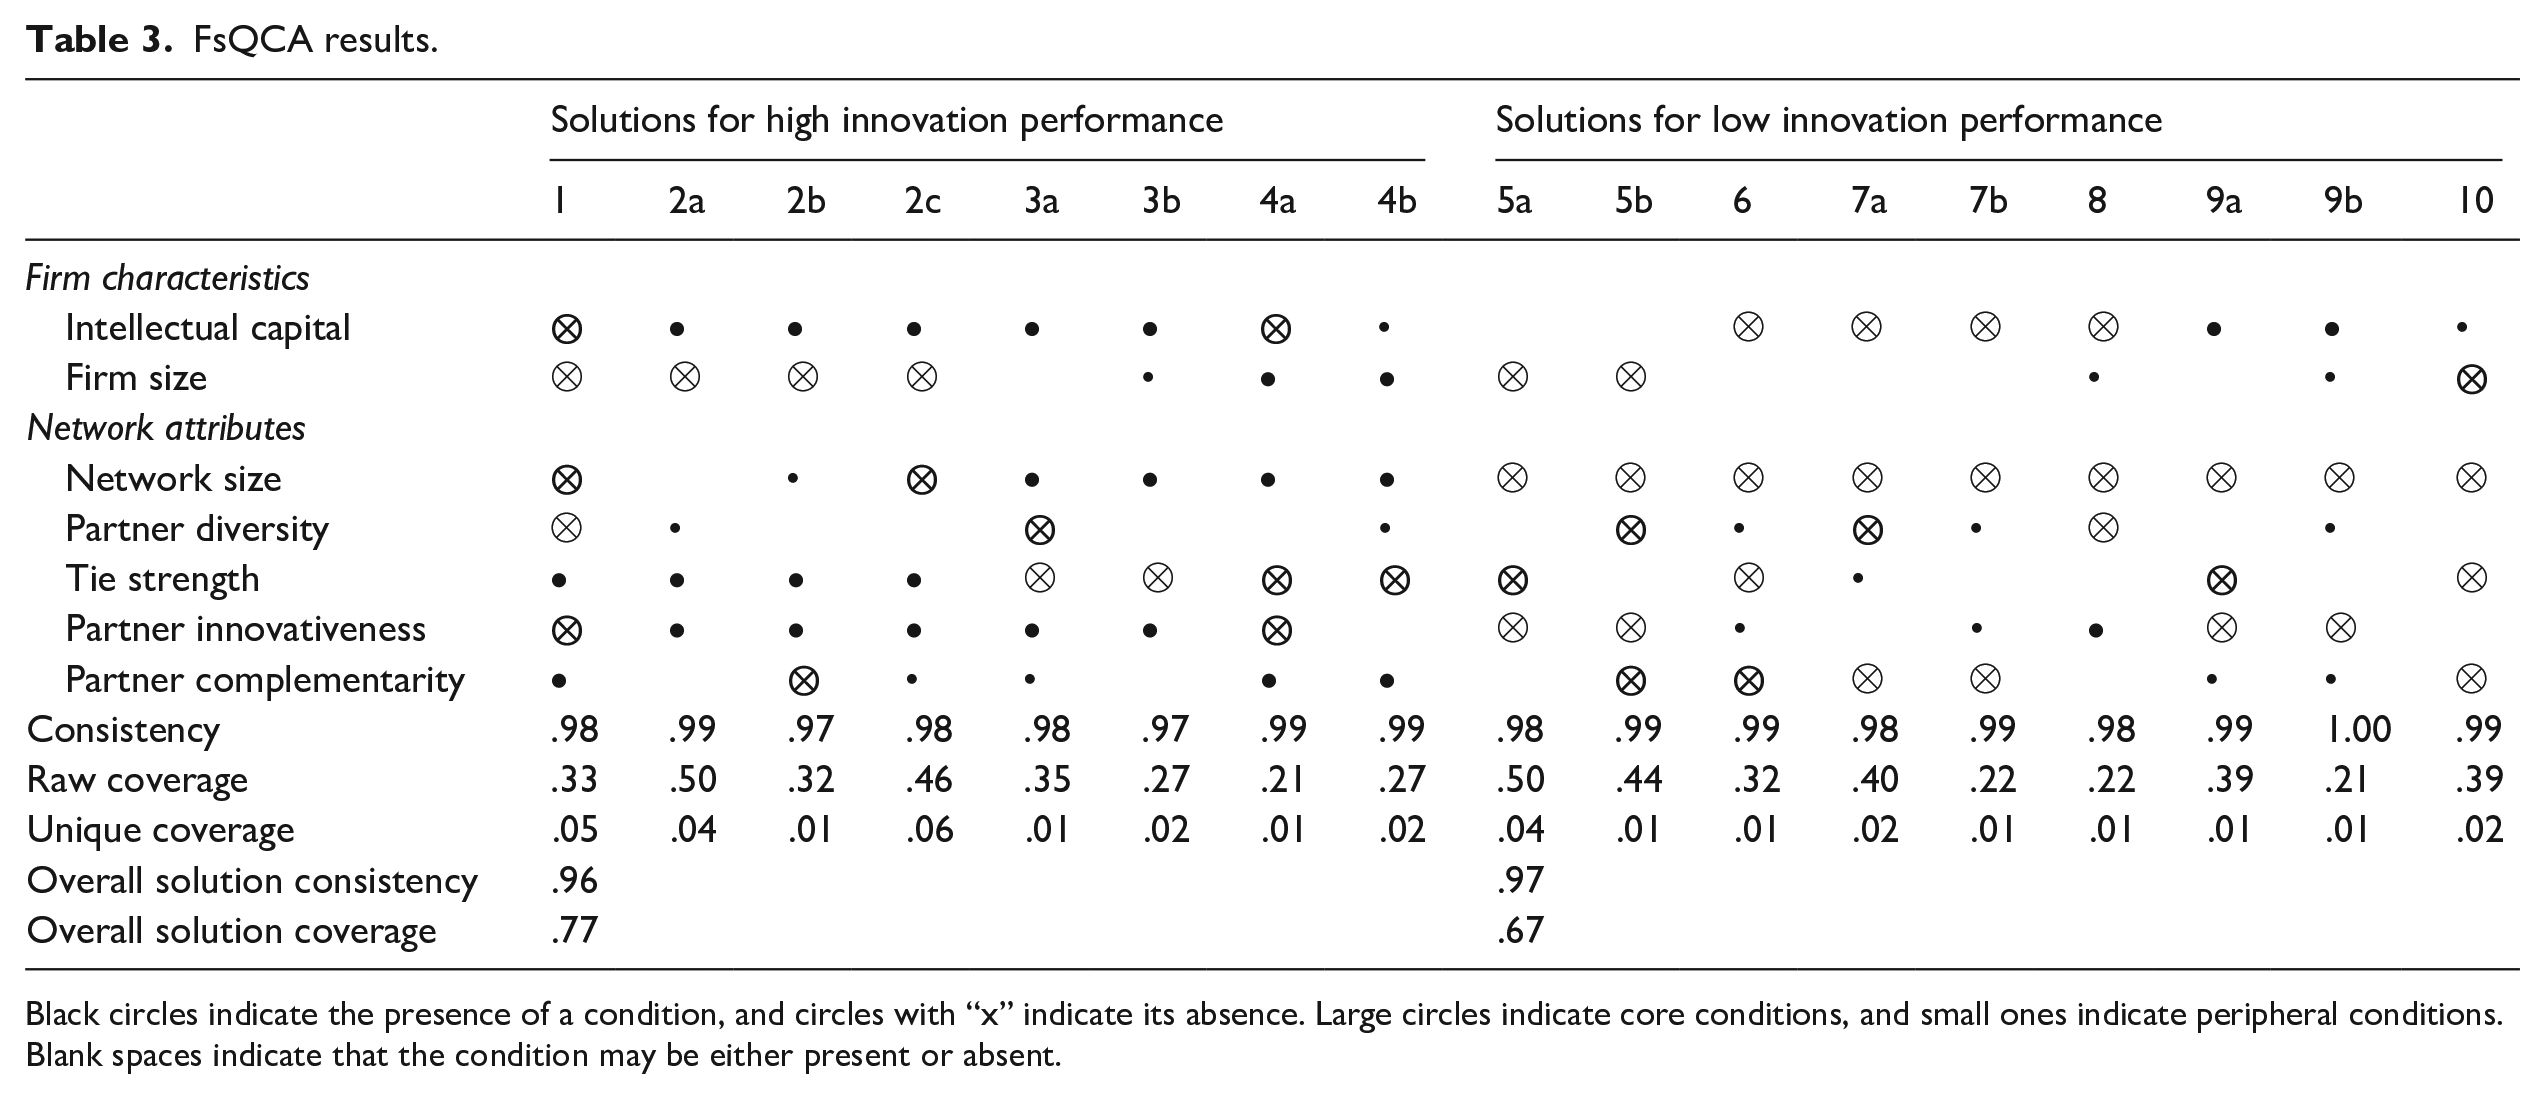
Black circles indicate the presence of a condition, and circles with “x” indicate its absence. Large circles indicate core conditions, and small ones indicate peripheral conditions. Blank spaces indicate that the condition may be either present or absent.
Table 3 further reports the measures of consistency and coverage for all identified configurations (Ragin, 2008). Put simply, consistency measures represent the share of cases falling into the given configuration that also feature the outcome of interest. The “Overall Solution Consistency” reports the same measure, this time calculated for the aggregated set of all identified configurations. “Raw Coverage” displays the share of all cases in the sample that feature the given configuration and the respective performance outcome; the “Unique Coverage” captures the same measure, this time calculated based on the cases that are uniquely covered by a given configuration (i.e. those cases are not covered by any of the other identified configurations). The “Overall Solution Coverage” refers to the raw coverage of the whole set of identified configurations for the respective outcome. In our case, the value of .77 for high innovation performance indicates that a large majority of high-performing cases in our sample are covered by the eight high-performing configurations identified.
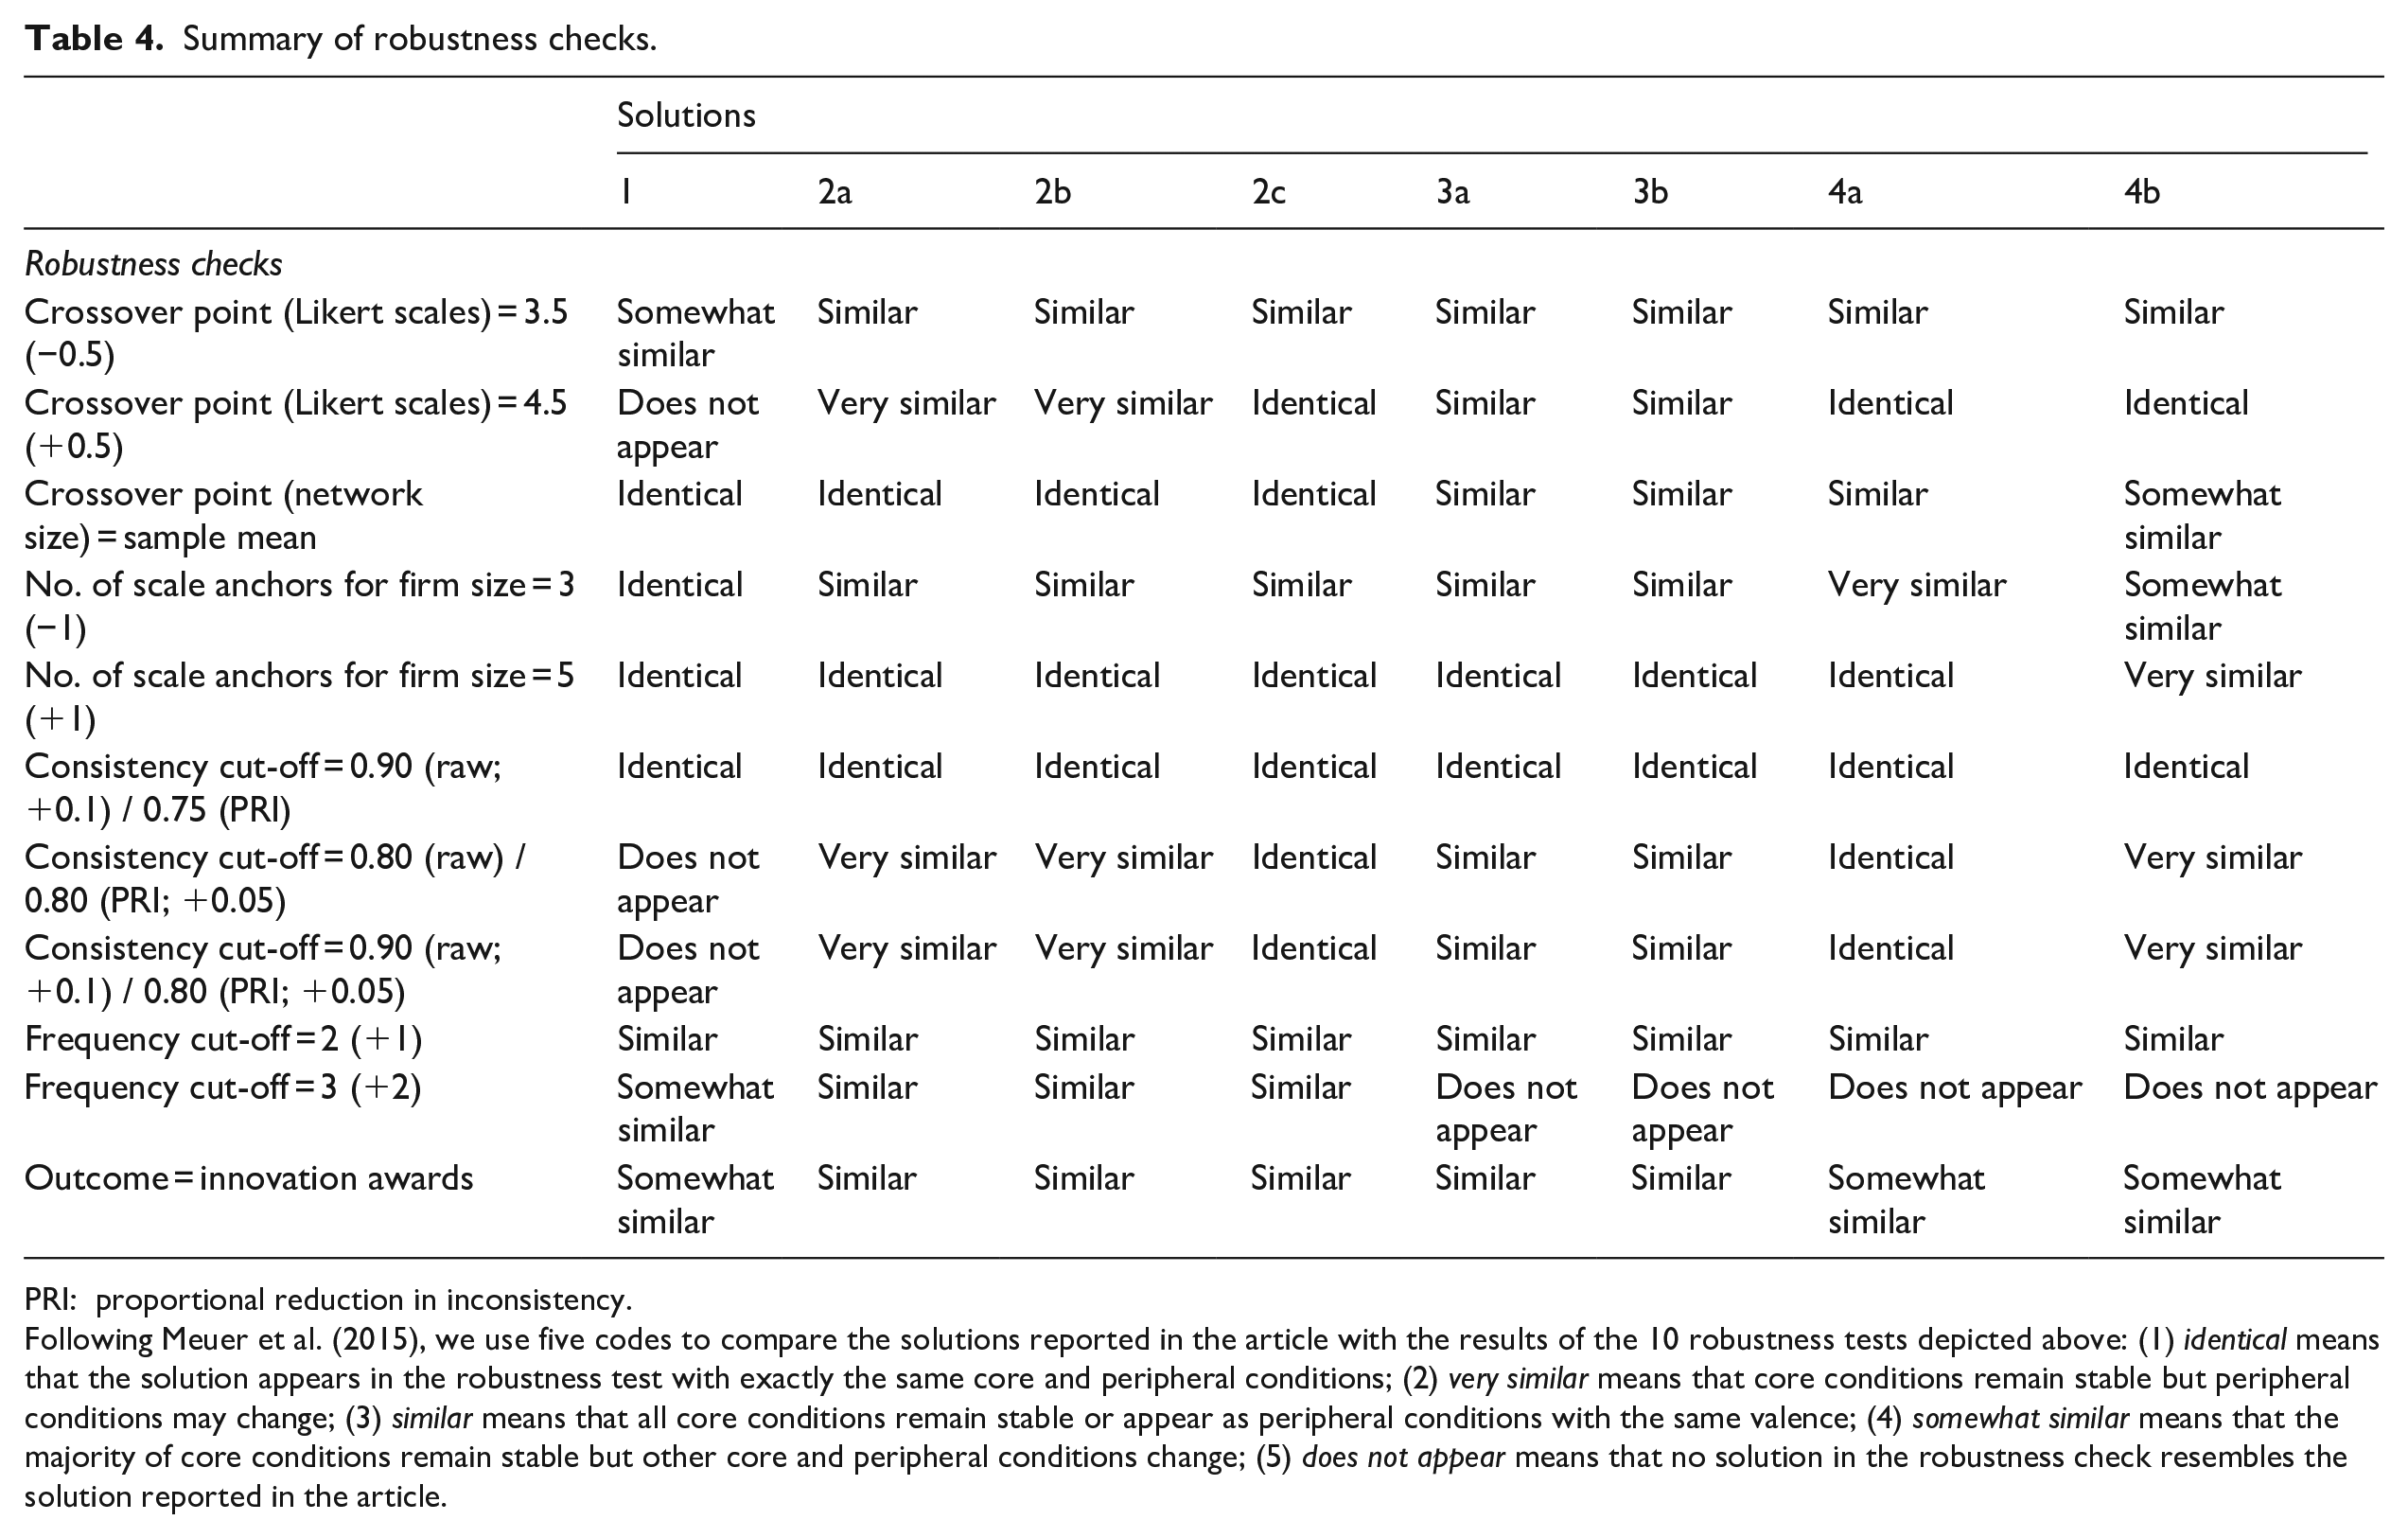
In line with previous fsQCA studies, we conducted several tests to ensure the robustness of our results (Meuer et al., 2015). First, we reran the analysis with changed calibration anchors for the Likert-type scales. For firm size and network size, we also tested different calibrations. Second, we varied the criterion for raw and PRI consistency, and the frequency threshold. Finally, we used our triangulation measure for innovation performance as outcome variable in the analysis. In doing so, we created a two-anchor scale that assigned full membership if a firm was nominated for an innovation award in the 2016–2018 period, and full non-membership if the firm was not. In all, the robustness checks reproduced the solutions that were found in the baseline analysis to a satisfactory extent (see Table 4).
Summary of robustness checks.
PRI: proportional reduction in inconsistency.
Following Meuer et al. (2015), we use five codes to compare the solutions reported in the article with the results of the 10 robustness tests depicted above: (1) identical means that the solution appears in the robustness test with exactly the same core and peripheral conditions; (2) very similar means that core conditions remain stable but peripheral conditions may change; (3) similar means that all core conditions remain stable or appear as peripheral conditions with the same valence; (4) somewhat similar means that the majority of core conditions remain stable but other core and peripheral conditions change; (5) does not appear means that no solution in the robustness check resembles the solution reported in the article.
Analysis of substitution and complementarity
To explore how different network attributes combine as substitutes or complements, we followed the meta-set approach proposed by Misangyi and Acharya (2014). The term “meta-set” describes a conjunction of two or more case attributes via “fuzzy or” and/or “fuzzy and” operators (Ragin, 2008). “Fuzzy or” allows for examining whether two or more case attributes serve as substitutes. For instance, if NS and PD are substitutes, only one of the two needs to be present for high innovation performance (NS_or_PD). Thus, only the higher set membership score on the two attributes is of relevance for “fuzzy or” sets. “Fuzzy and,” in contrast, uses the minimum set membership score to merge case attributes so that the worst score of a case on each of the included attributes matters. “Fuzzy and” sets are used to represent complementarity between case attributes.
In line with Misangyi and Acharya (2014), we systematically conducted a series of meta-set fsQCAs. We successively replaced sets of case attributes by their “fuzzy or” and “fuzzy and” meta-sets, reran the sufficiency analysis, and assessed whether the subsequent solution outperformed the baseline solution (Table 3) regarding its fit to the data (i.e. whether the overall coverage was ⩾.77). If so, the meta-set is able to replace the separate case attributes without a loss of information. In that case, substitution/complementarity between the included explanatory variables can be stated.
We first examined model specifications in which we entered each pair of network attributes as substitutes and then as complements. The results of this analysis are reported in Table 5. With respect to the interaction between the three access-related network attributes, we found that NS and PD as well as NS and TS combine as substitutes. Regarding the two quality-related attributes, the results indicate a substitutive interaction of PI and PC. Furthermore, our analysis revealed several meta-set relations between access- and quality-related network attributes.
Meta-set analysis: internal fit.
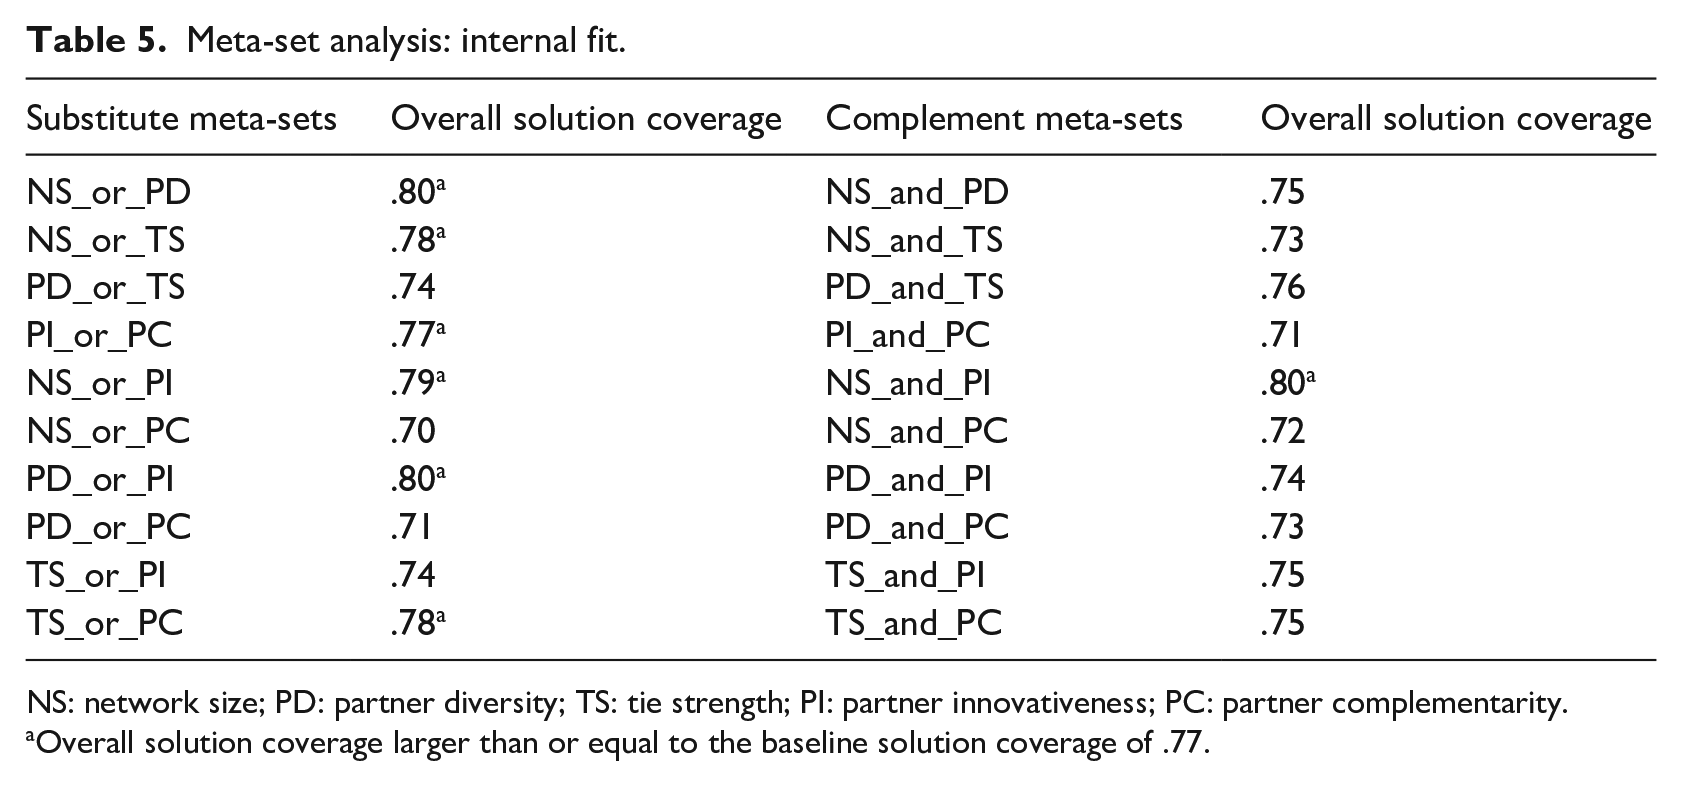
NS: network size; PD: partner diversity; TS: tie strength; PI: partner innovativeness; PC: partner complementarity.
Overall solution coverage larger than or equal to the baseline solution coverage of .77.
In the next step, we extended our analysis to examine (1) whether there are more complex meta-sets of substitution and complementarity among the network attributes, and (2) if and how different internal resource configurations prescribe different network attributes. To explore such multilateral combinations, we started by testing all possible models in which between three and all five network attributes were treated as substitutes, respectively, complements. Most prominently, the model that included the meta-set NS_or_PD_or_TS exceeded the fit of the baseline model (coverage = .80). Hence, the three access-related network attributes act as substitutes. In addition, the analysis revealed that NS, TS, and PI combine as substitutes (coverage = .81). In contrast, none of the “fuzzy and” meta-sets exceeded the baseline coverage, indicating no complementary interaction of multiple network attributes.
Furthermore, we examined a series of models with meta-sets that included both “fuzzy or” and “fuzzy and” operations. Here, we started from a visual check of the baseline solution, noting that each high-performing configuration included at least one access-related and one quality-related network attribute. Translating this insight into a set-theoretic term, we arrived at
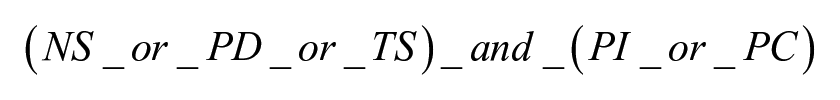
We employed this meta-set in our analysis and observed the highest fit of all tested models (coverage = .82). We modified the meta-set by excluding network attributes and by switching the set operators. None of the modifications resulted in equal or better model fit. The model with (NS_or_TS)_and_(PI_or_PC) came closest (coverage = .80).
Finally, we examined which network attributes work well with which internal resource configurations. To this end, we constructed “fuzzy and” meta-sets that linked each network attribute to the presence and to the absence of each internal resource and conducted the corresponding series of analyses (see Table 6). Our results confirm that PI is valuable for firms with high intellectual capital, whereas TS and PC combine successfully with low intellectual capital. Large firm size in combination with NS, PD, and PI is sufficient for high innovation performance, while low firm size complements with TS.
Meta-set analysis: external fit.
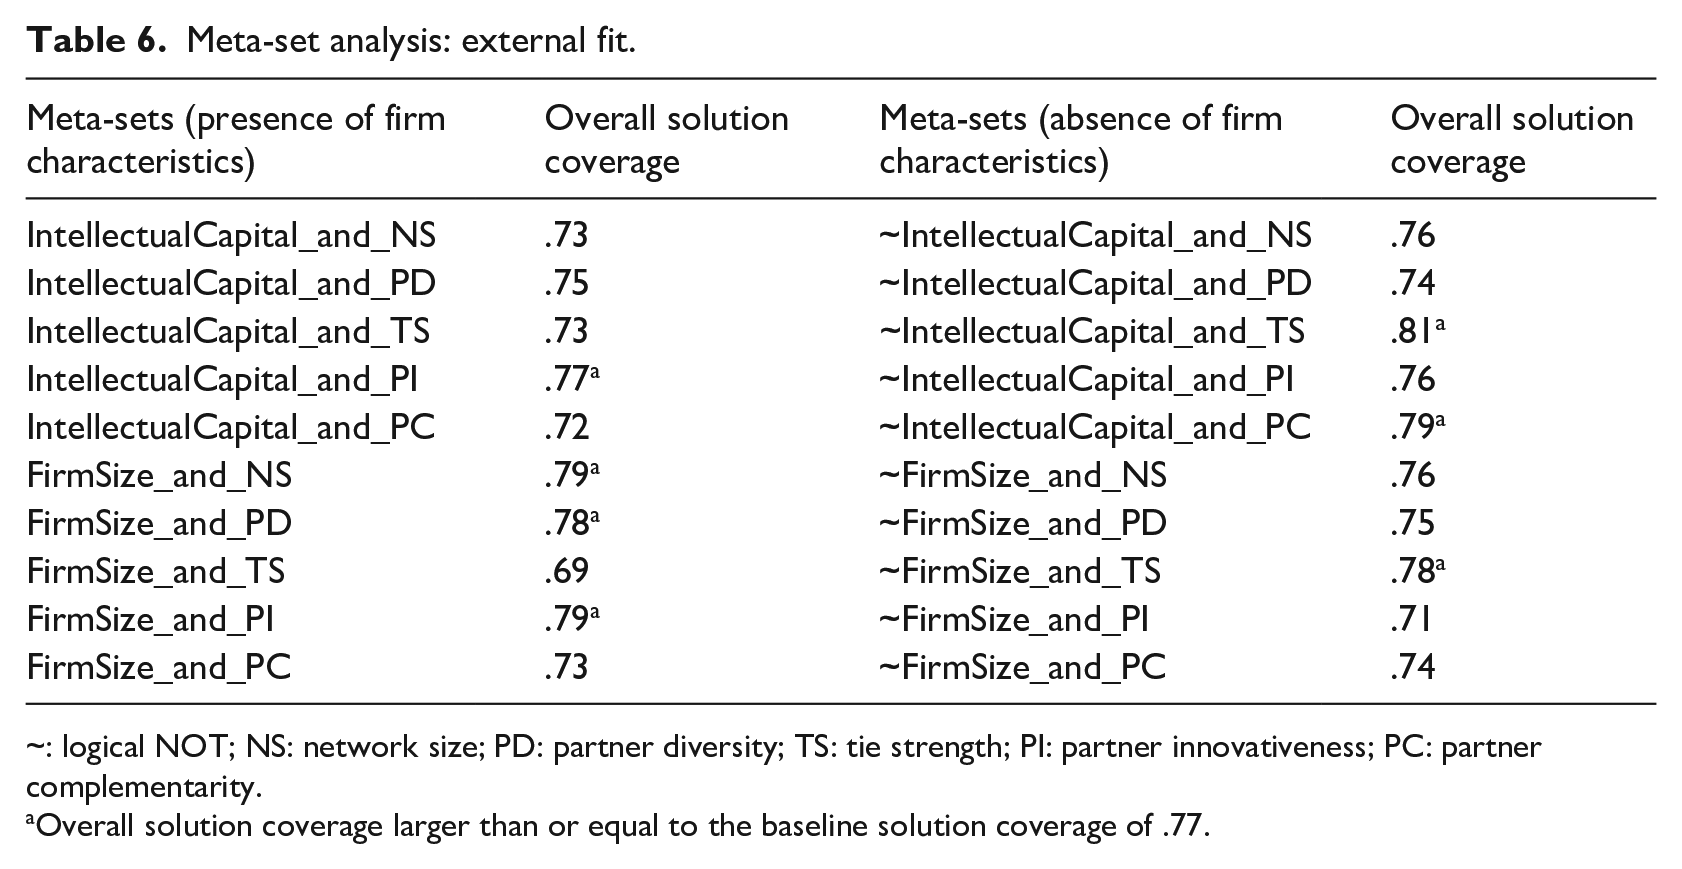
~: logical NOT; NS: network size; PD: partner diversity; TS: tie strength; PI: partner innovativeness; PC: partner complementarity.
Overall solution coverage larger than or equal to the baseline solution coverage of .77.
Discussion
Interpretation of the identified high-performing configurations
In line with best practices of configurational theorizing (Furnari et al., 2021), we start our discussion by taking a detailed look at the identified configurations. In all, our data reveal that for each of the four possible scenarios of presence and absence of intellectual capital and firm size, a unique archetype of network configuration is conducive to innovation (see Figure 4). In the following, we describe each of those archetypes and provide typical examples within our research cases that help illustrate how exactly the specific type of network benefits innovation:
“Share & Care” network (Solution 1): This network configuration combines the presence of PC and TS as well as the absence of PD in its causal core. The focal firm has assembled a closely knit network of partners that are able to compensate its own deficiencies. This type of network works well for small firms and with little intellectual capital. Within our research cases, a typical example is a smaller utility (around 350 employees) operating from a rural part of Germany. In the network analysis, the firm reported seven trusted partners which divide into two categories: (a) project developers for renewables, and (b) specialists for building automation. While the network is quite homogeneous, it assembles complementary resources. The network was heavily involved in one of the utility’s flagship innovation projects: the development of a nearly 100% self-sufficient renewable energy system for the city’s largest childcare facility. The system builds on a combination of photovoltaics, communal heating, battery, and smart building technologies and thus integrates the complementary expertise of the utility, the renewables specialists, and the facility engineers. Recently, the project won a national-level award for the “Most Innovative Smart Energy Concept.”
“Elite Circle” network (Solutions 2a–c): This configuration is characterized by the presence of PI and TS. Such an “elite circle” (Pisano and Verganti, 2008) enables continuous access to highly novel knowledge and is associated with profound relational capital and long-term cooperation. This network configuration benefits only one category of firms—small companies with high levels of intellectual capital. For this type of network, one research case clearly stands out as an example. The small firm (<300 employees) began to develop strong internal know-how when in the mid-2000s the current CEO was appointed. Among his first strategic actions, he mandated the installment of a dedicated department for product innovation. In the following, a major business magazine declared the firm “Germany’s Most Innovative Energy Provider.” Regarding its network, the utility is focused on a small set of high-quality partners, including start-ups, research institutes, and multinationals, all with background in the energy sector. With those long-term partners, the firm engages in a range of cutting-edge projects, for example, the development of a blockchain-based app for private energy trading. The project is administered as a consortium with shared governance between the utility, a large multinational in the field of energy infrastructure, and research institutes focused on energy IT.
“Antennae” network (Solution 3a–b): The presence of NS and PI as well as the absence of TS are the main features of this network configuration. By providing many capable “antennae” (Ahuja, 2000), this network should keep the firm informed about the newest developments in technological and market environments. This configuration typically is effective in the presence of intellectual capital and firm size. Our exemplary case for this type of network is one of the largest German utilities. The company invests heavily in R&D and possesses leading expertise in a range of technology fields, including energy infrastructure, e-mobility, smart metering, and renewables. The company reported 24 network ties, which is the largest ego-network in our sample. The networking efforts are explicitly focused on creating a broad range of “antennae,” as the following strategic initiative demonstrates: in 2018, the utility issued a smart city innovation contest to attract high-tech start-ups to join the firm’s Internet-of-Things (IoT) platform as partners and grasp “the ideas and smart city solutions that rattle around worldwide” (CEO). Among others, the competition resulted in the utility entering the business field of bike tracking which fuels into the company’s efforts to develop the broader market for e-mobility.
“Portfolio” network (Solution 4a–b): This network configuration is characterized by NS and PC as core elements. The firm has assembled a “portfolio of different, though complementary, interorganizational arrangements for achieving innovation outcomes” (Faems et al., 2005: 247). This type of ego-network led to high innovation performance for large firms with both low levels (Solution 4a) and high levels of intellectual capital (Solution 4b). As an example, we have a larger utility (around 1000 employees). The company reported 20 network ties, encompassing a broad range of partner types and expertise. A look at specific innovation projects demonstrates the portfolio character of this network and the firm’s deliberate search for the right partners in each of its innovative efforts. For instance, the utility cooperates with geologists and local mining companies in a project on geothermal heating, it participates in an innovation circle on the platform economy with other energy providers and leading software companies, and it engages in the development of daylight illumination technologies for office buildings and factory plants together with a hidden champion in LED systems.
Low-performing network configurations
Although we deliberately focused on the high-performing configurations, valuable insights can also be gained from examining which networks led to low levels of innovation performance. Solutions 5a and 5b refer to small firms and show that without any of the five network attributes those firms do not achieve innovation performance. More interesting are Solutions 6, 7a, 7b, and 8 that depict firms with weak intellectual capital and in many cases high levels of PI. Contrasting this pattern, Solutions 9a and 9b represent firms with high levels of intellectual capital and networks with high levels of PC but low levels of PI. Altogether, those solutions indicate that firms with different levels of internal know-how will profit from different types of resource quality in their network (see below for a more detailed discussion). Finally, Solution 10 illustrates small firms with strong intellectual capital that lack external resource access since they have neither strong ties nor a large network. Referring back to the configurations outlined above, this type of firm apparently lacks the “elite circle” or “antennae” network to fully enhance its internal know-how.
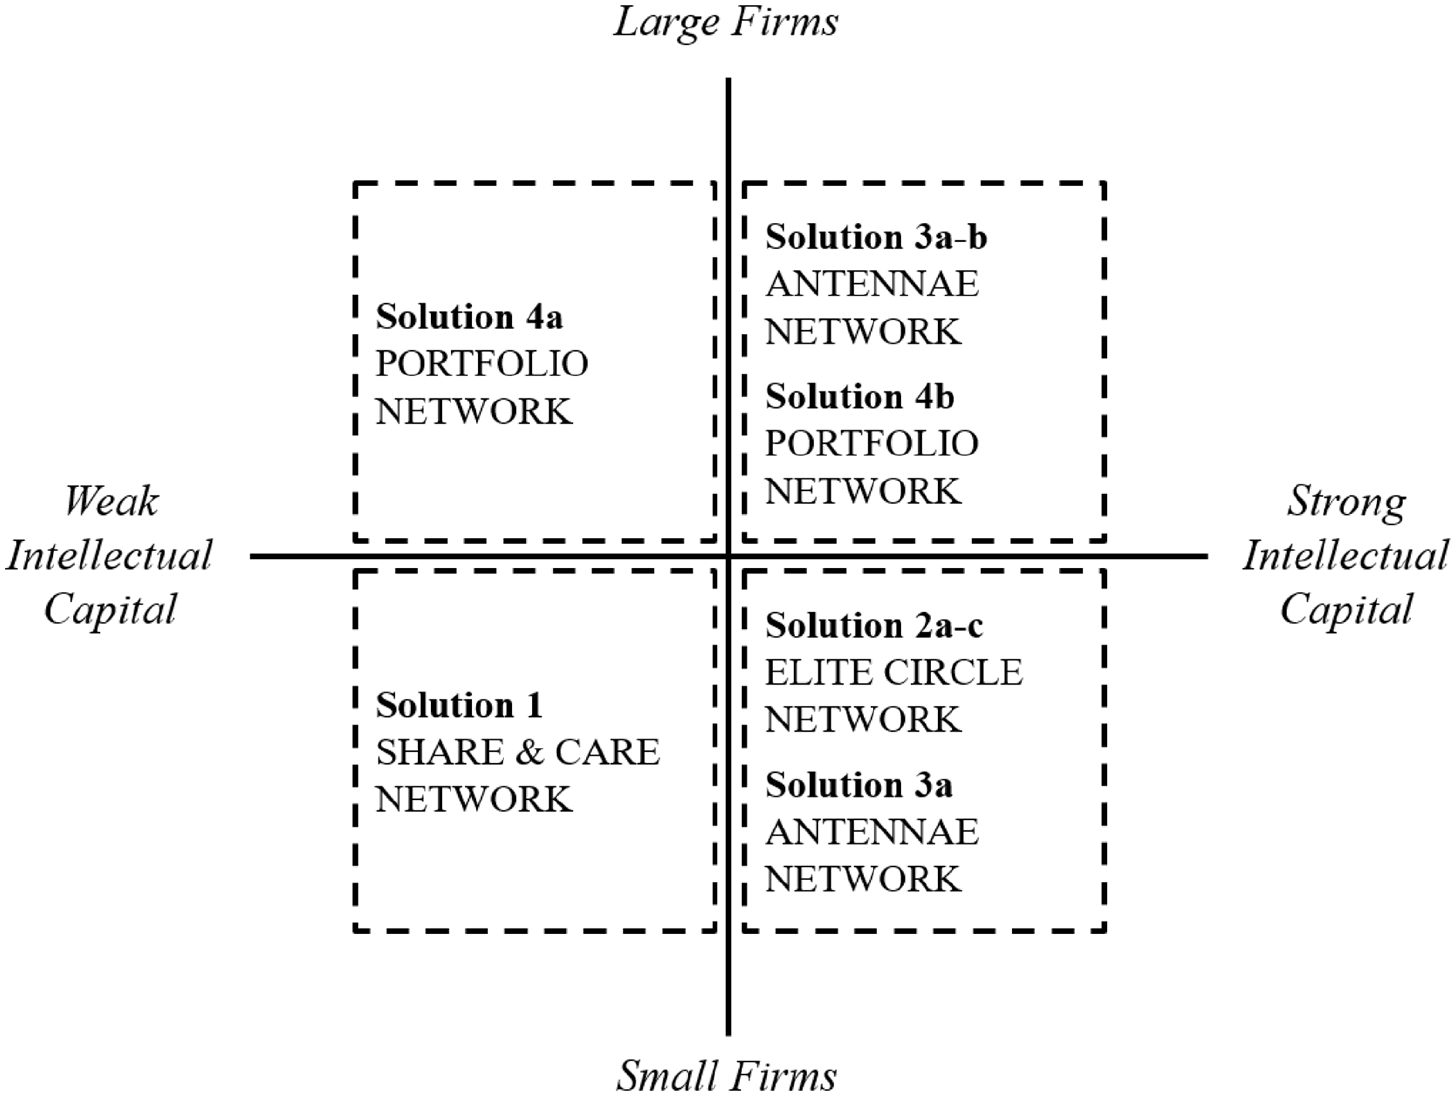
Optimal network configurations depending on firm characteristics.
By identifying those “archetypes” of high- and low-performing networks, our work provides first important contributions to the literature. In the narrow sense, we specify “blueprints” of the firm’s ego-network. By this, we help answer the crucial question of “what kinds of network configurations facilitate innovation” (Pittaway et al., 2004: 147). In a more general sense, we demonstrate that the relation between the firm’s strategic network and its innovation performance is characterized by equifinality. Our results show that there is no single “one-size-fits-all” configuration that is (in-)effective for all types of firms. Instead of trying to establish “consensus as to the [singular] optimal network configuration” (Pittaway et al., 2004: 147), strategic network theory should thus account for the notion that depending on their internal resource base, different firms will require different networks.
Theoretical implications on the internal fit of network configurations
After identifying high- and low-performing networks, the next step of our configurational theorizing is to explore if there are “orchestrating themes” that describe the internal fit of those network configurations. To this end, our empirical results appear to substantiate a holistic formula for optimal network configurations in the context of innovation. Altogether, high innovation performance is the consequence of the presence of NS or PD or TS, and the presence of PI or PC. In specifying this formula, we substantially extend current insights on how network attributes operate together. The few works that studied the internal fit of strategic networks either favored a “pure substitute” (Xie et al., 2016), or a “pure complement” perspective (Pullen et al., 2012a). Contrasting those one-sided views, our results reveal that network attributes combine in more complex ways so that fit within network configurations results from a simultaneity of substitute and complement mechanisms.
Thereby, our analysis reveals two main combinatory patterns. First, access-related and quality-related network attributes appear to complement one another. All high-performing network configurations combine at least one access-related and one quality-related attribute in their causal core; the meta-set analysis also supported the notion of a complementing relation between these two types of network attributes. Previous research on this interaction has produced conflicting findings. Scholars who advocate the substitute perspective argue that both access-related and quality-related network attributes provide the firm with resource advantages that each are “in itself beneficial” (Operti and Carnabuci, 2014: 1049). Put differently, from the substitute perspective, the two types of resource advantage offer alternative but individually sufficient ways for the firm to enhance innovation (Gilsing et al., 2008). Our findings contradict this perspective and support the complementarity rationale, demonstrating that innovation performance is the consequence of a network that grants both superior resource access and resource quality.
The complementarity rationale implies that the absence of either of the two resource advantages will fundamentally limit the firm’s ability to innovate successfully. The mere access to partners’ resources is no guarantee for innovation success since the inherent quality of the accessible resources “sets an upper limit on the value that the organization can potentially extract from its network” (Gulati et al., 2011: 215). In turn, when partners possess valuable resources, the performance impact will still be limited if the network characteristics do not allow the firm to channel those resources (Gulati et al., 2011) and/or if the range of accessible resources is small and homogeneous (Baum et al., 2000). Regarding the composition of high-performing network configurations, we thus posit the following:
Proposition 1. Access-related and quality-related network attributes act as complements. Innovation performance is the consequence of the presence of at least one of each type.
As the second pattern, our study results indicate that both the three access-related network attributes (NS, PD, and TS) and the two quality-related network attributes (PI and PC) substitute one another. Regarding the former, this finding is in line with the empirical results of Koka and Prescott (2008) who argue that volume and diversity of network resources are different “types of benefits” that both help the firm outperform its competition but yield diminishing returns if combined. Similarly, Xie et al. (2016) found that NS, PD, and TS are equifinal pathways to innovation. From the strategic network perspective, our finding implies that firms have an opportunity to select between “alternative strategies” to achieve network resource access (Gilsing et al., 2008: 1722). Firms profit either from the sheer volume of knowledge provided by a large network, or from access to heterogeneous expertise, or from an in-depth transfer of complex knowledge enabled by strong inter-firm relations. In general, advantages in NS, PD, and TS are permutable for an innovation-enhancing effect.
Similarly, the two attributes of network resource quality—PI and PC—also substitute one another. This finding extends previous literature which has neglected the interplay between those two network attributes. Our analysis indicates that relying on innovative partners and relying on complementary partners represent two alternative strategies for the firm to create opportunities for learning and innovation. The finding is consistent with the arguments of Gulati et al. (2011: 214) who claim that the “inherent value of network resources” has two dimensions: the singular, “objective” value that originates from the magnitude of partners’ resources and the combinatory, “subjective” value that originates from synergies between resources. Altogether, we formulate the following proposition:
Proposition 2. NS, PD, and TS act as substitutes. The presence of either one is sufficient for innovation performance. The same applies for PI and PC.
Theoretical implications on the external fit of network configurations
Regarding the “external fit” of network configurations, our findings indicate that only firms with strong know-how and expertise are able to benefit from PI. Firms without substantial intellectual capital, on the contrary, strive to close their existing resource deficiencies by assembling a network of high PC. Thus, differences in intellectual capital determine which of the two quality-related network attributes are helpful for the firm.
On the one hand, this finding provides further evidence to the arguments raised, for instance, by Srivastava and Gnyawali (2011) and Zaheer and Bell (2005). If the firm has strong intellectual capital, it will be better able to screen and evaluate cutting-edge external expertise. In turn, firms without strong intellectual capital will lack the capacity to absorb and learn from their partners’ innovative ideas. As relations with innovative partners require substantial efforts to build and maintain (Sarkar et al., 2001b), such relations might turn out as “high cost–low reward” investments and thus be even detrimental for “non-expert” firms (as illustrated, for instance, by Solutions 6, 7b, and 8 of our analysis for low innovation performance).
On the other hand, our empirical study demonstrates that also for firms with weak intellectual capital, there exist network configurations that allow for enhancing innovation performance, namely, when PC is present. In contrast to PI, PC apparently produces resource benefits that even firms with little innovation-related expertise may appropriate. This finding is both novel and intriguing as previous strategic network research rarely discussed how firms without profound internal expertise can configure their network to foster innovation.
Although literature lacks an in-depth discussion on how firms with weak intellectual capital may profit from their ego-networks, there still are some indications that might help explain this finding. Ozcan and Eisenhardt (2009), for instance, argue that for new ventures that have not yet built a strong resource base, it will be advantageous to create partnerships that are based on “unique interdependencies,” that is, complementary resources possessed by potential partners. A network configuration that features high levels of PC “is effective because it clarifies roles for potential partners and mobilizes their action” and “structures and motivates interactions among partners” (Ozcan and Eisenhardt, 2009: 269). New ventures thus “need not initially form ties with the ‘best’ partners” (Ozcan and Eisenhardt, 2009: 269) but should focus on accessing complementary assets.
Based on our empirical results, we believe that this line of reasoning will hold true for firms with weak intellectual capital in general. For firms that lack strong intellectual capital on their own, it will be difficult to maintain relationships to highly innovative partners because mutual benefits are unclear (Mindruta et al., 2016). In a complementary network, in contrast, the partners’ relative strengths act as orientation guide that is instrumental for creating idiosyncratic, that is, relationship-specific, solutions to innovative problems (Lambe et al., 2002). Hence, at low levels of intellectual capital, firms will benefit from searching for complementary capabilities in potential partners (Hitt et al., 2000). In all, we propose the following:,
Proposition 3. For firms with strong intellectual capital, optimal network configurations are characterized by a high level of PI. In turn, firms with weak intellectual capital benefit from high levels of PC.
Furthermore, our analysis reveals that differences in firm size mainly prescribe the access-related attributes of innovation-friendly network configurations. Large firms profit strongly from large networks. This is plausible as larger firms should be able to handle a higher volume of network activity as they have less restrictions to dispose financial and human resources to manage inter-firm relations (Demirkan et al., 2013). Moreover, Rauch et al. (2016) argue that a larger volume of external knowledge may help large companies overcome issues of inflexibility and rigidity.
In contrast, small firms can enhance their innovation performance by assembling a smaller but closely knit partner network. Due to resource constraints, small firms might not have the capacity to deal with broad external information and cannot afford to engage in resource-consuming “adventures” (Rauch et al., 2016). Furthermore, small firms might be exposed to considerable risks when a partnership goes wrong as they generally are more likely than large firms to “get unfairly exploited and actually suffer over the longer term” (Sarkar et al., 2001a: 704). Strong, embedded network ties are conducive to mitigate such risks (Kale et al., 2000) so that high levels of TS are especially valuable to smaller firms. In contrast, larger firms might not benefit as much from a strong-tie network as such a network bears the risk of inertia and getting entangled in existing relationships at the cost of exploring new partnering opportunities (Rauch et al., 2016). In all, we suggest the following:
Proposition 4. For large firms, optimal network configurations are characterized by high levels of NS. In turn, small firms benefit from high levels of TS.
Limitations and further research
Our work has several limitations that indicate promising avenues for further research. First, as the firm and its ego-network are the unit of analysis, part of our data had to be converted to obtain firm-level indicators from relational data (Tsai and Ghoshal, 1998). Specifically, we aggregated partner-related and relational properties of network ties into mean values for each firm’s ego-network. While such conversions are common in strategic network research, information on differences between single ties was not included in our statistical approach. Future works might conduct a more detailed analysis of such differences on the dyad level.
Second, although we are confident in the selection and theoretical grounding of our research variables, it is still possible that we might have missed out on further influence factors. While fsQCA does not suffer from omitted variable bias in the same way as regression analysis does, leaving out a relevant condition may still decrease the explanatory power of configurational models (e.g. Fiss, 2011). Future research may thus examine if and how the configurations identified by us intersect with other network attributes—especially global network measures such as centrality (e.g. Gilsing et al., 2008)—and other “control” conditions on the firm and the industry level.
Third, our empirical study was conducted exclusively in the context of the German energy industry. In general, fsQCA studies are merely able to illustrate midrange theories, that is, “theories of specific phenomena within a bounded scope” (Misangyi et al., 2017: 270). While we believe that our findings and theoretical conclusions hold valuable insights for network researchers across contexts, the specifics of the energy sector make us expect that the precise patterns of high- and low-performing networks may differ in other industry settings. We encourage scholars to study other innovation- and collaboration-intensive industries such as software or medical engineering to explore whether the identified network configurations are robust across research contexts.
Finally, we relied on cross-sectional data and self-report made in the majority of our sample firms by single informants. Although we took several measures to deal with potential biases, we suggest that future research should draw on longitudinal data and consult a broader range of data sources. In sum, we hope that the results of our study have contributed to a better understanding of network configurations and their interplay with the firms’ internal resources in fostering innovation and encouraged future research on this important issue.
Footnotes
Acknowledgements
We thank associate editor Luca Berchicci and the two anonymous reviewers for their very constructive guidance during the review process. The paper also benefited from the comments of participants at the annual meeting of the Academy of Management in 2019.
Funding
The author(s) disclosed receipt of the following financial support for the research, authorship, and/or publication of this article: This work was supported by the Research Center for Business Models in the Digital World, a cooperation between the University of Bamberg and the Fraunhofer Institute for Integrated Circuits IIS.