
Abstract
The disruptive impact of platform businesses on local economies has received much attention, but virtually none has been paid to the factors that impact platforms’ decisions about where to locate their activities. The novel, disruptive nature of platforms limits the relevance of traditional theories about location decisions. We argue that local institutional conditions and global legitimacy spillovers affect the choices of platform businesses about where to operate. We analyze the controversial case of ride-hailing platform Uber, an app-based service that matches uncertified chauffeurs with passengers. We find that Uber showed a preference for cities that promote competition and innovation. A spillover analysis shows how Uber leveraged its global pool of customers by choosing cities whose visitors were already familiar with Uber’s service. Our study illuminates the key role played by the brand’s mobile customer base as global carriers of legitimacy for Uber’s controversial innovation.
Introduction
Economists and management scholars have extensively studied the location choices of multinational enterprises (MNEs). Traditionally, location choices are explained by economic drivers such as market size, resource availability, or low labor costs (for a review, see Kim and Aguilera, 2016). This framework, however, was developed in the pre-digital era, when multinationals grew organically and expanded in new markets and production locations selectively. In today’s Internet age, many new multinationals are online digital platforms offering services via apps. A generic “definition of platforms is one in which social and economic interactions are mediated online” (Kenney and Zysman, 2016: 65) with Amazon, Facebook, YouTube, eBay, Uber, and Airbnb as prominent examples. These platforms provide a support structure for their users, who themselves offer the content, goods, and services to be exchanged. Accordingly, the economic structure of platform organizations differs markedly from traditional business; platforms require greater upfront investment in software development, but only marginal spending to scale operations worldwide, as their services are distributed to users via an app.
Platform-based services can be scaled rapidly. They are prime examples of today’s innovative, “born-global” startups (Knight and Cavusgil, 2004) capable of entering many local markets in a short period of time. But while most born-global startups target specialized niches, platforms do not. They target mundane services embedded in local economies and rooted in particular institutional contexts. Accordingly, location-bound services such as Airbnb (Zervas et al., 2017), Uber (Thelen, 2018), and Deliveroo (Cant, 2019) encounter regulation at the local and national levels (Frenken et al., 2020; Garud et al., 2020; Mair and Reischauer, 2017; Thelen, 2018; Uzunca et al., 2018). Underlying the typical platform strategy to expand rapidly is the implication that regulations are to be dealt with at a later stage—a strategy known as “don’t ask permission, ask forgiveness” (Kenney and Zysman, 2016: 67). When making their location decisions, platforms may prioritize market share to foster first-mover advantages and network externalities, even with the awareness that regulatory conflicts may follow (Parente et al., 2018). Hence, platforms might intentionally seek out institutional environments that are hospitable to their innovative platform services. However, our theoretical and empirical understanding of platforms’ location choices around the globe is still limited (Nambisan et al., 2019; Stallkamp and Schotter, 2021).
Given that platform businesses challenge local institutions, an institutional-theoretical lens is particularly apt for the study of their location decisions. In this respect, our study fits in the specific literature on institutional and cultural factors affecting location decisions (Dunning and Lundan, 2008; Flores and Aguilera, 2007; Kostova and Zaheer, 1999). The core tenet of these studies holds that multinationals look for host locations that are institutionally similar to their home country (Kostova and Zaheer, 1999). While we expect that platforms would take certain formal institutions into account when making their location decisions, we argue that platforms also rely on their mobile customer base in two ways. First, app-based platform businesses have the ability to discern the latent demand for their service in new markets by tracing their customers in cities worldwide using Global Positioning System (GPS) (Johnson, 2016; Van Dijck et al., 2018). Second, mobile customers comprise a “trusted community” which paves the way into new local markets, not just as prospective users in new markets, but also as carriers of legitimacy. That legitimacy enables platform companies to compensate for their potential lack of local knowledge of, familiarity with, and legitimacy among local customers.
In this article, we specifically focus on platforms active in markets for location-bound services (e.g. taxi, food delivery, and cleaning), rather than online exchange services (e.g. social media, programming, and translation) (Stallkamp and Schotter, 2021). Location-bound services disrupt local business operations and local communities and are subject to context-specific regulations. Here, we present the case of ride-hail platform Uber, with a particular focus on its controversial UberX service (UberPop in Europe). The Uber app, which connects “uncertified” chauffeurs—unlicensed by an existing regulatory body—with local passengers, thus challenges existing municipal taxi regulations. We analyze the factors associated with Uber’s decisions to locate in nearly 600 cities across the globe in under 7 years. Specifically, we test to what extent Uber’s location decisions are affected by existing public institutions, such as regulations, and the informal institutions instilled by their global customer base.
The article makes several contributions. Theoretically, we extend our understanding of location choices made by multinational platform companies from an institutional perspective. While the influence of formal institutions is a feature of this framework, our main theoretical contribution is to expose the role mobile customers play as global carriers of legitimacy for controversial, platform-based innovations. Empirically, we add to the recent wave of studies on platform organizations. We examine cities worldwide as potential locations, and by developing a city-to-city matrix, we provide a means of tracing the global legitimacy spillovers created and carried by mobile customers. As such, we respond to recent calls for a systematic understanding of the internationalization patterns of platform companies (Parente et al., 2018; Stallkamp and Schotter, 2021).
In the following section, we review location choice research that considers formal and informal institutions and hypothesize about how institutions affect platform’s location decisions. We then present our data and explain our application of a time-to-event model to study Uber’s location decisions. We test our hypotheses in the section after, and in the last part conclude with a discussion on the relevance of our study to the literature on location choice and discuss the implications for management and policy.
Location choice and institutions
International business research has a long tradition of analyzing how MNEs choose where to locate their operations. That body of research is mainly concerned with studying location factors that shape MNEs’ strategic approach to new geographic markets and impact their decisions about where to locate (Jain et al., 2016; Nielsen et al., 2017). A multitude of factors influence an MNE’s choice for a particular location. These can broadly be divided into two umbrella drivers: economic drivers and institutional-cultural factors (Flores and Aguilera, 2007). While, traditionally, much emphasis has been placed on economic drivers, such as market size, market affluence, and market growth, or efficiency-seeking motives, such as resource availability (Caves, 1996; Culem, 1988; Dunning, 1980; Sethi et al., 2003; Vernon, 1966), institutional drivers have received more attention in recent years (Dunning and Lundan, 2008; Flores and Aguilera, 2007; Kostova and Zaheer, 1999; and for a review, see Kim and Aguilera, 2016).
MNEs are aware of the importance of the institutional environment for their location decisions (Kedia and Mukherji, 1999). The core tenet in research on institutional drivers holds that MNEs prefer host locations that are institutionally similar to the home country, reducing uncertainty and the likelihood of failure (Kostova and Zaheer, 1999). New foreign markets come with new sets of regulations, new local norms, and specific customer requirements. MNEs are more likely to gain local legitimacy when these regulations, local norms, and customer requirements are similar to those in their home country (Flores and Aguilera, 2007).
Being born-global startups, similarity between home and host countries arguably plays a minor role—platforms rapidly expand beyond the geographic borders of their home markets, and in some cases may not even be legitimate businesses in their home countries in the first place. Instead, one can expect that platforms look for institutional environments that fit best with their disruptive business models. In this respect, some have stressed a difference between a business model’s legality and its legitimacy in a new institutional environment (Webb et al., 2009)—there are formal institutions codified in laws and regulations, and there is the question of ensuring familiarity and acceptance of the new business models from customers (Garud et al., 2020).
Formal institutions
Some friction between platform services that enable informal economic activity among peers and existing laws and regulations at the local level is to be expected. It is still reasonable to expect that platform organizations will try to limit the friction between their activities and local regulations to the extent that such institutions can provide at least some concrete support for a platform’s service (Kostova and Zaheer, 1999). The literature in this domain distinguishes between three sets of institutions: (1) economic, (2) political, and (3) labor.
An MNE’s location choice may be affected by a range of economic institutions—“the various dimensions of institutions that ensure the smooth operation of a market economy” (Du et al., 2012: 210). Generally, prior studies conclude that MNEs exhibit an aversion toward locations with weaker economic institutions (Ascani et al., 2016; Du et al., 2008). Barriers to new business insertions, barriers to market entry, complex taxation policies, and trade restrictions (Bevan et al., 2004; Djankov et al., 2006; Pajunen, 2008; Spar, 2001) are among the most prominent economic institutions that MNEs contend with. Prior research also demonstrates that in most countries, governments limit foreign penetration of their service industries more severely than their manufacturing industries (Li and Guisinger, 1992; Miozzo and Yamin, 2012). This may particularly impact a platform organization’s decision to implant itself in a new market, given their propensity for selecting winner-take-all markets, and causing severe disruption of incumbents operating traditional business models (Kenney and Zysman, 2016; Thelen, 2018; Zervas et al., 2017).
The extent to which countries allow foreign entry and support innovation differs quite a bit (Herrera and Nieto, 2008; Spar, 2001), including the ways they regulate platform organization activities economically (Aguilera et al., 2019; Thelen, 2018; Uzunca et al., 2018). The studies by Thelen (2018) on Germany, Sweden, and the United States and Uzunca et al. (2018) on Egypt, The Netherlands, and the United Kingdom show that, while each government regulated Uber and Airbnb quite differently, they all acknowledged the innovative and user-friendly nature of these services. Countries that encourage investment in technology and novel business structures, and which have more innovation-friendly institutions in place, are arguably more attractive to platform companies than countries that lack such institutions (Interian, 2016). One can therefore expect that platforms, like other innovative MNEs, would prefer locations with economic policies and institutions that promote competition and innovation. This leads us to our first hypothesis:
Hypothesis 1. Platform companies are more likely to introduce their location-bound services in locations with strong economic institutions.
In terms of political institutions, prior literature has argued that unstable political institutions and higher political risk make some locations less attractive for MNEs (García et al., 2008; Quer et al., 2012). The general argument holds that political instability and ineffective governments will negatively affect economic performance, especially for newcomers who are less acquainted and embedded than existing firms. One of the most studied aspects is local corruption, which many have found negatively influences an MNE’s decision to invest locally (Du et al., 2008; Grosse and Trevino, 2005; Habib and Zurawicki, 2002; Wei, 2000). Other studies have considered the quality of the host’s legal system, showing that MNEs tend to avoid countries without transparent legal systems (Campos and Kinoshita, 2003; Globerman and Shapiro, 2002). Scholars also looked at factors related to political stability and government effectiveness, including red tape, regime-like rule, and nepotism (Flores and Aguilera, 2007; Globerman and Shapiro, 2002; Mudambi and Navarra, 2002). While prior research on the effects of political instability and effective governments on platform MNEs is very limited, some research suggests that locations with higher political instability seem less supportive of platform activities (Cohen, 2018; Tham, 2016). Because they are aware of how disruptive their new business models can be, platforms may shy away from host locations where governments align closely with incumbent firms to defend vested local interests. And, as a born-global startup that is rapidly expanding internationally, a platform will generally have limited resources and little experience dealing with weak governments effectively. This leads us to the following hypothesis:
Hypothesis 2. Platform companies are more likely to introduce their location-bound services in locations with strong political institutions.
In terms of the relationship between labor market characteristics and an MNE’s decision to choose a given host location, most of the early literature focuses on labor costs (Caves, 1996; Culem, 1988; Sethi et al., 2003). Later studies consider the institutional characteristics of national labor markets. These studies found that MNEs prefer to enter countries where labor market regulations are flexible—dismissal is easier, notice periods are shorter, mandatory severance payments are lower, labor unions are weaker, and employment contract protection is weaker (Görg, 2005; Gross and Ryan, 2008; Lee, 2003). MNEs active in service sectors seem to be more sensitive to labor market regulations than manufacturing MNEs, as service sectors are generally more labor-intensive (Javorcik and Spatareanu, 2005). Because platform companies are service providers, and because they often classify their workers as independent contractors, we expect that a fortiori platform MNEs will prefer locations with flexible labor market institutions.
For platforms, the relation with platform workers is not without controversies. Although their workers are independent contractors, platform organizations actively oversee their workers’ speed and quality of service, and sometimes even ban them from the platform if quality is deemed too low (Cornelissen and Cholakova, 2019; Kenney and Zysman, 2016). This precarious new labor relationship has been met with fierce critique from labor unions, while legal experts suggest that classifying platform workers as independent contractors may be inconsistent with labor law in most countries (Aloisi, 2015; De Stefano, 2015; Fabo et al., 2017). By now, platform companies such as Uber and Deliveroo have faced numerous lawsuits and worker strikes in multiple countries (Bernal, 2018; Taylor, 2018). It is therefore reasonable to expect platform organizations to select locations where they will meet the least amount of friction, that is, with flexible labor markets and little union clout (Cohen, 2018). This brings us to the following hypothesis:
Hypothesis 3. Platform companies are more likely to introduce their location-bound services in locations with weak labor market institutions.
Customer following
Mechanisms such as reputation, trust, and familiarity—examples of local, informal institutions—are important coordination devices in local economic activity (Seyoum, 2011). Countries’ informal institutions include patterns and norms of behavior, and socially sanctioned codes of conduct embedded in national cultures (Peng, 2000). Early studies investigated how the dissimilarity of informal institutions between host and home country affects location choices. Using measures of cultural distance, studies have indeed found that MNEs tend to avoid host countries with informal institutions dissimilar from the home country (Kogut and Singh, 1988; Quer et al., 2012). More recent studies have developed the idea that certain aspects of local informal institutional environments will make them more or less open to the activities and behavioral norms of foreign MNEs (Li et al., 2019). For instance, MNEs exhibit a general preference for certain types of informal institutions, such as high levels of trust (Seyoum, 2011), risk-taking attitudes (Contractor et al., 2014), or associative activity (Zhao and Kim, 2011).
Other research in the domain is examining the mechanisms MNEs might utilize to moderate or overcome cultural distance. Some have found that “trusted communities” play a functionally similar role to public institutions by facilitating economic exchange, albeit via shared informal practices (Hernandez, 2014; Li et al., 2019). For instance, the presence of co-ethnic communities facilitates economic exchange driven by shared codes of conduct, norms, and solidarity between the MNE and local co-ethnic communities (Portes and Sensenbrenner, 1993). Along similar lines, scholars have also researched home-country diaspora impact at the host location (Esperanca and Gulamhussen, 2001; Hernandez, 2014) and the impact of same-country MNE agglomeration (Tan and Meyer, 2011).
Platform companies organize digital marketplaces for mundane services rather than offering an innovative end-product (Acquier et al., 2017; Kenney and Zysman, 2016). As intermediaries of such services, platforms connect local customers with local producers online, thereby escaping most of the problems of cultural adjustment. Hence, one would expect that cultural similarity between home and host countries only plays a minor role in platform success. But because online marketplaces are disrupting local industries and practices, establishing legitimacy on the ground with potential local customers and with platform workers (taxi, delivery, cleaning, etc.) is key (Garud et al., 2020). Hence, from a location-theory perspective, the relevant question to ask does not so much revolve around cultural similarity, but around openness to a disruptive innovation.
In theorizing about a city’s openness to a new platform service, we build on the concept of “customer following” of trusted communities and extend it specifically to platforms. Born-global startups like platforms are largely dependent on brand familiarity among and attractiveness to local customers (Stallkamp and Schotter, 2021), and thus need to create a local buzz when they enter a new market location (Parente et al., 2018). Uber’s marketing officers, for example, use promotional events and influencers in new locations to generate the buzz that gets locals talking about the new service and early adopters recommending it to others (Crowley, 2013; Kern, 2012). What is more, platforms make use of referral programs providing their customers a discount if they recommend the app in their social network. Such referral programs foster cascades of online, word-of-mouth recommendations about the new service. Uber’s referral program has become an exemplar in the marketing profession, as evidenced by the many blogs devoted to their successful referral program. 1
Crucially, customer word-of-mouth extends beyond local markets to the extent that customers are internationally mobile. Because apps deliver essentially the same quality of service across countries, platform services are especially attractive to internationally mobile customers. Platforms such as Uber, Airbnb, Mobike, and BlaBlaCar intentionally target international travelers (Cardona, 2018). It is logical to assume, then, that mobile customers, and their recommendations, can buttress international diffusion of a platform’s offering.
Digital technology enables platforms to follow their customers—literally—and they use this information primarily to offer users relevant complementary services. By tracking their internationally mobile customers via GPS (Johnson, 2016; Van Dijck et al., 2018), platforms can also gauge the latent demand for their services in new markets as well as the exact customers who are suitable advocates for their new services. Referral programs can thus target these traveling customers once they arrive at a new location. In doing so, platforms can thus estimate with some precision the potential value the “trusted community” can provide before entering a new location and can subsequently leverage this community as a source of legitimacy transmitted by word-of-mouth.
Being intermediaries in two-sided markets, platforms also need to recruit workers to guarantee the local supply required to satisfy demand. This is where companies like Uber, Airbnb, and Etsy use a more hands-on strategy—directly contacting prospective platform workers (taxi chauffeurs, homeowners, vendors) when entering a new local market (Teixeira and Brown, 2016). One of Uber’s well-known strategies was to launch Uber Black, the luxury version of their app, first. Uber Black actively approached licensed chauffeurs and offered very attractive earnings to them (Arpi, 2015). Once the brand name “Uber” had become established among chauffeurs and clients, they would launch UberX, the mass-market ride-hailing service that matches uncertified chauffeurs with passengers.
The argument that we put forward holds that, as born-global startups, platform companies are in a dynamic process of customer following, by focusing on customers that are mobile between geographically separated areas. Platforms can leverage their continuous online relationship with their existing customer base by tracking their movements and informing them once they become active in new locations. Because of their familiarity with a platform’s service in a particular context, mobile customers serve not only as prospective customers in a new location, but also as advocates of the platforms’ service in those locations through word-of-mouth, fostering familiarity and legitimacy among first-time customers. Put differently, platforms can leverage mobile users as international carriers of “informal institutions” (social values, codes of conduct, and shared understandings) (Li et al., 2019; North, 1990) that support the acceptance of an innovation.
Platforms thus benefit from the “trusted community” formed by mobile customers visiting new host locations. Indeed, when platforms start operating in a new location, its first customers are often already familiar with its services (Campbell, 2015; Knight, 2016). Besides being part of the trusted community themselves, these users are also likely to increase legitimacy through processes of endogenous diffusion—promoting the new platform service(s) to a broader population. Here, we follow studies on the adoption of innovation, which have argued that new-to-the-world innovations are typically best legitimated by direct observations of peer behavior and word-of-mouth (Rossman, 2014). In this sense, global audiences are mobile carriers of legitimacy spillovers, transferring consumer behavior from cities where platforms are already present to cities where their services are newly introduced. Our last hypothesis reads as follows:
Hypothesis 4. Platform companies are more likely to introduce their location-bound services in locations with more exposure to customers visiting from other locations in which they already offer their services.
Data and methods
Sampling and dependent variable
Ever since the Uber app was launched in San Francisco in July 2010, Uber has been introducing its services worldwide—mostly at the city level. We have thus taken cities as our unit of analysis, and the introduction of UberX in a city at a particular time as our main dependent variable. In order to construct the dependent variable, we used Geonames 2 gazetteer data to compile a list of all cities worldwide with a population equal to or above 100,000 inhabitants, resulting in a comprehensive collection of 4262 cities worldwide. A minimum in population was set because including smaller cities would disproportionally increase the size of the dataset relative to the number of entries. We were able to collect information on all independent and control variables for 4190 (98.3%) of all cities. These cities comprise our final sample.
We used Uber’s “Cities” webpage 3 to create our binary and time-specific introduction variable. In order to gather the dates of city introductions, we used the Internet Archive Wayback Machine. 4 This archive enabled us to visit archived versions of Uber’s Cities webpage, and look for the dates when new cities were added. The Internet Archive states that their archived pages do not represent all historical updates of the web, but are based on periodic web crawls done by web traffic companies since 1996. However, 452 crawls in a period of 72 months (January 2011–February 2017), an average of 6.2 crawls per month, makes for a good proxy for the introduction dates of Uber’s services. To further refine the date of introduction we searched Uber’s blog and newsroom 5 pages to find posts containing the announcement and exact date of each city introduction. The first web crawls for Uber’s website go back to 4 January 2011, which is more than a year before the first date of observation in this study, when the company had its first UberX introduction (3 July 2012). The day of this first introduction of UberX is also the first date of follow-up. All searches were finalized on 28 February 2017, which we considered the final follow-up date for UberX entry. Thus, cities were either followed until UberX entry or until the final follow-up date, after which they were censored. We found an UberX introduction in 574 cities, comprising 13.5% of the cities in our dataset.
Formal institutional variables
To test the hypotheses on formal institutional variables, we focused on three sets of variables in the regulatory domain: economic institutions, political institutions, and labor market institutions. The data are taken from the Institutional Profiles Database (IPD) (Bertho, 2013; IPD, 2012), which contains 130 indicators of institutional characteristics for 143 countries and has been used in the international business literature before (Arezki et al., 2015; Bénassy-Quéré et al., 2007; Lavigne and Nicet-Chenaf, 2016). These institutional characteristics are measured at the country level through composite indicators measured on a continuous scale from 0 to 4. For some (low-income) countries, the data are lacking, which implied we had to leave out 38 cities from the analysis.
To measure economic institutions, we used indicators for market regulations: “competition regulation,” “barriers to market entry” and “public support for innovation.” Here, strong economic institutions have higher scores on competition regulation and public support for innovation and lower scores for barriers to market entry. In order to capture political stability, we included the IPD indicators “functioning of the justice system,” “level of corruption,” and “influence economic stakeholders.” Strong political institutions are thus indicated by higher scores for the functioning of the justice system and lower scores for the level of corruption and influence of economic stakeholders. Finally, to capture local labor regulations, we included the indicators “trade union freedoms,” “compliance with employment law (formal sector),” and “employment contract protection.” Here, strong labor market institutions are indicated by higher scores on all three indicators.
Out of all the indicators of the IPD database, we decided to use these nine indicators to operationalize the three regimes of formal institutions for several reasons. First, most of these IPD indicators have previously been used to explain location choice activities (Bénassy-Quéré et al., 2007). Second, and related to this, many of the other indicators fall outside of the scope of this research because they are unrelated to location choice, Uber, platform companies or the three regulatory regimes of interest (e.g. most indicators are on the capital market). Furthermore, some other indicators in the IPD dataset are too general (e.g. “functioning of political institutions” or “autonomy of organizations”). Finally, some indicators that might have been interesting inclusions to our analysis correlated too strongly with indicators we had already included (e.g. “barriers to entry” correlates strongly with “ease of starting a business,” “trade union freedoms” correlates strongly with “independence and pluralism of trade unions”).
Our nine indicators, plotted on a scale from 0 to 4, were all measured at one moment in time, justified by the fact that these generic regulatory institutions of interest were not expected to change substantially during the short period of our time frame, as macro-institutional change is gradual and incremental (Mahoney and Thelen, 2010; North, 1990). For a more detailed description of the IPD data, we refer to the data description published in Bertho (2013).
Customer following variables
To measure the extent to which Uber could follow its existing customers, we measured to what extent cities are exposed to UberX in other cities through networks of traveling customers. We used three networks between cities based on three different datasets.
First, we made use of air traffic between cities, which constitutes a general network of travel. The assumption here is that the better cities are connected to others through air traffic, the more Uber customers will travel between these cities. We used data provided by openflights.org on air routes between cities to calculate this air traffic connectivity between cities, which yielded 67,663 air routes between 3209 airports around the world. As such, we were able to calculate the number of air routes between each pair of cities and construct a network of incoming air routes between cities.
Our second network is based on global business connectivity. The business community specifically represents one of Uber’s most sizable communities (Alemi et al., 2018). Indeed, business travelers were among Uber’s earliest customers and Uber targeted this audience in their global expansion strategy (Lashinsky, 2017). In order to measure business connectivity between cities, we made use of data of the Globalization and World Cities (GaWC) Research Network (Taylor, 2001; Taylor and Derudder, 2016; Taylor et al., 2014). The composition of this world city network is based on the premise that links between cities follow from connections between a single firm’s offices in different cities (Taylor et al., 2014). The idea here is that the better cities are connected through business firms in the world city network, the more business travelers are expected to move between these cities. Two cities in this network are thus connected when they both have an office of the same multinational firm. This connection was weighted by the type of office that is present in both of the cities (which was coded between 1 and 5). By combining the single-firm networks of 175 multinational firms in “advanced producer services” in 2016, 6 we construct a (weighted) network of shared offices between cities.
Our third network is based on a dataset on co-patenting. We used co-patenting to capture a more industry-based business collaboration between cities, because co-patenting indicates a joint output stemming from collaborative R&D activities (Belderbos et al., 2014). When two cities are better connected by co-patenting, there is more collaboration between R&D-intensive organizations in these two cities and, accordingly, more travelers moving between these cities. In order to obtain co-patenting patterns between cities, we used the OECD-REGPAT database, which contains all patent applications to the European Patent Office and Patent Corporation Treaty between 1978 and 2017. These patent applications are allocated to the city level based on the inventor addresses. Because we analyzed co-patenting, we only selected the patents that were co-developed by inventors from different cities—we left out patents developed by only one inventor or inventors from the same city. As a result, our network of inter-city co-patenting consists of 136,197 patents that list at least two addresses from different cities between 2009 and 2017. For each year in our time frame (2012–2017), we took the moving sum of number of collaborations between cities within the past 4 years starting 3 years before the focal year in order to capture that working toward a patent application requires preparation and publications in the years before the application (Belderbos et al., 2014). We then constructed a network of connectivity between cities through co-patents for the period between 2012 and 2017.
In order to capture to what extent cities were exposed to UberX through these networks, for each city we computed i the sum of all connections with cities where UberX is already active at time t, as given by

where Ci↔i is the intercity connectivity of city i with the jth city in our dataset and Ujt is a binary variable indicating whether UberX is active in the jth city at time t. Applying this formula to our three individual networks provided us with three time-dependent UberX exposure variables that changed over time when UberX began introducing its services in more cities globally. In order to make the three independent variables more comparable, we normalized the variables on a scale from 0 to 10.
Our three different networks provide us with a rich picture of a cities’ exposure to incoming travelers. The GaWC network and the patent network mostly capture business travelers, where the former has a focus on advanced producer services and the latter a focus on R&D intensive industries. As such, we captured one of Uber’s core audiences (Alemi et al., 2018). Our air traffic network focuses more on incoming travelers in general, including business and tourist flights. As such, we also captured incoming tourists, another one of Uber’s core audiences (Connolly, 2020).
Control variables
We included a number of control variables in our models. First was national gross domestic product (GDP) per capita and city population, to control for the attractiveness of local markets. GDP per capita is measured in US dollars retrieved from World Bank (2019a) data. The population of the cities in our database was provided in the gazetteer data of Geonames. Besides these control variables for the general attraction of cities for foreign entry, we used certain variables that might affect attractiveness for Uber specifically. First, we included the level of unemployment as a percentage on the country-level (World Bank, 2019b), because higher unemployment rates provide Uber with more opportunities to find local drivers. Second, we used the perceived quality of local public transport (Bertho, 2013) since the attractiveness of entering a city for Uber might decrease if high(er) quality alternative mobility options are present. We also included a dummy variable for capital cities, as these are sometimes considered more attractive locations for MNEs due to better access to national government officials (Belderbos et al., 2017).
Furthermore, to distinguish between exposure to UberX and overall connectivity of a city we also included the total connectivity for each city in our three networks. Here we use the same networks as used for the customer-following variables, but we did not restrict this measure to the cities that already have UberX—we applied it to all the cities in these networks. For total air traffic connectivity, we took the sum of all income air routes from all other cities in the network. For total global business connectivity, we took the weighted number of shared offices a city has with all other cities in the network. Finally, for the total co-patenting connectivity, we took the moving sum of co-patents a city had with all other cities in the network within the past 4 years. We added these measures for overall global connectivity to control for the attractiveness of global cities for the location choice of MNEs (Belderbos et al., 2017).
As a final control variable, we took into account the geographic proximity of prior UberX entry. This variable was introduced to control for the possibility that Uber had prior local experience proximate to a given location (Jain et al., 2016; Nielsen et al., 2017). We calculated, for each day, the number of cities with UberX in a radius of 100 km (great-circle distance) from the focal city. Rather than taking the national scale, we chose this smaller scale since our geographic proximity variable was expected to measure the likelihood that Uber had overcome local cultural adjustment problems and that local audiences directly interacted with UberX services in geographically proximate cities. Tables 1 and 2 show the descriptive statistics for our time-independent variables only and correlations for all independent and control variables, respectively.
Descriptive statistics for time-independent and time-dependent variables.
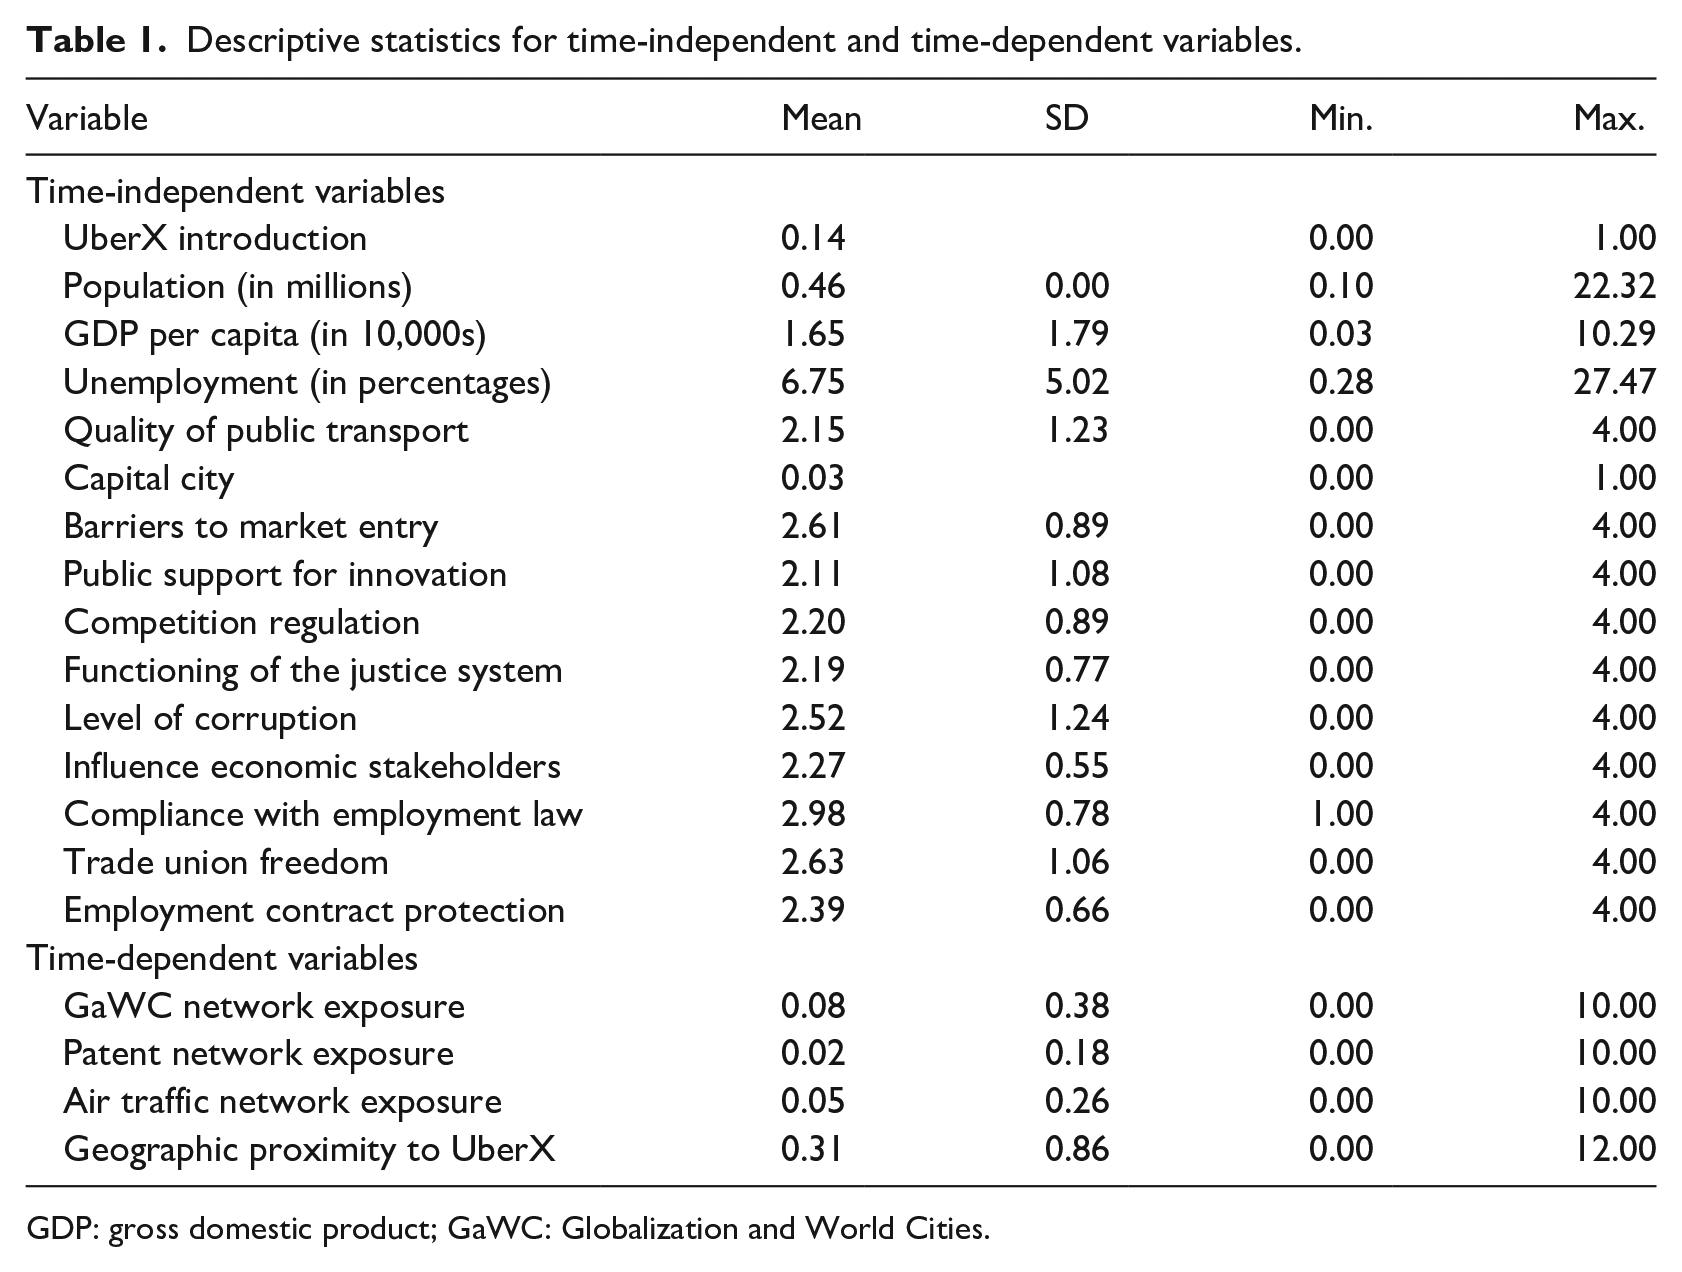
GDP: gross domestic product; GaWC: Globalization and World Cities.
Correlations of independent and control variables.
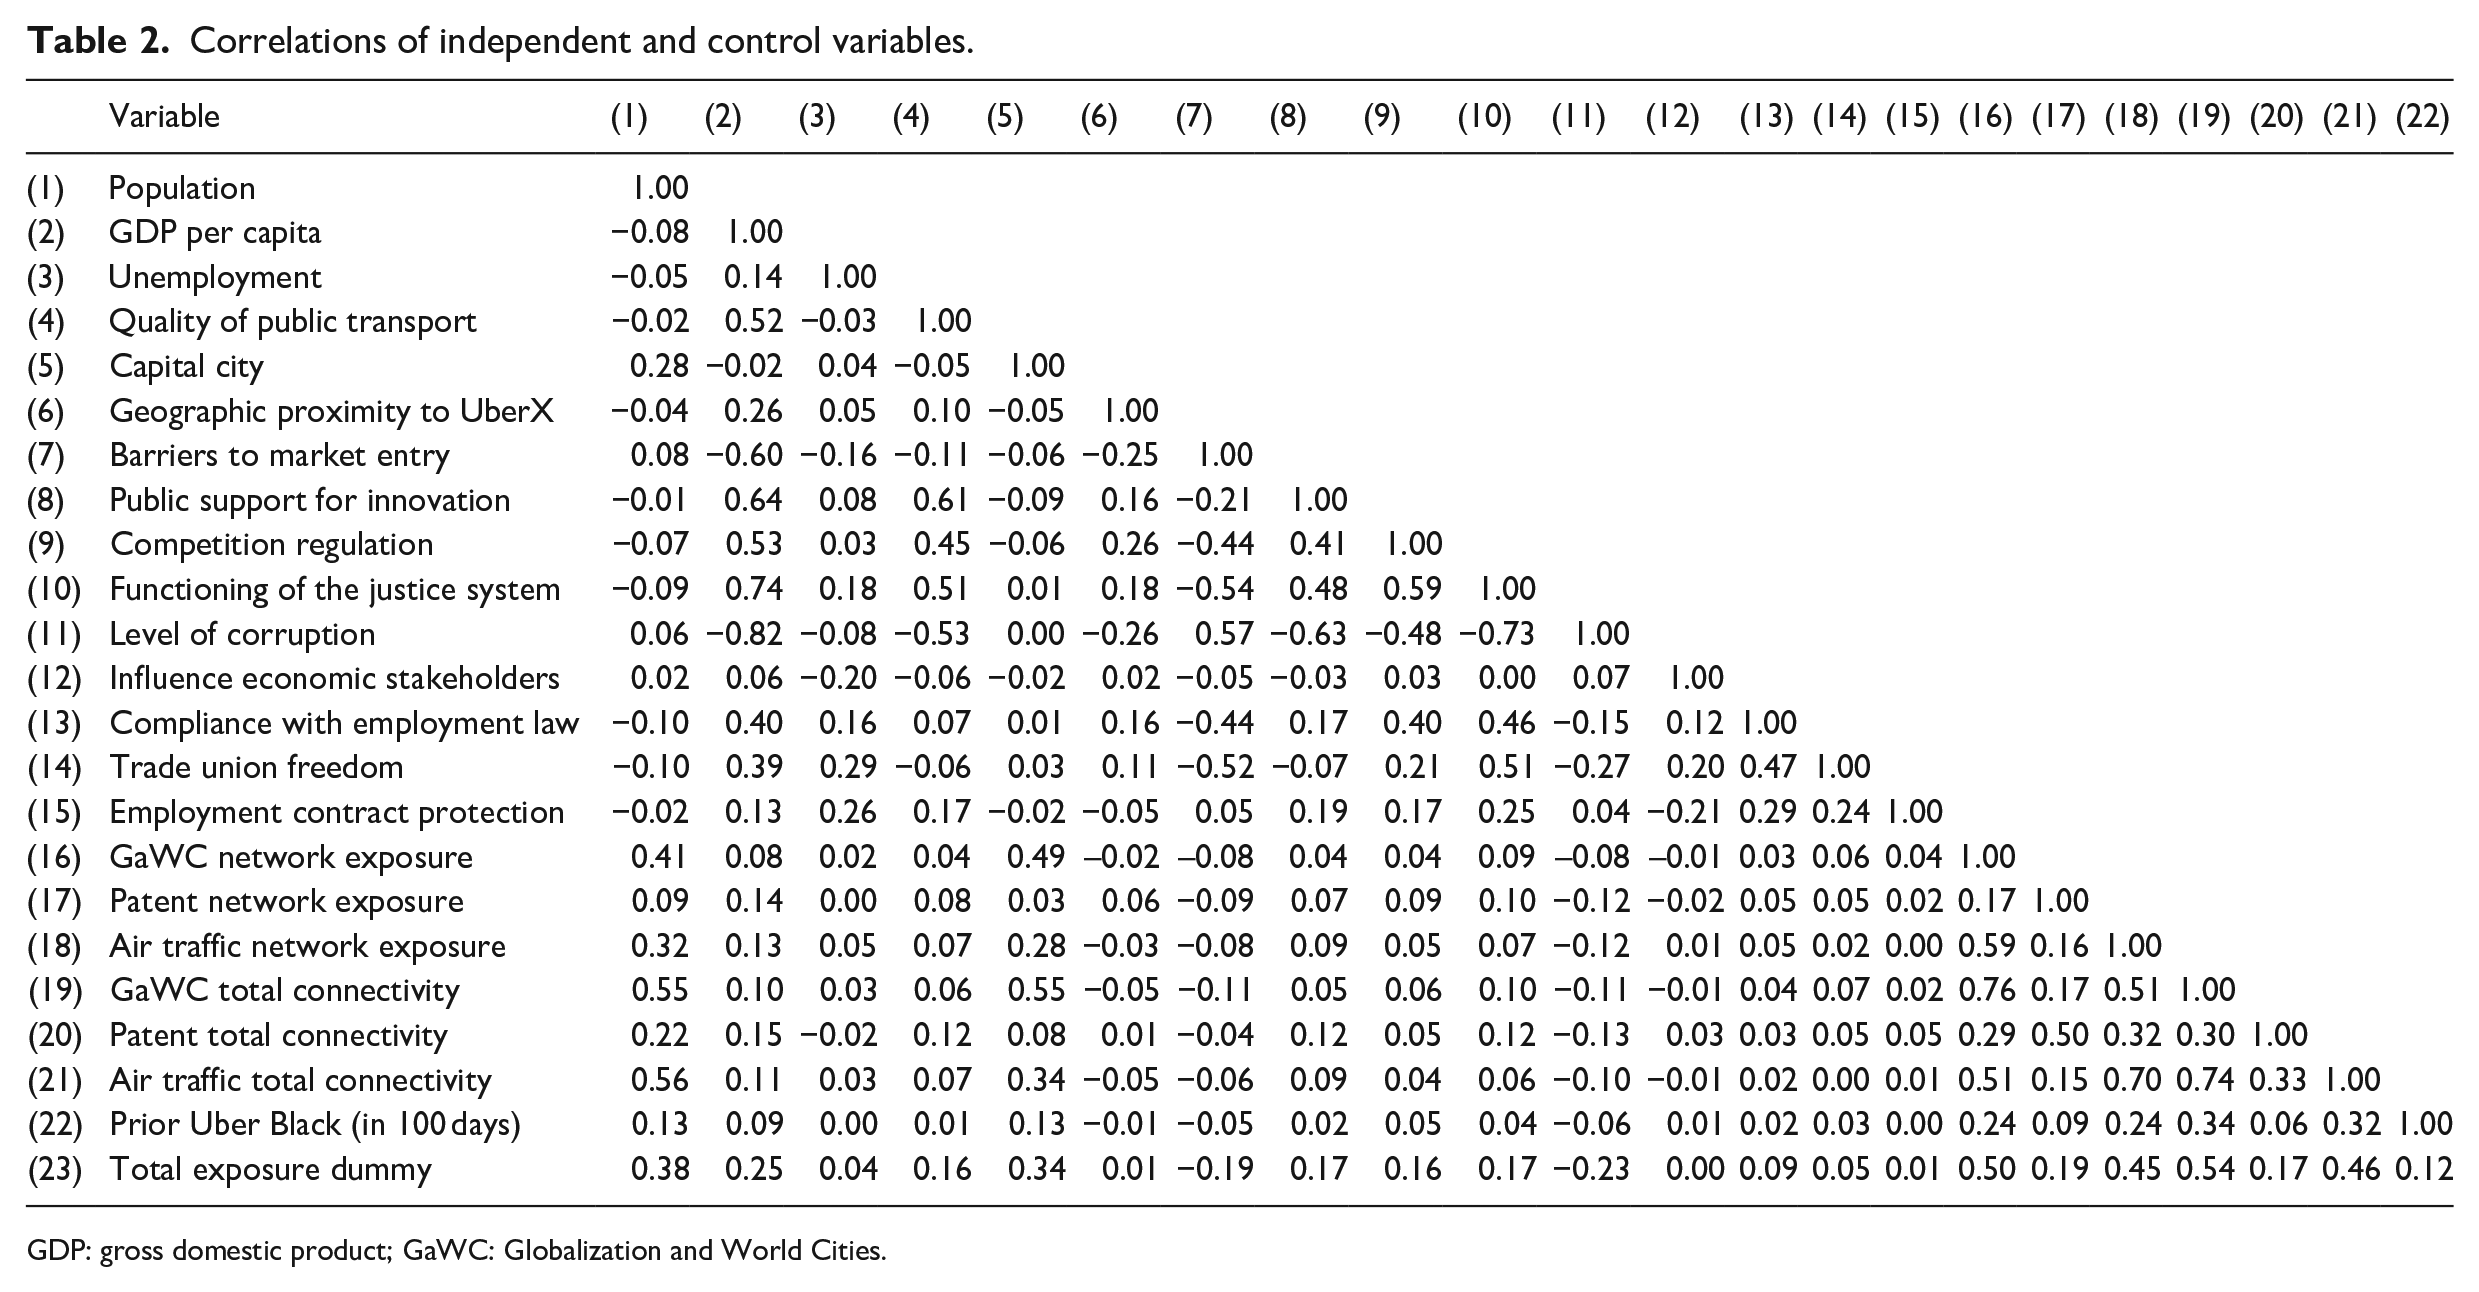
GDP: gross domestic product; GaWC: Globalization and World Cities.
Time-to-event analysis
In order to test our hypotheses, we used time-to-event analysis and built an extended Cox model. The Cox model is suitable for studying the impact of time-varying covariates on the risk of a specific event occurring, in this case the local introduction of UberX within a city. The main reason for using it is that the model explicitly accounts for the right-censored nature of our data, that is, cities that did not experience an UberX introduction in the studied time frame, but might experience such an introduction at a later stage. We used an extended Cox model because we sought to include time-varying variables in our analysis which would result in a violation of the proportional hazard assumption of a regular Cox model. In order to estimate covariates associated with the risk of introduction, extended Cox models use exponential hazard functions that represent the risk that if at time t a city has not seen an UberX introduction, this city will be subjected to an UberX introduction at some instance later on. This means that the data are formatted in such a way that each city contributes a line for each time interval, allowing the time-dependent variables to change (Kleinbaum and Klein, 2012; Therneau, 2018). To measure the influence of covariates, the model uses the following equation

where h0(t) is the baseline hazard function, Xi denotes the ith time-independent variables and Xj(t) denotes the jth time-dependent variables (Kleinbaum and Klein, 2012). All predictors at time t are denoted by
Results
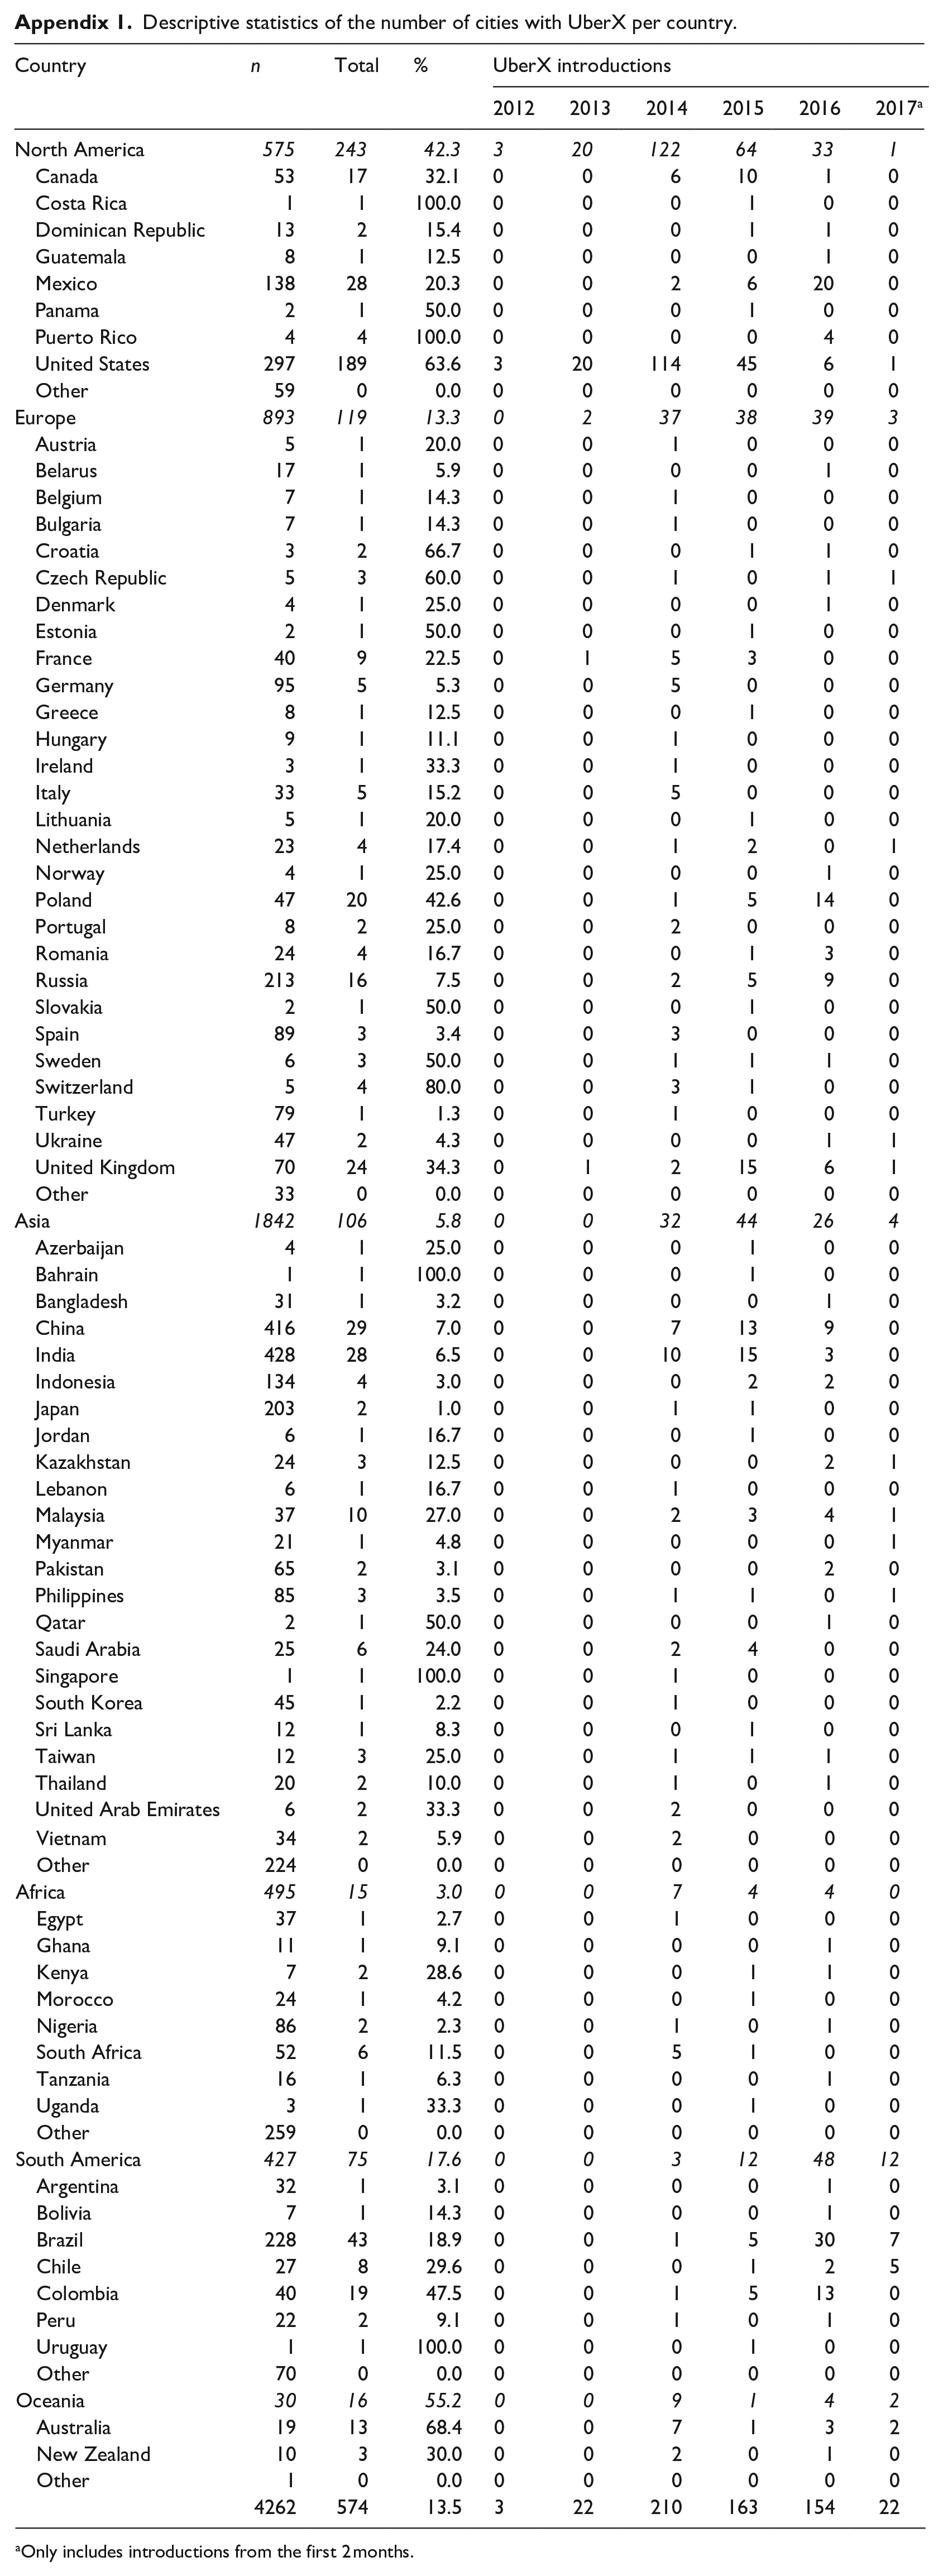
In total, 574 cities experienced an UberX introduction during our time frame, which corresponds to 13.5% of the 4190 cities included in our dataset. The table in Appendix 1 classifies this global diffusion by continent and country. The overall pattern of diffusion can be summarized as a process that started in North America, continued in Europe, Asia, and Oceania and ended in South America.
Hypothesis testing
Table 3 presents the exponential regression coefficients (hazard ratios) of our extended Cox models of the formal institutional variables. Following Blossfeld et al. (2007), we interpreted the effect of the covariates in the extended Cox model as the percentage change in the hazard rate, given that all other variables remained unchanged. To do this, the following equation is used

where
Extended Cox model introducing regulatory institutional variables for predicting local UberX introduction.
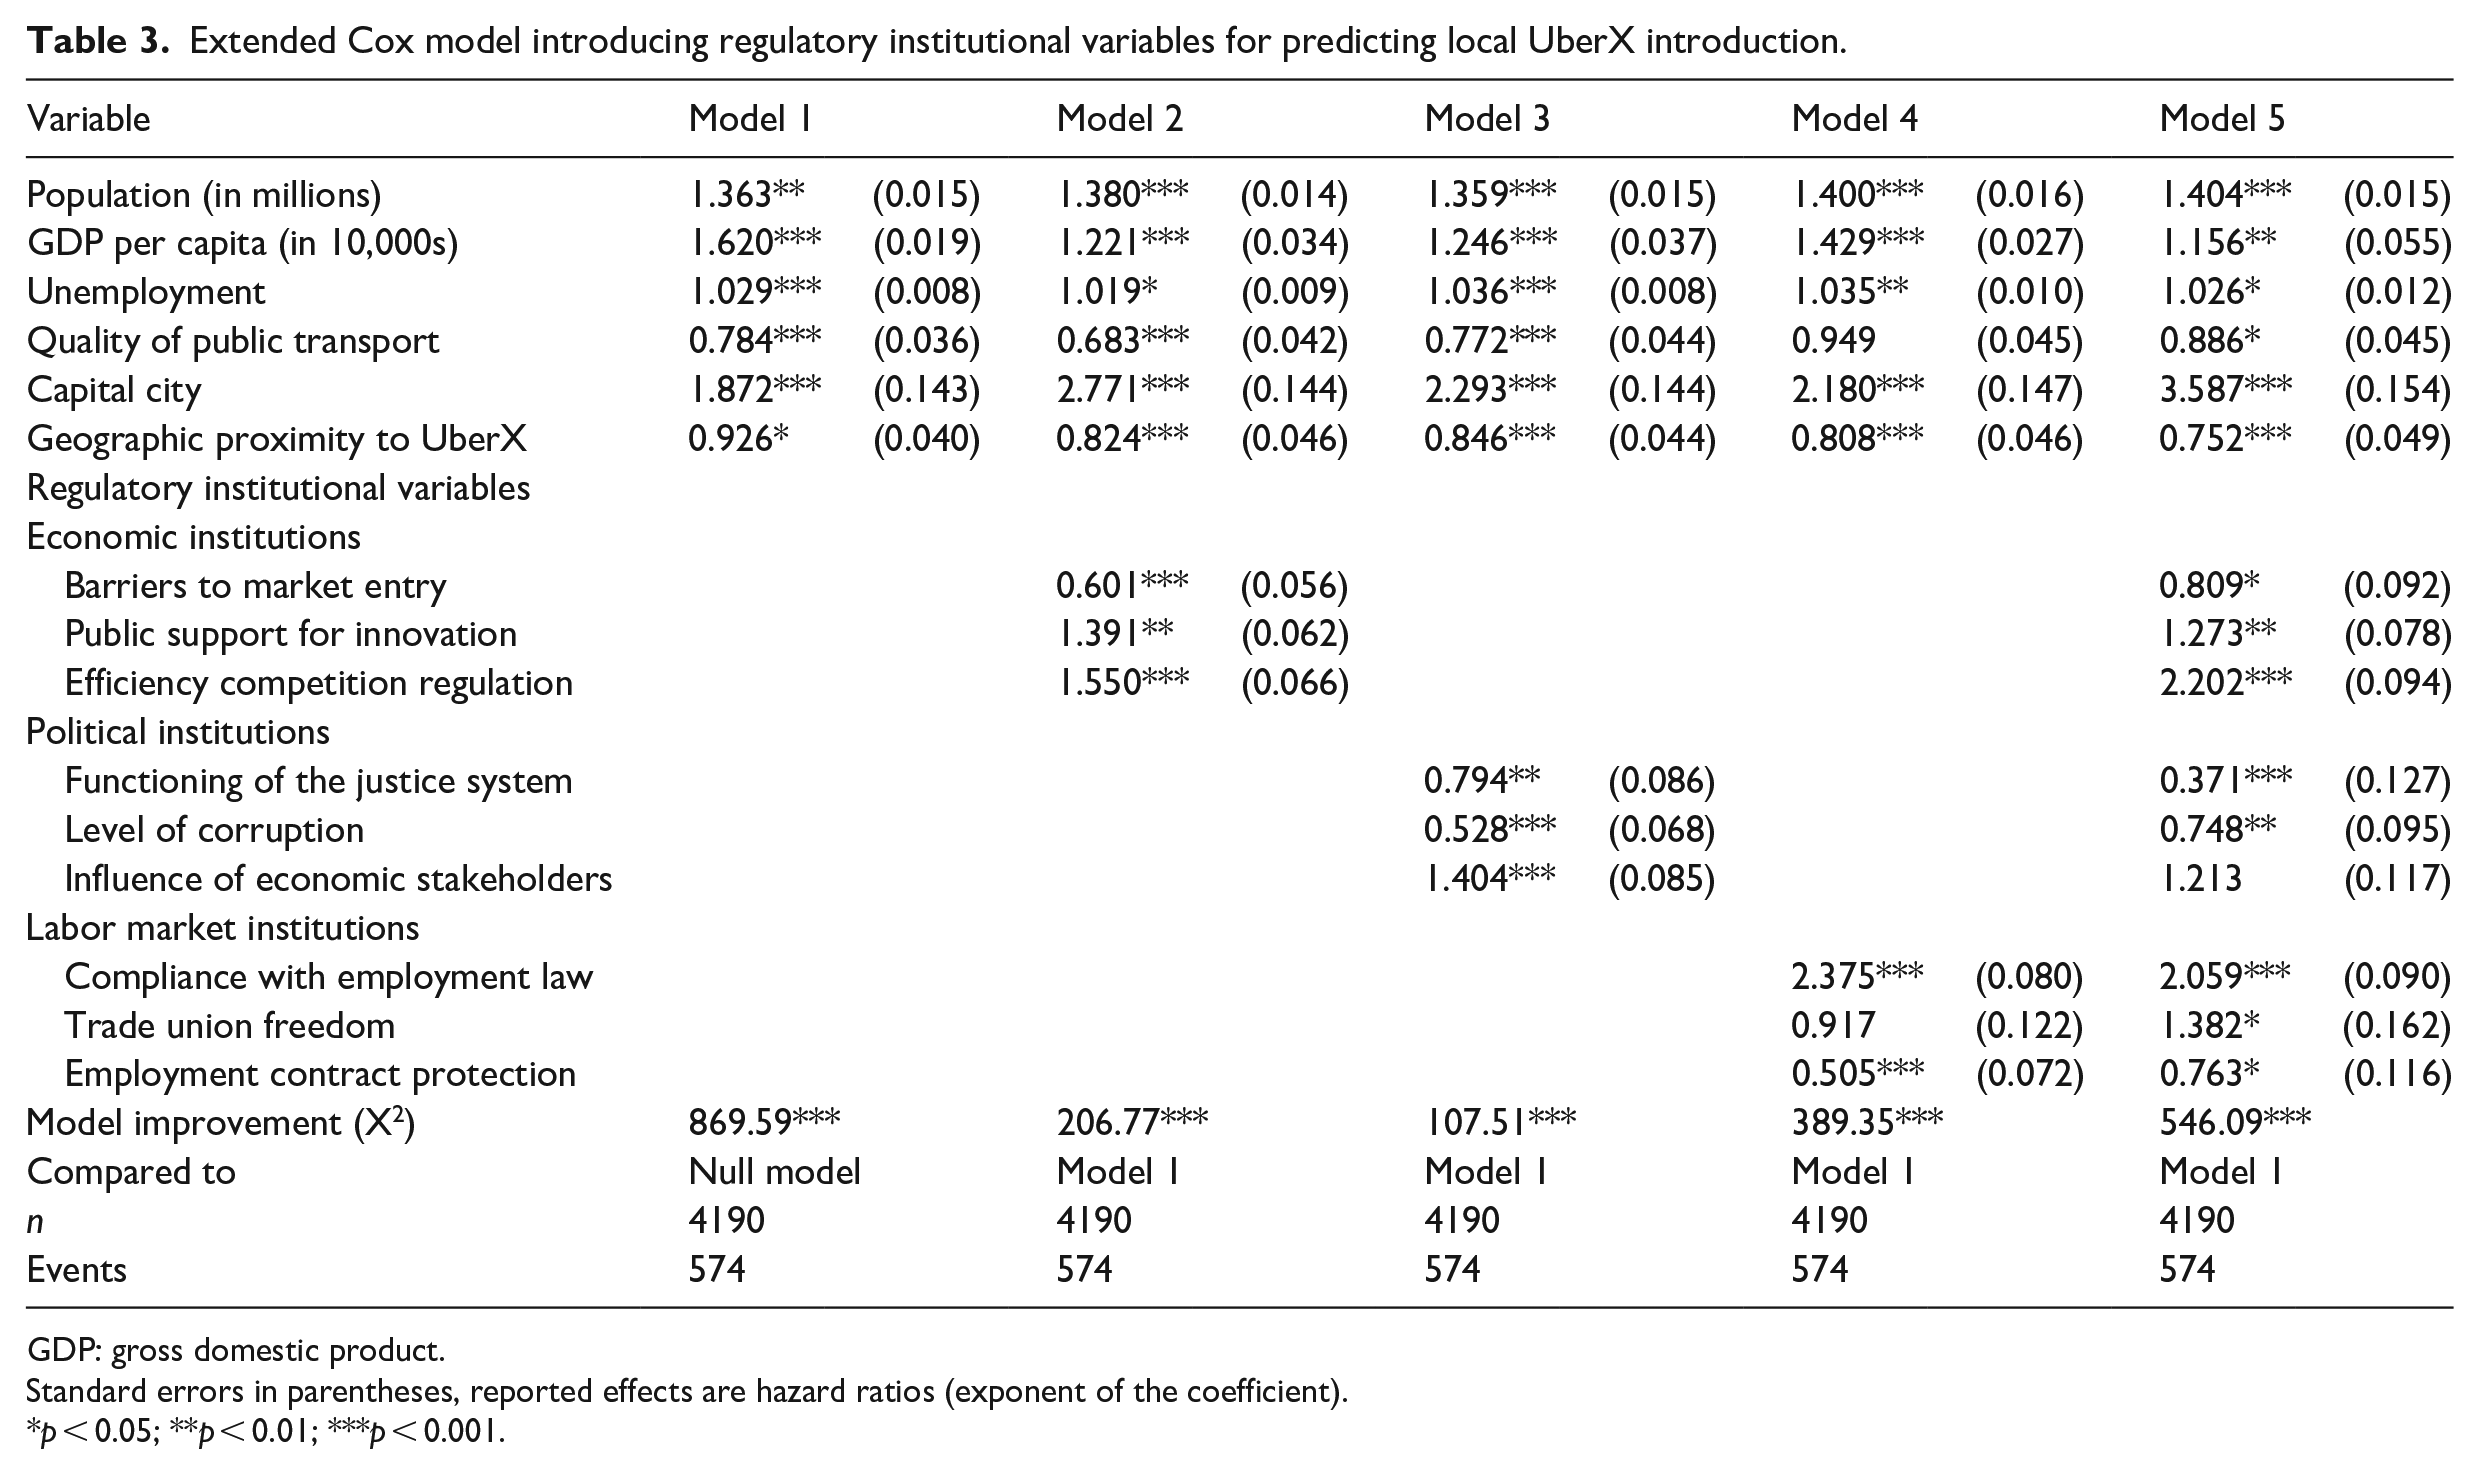
GDP: gross domestic product.
Standard errors in parentheses, reported effects are hazard ratios (exponent of the coefficient).
p < 0.05; **p < 0.01; ***p < 0.001.
Model 1 only includes our control variables and shows the expected results for variables measuring host market attractiveness. Both population and GDP per capita show a positive and significant effect on the likelihood of experiencing an UberX introduction. Furthermore, the variables indicating a city’s attractiveness for the UberX service specifically show the expected signs, with Uber entering being more likely in locations where the quality of public transport is relatively low and the level of unemployment is relatively high. This first model also shows that capital cities have an increased likelihood of experiencing an UberX introduction. Finally, prior UberX activities in proximate cities seems to have had a negative effect, indicating a more geographically diffuse strategy for Uber to penetrate markets worldwide.
Models 2–5 introduce the regulatory institutional variables that we used to test Hypotheses 1–3. We introduce three blocks of variables representing economic institutions, political institutions and labor market institutions. As Model 2 shows, all of the variables capturing economic institutions promoting innovation and competition are significant and move in the expected direction. It shows that Uber preferred new locations where barriers to market entry are low, innovation is encouraged, and competition is safeguarded. These effects are robust from Model 2 onwards. The competition variable shows the strongest effect, with an increase in the hazard rate between 55% and 120.2% per one-unit change for this variable (on a scale from 0 to 4) throughout our models. In all, the effects for economic institution variables support Hypothesis 1.
The results regarding local political institutions are mixed. In Model 3, all three variables show a significant effect, but not all took the expected directions. While the variables for corruption show the expected direction (i.e. less corruption increases the chance of UberX introduction), the hazard ratio of 0.794 (and 0.371 in Model 5) for functioning of the justice system runs counter to Hypothesis 2: the better the functioning of the justice system, the less likely Uber is to enter with their UberX service. The hazard ratio of 1.404 for influence of economic stakeholders also runs counter to Hypothesis 2: the more influence economic stakeholders have (and thus the weaker political institutions are), the more likely Uber is to introduce their UberX service. However, from Model 5 onwards the influence of economic stakeholders shows no significant effect. Taken together, we can only partially confirm Hypothesis 2, as only one out of three variables showed the anticipated effect.
Our variables for labor market institutions were added in Model 4. Again, this set of formal institutions revealed a mixed picture. Employment contract protection displayed the expected negative effect: the higher employment contract protection, the less likely it is that UberX is introduced. Model 5 tells us that the hazard rate of UberX introduction decreased by 23.7% with a one-unit increase in the employment contract protection variable (on a scale from 0 to 4). However, the variable indicating compliance with employment laws showed an unexpected positive relationship with the likelihood of UberX entering. The hazard rate of UberX entry more than doubled for every one-unit change in this variable (on a scale from 0 to 4). Uber seems to introduce their UberX service in locations that have an increased compliance with local employment laws. Trade union freedom also showed an unexpected positive effect, but it turned out not to be significant in later models. Taken together, we can only partially confirm Hypothesis 3.
Models 6–9 in Table 4 include our variables measuring exposure to visiting customers who had already experienced their services as a test of Hypothesis 4. In each of the Models 6–9, we introduced one of the exposure measures separately, with all of them showing significant positive effects. When we included all of the exposure measures in Model 9, all maintain their positive and significant effect. The GaWC network exposure variable showed the strongest effect. A one-unit increase in the GaWC network exposure variable (on a scale from 0 to 10) increased the hazard rate of UberX introduction by 51.9%. Our patent network and air traffic exposure variables showed an increase in the hazard rate of 19.9% and 20.8%, respectively. Taken together, the observed effects for network exposure confirm Hypothesis 4.
Extended Cox model introducing network exposure variables for predicting local UberX introduction.
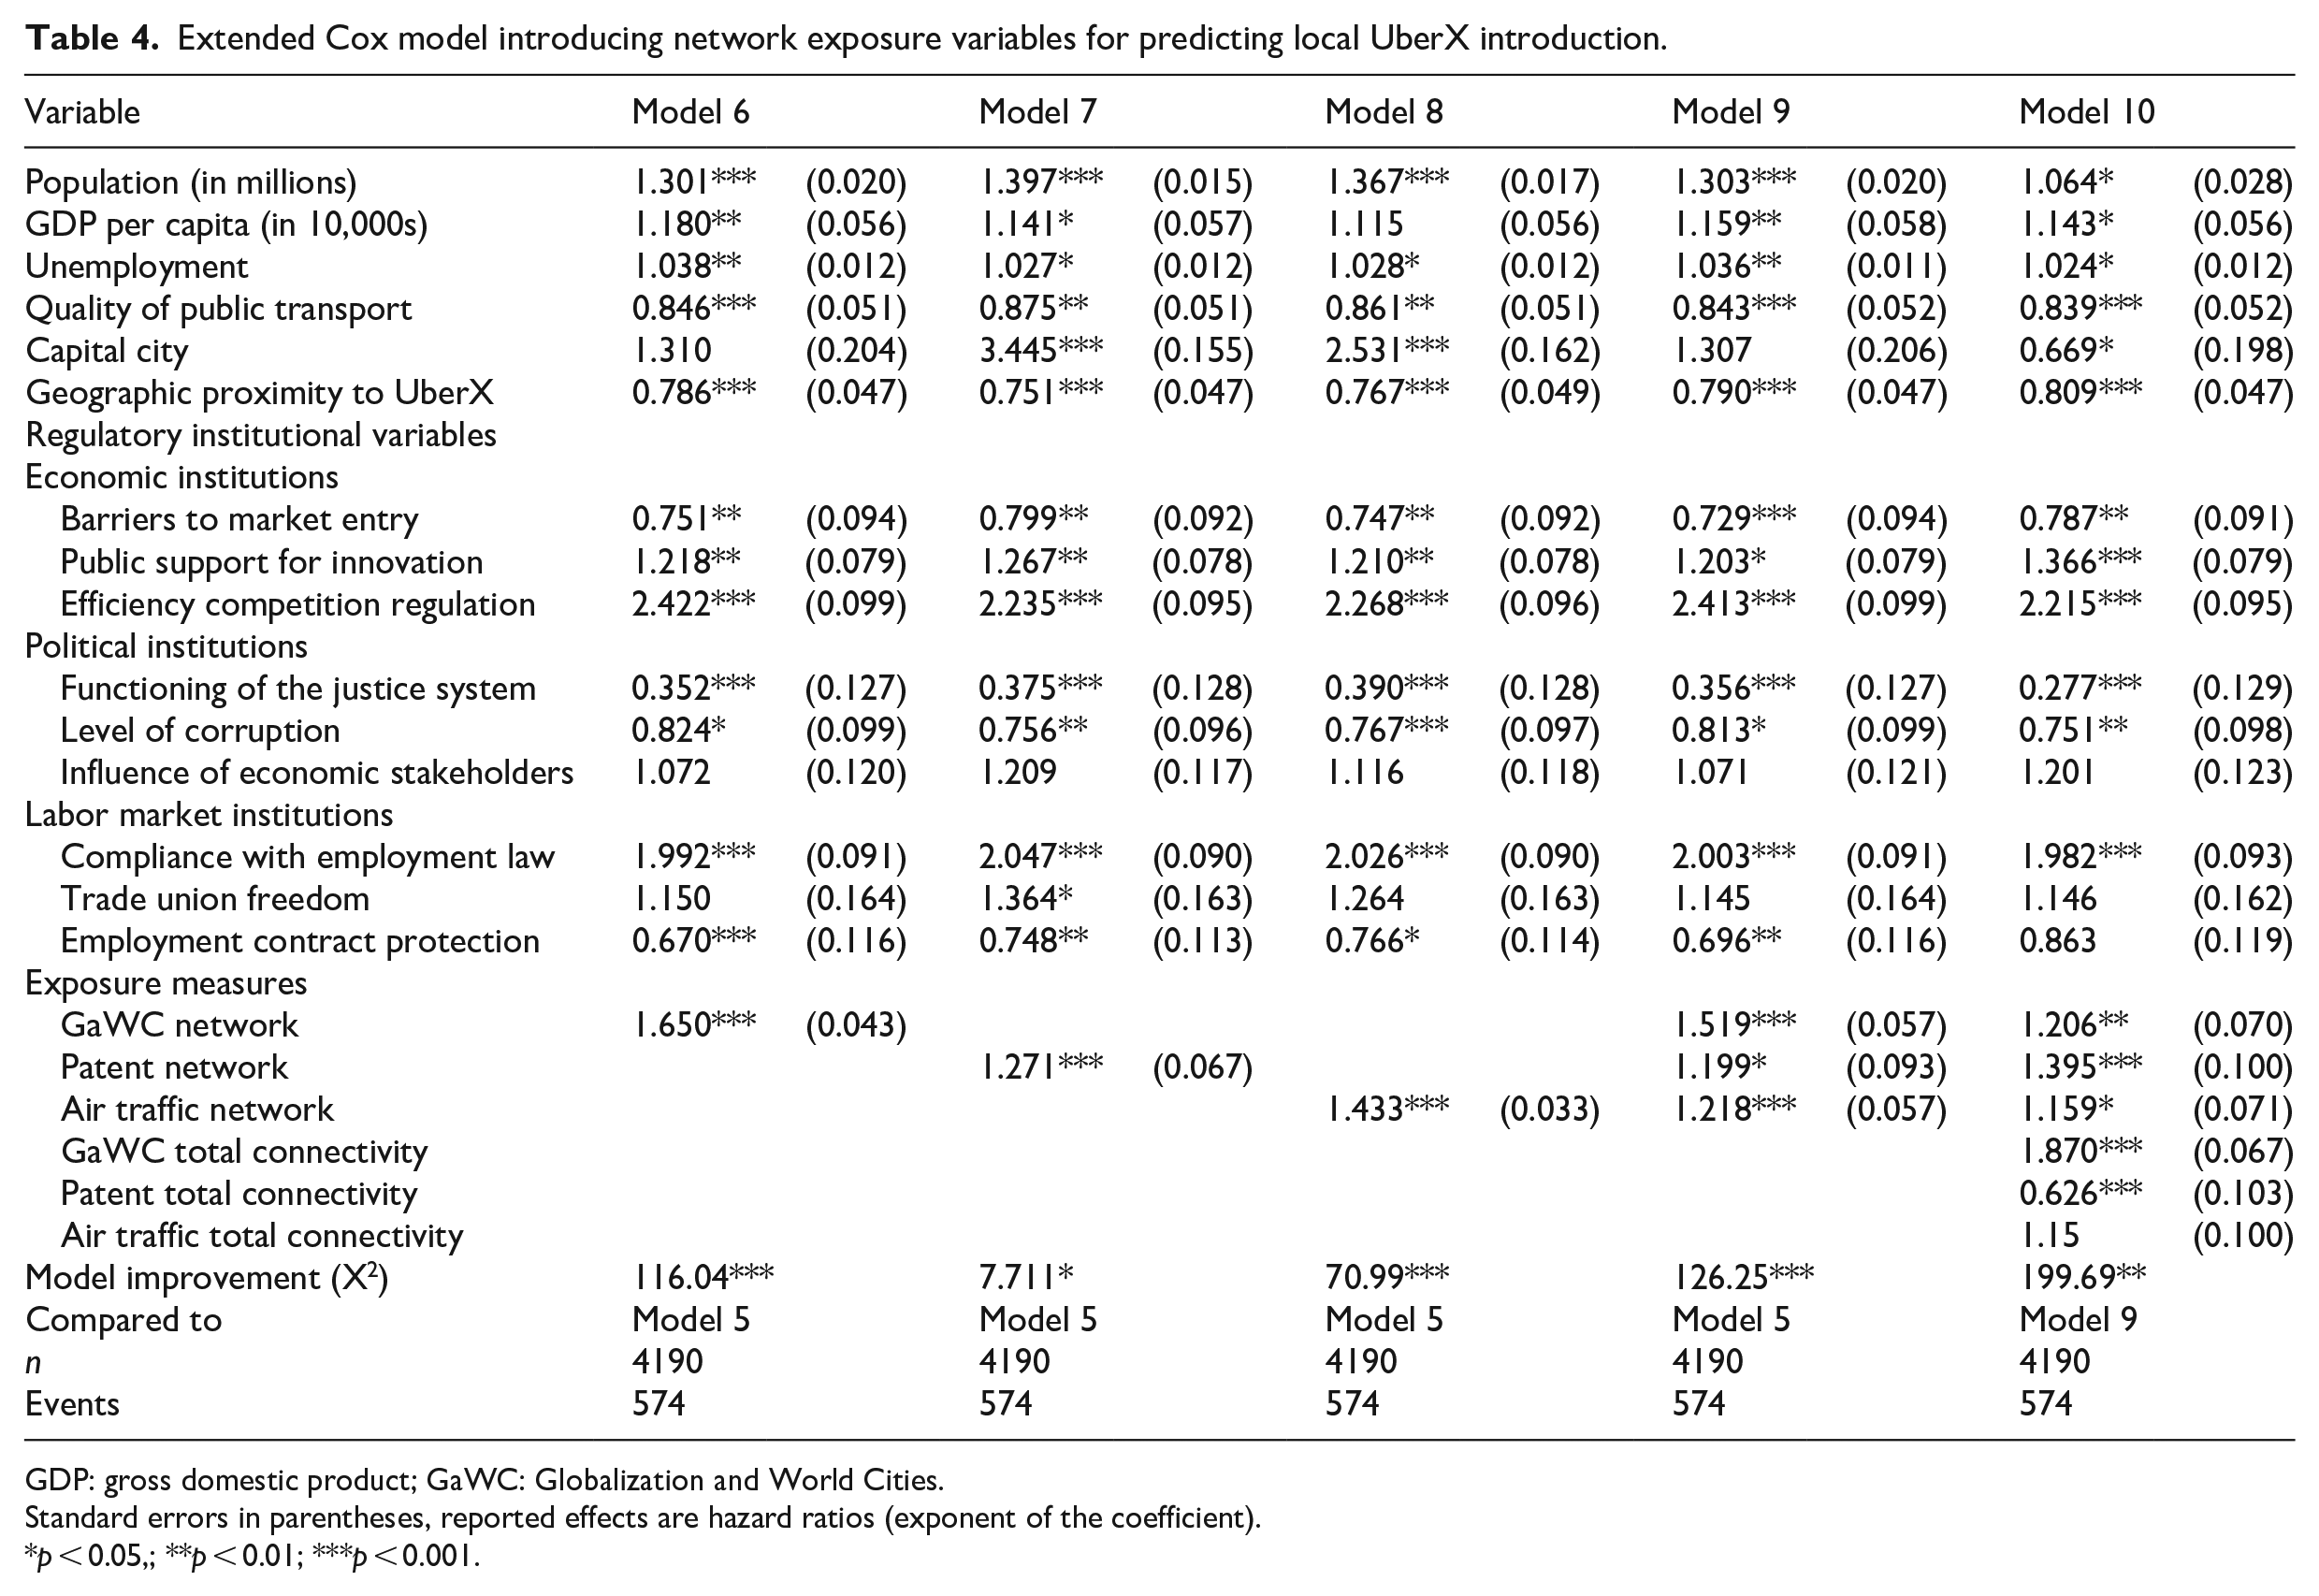
GDP: gross domestic product; GaWC: Globalization and World Cities.
Standard errors in parentheses, reported effects are hazard ratios (exponent of the coefficient).
p < 0.05,; **p < 0.01; ***p < 0.001.
Finally, in Model 10 we control for the total connectivity of our three networks, in addition to the specific exposure to UberX measured by our network exposure variables. We thus test whether location decisions during the period under review were based on prior exposure to UberX, or a city’s overall global connectivity (Belderbos et al., 2017). The GaWC total connectivity variable in this model revealed that cities are indeed more attractive to Uber when they are globally connected. However, the inclusion of overall connectivity did not come at the expense of the effects of our network exposure variables.
Robustness checks
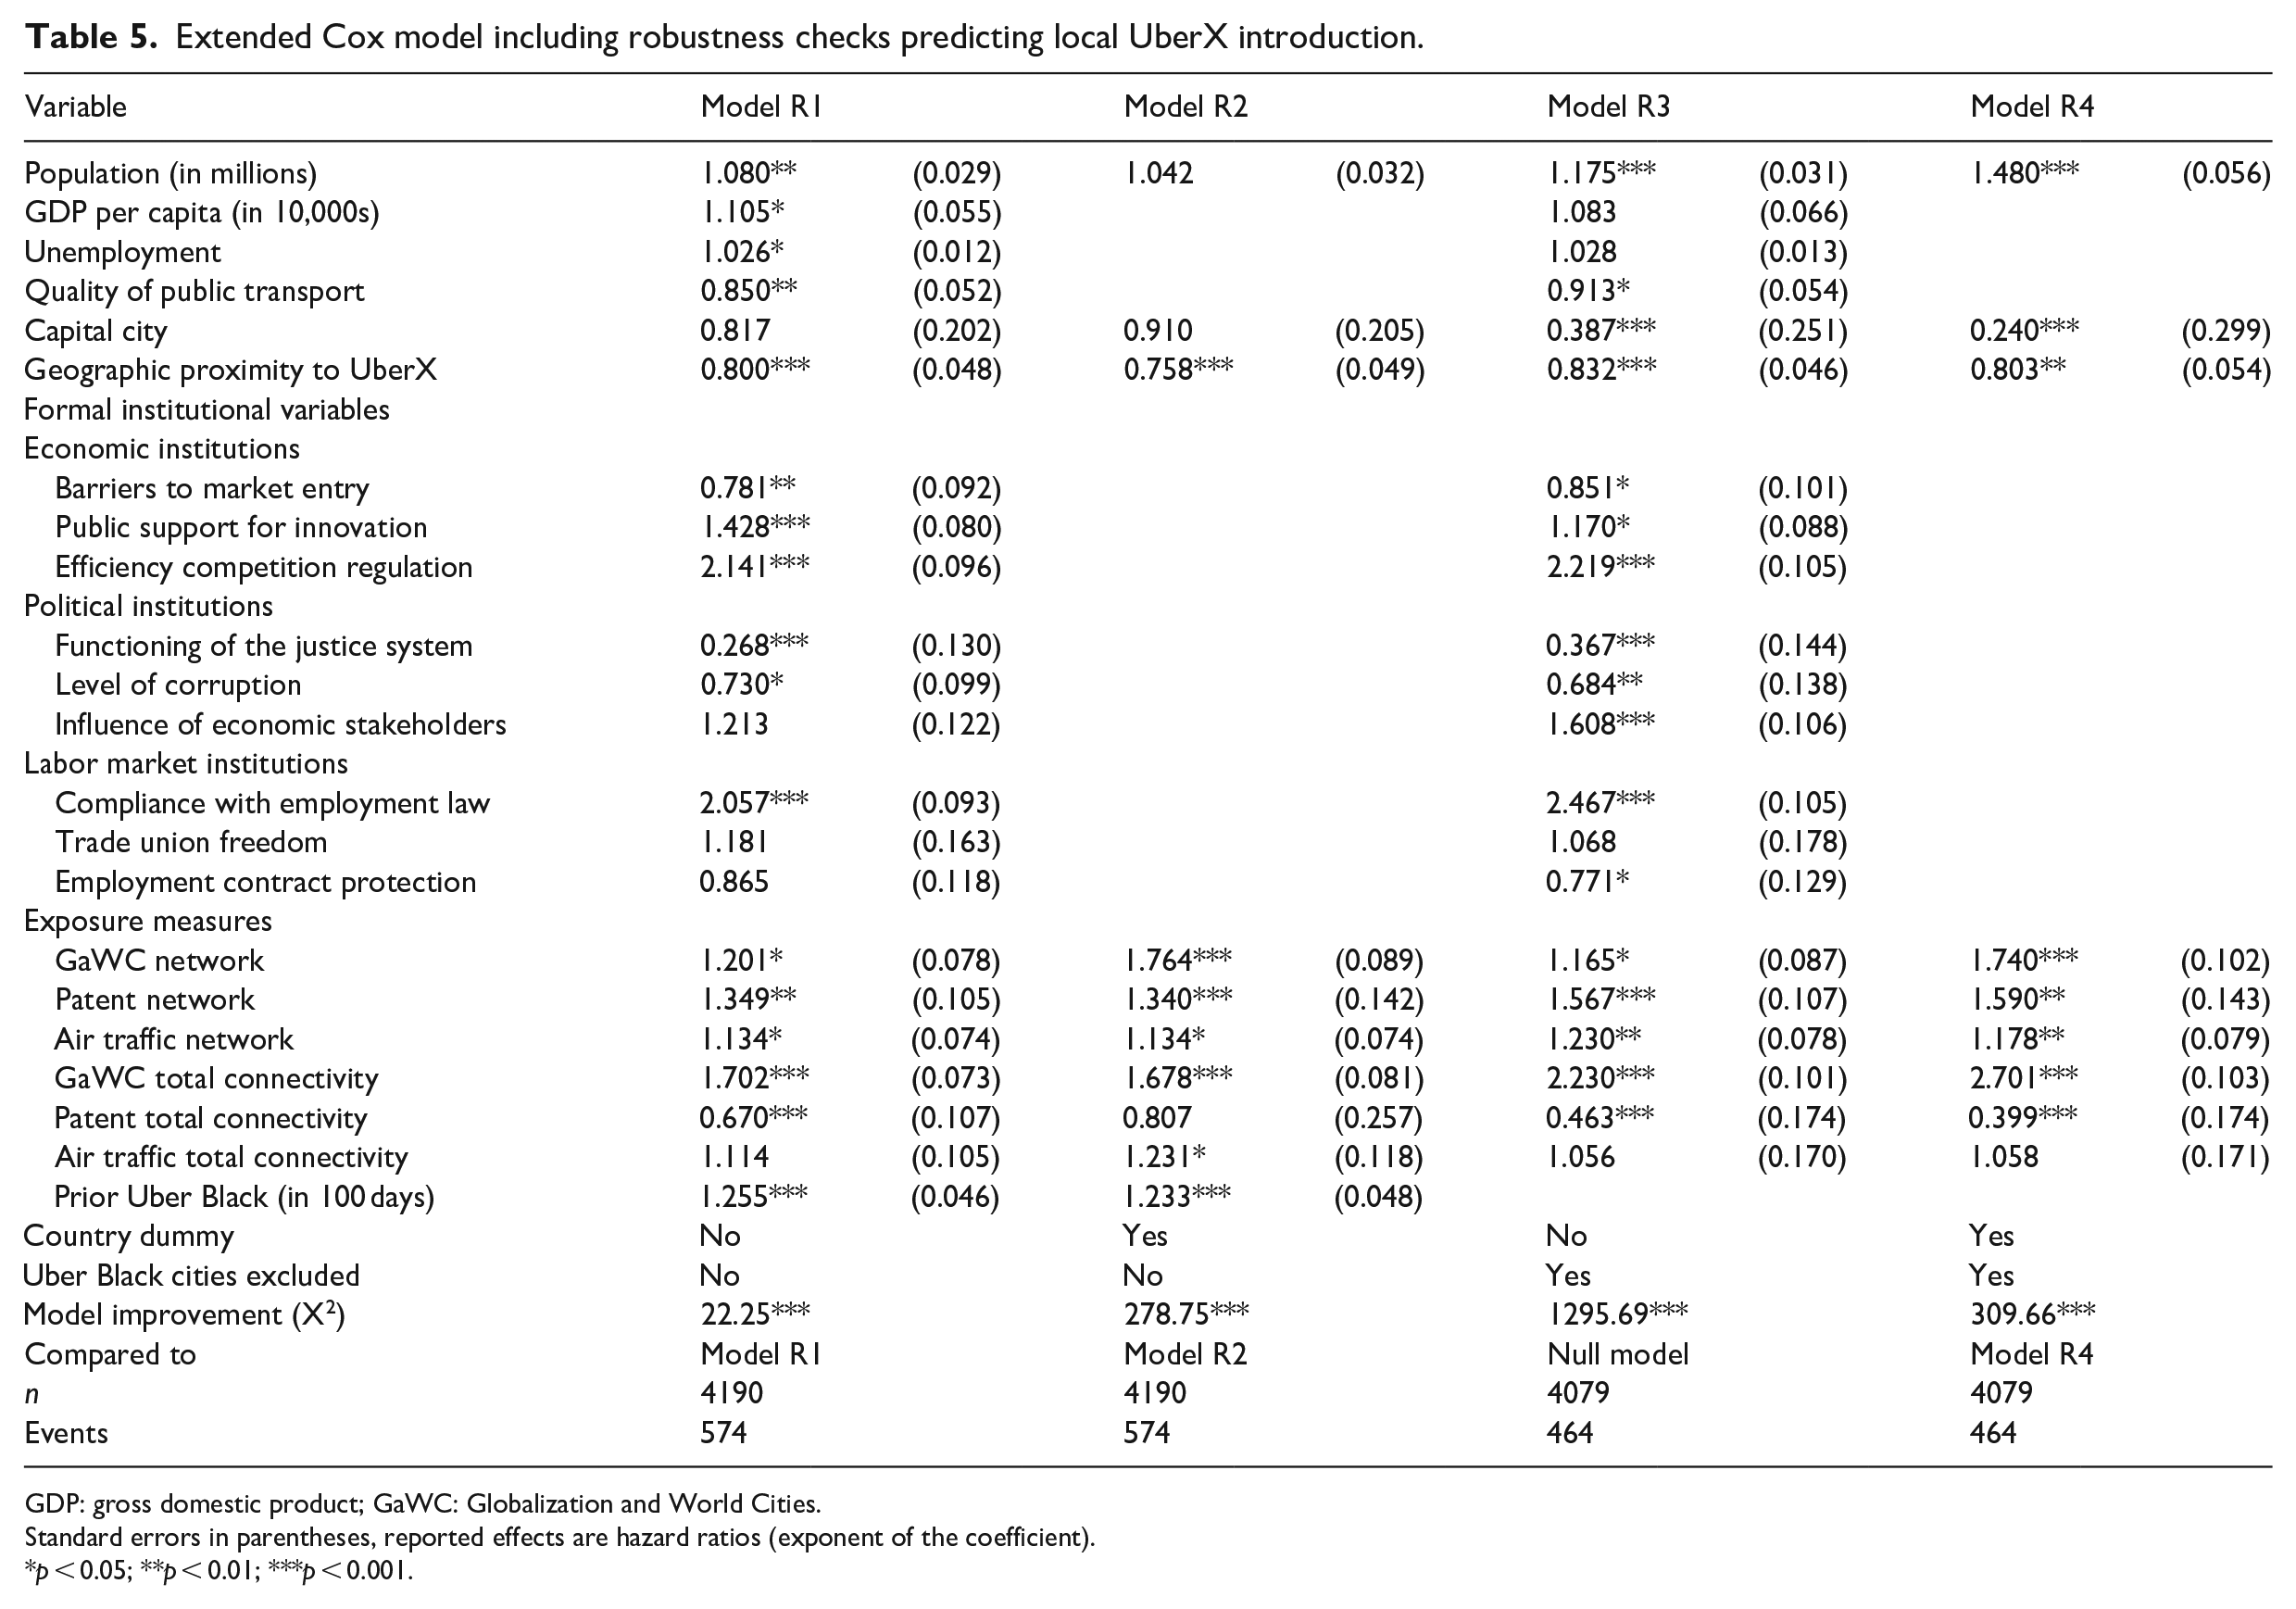
We check the robustness of our findings in Table 5. A second service that Uber introduced globally is Uber Black, which only employs certified drivers with luxurious cars and so faced much less friction with formal regulatory institutions. More specifically, Uber Black more closely resembles incumbent taxi business, and therefore has met less local resistance compared to the controversial UberX service (Rienstra et al., 2015). Of the 574 cities that experienced an UberX introduction, 20% experienced a prior Uber Black introduction. Model R1 in Table 5 includes an additional control variable that measures the number of days that Uber Black was already present in a city. The result shows that cities become more attractive to UberX introduction when Uber had already introduced its Uber Black service in that same city. This could be interpreted as Uber using its legal Uber Black service to prepare a city and its local audiences for an UberX introduction. The UberX service can, as such, profit from a local legitimacy transfer from the prior Uber Black introduction (Dobrev et al., 2006). The effects of all our independent variables remained robust after adding this variable to our model.
Extended Cox model including robustness checks predicting local UberX introduction.
GDP: gross domestic product; GaWC: Globalization and World Cities.
Standard errors in parentheses, reported effects are hazard ratios (exponent of the coefficient).
p < 0.05; **p < 0.01; ***p < 0.001.
In Model R2 we include country dummies for countries with at least five cities in the dataset, to control for any unobserved country differences. This meant that we had to exclude the country-level institutional variables. The likelihood-ratio test shows that this model is an improvement compared to Model R1, meaning that a model containing country dummies captures additional heterogeneity compared to a model that merely contains the country-specific institutional variables. After adding these dummies, all of our network exposure variables remained virtually unchanged in both significance and effect sizes.
One might argue that the entry of UberX in cities where Uber Black is already active is not a true UberX entry, as Uber had already established a brand name and user base on the ground. Hence, in Models R3 and R4, we reran the analysis of R1 and R2 only for cities that had not seen a prior Uber Black introduction. This limited our analysis to 4079 cities with 464 UberX introductions. While our network exposure variables also proved to be robust in this analysis, there were some changes in the effects of our formal institutions in R3 compared to R1. In contrast to Model R1, the influence of economic stakeholders and the employment contract protection showed significant effects again, as was also the case in the earlier models in Table 3.
Conditional logit model
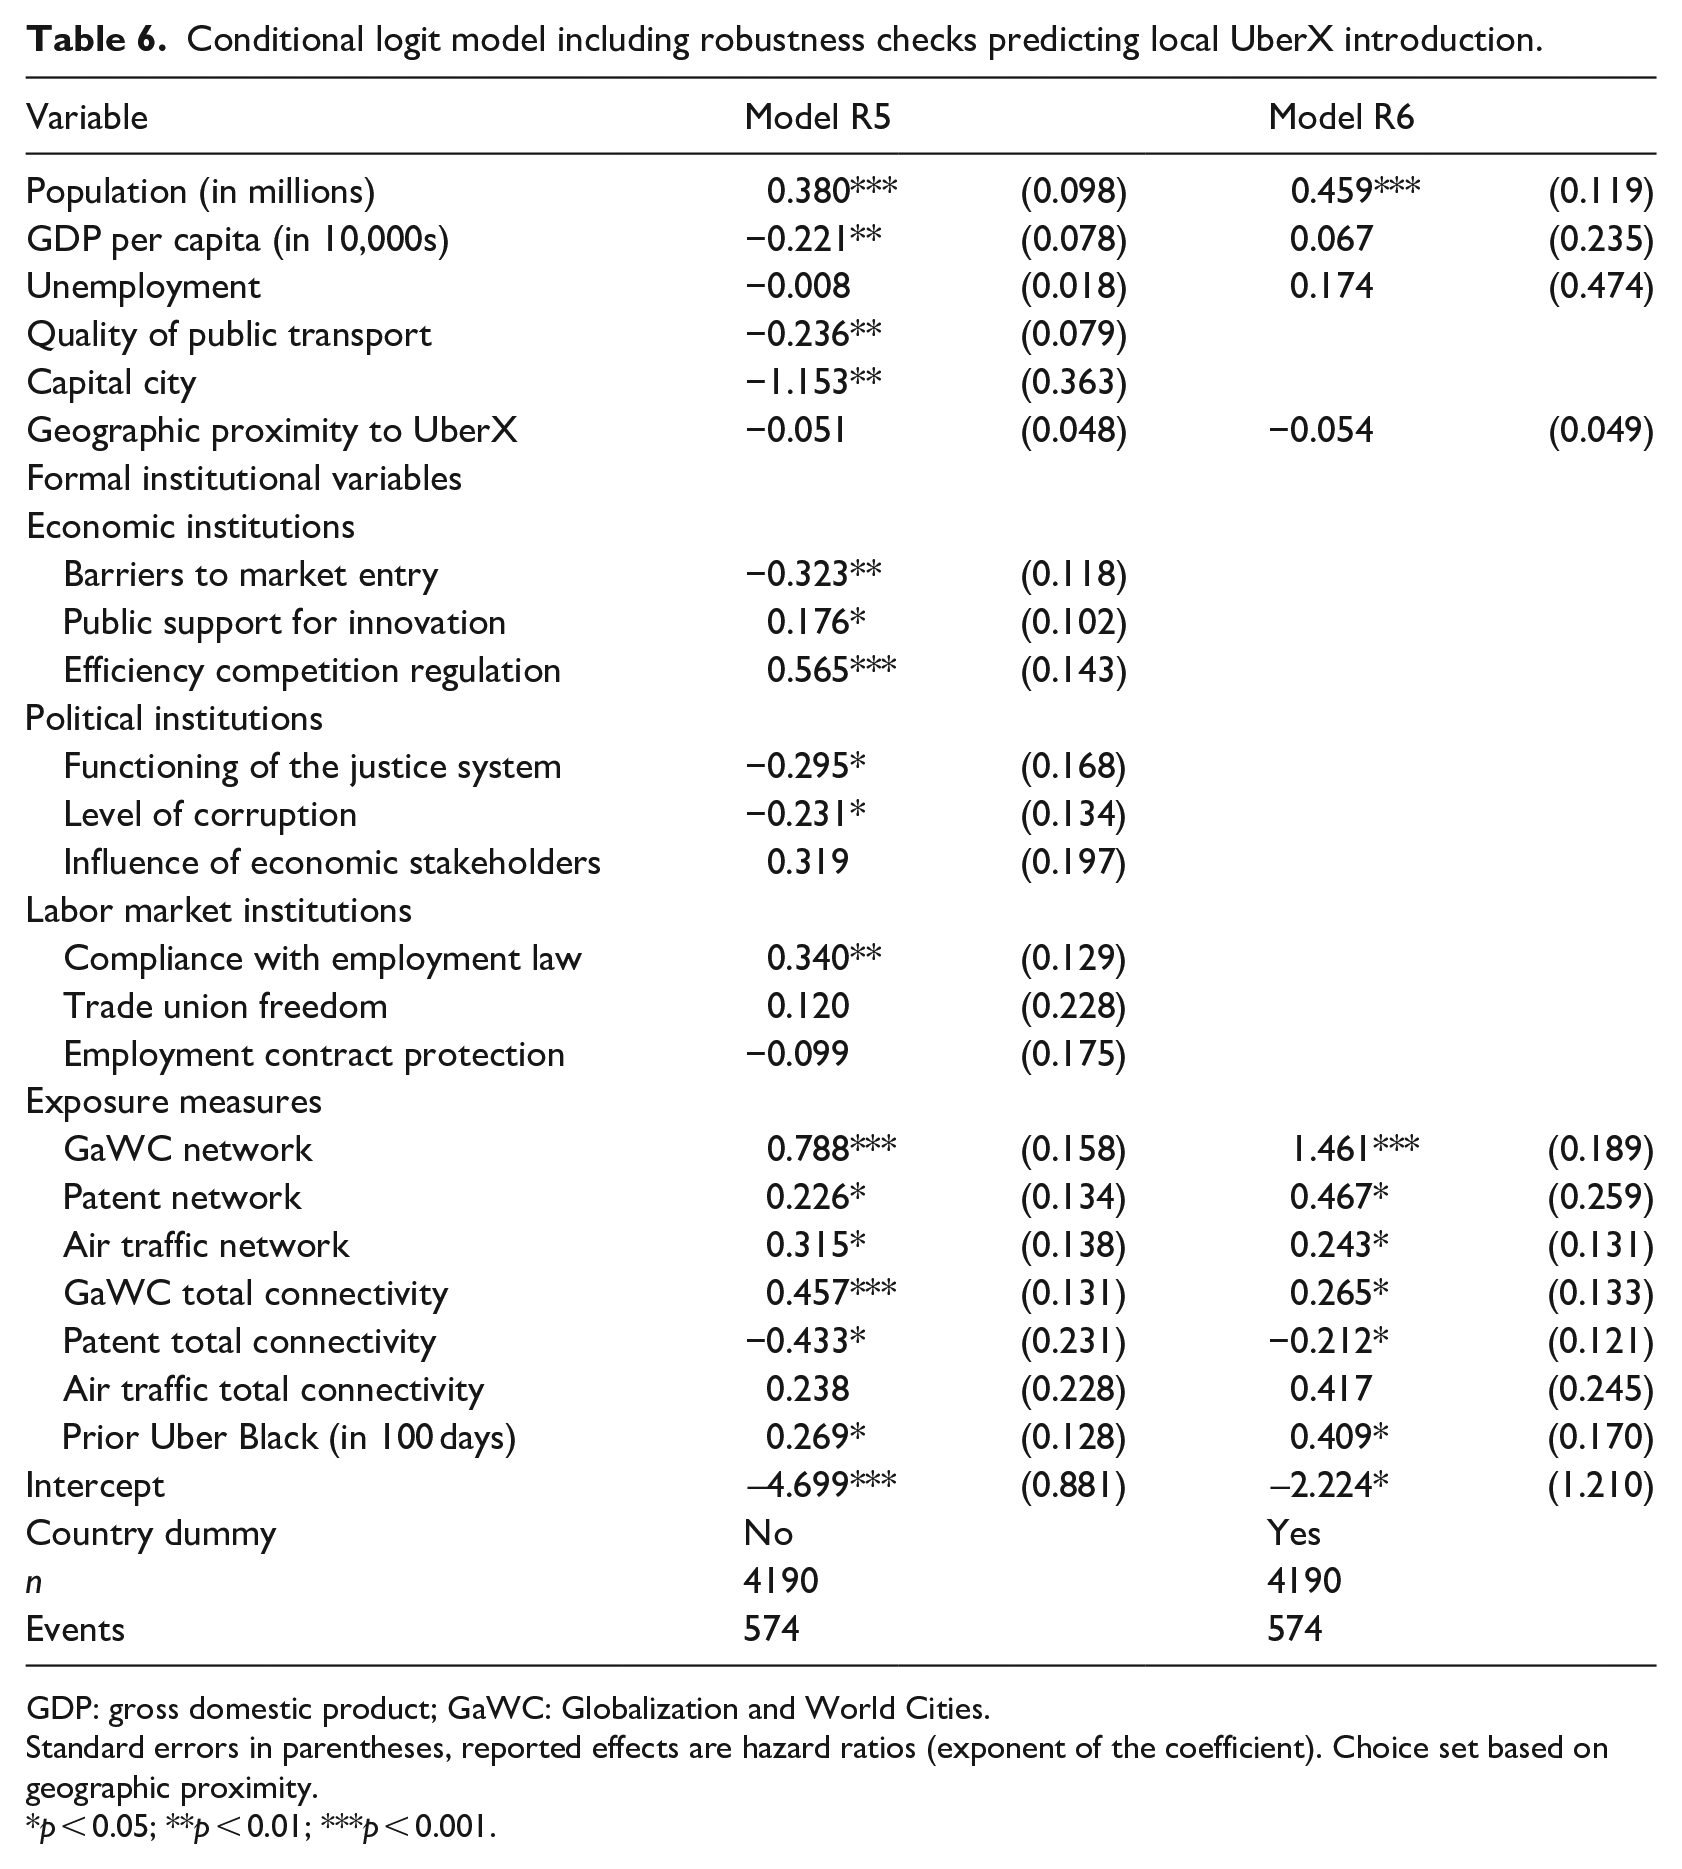
We also used an alternative estimation strategy using a conditional logit model. This model estimates the conditional probability that a city is selected from a set of alternative cities with similar attributes, and is regularly used to model MNE’s location choices (Belderbos et al., 2011; Li et al., 2019; Tan and Meyer, 2011). By constructing choice sets of a selected city and alternative non-selected cities that share the same attributes, part of the variance in these models is conditioned out of the model (Li et al., 2019). The variance in this model is then limited to attributes within the choice set that vary between cities. For each UberX introduction (n = 574) possible alternative choices were defined by a choice set that included the five most proximate cities where UberX had not been introduced at that point in time. As such, we constructed a sample of 3444 cities (574 × 6), in which cities could be included multiple times as long as they had not had an UberX introduction and were among the five most proximate cities to the city where UberX had been introduced at that point in time. We estimated this conditional logit using the survival package in R, and parameters were estimated using the maximum likelihood method. Table 6 presents the two conditional logit models including our robustness checks. We found that using a conditional logit model, instead of an extended Cox model, provided us with very similar results and did not change any of the conclusions regarding our hypotheses.
Conditional logit model including robustness checks predicting local UberX introduction.
GDP: gross domestic product; GaWC: Globalization and World Cities.
Standard errors in parentheses, reported effects are hazard ratios (exponent of the coefficient). Choice set based on geographic proximity.
p < 0.05; **p < 0.01; ***p < 0.001.
Post hoc analysis
Our results yielded some significant results that ran counter to some of our hypotheses. While Hypotheses 1 and 4 were confirmed, we could only partially confirm Hypothesis 2 regarding political institutions and Hypothesis 3 regarding labor market institutions. For the political institutions, only the corruption variable showed the expected effect, and for the labor market institutions, only the employment contract protection variable showed the expected effect. Thus, while the economic institutions seemed to have a straightforward effect on Uber’s location decision, the associations with political institutions and labor market institutions might be more complex. We ran three post hoc analyses to explore the effects of the latter two sets of institutions.
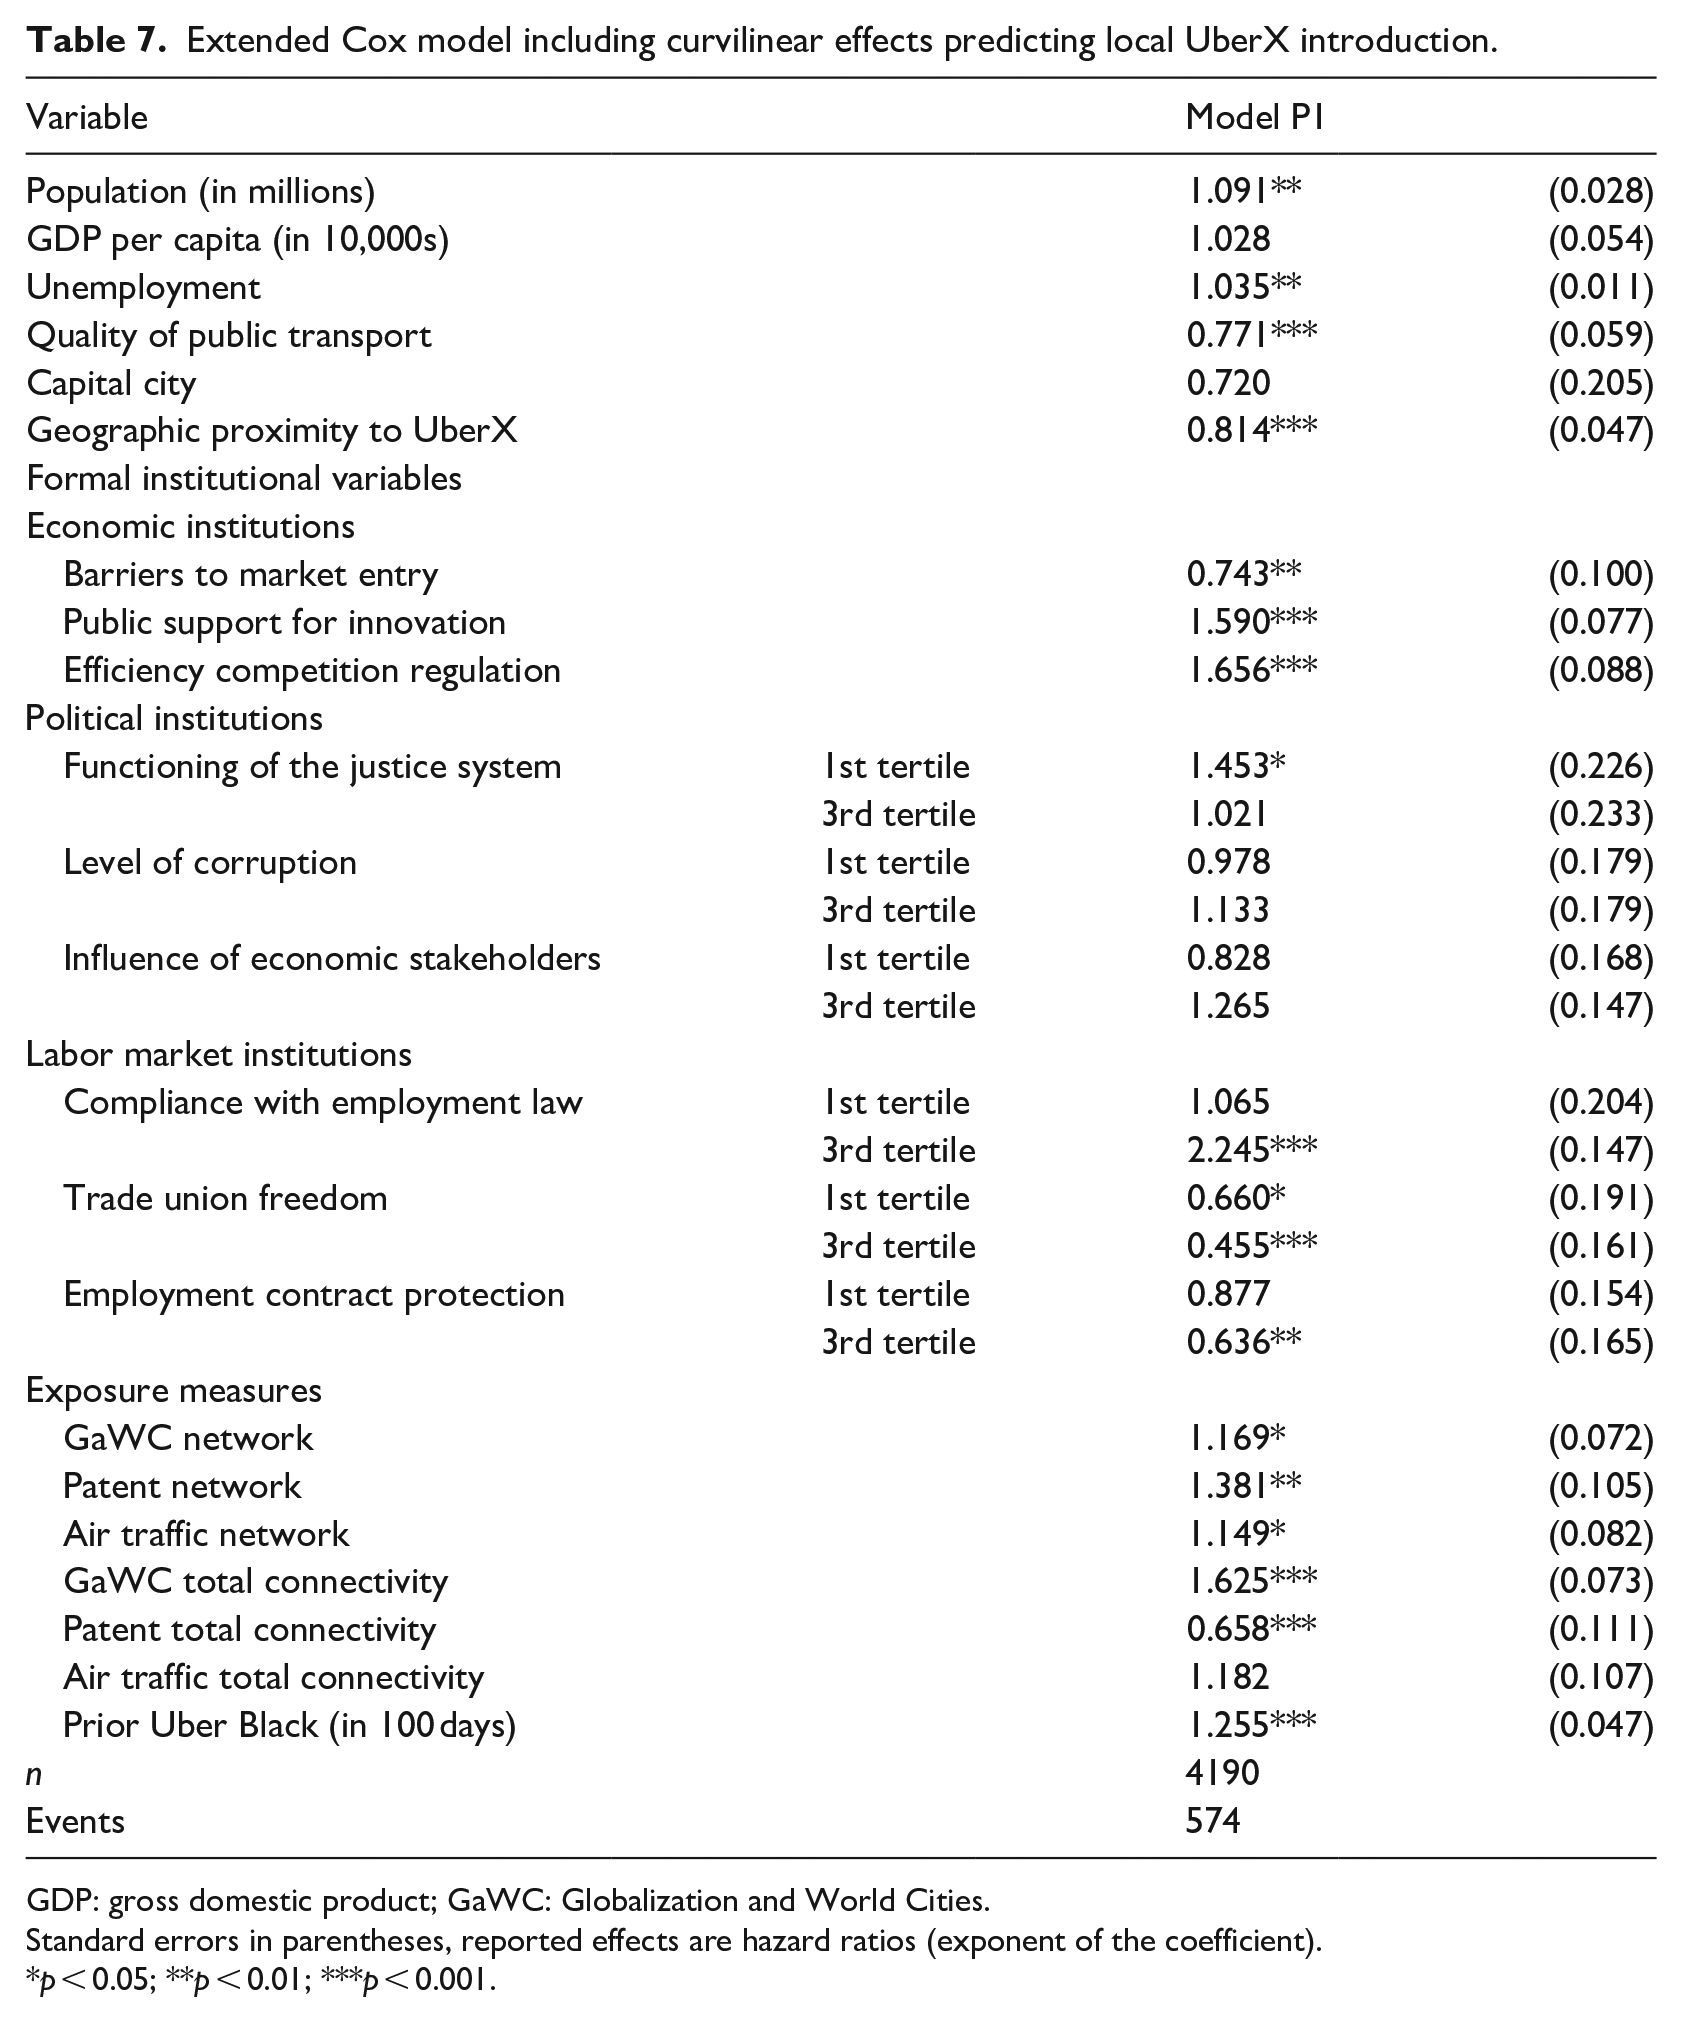
Our first post hoc analysis tested whether location choice was affected by institutions in a curvilinear fashion. 7 For the political institutions, one could expect that Uber might sometimes favor political institutions that are weaker at enforcing sectoral regulations and more sensitive to the lobby of the platform when asking for adjusted pro-platform regulations (Uzunca et al., 2018). However, in locations where political institutions are weakest, problems with local governments might outweigh the possible leeway in sectoral regulations. Similarly, for the labor market institutions, platforms might prefer cities where labor market institutions are more lenient, but also avoid locations where labor market institutions are weakest. Model P1 in Table 7 includes our political and labor market institutions as dummy variables. We split the original variables on the tertiles of the number of observations and created three equally sized groups: weak (1st tertile), moderate (as reference) and strong institutions (3rd tertile).
Extended Cox model including curvilinear effects predicting local UberX introduction.
GDP: gross domestic product; GaWC: Globalization and World Cities.
Standard errors in parentheses, reported effects are hazard ratios (exponent of the coefficient).
p < 0.05; **p < 0.01; ***p < 0.001.
As Table 7 shows, most other variables in Model P1 remained unchanged compared to earlier models. Considering the political institutions, the tertile dummies showed no evidence of curvilinear effects. Labor market institutions showed signs of a curvilinear relation, of which the freedom of trade unions turned out to be significant. This effect showed that Uber tends to avoid locations where freedom of trade unions is either relatively strong or relatively weak. Furthermore, the significant negative effect for the third tertile of the employment contract protection variable indicated that Uber tends to avoid locations where employment contract protection is the strongest. While these two results show some support for Hypothesis 3, the strong positive effect for locations with the strongest compliance with employment law remains and goes counter to the formulated hypothesis.
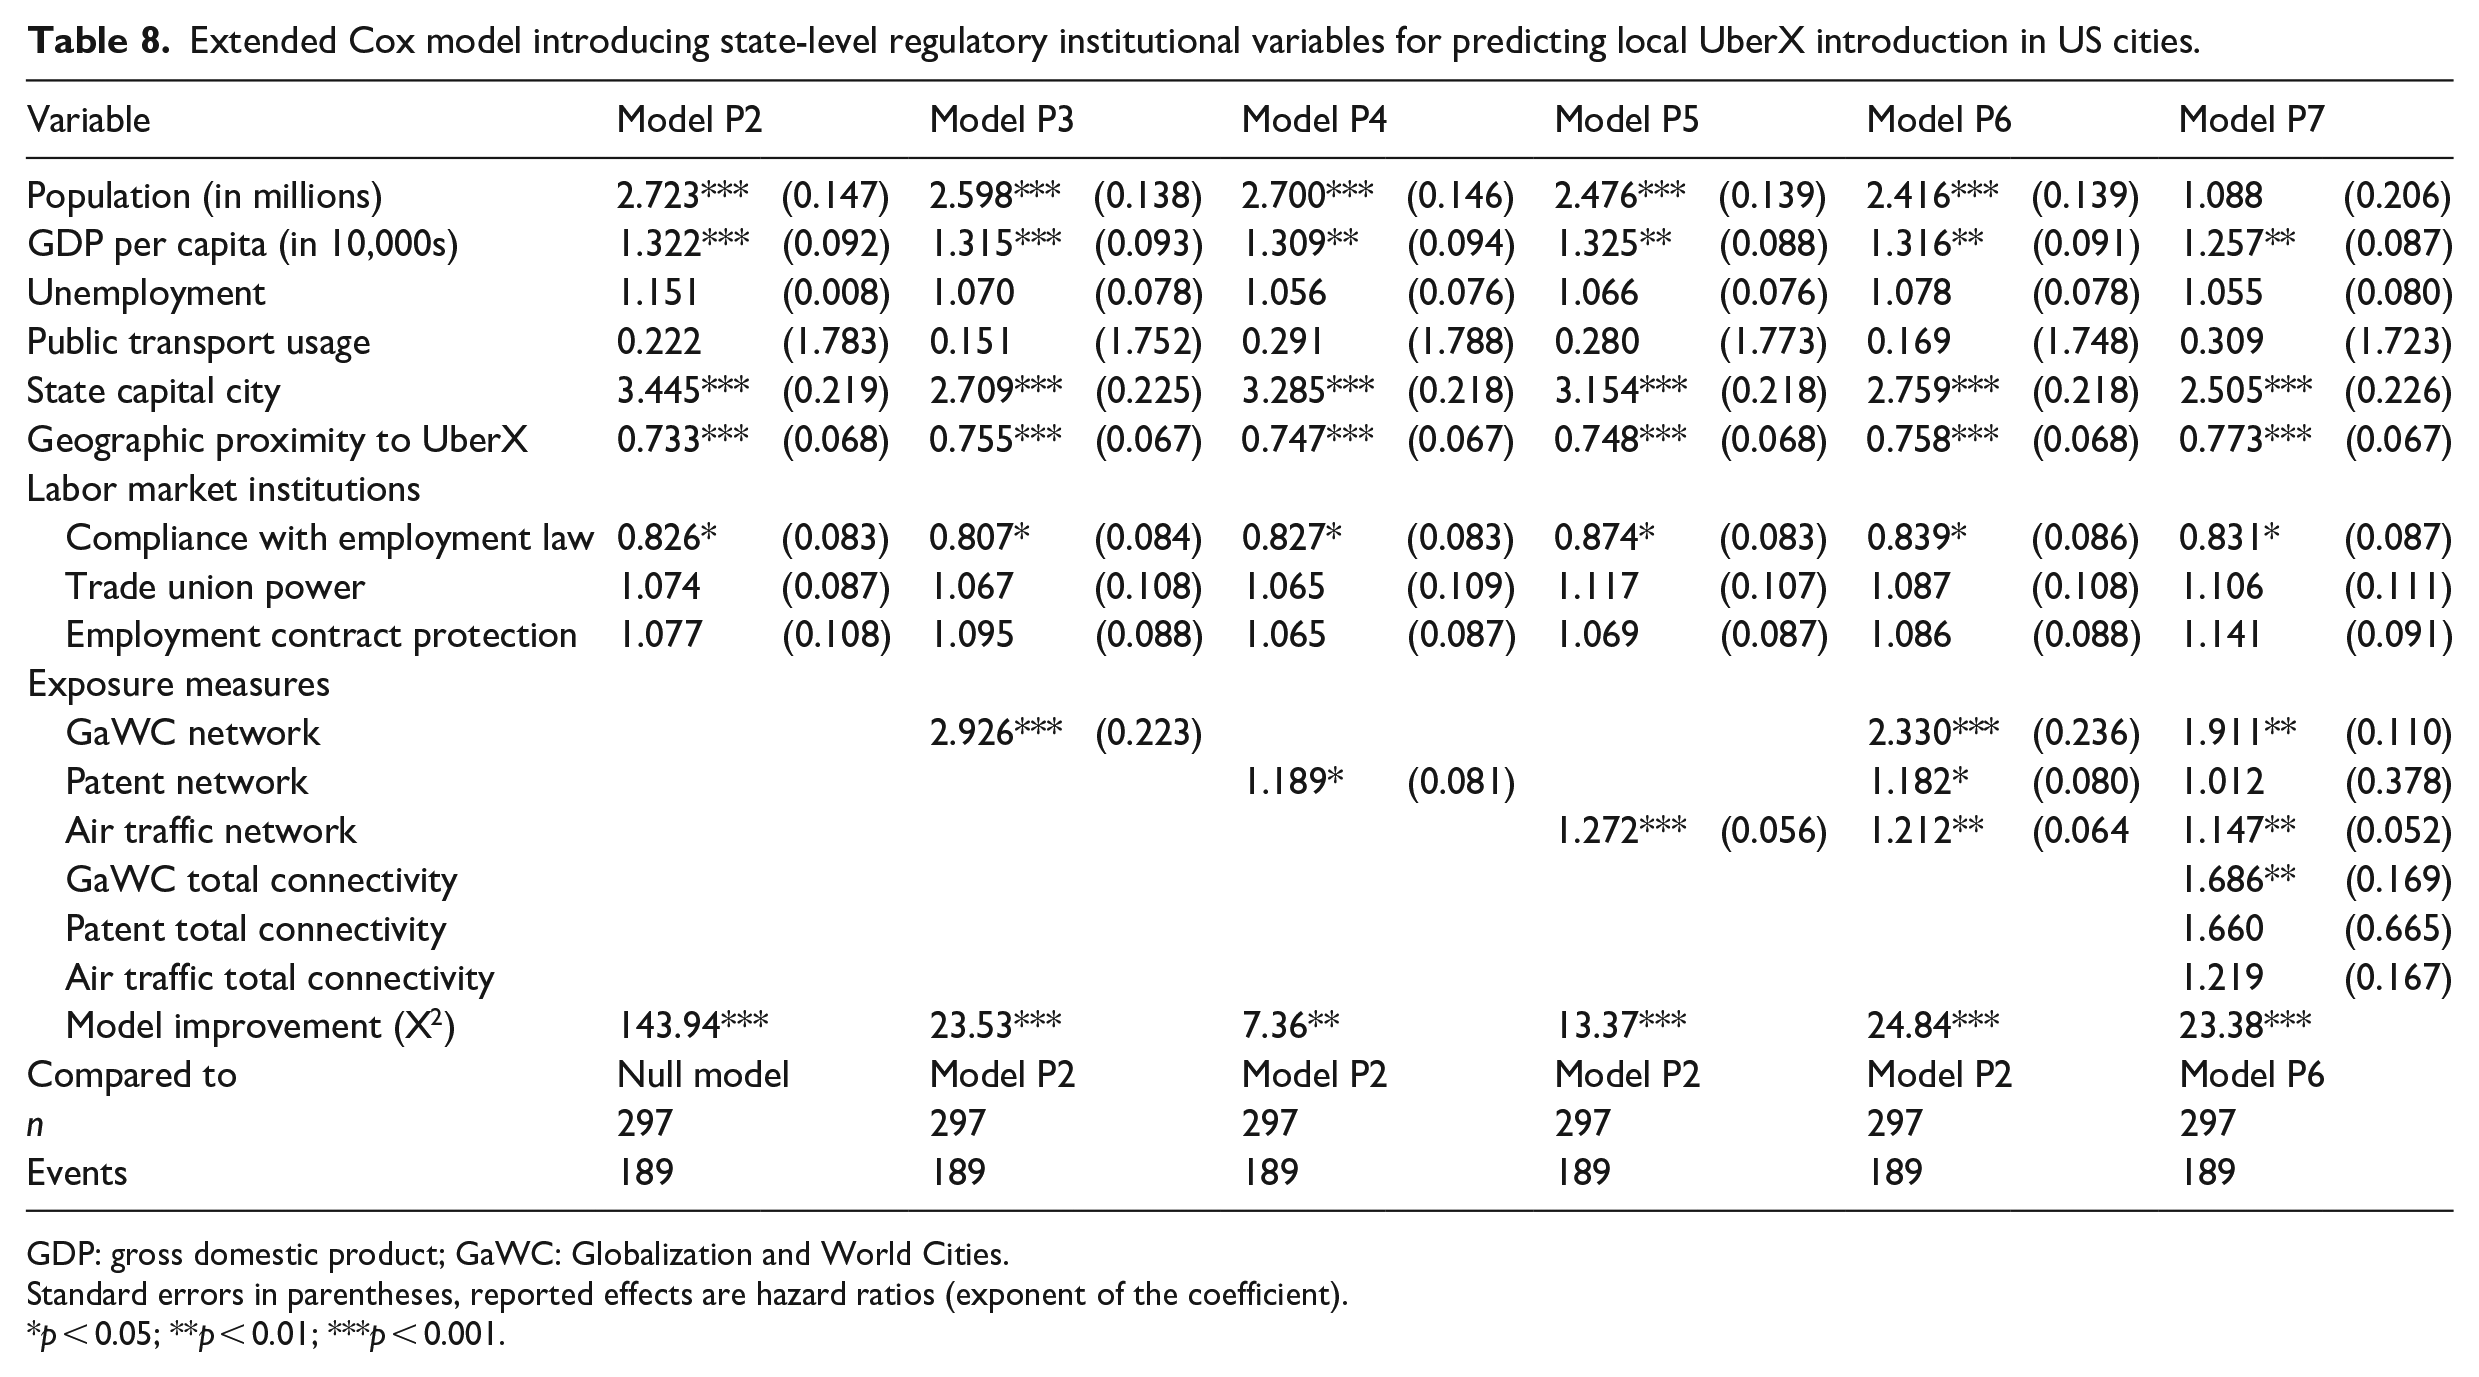
In order to address the mixed findings regarding labor market institutions, our second post hoc analysis tested the effects of state-level labor market institutions for US cities only. Because many of the local introductions of UberX were in the United States (see Table A1 in Appendix 1), the unexpected finding that Uber preferred locations with high employment law compliance may well be driven by the high number of cases of US cities given that the United States—as a country—has a high compliance rate when compared to other countries. Measuring institutional conditions at the national level, however, hides the state-level heterogeneity within the United States that could still affect the order of local introduction across the country.
We thus collected data for US states on labor market institutions. To measure the power of unions across states we used data by the US Bureau of Labor Statistics (BLS) on the rate of employed that are represented by a union. 8 To measure employment contract protection, we looked at at-will employment and common law exceptions to at-will presumption per state. In almost all US states, employment relationships are presumed “at-will,” meaning that employers can terminate employment contracts at any time and for any legal reason. However, states vary in the extent to which they recognize one of the three major exceptions to at-will employment (public policy exception, implied-contract exception, and covenant of good faith and fair dealing) (Muhl, 2001). We used the number of exceptions as an indicator of employment contract protection, meaning that the more exceptions that were included, the higher the employment contract protection in a state. 9 Finally, we used enforcement data by the Wage and Hour Division (WHD) of the US Department of Labor to measure compliance with the employment law per state. To construct this measure, we counted the number of yearly violations of labor standards per state as found by the WHD. 10 We normalized all variables on a scale from 0 to 4, in order to make them comparable to the labor market institutions as measured in Models 1–10. Furthermore, for consistency, we reversed the scale for the variable measuring the number of labor law violations in order to measure compliance rather than noncompliance. Finally, we also included control variables similar to the ones in our original analysis. The control variables for GDP per capita, unemployment and capital cities were measured in the same way as for the original analysis, but now at the US state level. We measured state-level unemployment in percentages by using data by the BLS to measure unemployment. 11 We captured state-level GDP per capita in US dollars by using data by the US Census Bureau and the US Bureau of Economic Analysis to measure the GDP per capita. 12 For the control variable on the quality of public transport at the country level, we introduced an indicator on the usage of the public transport on the state level, by using data by the Bureau of Transportation Statistics to measure the percentage of commuters using public transport. 13 Finally, the controls for population and geographic proximity of prior UberX entry were unchanged compared to the original analysis.
Table 8 shows the results of this analysis for US cities. For most of our independent and control variables, the results are very similar to Models 1–10. However, for the labor market institutions we found a different effect for employment law compliance. In contrast to the results of our earlier models on worldwide introductions, which showed a significant positive effect, these models showed a significant negative effect for employment law compliance. This means that, in the United States, Uber preferred locations where compliance with the employment law was lower, confirming Hypothesis 3. Uber’s decisions, later on, to enter other countries with high levels of compliance with employment law may have stemmed from the little resistance they had met from labor unions in the United States in the period of study (Thelen, 2018). Indeed, Uber’s entry in high-compliance countries such as the Netherlands, Sweden, and the United Kingdom did not invoke legal issues in the first years of its operation (Pelzer et al., 2019; Thelen, 2018; Uzunca et al., 2018). With the benefit of hindsight, we can now conclude that Uber likely underestimated the backlash by employment law enforcement that would eventually unfold in Europe regarding the alleged misclassification of their drivers as independent contractors (Cornelissen and Cholakova, 2019; Garud et al., 2020).
Extended Cox model introducing state-level regulatory institutional variables for predicting local UberX introduction in US cities.
GDP: gross domestic product; GaWC: Globalization and World Cities.
Standard errors in parentheses, reported effects are hazard ratios (exponent of the coefficient).
p < 0.05; **p < 0.01; ***p < 0.001.
Our third post hoc analysis tested whether there are interaction effects between the legitimacy carried by mobile customers and the political and labor market institutions. In general, scholars studying “institutional voids” have argued that when formal institutions are weak, that void can be filled by informal institutions (Khanna and Palepu, 1997; Mair et al., 2012). In our context, this could mean that in locations that lack formal institutions supporting innovative entry, MNEs may rely more on legitimacy developed informally in local networks and communities (Li et al., 2019; Puffer et al., 2009). Furthermore, earlier research suggests that platforms can effectively operate in countries that are politically unstable, since their decentralized crowd-based rating systems solve problems with information asymmetry that are characteristic of markets that lack effective governmental regulation (Ozimek, 2014; Uzunca et al., 2018).
To test whether there were any interactions between our network exposure variables and our political or labor market institutions, we first constructed one composite variable capturing a city’s exposure to Uber’s customer base. Because our three network exposure measures are all on a scale from 0 to 10, we added up the three values for each city to obtain a single network exposure measure ranging from 0 to 30. When this measure was entered in Model 10 (Table 4), instead of the three separate network exposure variables, it yielded a hazard ratio of 1.238 (p < 0.001), similar to our three separate network measures. Subsequently, we created four groups of cities, allocating cities that have any exposure into tertiles, and using cities without any network exposure as a reference category. We then interacted general exposure with the political and labor market institutions to analyze whether the effect of political and labor market institutions depended on levels of exposure.
Figure 1 presents the hazard ratios for the political institutions by UberX exposure group, when they are added to Model 10. As can be seen in the top panel, the main effect for the functioning in the justice system turns positive (1.319), meaning that for cities without network exposure to UberX, a functioning justice system had a positive effect on location decision. And, indeed, the interaction terms for the last two tertiles are significant and increasingly negative (0.707 and 0.477, respectively), meaning that the higher the network exposure to UberX, the less important a functioning justice system was for Uber’s location decision in the time period under investigation. When we look at the middle panel, we find a similar pattern for corruption. The main effect is negative and significant (0.584), meaning that in cities without network exposure, corruption had a negative effect on location decision. The interaction terms were all significant and positive, which indicates that the higher the network exposure in a city, the less important the negative effect of corruption was for location decision. The bottom panel shows that for the influence of economic stakeholders there were no clear and significant main and interaction effects.
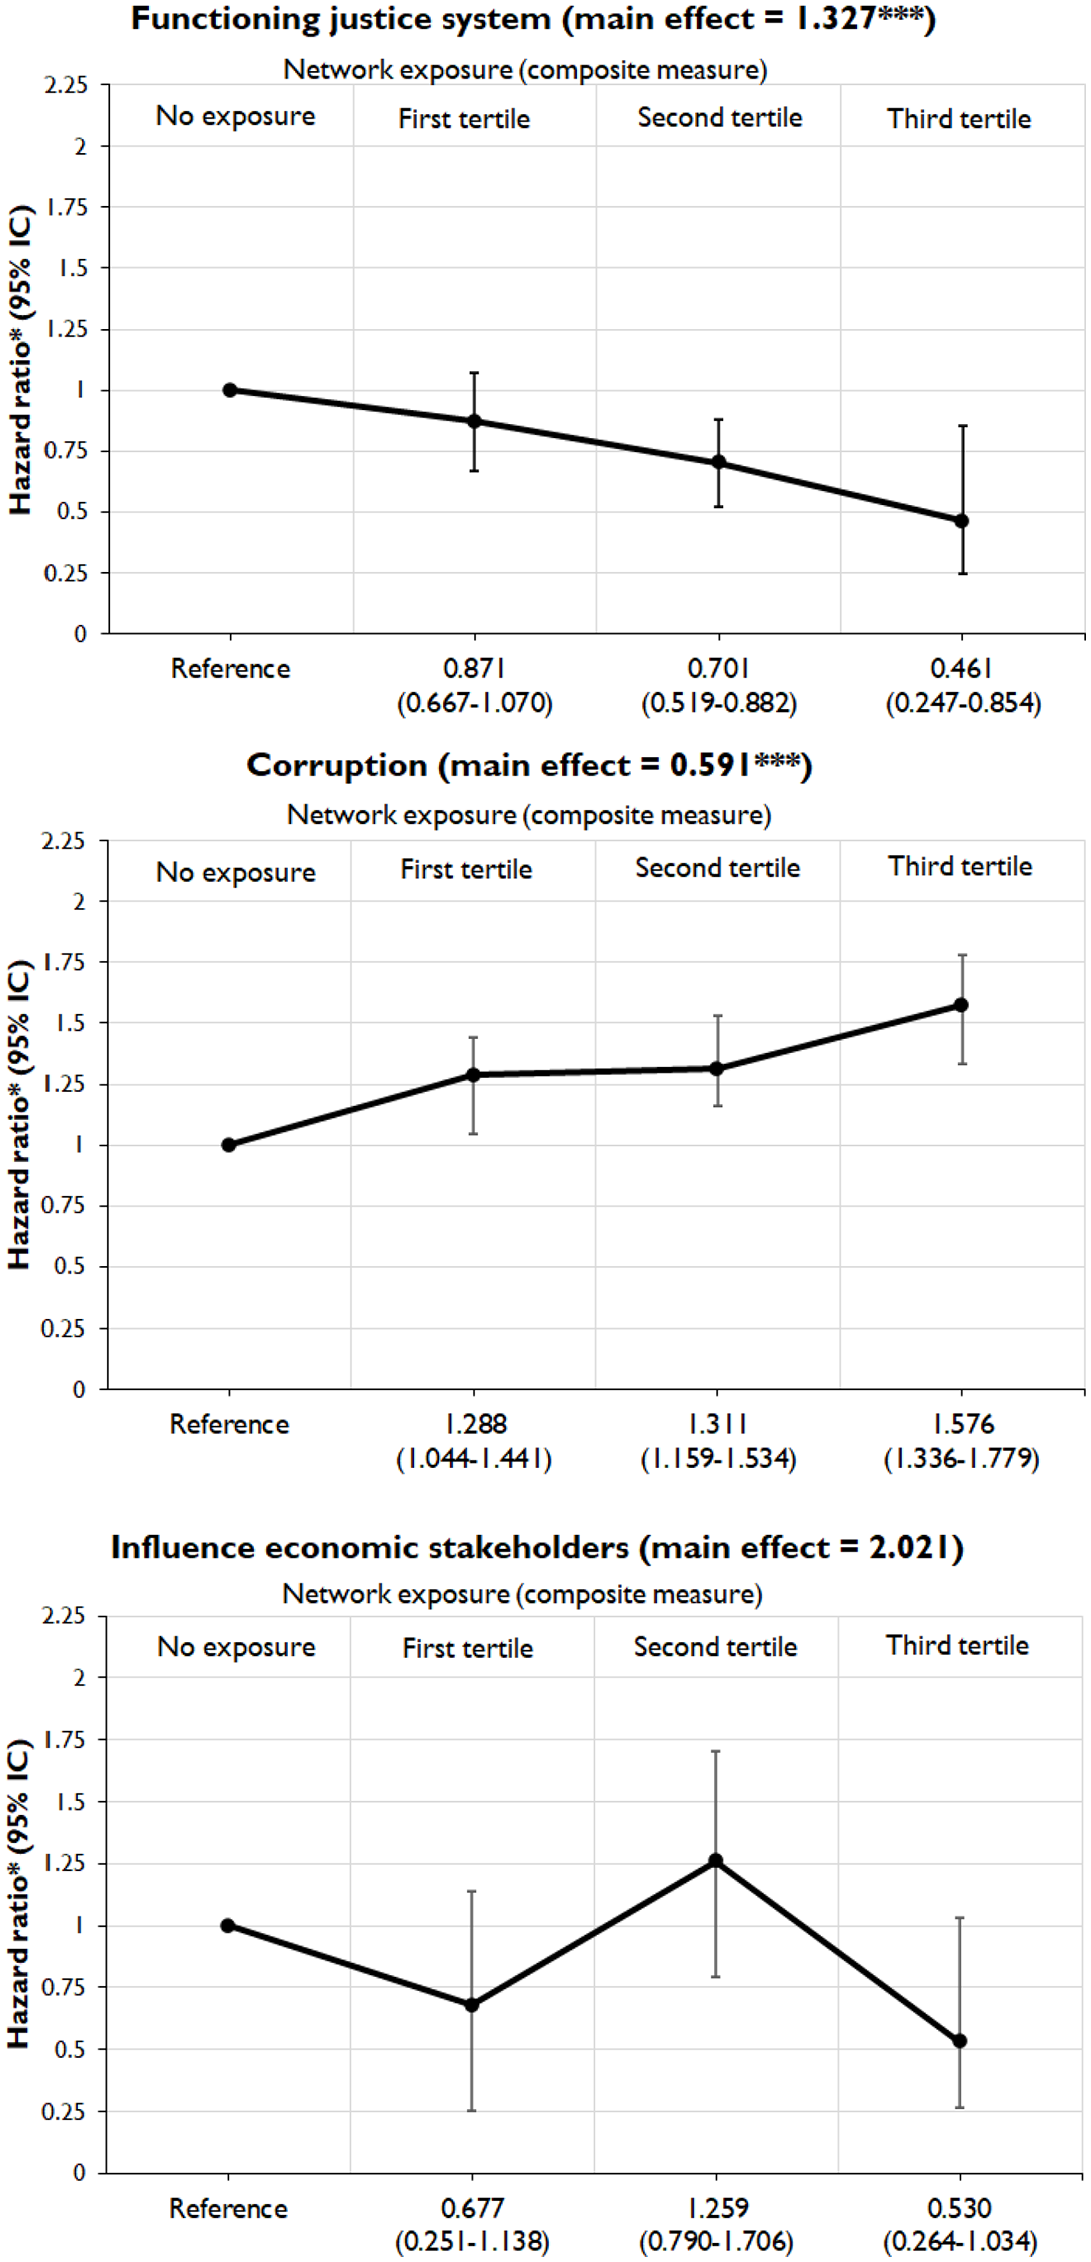
Adjusted hazard ratios for interaction effects between political institutions and total exposure to informal institutions. Hazard ratios adjusted for variables from Model 10.
The interaction effects showed that the effects of the functioning of the justice system and corruption were not as straightforward as we might expect. We know that platforms are mostly driven by market share and first-mover advantage despite possible issues with local regulators or governments (Parente et al., 2018) and a way to overcome the problems with these issues might be to rely more heavily on informal institutions present at the guest location.
Figure 2 presents the hazard ratios for the labor market institutions by traveler exposure group, when added to Model 10. Our three variables on labor market institutions barely showed any significant effects. As such, we must conclude that there was no interaction effect between labor market institutions and our informal institutions.
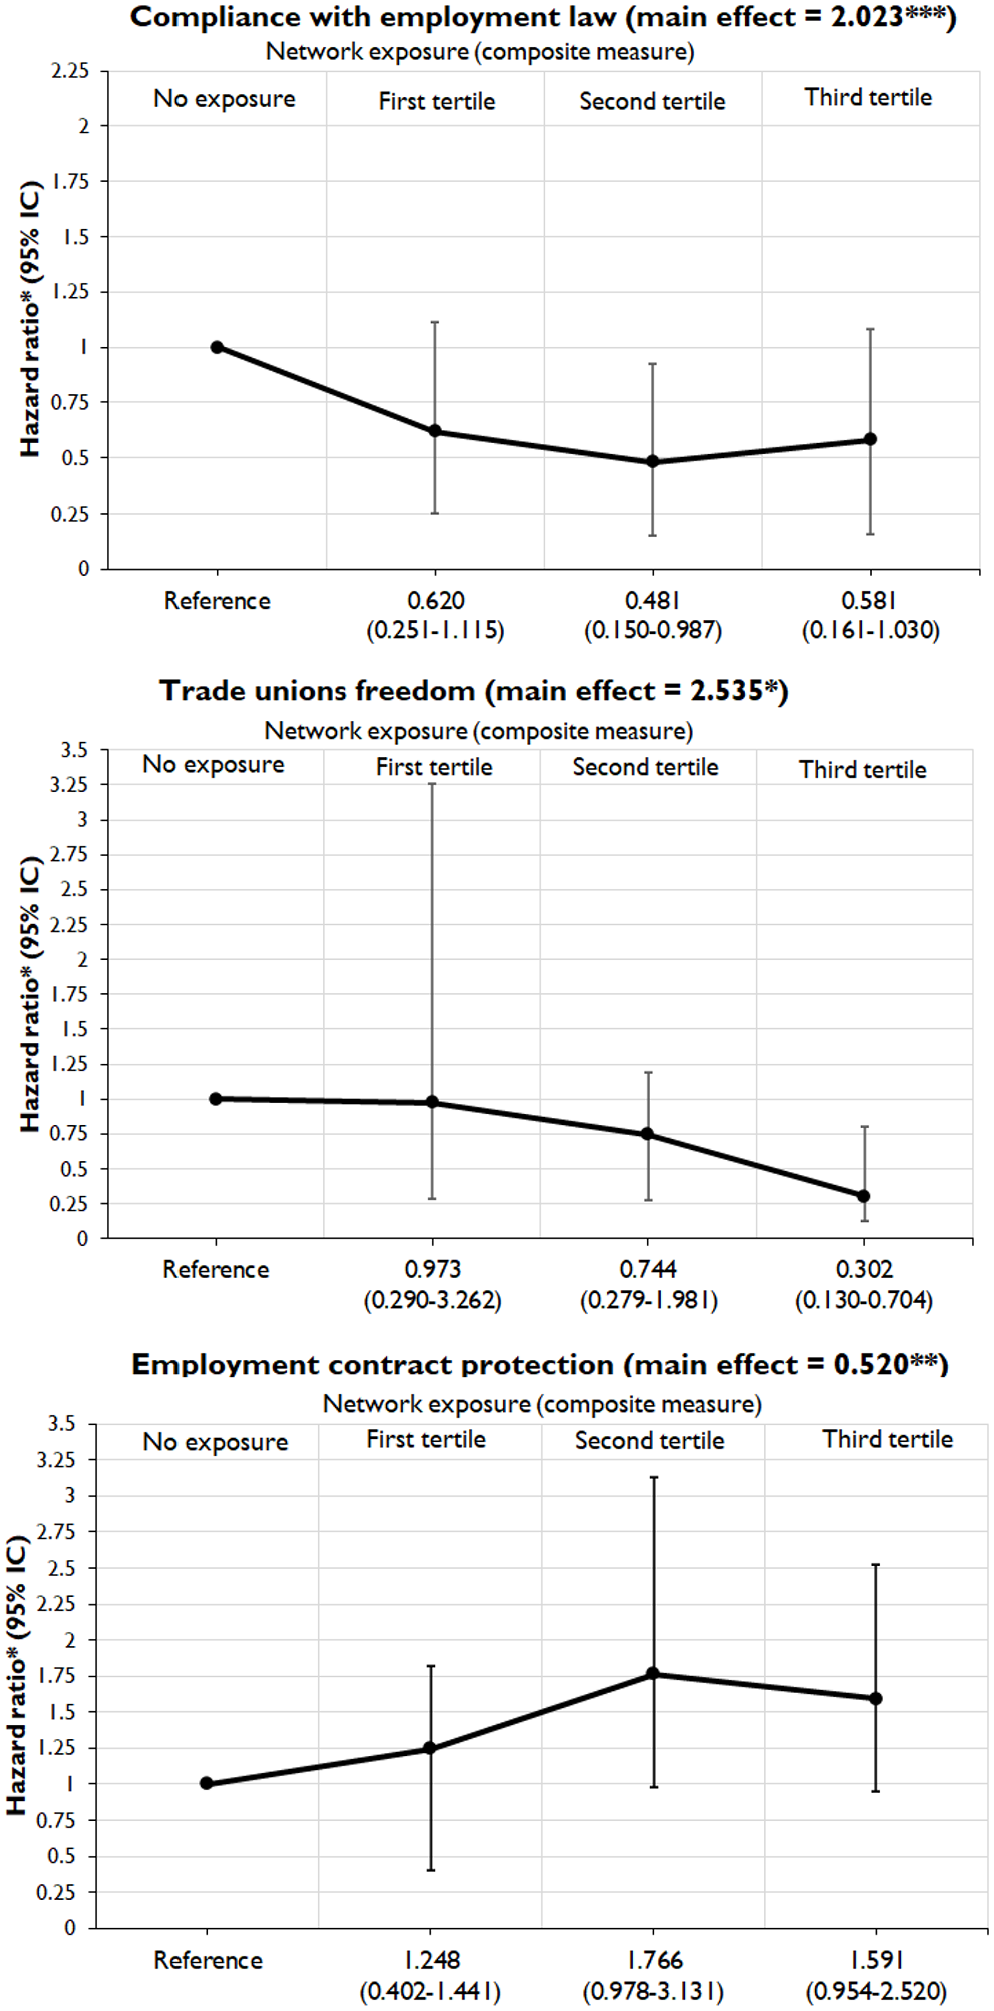
Adjusted hazard ratios for interaction effects between labor market institutions and total exposure to informal institutions. Hazard ratios adjusted for variables from Model 10.
The results thus suggest that platforms, casu quo Uber, may prefer locations with strong political institutions in cities with few international visitors familiar with their service, but also locations with weak political institutions provided that these locations are exposed to many international visitors who already used their service elsewhere. This pattern further underlines the role that international visitors play as carriers of legitimacy as their support is shown to be especially pivotal in locations with weak political institutions. It speaks to prior location choice research that found trusted communities to substitute weak formal institutions. However, where these studies looked at ethnic communities fostering new norms and institutions (Li et al., 2019; Portes and Sensenbrenner, 1993), the key role of mobile users in the case of Uber would suggest that the relevant global community consists of the early adopters in each country.
Political elites are part of this global community, as they are among the first exposed to word-of-mouth recommendations: not only do political elites host many foreign visitors, they themselves are globally mobile and thus likely to experience Uber’s service firsthand abroad. In this respect, political elites are most probably among the first to be exposed to word-of-mouth recommendation by visitors, as members of national elites. The global orientation of national elites is known to be especially pertinent in countries with weak institutions, which tend to rely on multinational services and to send their elite youngsters abroad for high-quality education. Thus, even if our hypothesis was that Uber would not be attracted to countries with weak institutions whose political elites may defend the vested interests of taxi drivers, these elite actors may still be drawn to supporting Uber to the extent that they are in contact with their international peers exerting isomorphic pressures (Zald and Lounsbury, 2010). In this respect, the legitimacy Uber gained with national elites would count as an example of what Meyer et al. (1997: 144–145) have called “worldwide models constructed and propagated through cultural and associational processes” by members of global networks making up a “world society.” Thus, countries with weaker institutions may be more susceptible to emerging institutions diffusing globally, while countries with stronger institutions may focus more on domestic bureaucratic procedures and political processes (Cole, 2017).
Summary and limitations
In this article we use an institutional lens to further our understanding of the location choices of platform companies that introduce location-bound services. As platform companies generally meet institutional resistance in the host locations they enter (Mair and Reischauer, 2017; Thelen, 2018; Uzunca et al., 2018), we studied institutional factors and global legitimacy spillovers that affect the location choices of Uber. The main novel finding we present holds that Uber follows their globally mobile customer base, which functions as a “trusted community” in the locations they visit. We argue that international visitors are already familiar with the platform’s service and, as such, share particular codes of conduct and norms with the platform company and facilitate economic exchange in potential locations around the world. Our findings on global legitimacy spillover enhance our understanding of the institutional complexities that MNEs face by being present in multiple geographic fields (Kostova and Zaheer, 1999), highlighting the key role of mobile customers as carriers of legitimacy in this diffusion process.
Furthermore, we present robust evidence of the effect of formal institutions on location decisions, by showing that Uber is attracted to locations with pro-market institutions that stimulate competition and innovation. We found, however, only partial evidence substantiating the hypotheses that Uber is drawn to locations with strong political institutions and weak labor institutions. Yet, countries with weak political institutions are nevertheless attractive to Uber if they are exposed to many international visitors already familiar with Uber. This suggests that Uber expects political elites in such countries to side with their international peers who promote Uber during visits, thus exerting isomorphic pressures (Zald and Lounsbury, 2010).
It is important to highlight some limitations of our study. One is our exclusive focus on market entry, without considering exit. Following Jain et al. (2016), we treat a location choice as an MNE’s a priori evaluation—the MNE’s belief that it can deploy its resources successfully in a host location. A follow-up study to examine where Uber and other platforms fail to continue to operate would supplement our analysis. 14
Second, we measured economic, political and labor market regulations at the national level, and our customer following variable measured these at the local level. Indeed, economic, political and labor market institutions are predominantly codified at the level of nation states (Hall and Soskice, 2001). And on top of any prevailing national regulations, some platform companies may also face local regulations (Tzur, 2019). Our post hoc analysis at the US state level also provides evidence that state-level regulations played a role, by showing that Uber was more likely to enter sites with lower levels of employment protection. Future empirical studies on platform companies may focus on collecting local institutional variables from more countries to supplement the national variables.
Finally, while our focus has been on platform businesses, and more specifically a location-bound platform business model, the scope of our findings could be extended to other industries. For example, the banking industry is also characterized by global customers and able to follow its clients through their expense patterns abroad (Esperanca and Gulamhussen, 2001). As such, future research could test to what extent global banking customers can function as trusted communities supporting the entry of multinational bank in new markets.
Discussion
Our study answers to recent calls to scrutinize the internationalization patterns of platform companies (Nambisan et al., 2019; Parente et al., 2018; Stallkamp and Schotter, 2021). Our main contribution is to view platform businesses as a new type of born-global startups with distinct features and internationalization logics. Early theorizing puts forward that born globals will typically provide niche products, possess local market knowledge and leverage local business partnership to complement their own competences (Knight and Cavusgil, 2004; Madsen and Servais, 1997). Platform companies, however, do not fit this theory, as they tend to be active in mass, mundane service markets, and enter markets with ease—users on both sides of the market (providers and clients) simply download their app—with very little understanding of local environments, and typically no local business partners. As they make their location decisions, we argue that platform companies can leverage their existing, internationally mobile customer base not just as prospective clients in new locations, but as advocates of the new service through word-of-mouth recommendation. In this way, platform companies can compensate for their own limited market knowledge and marketing resources as well as their initial lack of legitimacy in host locations.
Our findings are in line with previous studies on MNEs, which have argued that local communities can play important roles as trusted communities by providing informal institutional contexts which facilitate economic exchange through shared social norms and codes of conduct. However, these studies tend to focus on the presence of ethnic groups and same-country MNEs (Li et al., 2019; Portes and Sensenbrenner, 1993; Tan and Meyer, 2011), with one study showing that home-country customer following had limited success outside of providing services to co-ethnic communities in host locations (Jia et al., 2018). We study a more dynamic, mobile form of customer following, by extending the notion of trusted community to include existing customers of an MNE who travel internationally. While this practice typically applies to platform business models, who can follow existing customers through GPS-based mobile applications, previous studies on multinational bank expansion have also emphasized the importance of non-corporate customer following (Esperanca and Gulamhussen, 2001; Gulamhussen et al., 2016). However, the analyses in these works are usually restricted to immigrants and non-citizen permanent residents (Chou and Shen, 2014). In contrast, our study recasts internationally mobile customers as carriers of legitimacy.
Our article also adds to the understanding of the diffusion of innovations introduced by companies that face controversy from the day of founding, common to platform businesses. While the diffusion of legitimacy has received plenty of academic attention in management studies, a puzzle that remains is how some innovations spread without much legitimacy. Colyvas and Jonsson (2011) have argued that “many activities diffuse widely but are not regarded as legitimate” and that very little research “tackled the spread and depth of these types of behaviors” (p. 30). MNEs should understand that legitimacy does not solely stem from local audiences and regulators, but also depends on endogenous processes of legitimization stemming from their audience’s firsthand observations and word-of-mouth, plus the role of vanguard audiences. Accordingly, MNEs’ marketing efforts can leverage these mechanisms by mobilizing their mobile user base—and the ensemble of their personal networks—in word-of-mouth and online referral marketing programs.
For policymakers, our findings on the role of mobile customers suggest that it is difficult to steer local legitimization processes that are heavily influenced by mobile actors. From a public policy point of view, it may be important for cities to join forces with other cities affected by platforms to exchange information and experience and possibly even engage in joint negotiations with global platforms. In this way, public interests shared by cities around the world can be safeguarded more effectively. At the same time, a process of institutional isomorphism may emerge, resulting in joint regulations and standardization that may also bring benefits to platforms and their users.
Footnotes
Appendix
Descriptive statistics of the number of cities with UberX per country.
| Country | n | Total | % | UberX introductions | |||||
|---|---|---|---|---|---|---|---|---|---|
| 2012 | 2013 | 2014 | 2015 | 2016 | 2017 a | ||||
| North America | 575 | 243 | 42.3 | 3 | 20 | 122 | 64 | 33 | 1 |
| Canada | 53 | 17 | 32.1 | 0 | 0 | 6 | 10 | 1 | 0 |
| Costa Rica | 1 | 1 | 100.0 | 0 | 0 | 0 | 1 | 0 | 0 |
| Dominican Republic | 13 | 2 | 15.4 | 0 | 0 | 0 | 1 | 1 | 0 |
| Guatemala | 8 | 1 | 12.5 | 0 | 0 | 0 | 0 | 1 | 0 |
| Mexico | 138 | 28 | 20.3 | 0 | 0 | 2 | 6 | 20 | 0 |
| Panama | 2 | 1 | 50.0 | 0 | 0 | 0 | 1 | 0 | 0 |
| Puerto Rico | 4 | 4 | 100.0 | 0 | 0 | 0 | 0 | 4 | 0 |
| United States | 297 | 189 | 63.6 | 3 | 20 | 114 | 45 | 6 | 1 |
| Other | 59 | 0 | 0.0 | 0 | 0 | 0 | 0 | 0 | 0 |
| Europe | 893 | 119 | 13.3 | 0 | 2 | 37 | 38 | 39 | 3 |
| Austria | 5 | 1 | 20.0 | 0 | 0 | 1 | 0 | 0 | 0 |
| Belarus | 17 | 1 | 5.9 | 0 | 0 | 0 | 0 | 1 | 0 |
| Belgium | 7 | 1 | 14.3 | 0 | 0 | 1 | 0 | 0 | 0 |
| Bulgaria | 7 | 1 | 14.3 | 0 | 0 | 1 | 0 | 0 | 0 |
| Croatia | 3 | 2 | 66.7 | 0 | 0 | 0 | 1 | 1 | 0 |
| Czech Republic | 5 | 3 | 60.0 | 0 | 0 | 1 | 0 | 1 | 1 |
| Denmark | 4 | 1 | 25.0 | 0 | 0 | 0 | 0 | 1 | 0 |
| Estonia | 2 | 1 | 50.0 | 0 | 0 | 0 | 1 | 0 | 0 |
| France | 40 | 9 | 22.5 | 0 | 1 | 5 | 3 | 0 | 0 |
| Germany | 95 | 5 | 5.3 | 0 | 0 | 5 | 0 | 0 | 0 |
| Greece | 8 | 1 | 12.5 | 0 | 0 | 0 | 1 | 0 | 0 |
| Hungary | 9 | 1 | 11.1 | 0 | 0 | 1 | 0 | 0 | 0 |
| Ireland | 3 | 1 | 33.3 | 0 | 0 | 1 | 0 | 0 | 0 |
| Italy | 33 | 5 | 15.2 | 0 | 0 | 5 | 0 | 0 | 0 |
| Lithuania | 5 | 1 | 20.0 | 0 | 0 | 0 | 1 | 0 | 0 |
| Netherlands | 23 | 4 | 17.4 | 0 | 0 | 1 | 2 | 0 | 1 |
| Norway | 4 | 1 | 25.0 | 0 | 0 | 0 | 0 | 1 | 0 |
| Poland | 47 | 20 | 42.6 | 0 | 0 | 1 | 5 | 14 | 0 |
| Portugal | 8 | 2 | 25.0 | 0 | 0 | 2 | 0 | 0 | 0 |
| Romania | 24 | 4 | 16.7 | 0 | 0 | 0 | 1 | 3 | 0 |
| Russia | 213 | 16 | 7.5 | 0 | 0 | 2 | 5 | 9 | 0 |
| Slovakia | 2 | 1 | 50.0 | 0 | 0 | 0 | 1 | 0 | 0 |
| Spain | 89 | 3 | 3.4 | 0 | 0 | 3 | 0 | 0 | 0 |
| Sweden | 6 | 3 | 50.0 | 0 | 0 | 1 | 1 | 1 | 0 |
| Switzerland | 5 | 4 | 80.0 | 0 | 0 | 3 | 1 | 0 | 0 |
| Turkey | 79 | 1 | 1.3 | 0 | 0 | 1 | 0 | 0 | 0 |
| Ukraine | 47 | 2 | 4.3 | 0 | 0 | 0 | 0 | 1 | 1 |
| United Kingdom | 70 | 24 | 34.3 | 0 | 1 | 2 | 15 | 6 | 1 |
| Other | 33 | 0 | 0.0 | 0 | 0 | 0 | 0 | 0 | 0 |
| Asia | 1842 | 106 | 5.8 | 0 | 0 | 32 | 44 | 26 | 4 |
| Azerbaijan | 4 | 1 | 25.0 | 0 | 0 | 0 | 1 | 0 | 0 |
| Bahrain | 1 | 1 | 100.0 | 0 | 0 | 0 | 1 | 0 | 0 |
| Bangladesh | 31 | 1 | 3.2 | 0 | 0 | 0 | 0 | 1 | 0 |
| China | 416 | 29 | 7.0 | 0 | 0 | 7 | 13 | 9 | 0 |
| India | 428 | 28 | 6.5 | 0 | 0 | 10 | 15 | 3 | 0 |
| Indonesia | 134 | 4 | 3.0 | 0 | 0 | 0 | 2 | 2 | 0 |
| Japan | 203 | 2 | 1.0 | 0 | 0 | 1 | 1 | 0 | 0 |
| Jordan | 6 | 1 | 16.7 | 0 | 0 | 0 | 1 | 0 | 0 |
| Kazakhstan | 24 | 3 | 12.5 | 0 | 0 | 0 | 0 | 2 | 1 |
| Lebanon | 6 | 1 | 16.7 | 0 | 0 | 1 | 0 | 0 | 0 |
| Malaysia | 37 | 10 | 27.0 | 0 | 0 | 2 | 3 | 4 | 1 |
| Myanmar | 21 | 1 | 4.8 | 0 | 0 | 0 | 0 | 0 | 1 |
| Pakistan | 65 | 2 | 3.1 | 0 | 0 | 0 | 0 | 2 | 0 |
| Philippines | 85 | 3 | 3.5 | 0 | 0 | 1 | 1 | 0 | 1 |
| Qatar | 2 | 1 | 50.0 | 0 | 0 | 0 | 0 | 1 | 0 |
| Saudi Arabia | 25 | 6 | 24.0 | 0 | 0 | 2 | 4 | 0 | 0 |
| Singapore | 1 | 1 | 100.0 | 0 | 0 | 1 | 0 | 0 | 0 |
| South Korea | 45 | 1 | 2.2 | 0 | 0 | 1 | 0 | 0 | 0 |
| Sri Lanka | 12 | 1 | 8.3 | 0 | 0 | 0 | 1 | 0 | 0 |
| Taiwan | 12 | 3 | 25.0 | 0 | 0 | 1 | 1 | 1 | 0 |
| Thailand | 20 | 2 | 10.0 | 0 | 0 | 1 | 0 | 1 | 0 |
| United Arab Emirates | 6 | 2 | 33.3 | 0 | 0 | 2 | 0 | 0 | 0 |
| Vietnam | 34 | 2 | 5.9 | 0 | 0 | 2 | 0 | 0 | 0 |
| Other | 224 | 0 | 0.0 | 0 | 0 | 0 | 0 | 0 | 0 |
| Africa | 495 | 15 | 3.0 | 0 | 0 | 7 | 4 | 4 | 0 |
| Egypt | 37 | 1 | 2.7 | 0 | 0 | 1 | 0 | 0 | 0 |
| Ghana | 11 | 1 | 9.1 | 0 | 0 | 0 | 0 | 1 | 0 |
| Kenya | 7 | 2 | 28.6 | 0 | 0 | 0 | 1 | 1 | 0 |
| Morocco | 24 | 1 | 4.2 | 0 | 0 | 0 | 1 | 0 | 0 |
| Nigeria | 86 | 2 | 2.3 | 0 | 0 | 1 | 0 | 1 | 0 |
| South Africa | 52 | 6 | 11.5 | 0 | 0 | 5 | 1 | 0 | 0 |
| Tanzania | 16 | 1 | 6.3 | 0 | 0 | 0 | 0 | 1 | 0 |
| Uganda | 3 | 1 | 33.3 | 0 | 0 | 0 | 1 | 0 | 0 |
| Other | 259 | 0 | 0.0 | 0 | 0 | 0 | 0 | 0 | 0 |
| South America | 427 | 75 | 17.6 | 0 | 0 | 3 | 12 | 48 | 12 |
| Argentina | 32 | 1 | 3.1 | 0 | 0 | 0 | 0 | 1 | 0 |
| Bolivia | 7 | 1 | 14.3 | 0 | 0 | 0 | 0 | 1 | 0 |
| Brazil | 228 | 43 | 18.9 | 0 | 0 | 1 | 5 | 30 | 7 |
| Chile | 27 | 8 | 29.6 | 0 | 0 | 0 | 1 | 2 | 5 |
| Colombia | 40 | 19 | 47.5 | 0 | 0 | 1 | 5 | 13 | 0 |
| Peru | 22 | 2 | 9.1 | 0 | 0 | 1 | 0 | 1 | 0 |
| Uruguay | 1 | 1 | 100.0 | 0 | 0 | 0 | 1 | 0 | 0 |
| Other | 70 | 0 | 0.0 | 0 | 0 | 0 | 0 | 0 | 0 |
| Oceania | 30 | 16 | 55.2 | 0 | 0 | 9 | 1 | 4 | 2 |
| Australia | 19 | 13 | 68.4 | 0 | 0 | 7 | 1 | 3 | 2 |
| New Zealand | 10 | 3 | 30.0 | 0 | 0 | 2 | 0 | 1 | 0 |
| Other | 1 | 0 | 0.0 | 0 | 0 | 0 | 0 | 0 | 0 |
| 4262 | 574 | 13.5 | 3 | 22 | 210 | 163 | 154 | 22 | |
Only includes introductions from the first 2 months.
Acknowledgements
The authors thank Pierre-Alexandre Balland for his helpful comments and suggestions and for provision of patent data and Ben Derudder for provision of GaWC data. They also thank Andrea Ascani and René Belderbos for their helpful comments. They also thank the anonymous reviewers and especially the editor for their help in improving this paper.
Funding
The author(s) disclosed receipt of the following financial support for the research, authorship, and/or publication of this article: M.B. Punt and K. Frenken were funded by the Netherlands Organisation for Scientific Research (NWO)—Vici grant under Grant No. 453-14-014.