
Abstract
Looking at business models as systems of interdependent elements, we study how the breadth of an incumbent firm’s business model reconfiguration influences its performance. Drawing on the metaphor of firms searching on a performance landscape, we argue that the relationship between business model reconfiguration breadth and performance should form an inverted U-shape. While firms can gain from increasing business model reconfiguration breadth, these benefits need to be traded-off against the increasing complexity of its associated changes. We further predict that this inverted U-shape will flip for highly performing firms while being amplified for firms heavily active in innovation. Using data from an original survey of knowledge-intensive business services firms, we find that, on average, business model reconfiguration has little effect on performance. However, U-shaped effects clearly emerge when accounting for the effects of past performance and innovative activity. Our findings contribute to a better understanding of the conditional nature of the advantages stemming from business model reconfiguration.
Introduction
Business models—systems of interconnected elements that firms deploy to create, deliver, and capture value (Foss and Saebi, 2018; Ritter and Lettl, 2018; Teece, 2010: 172)—are becoming an increasingly important concept in the domain of strategy (Massa et al., 2017). For incumbent firms, in particular, business model reconfiguration (BMR) 1 is seen as a way for managers to renew their firms (Birkinshaw et al., 2008; Casadesus-Masanell and Zhu, 2013; Chesbrough, 2007; Demil et al., 2015; Sosna et al., 2010). The idea is that by reconfiguring their business model—that is, adding, removing, or changing at least one element (Siggelkow, 2002)—established companies may substantially improve their performance (Andries et al., 2013; George and Bock, 2011; Teece, 2018; Wirtz et al., 2016). Innovation and strategy research has been keen to embrace this idea (Eckhardt, 2013; Foss and Saebi, 2017, 2018; Massa et al., 2017; Saebi et al., 2017; Teece, 2010, 2018), highlighting benefits in areas as diverse as online business (e.g. Amit and Zott, 2001; Kim and Min, 2015; Zott and Amit, 2008), servitization (e.g. Mina et al., 2014; Visnjic et al., 2016), software firms opening up their business model (e.g. Alexy and George, 2013; Stam, 2009), or Formula 1 racing (Aversa et al., 2015). Practitioner-leaning work emphasizes how focusing on (re)configuring business models may eventually prove more crucial to success of established firms than their underlying technologies (Girotra and Netessine, 2014; Johnson et al., 2008; Kim and Mauborgne, 2005; Osterwalder and Pigneur, 2010; Ries, 2011).
Yet, while BMR holds considerable promise, we still do not clearly understand when it may improve a firm’s performance (Foss and Saebi, 2017). Specifically, we lack insight into how much BMR is appropriate—that is, how many dimensions of its business model a firm should change to improve its performance. This is an important issue because business models, as purposively configured systems of interdependent elements (Baden-Fuller and Mangematin, 2013; Osterwalder and Pigneur, 2010), need to show internal and external fit (Demil and Lecocq, 2010; Saebi et al., 2017)—that is, the elements need to work well with each other (Milgrom and Roberts, 1990, 1995) as well as toward a firm’s product-market strategy (Porter and Siggelkow, 2008). Hence, assuming that a firm has a functioning business model, a small change could destroy a delicate balance between existing elements rather than raising performance (Demil and Lecocq, 2010), even if changing too little about the business model may not even be seen to qualify as a reconfiguration (Foss and Saebi, 2018; Markides, 2006). At the other extreme, changing too many elements of a business model introduces levels of complexity that may put at risk the business model itself (Csaszar and Siggelkow, 2010; Siggelkow, 2011). From a practitioner perspective, in-depth work by McKinsey (Bradley et al., 2013; Fruk et al., 2013) would suggest that the number of changes drives the value of BMR, but also that each firm’s success is contingent on identifying the correct amount of change. In sum, we note how current research and practice suggests there may be a BMR “sweet spot,” which may further vary depending on the firm and its operating environment. However, where that sweet spot resides and precisely how and why it might shift are open questions (Foss and Saebi, 2017, 2018; Massa et al., 2017).
Accordingly, in this article, we ask: how much business model reconfiguration is needed to improve firm performance, and what may this level depend on? To this end, we conceive of business models as systems of interconnected elements in value creation, delivery, and capture (Siggelkow, 2001, 2002, 2011; Teece, 2010). 2 Hence, BMR implies a search for novel business model configurations. In line with prior innovation research (Laursen and Salter, 2006), our focus is then on identifying the correct breadth of BMR, that is, the number of elements of an existing business model that should be changed.
As a baseline, we expect an inverted U-shape for the relationship between the breadth of BMR and firm performance for the average firm, as found in most studies on innovative performance (Garriga et al., 2013; Laursen and Salter, 2006; Leiponen and Helfat, 2010). In short, most firms should be able to improve their performance through a series of minor adaptations; however, too many adaptations introduce a level of complexity that should eventually be detrimental to the firm (Levinthal, 1997; Posen et al., 2018; Siggelkow, 2001). Furthermore, we predict that the U-shape will “flip” for high-performing firms: minor changes will break the existing highly performing configuration and only a substantial reconfiguration may again bring such firms closer to a performance peak (Siggelkow and Levinthal, 2003). Finally, we expect that the original inverted U-shape will be amplified for firms that combine BMR with higher numbers of product and process innovations. On one hand, the new search dimension that such innovation introduces holds the potential to increase dramatically the firm’s value position (Adner et al., 2014), indicating a higher maximum for the inverted U-shape. On the other hand, a new dimension introduces additional complexity, thereby favoring low-to-medium levels of BMR over higher ones (Csaszar and Siggelkow, 2010; Levinthal, 1997; Posen and Levinthal, 2012).
We purposefully explore the performance implications of BMR breadth in the context of knowledge-intensive business services (KIBS), in which firms are known to co-create value with suppliers and clients (Bettencourt et al., 2002; Leiponen, 2008; Miozzo et al., 2016). BMR should be a particularly relevant topic in such settings (Massa et al., 2017; Rietveld, 2018). We draw on a proprietary survey administered to a sample of publicly traded US and UK KIBS firms to infer business-model-related information with which to construct our independent variables. We derive our dependent variable—Tobin’s Q growth (e.g. Ceccagnoli, 2009)—from financial and stock market data to avoid issues of common method bias (e.g. Podsakoff et al., 2003). We further try to account for the possibility that the choice of BMR breadth and performance is endogenous (Hamilton and Nickerson, 2003; Shaver, 1998).
Our analyses highlight the conditional nature of the advantages of BMR. On average, BMR, irrespective of its breadth, is not associated with significantly better or worse performance. However, we find clear evidence that the effect of the breadth of BMR depends on the firm’s prior performance and level of innovation. In line with our hypotheses, highly performing firms benefit from low and high levels of BMR breadth, but not from intermediate ones. In contrast, moderate levels of BMR breadth elevate firm performance when BMR is complemented by a high level of innovation.
The study makes three contributions to our understanding of BMR. First, by developing a conceptual framework that describes BMR as a search to improve a system of interconnected elements, we can produce a coherent and consistent theoretical account of how BMR links to firm performance. Second, in doing so, we shed light on two specific contingencies associated with the BMR breadth–performance link. Third, our approach offers a new operationalization by which to capture the breadth of change in a firm’s business model and tests the predictive validity of this measure using a robust approach for evaluating firm performance.
Prior research on the BMR performance link
At present, there is a paucity of systematic academic evidence for the performance implications of BMR (Arend, 2013; Foss and Saebi, 2017; Massa et al., 2017). In turn, the practitioner-oriented work around BMR tends to focus on prominent cases of successful BMR (e.g. Ireland et al., 2001; Johnson et al., 2008; Weill et al., 2011), which complicates the drawing of generalizable inferences or identification of boundary conditions, given concerns about selection and survivorship biases.
To address these shortcomings, an increasing number of researchers have tried to quantitatively assess the effects of BMR. In Table 1, we report the current range of quantitative empirical work in the field. This table shows that much of our knowledge of business models comes from fledgling e-business firms around the time of the dotcom bubble (Amit and Zott, 2001; Zott and Amit, 2008). For example, Zott and Amit (2008), distinguishing between the novelty- and efficiency-centered business models of Internet-based start-ups, reported enhanced performance for novelty centered business models that were coupled with product-market strategies emphasizing differentiation, cost leadership, or early market entry. The work of Gerasymenko et al. (2015) suggested that start-ups whose managers changed their business models performed better when they drew on outside expertise, namely, venture capital funds and externally hired CEOs versed in business model changes.
Summary of findings of literature on the relationship between business model innovation and performance.
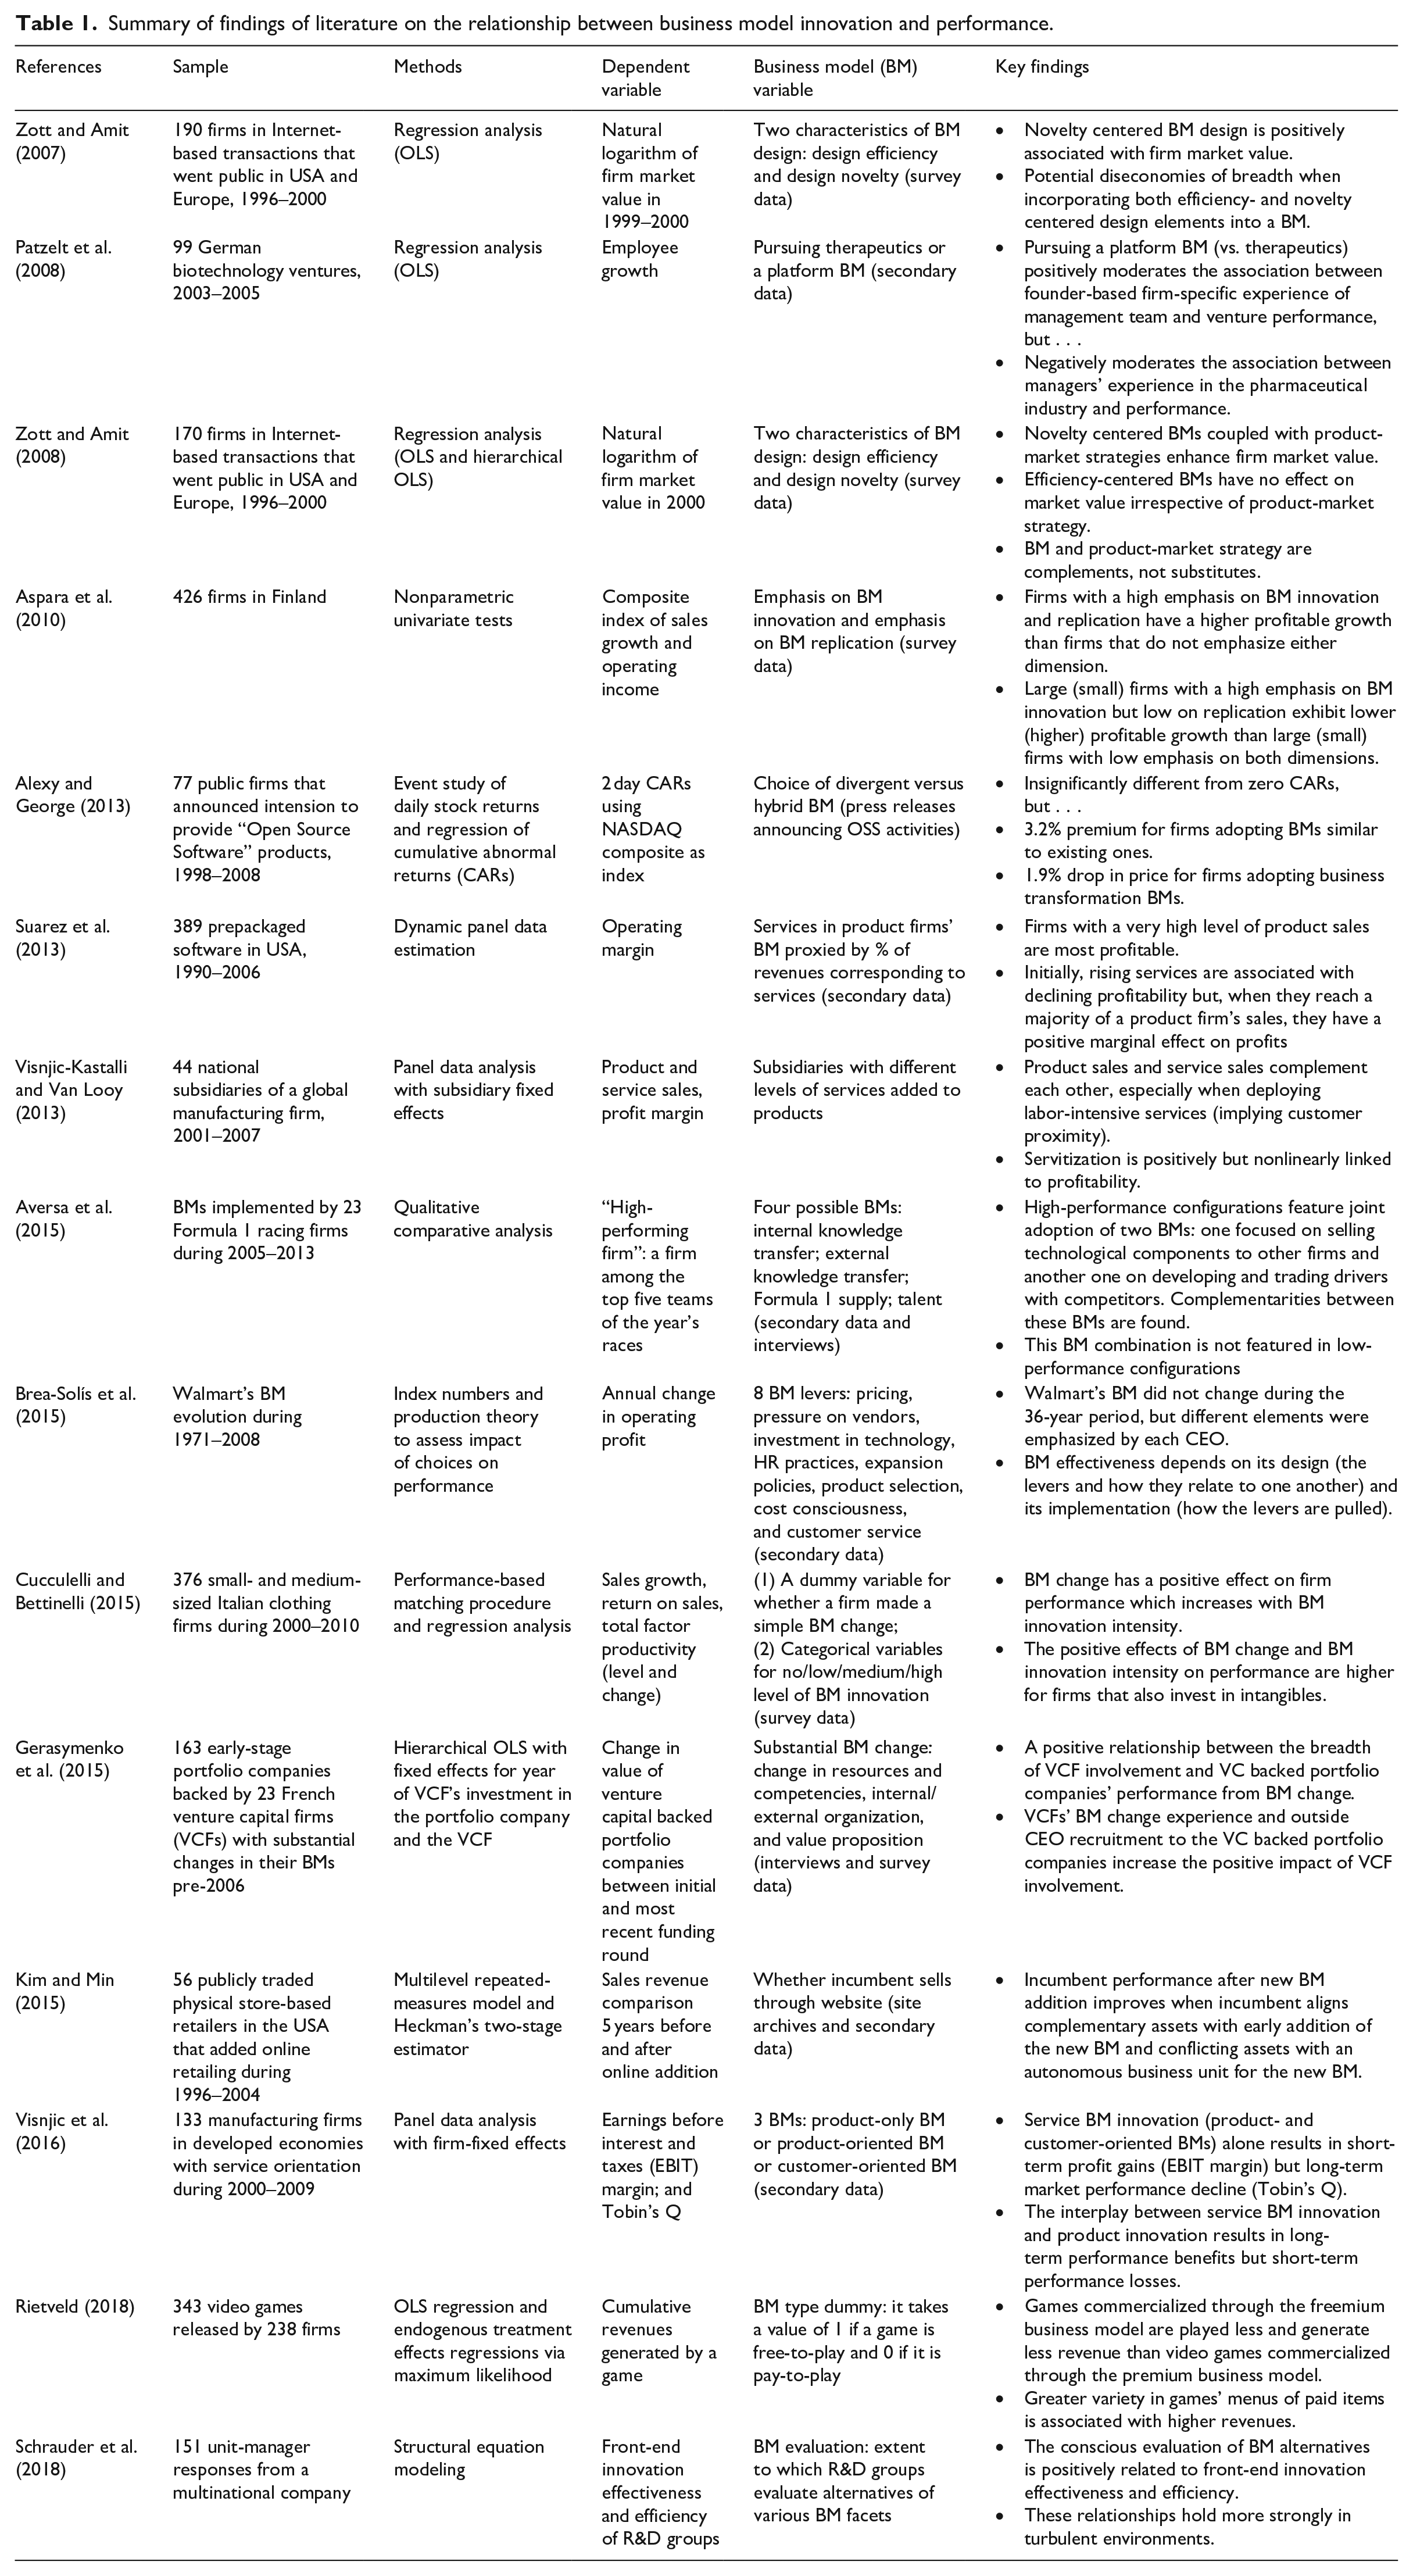
What is surprising is that, despite the fact the BMR is most likely to be an activity in established firms (Berends et al., 2016), only a few authors have adopted an incumbent perspective in exploring the links between business models and firms’ performance. For example, Visnjic et al. (2016) studied manufacturing firms that deploy business models with varying degrees of service orientation. They showed how the interplay between the deployment of service-based business models and product innovation resulted in long-term performance benefits but short-term performance decline and vice versa when a service-based business model was deployed in isolation. Most closely in line with our logic, Kim and Min (2015) studied retail firms going online, highlighting that incumbents generated higher sales growth when their complementary assets were aligned with the new business model or when they started a new autonomous business unit to avoid conflict with existing resources.
Although these studies make important contributions, the understanding of the effect of incumbents’ BMR efforts remains slender (Foss and Saebi, 2017); especially missing from extant work is a conceptual account that could inform the question of how broad the extent of BMR needs to be to allow firms to attain improved performance. For example, McKinsey studied the strategic moves taken by the largest firms in the world over a 10-year period and how that affected their success. One of the suggestions of that study was that, controlling for industry effects, a logic of “the more, the better” might not pan out as a superior strategy in terms of BMR (Bradley et al., 2013; Fruk et al., 2013). In line with the baseline inverted U-shape relationship between BMR and performance we hypothesize below, these authors argue that the increased complexity introduced by multiple changes to a business model can engender challenges that outweigh the benefits attainable.
Theoretical background and hypotheses
To provide a conceptual account for the BMR performance link, we follow the behavioral theory of the firm (Cyert and March, 1963) in conceiving of the business model as a set of loosely coupled organizational elements, which have to be assembled in a way to produce “fit” (Brea-Solís et al., 2015; Csaszar and Siggelkow, 2010; Miles and Snow, 1978; Siggelkow, 2001, 2002, 2011). Thus, a business model has high internal fit when its parts work well with one another; and it has high external fit when the elements, jointly, can help address the need of the product-market, as also expressed in firm strategy (Casadesus-Masanell and Ricart, 2010; Casadesus-Masanell and Zhu, 2013; Siggelkow, 2001).
Following this logic, even if the internal attributes of the business models of successful firms may be designed to last (Christensen et al., 2016; Hannan and Freeman, 1984; Snihur and Zott, 2019), changes in the external environment may oblige such firms to make business model adaptations (Demil and Lecocq, 2010; Rindova and Kotha, 2001). Underperforming firms might anticipate performance improvement from BMR, in particular, given that it is often regarded as less risky and capital-intensive, and, hence, more often associated with success than product or process innovation (Amit and Zott, 2012; Andries et al., 2013; Foss and Saebi, 2017; Johnson et al., 2008; Massa et al., 2017). Even firms that actually want to deploy novel technologies or products to the market should find they may be better able to do so by revising their existing business model accordingly (Chesbrough and Rosenbloom, 2002; Desyllas and Sako, 2013).
Accordingly, we see BMR as a firm-level activity in which managers search for opportunities to change elements of their current business model to improve firm performance (Brea-Solís et al., 2015; Porter and Siggelkow, 2008; Siggelkow, 2001, 2002). Drawing on the well-established metaphor of search as moving on rugged performance landscapes (Baumann et al., 2019; Levinthal, 1997; Posen et al., 2018), we conceive of BMR as firms trying to identify which business model elements and configurations thereof can elevate firms to higher performance levels. Firms that engage in BMR at low breadth (i.e. changing few dimensions) will be searching locally, trying to improve performance close to where they are in the performance landscape through minor adaptations of their existing business models. In contrast, firms that engage in BMR at high breadth (i.e. changing many dimensions) attempt to explore or move to new and distant places in the landscape in the hope of identifying previously unknown performance peaks by radically shifting the way they create, deliver, and capture value.
As with any form of innovative search, we expect that the effects of BMR on firm performance will be driven by two opposing forces. On one hand, increasing search activity (i.e. higher BMR breadth) increases the amount of business model combinations that a firm acquires knowledge of, with each change also revealing information about the underlying performance landscape (Csaszar and Levinthal, 2016; Levinthal, 1997). Put differently, the more business model elements a firm experiments with, the more information it gains about how to improve performance and the more opportunity it has to do so. On the other hand, given the interconnections between the various business model elements, each additional change increases the complexity of the system—ultimately, all design choices will need to be delicately balanced—and hence the likelihood of overall coordination failure (Bradley et al., 2013; Csaszar and Siggelkow, 2010; Fruk et al., 2013; Levinthal, 1997; Posen and Levinthal, 2012).
Within this perspective, we posit that finding the right balance between adaptation and stability will be crucial in generating BMR that is truly performance enhancing. This question of identifying what determines the right level of BMR breadth is all the more important given that the link between BMR breadth and performance has undergone little scrutiny (Foss and Saebi, 2017, 2018; Massa et al., 2017). Indeed, the main focus of research on BMR breadth has consisted of a debate about how many dimensions a firm needs to have changed for BMR to be said to have occurred: although some scholars argue that BMR can be manifested in the change of a single element of a firm’s business model, others suggest that two or more elements must change before we can meaningfully talk about BMR having taken place (Foss and Saebi, 2018).
BMR breadth and firm performance
In our first baseline hypothesis, we elaborate on the link between BMR breadth and performance. As per our preceding argument, this effect should take the shape of an inverted U, in which, first, firms should initially benefit from the innovative potential of BMR before this potential becomes outweighed by the increasing complexity of having to balance a growing series of changes to the business model.
We first look at the benefits of increasing BMR breadth. When a business model is changed in a way that allows for novel ways of creating, delivering, and capturing value, the change may produce above-average returns (Demil and Lecocq, 2010). For example, the emergence of “pay-as-you-drive” auto-insurance attracted safer drivers, lured by the lower insurance premiums determined on the basis of when and how much a car was driven. Early adopters of the new business model not only changed how they priced insurance policies and the customer segments they targeted, they also adjusted other aspects of their businesses, including their profit models and their collaborations (by working with telematics suppliers, telecommunication operators, and software developers), as well as introducing complementary services (Desyllas and Sako, 2013; Perks et al., 2012).
As this example highlights, for BMR to take a firm that previously performed around the industry average to a substantially higher performance level, that firm may need to change multiple dimensions of its business model either simultaneously (Siggelkow, 2001) or sequentially (Posen et al., 2013; Siggelkow, 2002). A greater current distance of a firm from the performance frontier of its industry implies, by definition, a greater potential for innovation. Also, by experimenting with and altering more business model elements, a firm obtains more information about the underlying performance landscape and new configurations that can elevate its performance to a peak (Csaszar and Levinthal, 2016; Levinthal, 1997). Accordingly, firms currently performing around the industry average should see increasing returns to inventing new, or even copying existing, business practices (Csaszar and Siggelkow, 2010) in order to reconfigure their existing business models.
At the same time, increasing BMR breadth beyond a firm-specific limit will likely lead to decreasing, and possibly even negative returns (Csaszar and Siggelkow, 2010), irrespective of whether the business model changes happen simultaneously or in sequence (Demil and Lecocq, 2010; Van de Ven, 1986). To begin, greater BMR breadth increases the uncertainty experienced by managers, because the rugged nature of the performance landscape makes it more difficult to predict the performance consequences of more distant forms of search (Gavetti and Levinthal, 2000). Furthermore, changing ever more dimensions could increasingly overstrain current management resources (Joseph and Wilson, 2018; Ocasio, 1997). Indeed, more distant forms of search (i.e. greater BMR breadth) require higher levels of cognitive capacity in order to be successful (Posen et al., 2018). The more attention management is required to devote to familiarizing itself with a series of changes, the more likely it is to lose sight of other important business activities. For example, an increased focus on activities that aim to capture value may come at the expense of value creation by limiting the resources available to activities that contribute to innovation and long-term growth, and vice versa (Jacobides et al., 2006; March, 1991).
Even if managers do not make such “simple” mistakes, they may still fail to account appropriately for existing and newly emerging interdependencies when changing a larger amount of business model elements (Siggelkow, 2001). For instance, while it changes, a firm still has to fulfill preexisting commitments and obligations within the product (e.g. Brea-Solís et al., 2015) and financial (e.g. Brauer and Wiersema, 2018) markets. The same applies to its internal organization, where changing more existing interdependencies is likely to increasingly generate more conflicts, misunderstandings, and confusion about the roles of existing actors. Often, existing routines embody an organizational truce (Nelson and Winter, 1982), the disturbance of which will cause organizational turmoil and resistance (Zbaracki and Bergen, 2010). For example, as Xerox shifted away from manufacturing, servicing, and distributing photocopiers toward becoming an integrated solution provider, it was necessary to allow its new divisions to provide customer solutions with little or no Xerox equipment within them. This shift toward offering “best-in-class” solutions to customers broke with conventions within the firm, which had previously regarded its service division as a vehicle for increased product sales. As the service division shifted toward solutions, it faced extreme hostility from other divisions that considered this new business model a betrayal of the organization’s history (Jones, 2011).
In sum, following a series of studies on the breadth of firms’ innovative activities (Berchicci et al., 2019; Garriga et al., 2013; Laursen and Salter, 2006; Leiponen and Helfat, 2003), as well as search on rugged landscapes (Csaszar and Siggelkow, 2010; Siggelkow, 2011; Siggelkow and Rivkin, 2005), we expect that firms will first see increasing and then decreasing returns to higher levels of BMR breadth. While, initially, increasing BMR breadth should enable an average firm to leverage more of BMR’s potential, this advantage will eventually be outweighed by the complexity of managing the exponentially rising number of new interdependencies that further increasing BMR breadth involves. Accordingly, we posit the following hypothesis:
Hypothesis 1: There is an inverted U-shaped relationship between BMR breadth and firm performance, such that firms experience first positive and then negative marginal returns to increasing BMR breadth.
Past financial performance and the BMR breadth–performance relationship
At the same time, of course, not all firms are average. Continuing our previous argument, firms’ past financial performance should strongly impact the link between BMR breadth and firm performance.
From the perspective of search on rugged landscapes, strong past performance indicates that a firm has identified a local, or even global, peak (Baumann et al., 2019; Levinthal, 1997): in our case, a high-returns, possibly even best-of-breed, configuration of various business model elements. Accordingly, as when looking down from a mountaintop, in the immediate vicinity of such a firm’s position on the performance landscape, no higher performance plateaus should be close by. It follows that by making minor adaptations to its current business model, the firm would literally be descending from the peak, and performance should decrease (Siggelkow, 2011; Siggelkow and Levinthal, 2003). Indeed, a well-performing configuration will usually not have been the result of combining best-in-class choices for each business model element, but of selecting elements that exhibit an exceptional level of complementarity, making the whole business model worth substantially more than the sum of its individual parts (Miles and Snow, 1978; Milgrom and Roberts, 1990, 1995). Making only minor changes (i.e. low BMR breadth) would imply the breaking of the existing fit between business model elements (Siggelkow, 2001), leaving the firm “stuck-in-the-middle” (Velu, 2015). 3
Rather, a previously high-performing firm would need to make a large number of changes to its business model (i.e. high BMR breadth) to re-attain a highly performing configuration (Siggelkow and Levinthal, 2003). 4 For example, Visnjic-Kastalli and Van Looy (2013) showed how a global manufacturer of durable industrial equipment developed a business model in which its product and service offerings acted as revenue complements, with product sales generating more maintenance services and with services enhancing perceived product quality (see also, for example, Ennen and Richter, 2010; Ichniowski et al., 1997; Laursen and Foss, 2003; Whittington et al., 1999). Similarly, firms that switch from closed to more open models of innovation may not only need to make minor front-end adaptations, but may have to completely rethink how to create, deliver, and capture value with a series of external partners (Alexy and George, 2013). In addition, successful companies who shift from proprietary production models toward engaging in ecosystems (Adner, 2012; Dattée et al., 2018; Jacobides and Tae, 2015; Jacobides et al., 2018) should expect to have to adapt a whole series of business model aspects, yet without any guarantee of success.
In sum, the better a firm’s past performance, the more we expect the curvilinear relationship between BMR breadth and firm performance to flex: for firms with high past performance, this may even resemble an actual U-shape. In contrast, for firms with poor past performance, the dynamics we have described for Hypothesis 1 should fully apply. In fact, they may apply even more strongly (i.e. the inverted U-shape will be more pronounced), given that such firms will often engage more willingly and aggressively in BMR in order to return to acceptable performance levels (Cyert and March, 1963). Hence, we posit the next hypothesis:
Hypothesis 2: A firm’s past financial performance relative to competitors moderates the relationship between BMR breadth and firm performance in such a way that it is represented by a U-shaped curve for firms with a stronger past performance record (shape flip).
Innovative activity and the BMR breadth–performance relationship
The performance implications associated with BMR do not play out in a vacuum. Rather, firms’ resources and capabilities can be expected to have a significant effect on the value they can derive from BMR-related changes (Chesbrough and Rosenbloom, 2002). Following this logic, we suggest that the performance implications of BMR are interdependent with the level of product and process innovations that are simultaneously introduced by a firm.
From the perspective of search on rugged landscapes, allowing for innovation to co-occur with BMR implies searching on an additional value dimension: the more innovation there is, the more additional search activity occurs (Adner et al., 2014). In this view, the effect of innovation on firm performance should follow a similar logic to that of BMR breadth, that is, innovation must “fit” with the remaining activities of the firm and the broader product market. Accordingly, we suggest that the degree of innovativeness of a firm will amplify the inverted U-shaped relationship between BMR breadth and firm performance. At very low and very high levels of BMR breadth, high innovativeness will lead to relative performance decreases, while there will be relative performance increases for firms that combine high levels of innovation with medium levels of BMR breadth.
First, we suggest that firms with high levels of innovativeness but low BMR breadth will miss out on the full potential of their innovations. For example, innovations enabled by the application of new technologies can fall on fallow ground unless they are tied to business model changes because [u]nless a suitable model can be found, these technologies will yield less value to the firm than they otherwise might and if others, outside the firm, uncover a business model more suited for a given technology, they may realize far more value from it than the firm that originally discovered the technology. (Chesbrough, 2010: 355)
Similarly, Teece (2010) stresses the need for firms to match excellence in product innovation with an appropriate business model design so as to capture more value. Accordingly, a series of studies suggests that pairing BMR with innovations may help unlock greater value than either activity on its own (Baden-Fuller and Haefliger, 2013; Chesbrough and Rosenbloom, 2002).
Second, at the other extreme, firms that couple high levels of innovation with high BMR breadth will dramatically increase the inherent complexity of both activities (Levinthal, 1997; Rivkin and Siggelkow, 2003). Such broad, systematic, and complex efforts may aggravate the coordination challenges associated with both BMR and innovation (Ocasio and Joseph, 2018; Van de Ven, 1986). Indeed, there is evidence that high levels of simultaneous new product introductions may generate a significant performance hazard (Barnett and Freeman, 2001). Therefore, we can expect that, as innovation volume and BMR breadth intensify simultaneously, the danger of negative returns increases. Managers are even more likely to underestimate the coordination challenges that arise from broad BMR with extensive innovation. Indeed, the greater the level of interface changes associated with a new business model and innovations, the likelier managers are to miss important interrelationships (Tripsas and Gavetti, 2000). In effect, an organization would be seeking to disrupt its own operational routines, rooted in the current business model, at the same time as attempting to deliver a new generation of offerings to its core markets. This tension may exacerbate the challenges associated with both. For example, if performance feedback on the combined BMR innovation efforts is negative, it is difficult to identify whether it is because of the business model, the innovative offerings, or both (Siggelkow and Rivkin, 2009), which often leads managers to persist with a failing course of action. Indeed, it seems to be precisely this issue that explains why so many initiatives to digitize companies and business models have fallen behind expectations, yet still continue (Davenport and Westerman, 2018).
In addition, the likelihood of conflicts emerging with current stakeholders should increase with rising levels of innovativeness. For instance, IBM has been aggressively transforming its business in an attempt to lead in a new era of cognitive and cloud computing. To better reflect its evolution into a cognitive solutions and cloud platform company from a hardware–software one, it adopted a new way of reporting information on its activities and performance to its shareholders (Foresi, 2015). However, this did little to appease analysts: IBM executives presented hours of discussion about cool technologies they believe will drive the company’s future. Often absent from those discussions were facts on market size, competitive advantage, profitability, and demand related to the technologies. This kind of lack of specificity concerns us as it could show that Rometty [the CEO] doesn’t have a good understanding of where these technologies will take IBM. (Management CV-Analyst, 2016)
In turn, it should usually be at medium levels of BMR breadth that greater innovative efforts should be most valuable (Chesbrough et al., 2006; Teece, 2010). Here, firms should be sufficiently modifying their business model to exploit their innovations, yet not so much that exacerbated coordination challenges kick in. In line with this argument, Csaszar and Siggelkow (2010) show, in a series of simulations, that firms moving into a search environment that they do not understand (e.g. as they engage in product innovation) gain performance by copying an intermediate amount from rivals, in particular when their time horizon is short. In sum, we posit the third hypothesis:
Hypothesis 3: Innovative activity amplifies the relationship between BMR breadth and firm performance (Hypothesis 1): with increasing levels of innovation, we expect an increasingly negative effect at very high and low values of BMR breadth, and an increasingly positive effect at medium levels, with the overall U-shape to steepen increasingly as a result.
Our hypothesized relationships are graphically displayed in Figure 1.
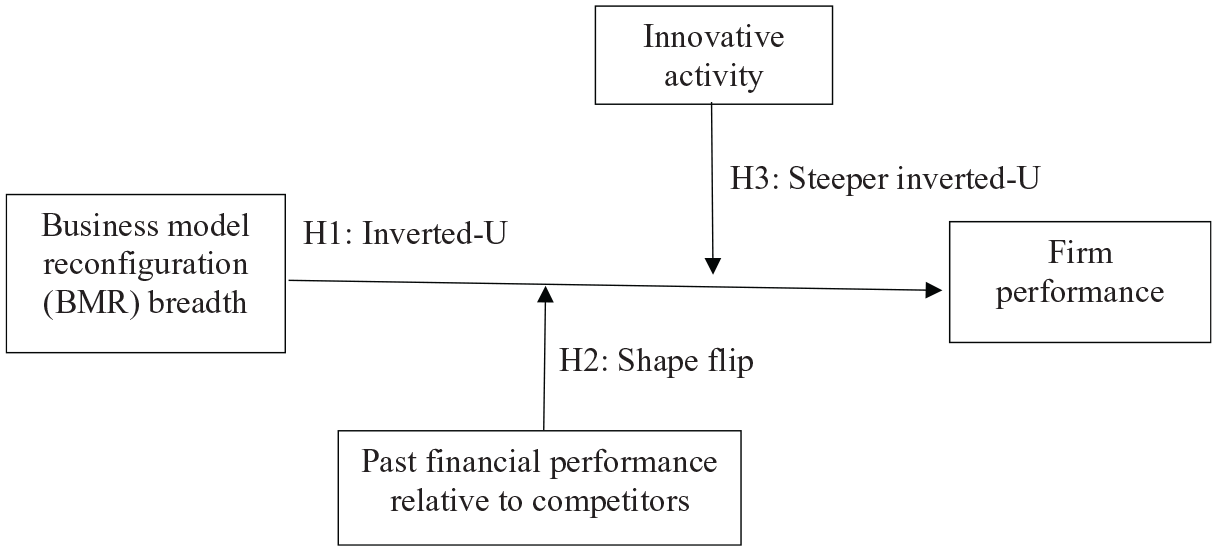
Conceptual framework.
Methods
Given our business model conceptualization, we purposefully chose to explore BMR in the context of KIBS firms. These firms offer either technological services—such as research and development (R&D), engineering, and computer services—or professional services—such as legal, accountancy, management consultancy, and marketing services. One of the defining characteristics of such firms is their tendency to co-create value with their suppliers and clients (Bettencourt et al., 2002; Leiponen, 2008; Miozzo et al., 2016). In addition, KIBS industries are characterized by weak intellectual property regimes, high levels of human capital, and low dependence on physical capital in value generation and its capture (Miles, 2005; Tether, 2005). Reconfiguration is common among KIBS firms because they must move with their customers to exploit market opportunities. For example, many professional services firms have shifted their business model away from the sale of services via hours billed on client projects toward taking up risk and equity shares in those projects. Finally, it is important to note that KIBS represent an important and dynamic sector of the economy. Professional services alone accounted for about 12% of gross value added (GVA) in the United States and the United Kingdom, equaling or surpassing the entire manufacturing sectors; and they have been one of the fastest growing parts of the US and UK economies, with an average annual growth rate for 2007–2013 of 5%–6% (see Bureau of Economic Analysis (BEA), 2016; Department for Business, Innovation and Skills (BIS), 2016).
Data sources
We combined multiple sources to construct a firm-level data set especially suited to studying BMR. First, we exploited a proprietary survey questionnaire for measures of firms’ BMR breadth as well as the nature, outputs, and protection of innovation. 5 Given the focus of prior innovation surveys on process, product, and management innovation, it became apparent that a new scale was needed to measure BMR, a need elaborated on below. Our sample population consists of all US and UK publicly traded firms in the KIBS sector listed in the Datastream database in 2012. 6
To design the questionnaire, we drew on previous innovation surveys, most notably the Community Innovation Survey (CIS) and the Yale/Carnegie Mellon survey (Cohen et al., 2000; Smith, 2005). We conducted the survey by telephone, drawing on professionally trained interviewers who were given detailed instructions. All respondents were given an overview of the survey so that they could judge whether they had adequate knowledge of its subject matter. Our questionnaire also included some text explaining the key terms used; these were read to the respondents either as a brief introduction to specific questions or as an intuitive explanation after a term was used.
Before rolling out the survey, we conducted a pilot test of it with a small number of subjects to establish its face validity. In addition, members of our research team visited the survey company to monitor the conduct of the interviews and provide feedback to the interviewers. However, we acknowledge that because many of our measures are based on perceptual responses, they might diverge from reality. To check for such possible biases, we identified a variable for which we possessed both subjective data from our survey (perceived importance of patents as a value-appropriability mechanism) and objective data from databases (actual number of patents awarded during the same period) and compared the two. This exercise demonstrated a significant correlation between our perceptual measures and actual behavior.
Administered through telephone interviews between September and December 2012, the survey questions refer to the period between 2009 and 2011. The respondents—all in senior managerial positions 7 —had averages of 7 years of organizational tenure and 5 years in their jobs. From our population sample of 2289 firms, we received 223 responses, corresponding to a response rate of about 10%, which is comparable to previous similar studies (Aspara et al., 2010; Mina et al., 2014). The response rates differed in the United Kingdom and the United States (23% and 7%, respectively) and were biased in favor of UK firms (χ2 = 94.5, p = 0.000) and large firms (as measured by the natural logarithm of the number of employees) (t = –2.15, p = 0.032). To adjust for nonresponse bias in firm size and country, we applied a weighting technique (Kalton and Flores-Cervantes, 2003), in which we regressed whether a firm responded to our survey on variables capturing information about firm size, Tobin’s Q, and primary industry in 2008, as well as the country of origin. The reciprocal of each firm’s propensity to respond to the survey was then used to weight observations on from that firm. We also tested for but found no evidence to suggest that BMR activity differed between 50 early and 50 late respondents, given that the latter are often assumed to be more akin to nonrespondents (χ2 = 2.12, p = 0.15) (Armstrong and Overton, 1977).
We derived firm-level financial, stock market, and demographic data using Datastream, Fame, and Osiris databases. As our dependent variable was constructed using Datastream, whereas our key independent variable was constructed using subjective information from our survey, we avoided the possible problem of common method bias (Podsakoff et al., 2003). Finally, to address potential endogeneity issues, we collected regional-level data on R&D expenditure per capita from the National Science Board for the United States and from Eurostat for the United Kingdom. After compiling all the information, we were left with 198 firms without missing values for any of our variables.
Dependent variable
To measure the effect of the breadth of BMR on the capacity of a firm to enhance its performance, we used Tobin’s Q growth as our dependent variable. This was computed as the difference between the natural logarithm of Tobin’s Q measured at 2011 year end (the last year covered by our survey) and its level at 2008 year end (immediately before the period covered by our survey). By looking at rates of change rather than absolute levels, we accounted for possible unobserved differences across firms (see also Micheli et al., 2020).
Numerous prior studies have used Tobin’s Q to estimate the links between a firm’s intangible assets and its performance (Benner and Veloso, 2008; Ceccagnoli, 2009; Fang et al., 2008; Hall et al., 2005). Conceptually, Tobin’s Q is determined by the market value of a firm’s tangible and intangible assets relative to their replacement cost (Tobin and Brainard, 1976). Compared to accounting-based measures, market-based measures are forward looking, thus better reflecting discounted future profits from investment, invention, and innovation (Ceccagnoli, 2009; Visnjic et al., 2016). In this sense, Tobin’s Q is informative about how well a company’s investments pay off or are expected to pay off. Empirically, Tobin’s Q has been found to be correlated with accumulated R&D expenditures, patent stocks, etc. (Hall et al., 2005). Thus, it should also reflect a firm’s ability to earn returns from BMR.
Table 2 reports the list of variables and details of their calculation. The empirical estimation of Tobin’s Q relies upon the use of accounting information as imperfect proxies. We calculated Tobin’s Q from the ratio of a firm’s market value to its total assets, in which the market value is taken as the year-end market value of common equity plus the book value of preferred stock plus the book value of total debt (see Gugler et al., 2004). We chose this formula in order to maximize our effective sample size. Previous studies report that different empirical approximations of Tobin’s Q are highly correlated with computationally more complex and accurate measures (Ceccagnoli, 2009; Chung and Pruitt, 1994).
List of variables.
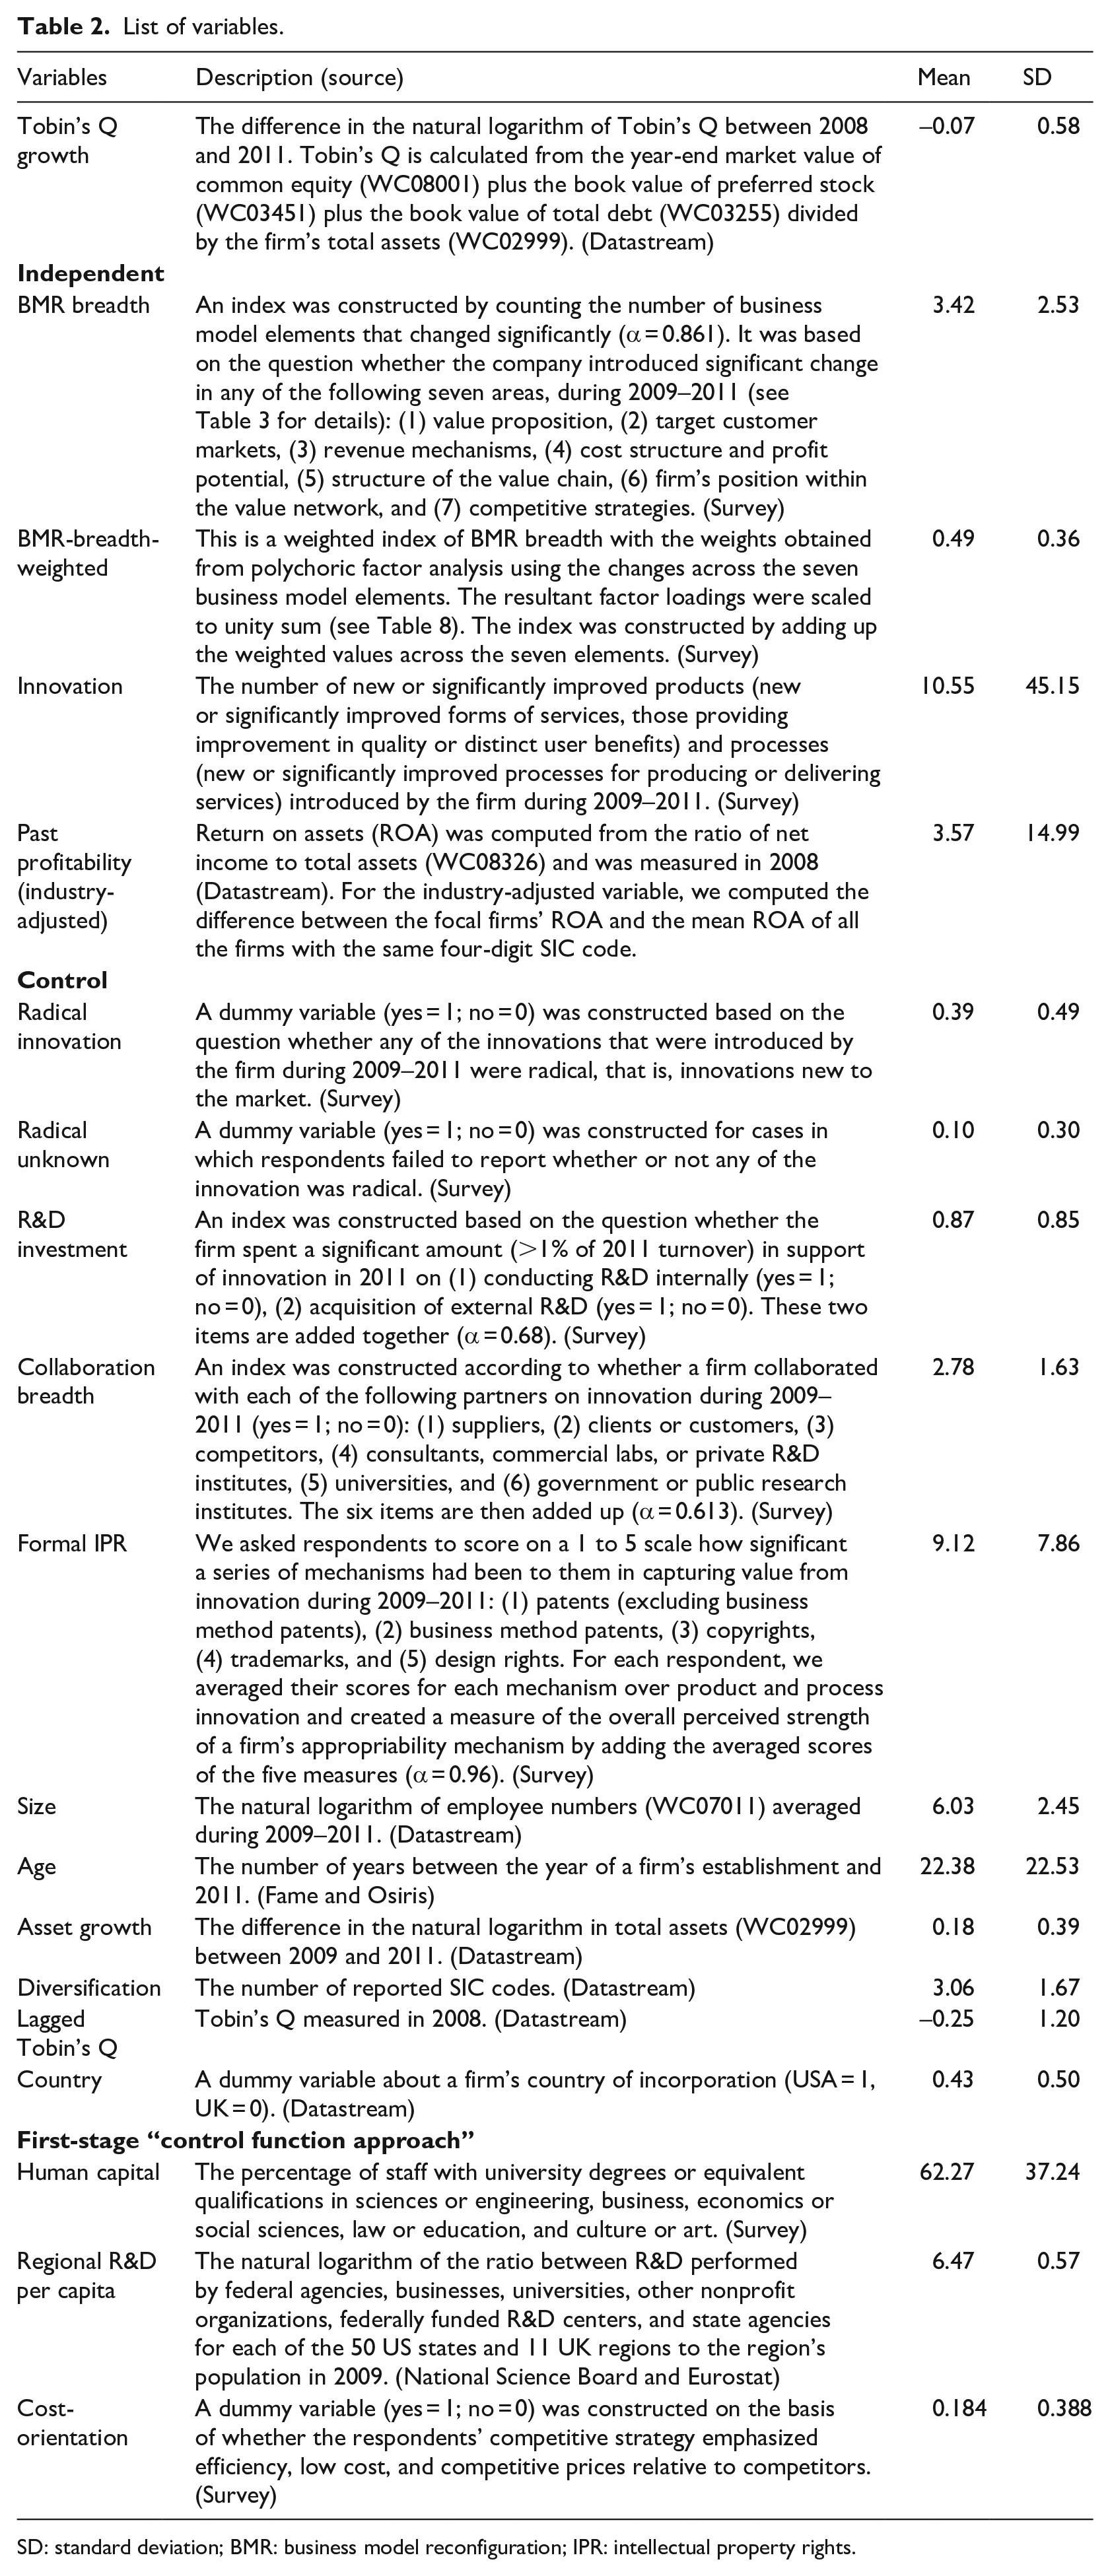
SD: standard deviation; BMR: business model reconfiguration; IPR: intellectual property rights.
Independent variables
We adopted a dual approach for the development of our measure of BMR breadth. We combined a deductive approach through a review of the scholarly literature and an inductive approach, based on interviews with managers of KIBS firms (Hinkin, 1995). Recent literature reviews have uncovered significant heterogeneity across studies in the level of abstraction of business model conceptualization and in the nature and number of business model elements across studies (Foss and Saebi, 2018; Saebi et al., 2017). In a review of 19 articles, Clauss (2017) found that the leanest models define three elements, but the most complex ones define about 18 elements. The development of our BMR breadth measure follows Chesbrough (2010) and Chesbrough and Rosenbloom (2002). These two highly cited studies provide an operational definition of a business model and its constituent elements that are mapped onto the fundamental functions of a business: (1) value proposition, (2) target customer markets, (3) revenue mechanisms, (4) cost structure and profit potential, (5) structure of the value chain, (6) firm’s position within the value network, and (7) competitive strategies. Then, collecting information on the constituent elements of a business model becomes reasonably straightforward (see Table 3 for details). This approach ensures that our measure of BMR breadth is conceptually aligned and empirically comparable with prior research (Brea-Solís et al., 2015; Siggelkow, 2001, 2002). For example, the measure used in empirical work by Saebi et al., (2017) spans four elements, namely, a firm’s value proposition, target customers, the structure of the value delivery, and the value capture mechanism.
Theoretical definition of business model elements and survey questionnaire approach.
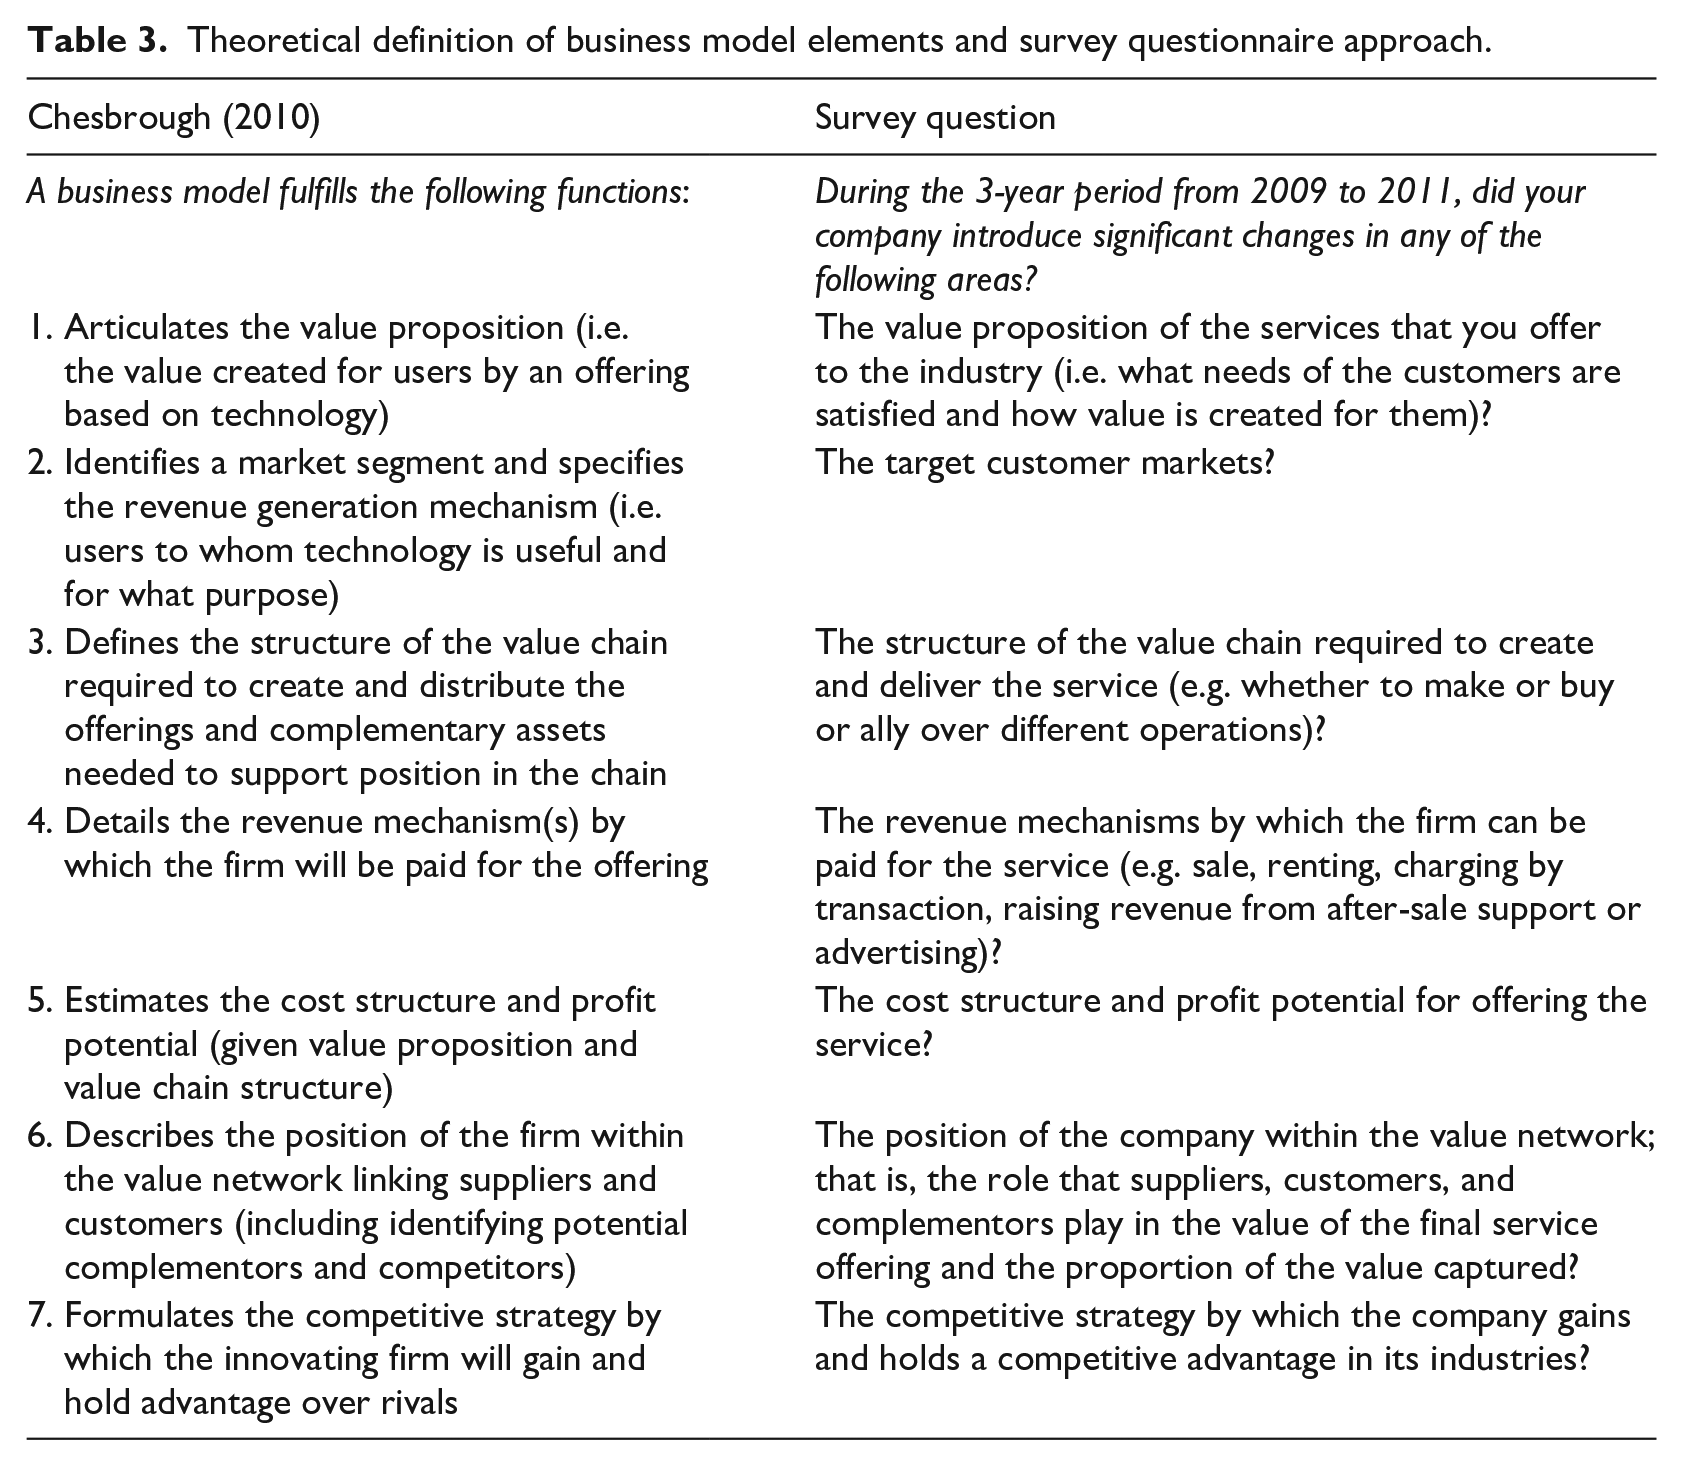
Our BMR breadth measure builds on the number of business model elements to which a company introduced significant change during the period 2009–2011. To extract this measure in the phone interviews, we avoided direct reference to “business model” within the actual questions to try to lessen possible misunderstandings, as the term “business model” remains contested (Foss and Saebi, 2017). Our approach should reduce confusion and expectancy bias regarding the term BMR itself (Podsakoff et al., 2003). Our measure was designed to capture changes in an incumbent firm’s existing business model rather than cases in which incumbent firms chose to introduce a new business model in parallel with their established one (see, for example, Markides and Charitou, 2004). This was a conscious choice because, otherwise, the effect of business model changes on performance could be subjected to conflation.
Like previous studies measuring the breadth of corporate activities (Alexy et al., 2016; Laursen and Salter, 2006; Leiponen and Helfat, 2010), we computed BMR breadth by constructing an index that counts how many of the seven business model dimensions a company changed. The focal summative BMR breadth index has a high degree of internal consistency, scoring a Cronbach’s alpha of 0.86. Figure 2 shows the percentages of each of the seven business model elements that our respondents identified as having changed. As Figure 3 shows, the reported BMR breadth values span the full range of elements, from none to all seven. 8
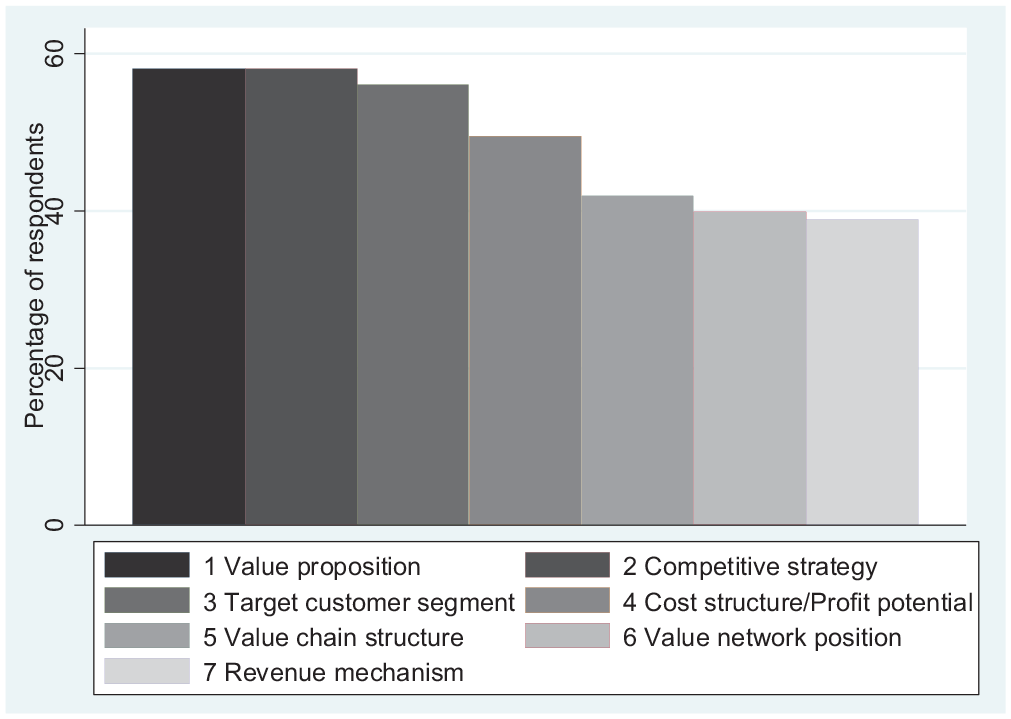
Business model constituent elements changed.
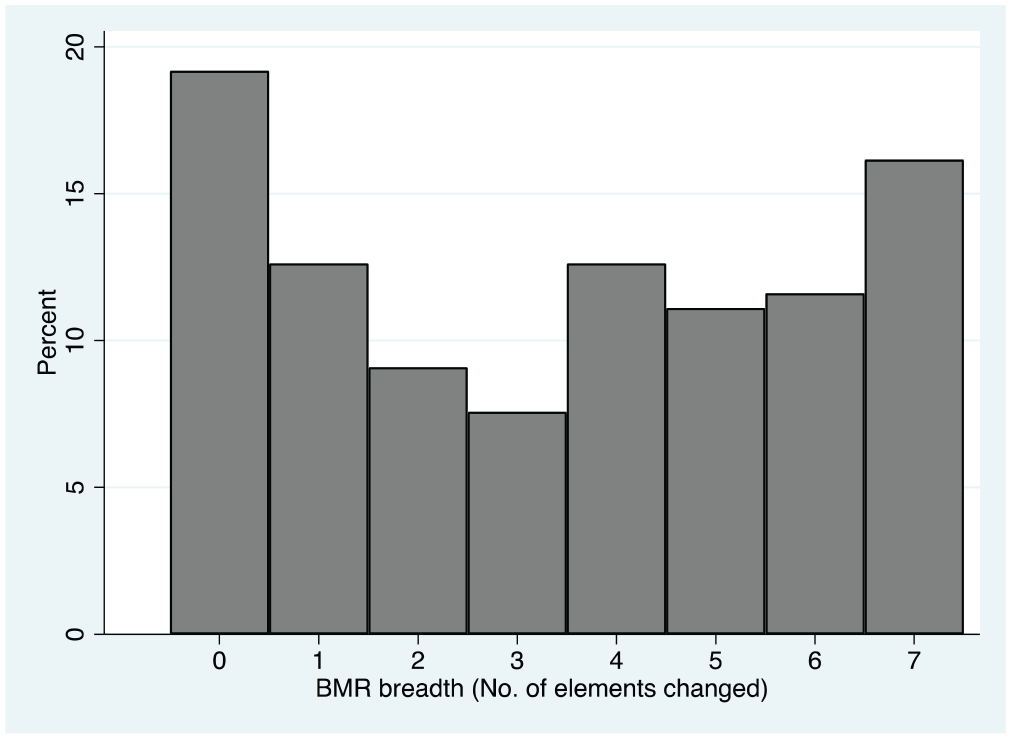
BMR breadth across sample firms.
Finally, we recognize that the impact of these seven elements on the BMR summative index may be uneven. To check the sensitivity of our findings to the possibility that different business model changes impact the BMR breadth index differentially, we constructed an alternative BMR breadth measure that allowed us to assign different weights to the different elements. Thus, we developed the variable BMR-breadth-weighted as an index with the weights obtained from factor analysis using changes across the seven business model elements (see Appendix 1 for details). As our BMR measure was constructed using several binary variables, we used a polychoric correlation matrix (Holgado-Tello et al., 2008). The results suggest a one-factor model using the Kaiser criterion. For the construction of the weighted index, the resultant factor loadings were scaled to unity sum (Becker et al., 2017). Our robustness checks will draw on this weighted version of our independent variable.
A firm’s past financial performance relative to its competitors is proxied using the variable past profitability (industry-adjusted). We measured past profitability through the ratio of net income to total assets (also known as return on assets) for 2008, which is the last year before the start of the focal period of our analysis of the implications of BMR. This is an accounting-based measure of past financial performance; it reflects how efficient management has been at using its assets to generate earnings. For the industry-adjusted variable, we computed the difference between the focal firms’ profitability and the mean industry profitability, which is calculated across all the firms operating in the same country with the same four-digit SIC code.
Next, we developed the variable innovation to capture firms’ product and process innovative activity. There is consensus among researchers that the boundaries between process and product innovations for services (vs manufacturing) firms are blurred. Often, service providers start with process improvements to increase the efficiency and quality of existing services, but these process changes then trigger the development of new forms of services (Barras, 1986, 1990). To account for this feature of KIBS firms, in our survey, we asked our respondents whether their firm introduced new or significantly improved products and processes for producing or delivering services during the period 2009–2011. Our approach is similar to questions used in prior innovation surveys (most notably, the CIS) to capture innovative activity (Laursen and Salter, 2006; Leiponen and Helfat, 2010). In this way, we benefit from the interpretability, reliability, and validity of the corresponding survey items that have been established through extensive piloting and implementation pre-testing across firms in different countries and industries (Laursen and Salter, 2006).
We also examined whether respondents were able to distinguish between innovations and changes in the constituent business model elements by checking the coefficients of the polychoric correlation matrix (see Table 7 in Appendix 1). This exercise did not reveal any economically significant correlations between innovation and business model element changes (the highest correlation coefficient equals 0.33). These results suggest that respondents could clearly distinguish between the survey items and their corresponding constructs.
Controls
We included a series of control variables related to a firm’s innovative activity (see Table 2 for details of measurement). First, we controlled for firms introducing radical innovation using a dummy derived from information from the survey. We set it to a value of 1 when at least some innovations were reported as new to the industry and to 0 otherwise. Because this information was not available for 19 of the 198 observations, we created an additional dummy variable, radical unknown, and set its value to 1 for those 19 cases. Second, we captured R&D investment with an index constructed according to whether a firm had spent a significant amount in support of innovation in conducting R&D internally or acquiring external R&D. 9 Third, the summative scale collaboration breadth was constructed according to whether the firm collaborated on innovation with suppliers, clients, customers, competitors, consultants, commercial labs, private R&D institutes, universities, and government or public research institutes (Laursen and Salter, 2014). 10 Moreover, given that both firm performance and the incentive to innovate depend on the ability to capture the resultant value, we controlled for a measure of the perceived strength of formal intellectual property rights (IPR), incorporating all formal appropriability mechanisms (James et al., 2013).
We further controlled for several other firm characteristics suggested as relevant in the existing literature. We proxied a firm’s size via the natural logarithm of employee numbers and a firm’s age by the number of years since its establishment. We measured the trajectory on which a firm was entering our observational window by measuring a firm’s asset growth as the difference in the natural logarithm of total assets. We captured a firm’s degree of diversification via the number of its reported SIC codes. We controlled for a firm’s country of incorporation and the type of industry in which it operates. To account for evidence that suggests that measures of firm performance tend to revert to their means over time (Penman, 1991; Puopolo, 2017), we controlled for lagged Tobin’s Q (i.e. its 2008 level).
Before creating the cross-products, we standardized all continuous independent variables (Echambadi et al., 2006) to facilitate the interpretation of effects and comparison of beta coefficients across different variables with different scales.
We also tested for multicollinearity among the regressors. Although variance inflation factors (VIFs) are neither necessary nor sufficient indicators of multicollinearity, especially in interaction models (Echambadi and Hess, 2007), we found values below the commonly accepted threshold of 10 (Hair et al., 2005) when calculating VIFs for first-order terms and before mean-centering our measures. As Maddala and Lahiri (2009) recommended, we also looked further for unexpected changes in coefficients or their significance levels following the stepwise inclusion of variables, as well as across our five estimation models, and we did not find them to be present. Accordingly, we conclude that our model specifications are robust to multicollinearity. Finally, using Hall’s (1987) joint test of model misspecification, we did not reject the null hypothesis of residual homoscedasticity, symmetry, and kurtosis even for our most elaborate specification (p < 0.31).
Accounting for endogeneity issues
A possible concern is that a relationship between BMR breadth and performance could be inflated because of an endogeneity problem, especially self-selection into (highly performing) BMR by high-quality firms. To obtain unbiased estimates of the effect of BMR on performance, we adopted a two-pronged approach. First, we emulated a difference-in-differences estimator. The cross-sectional sample allowed us to compare firms that did and did not change their business models. Then, by taking the difference in—rather than the level of—the logarithm of Tobin’s Q as the dependent variable, we avoided the problem of unobserved differences between firms that changed and those that did not change their business models (Roberts and Whited, 2013).
Second, we used a two-step estimation procedure to check the robustness of our findings. Like recent studies in management (e.g. Rao and Greve, 2018), we adopted a control function approach (CFA) (Cameron and Trivedi, 2010; Imbens and Wooldridge, 2007). The advantage of a CFA is its greater efficiency than direct instrumental variables when nonlinear functions of endogenous explanatory variables are added to a model. Indeed, the right-hand side of our model included both the squared term of BMR breadth and its interactions with innovation and past profitability. In the first stage, we estimated a reduced-form specification by regressing the possibly endogenous BMR breadth on the exogenous variables from the original regression and the additional variables that are used as “instruments” for BMR breadth. In the second stage, as a way to control for possible endogeneity of BMR breadth, we estimated the main specification after controlling for the estimated residuals from the reduced-form specification. The “Implementing a control function approach” section of Appendix 1 presents further details of the approach.
Results
Table 4 presents the descriptive statistics and correlations of the weighted variables used in the regression analysis. We present the results of the main empirical model linking BMR breadth and Tobin’s Q growth in Table 5. Reported coefficients are multiplied by 100 for ease of exposition. The first two models are the baseline models and include the direct effect of BMR breadth (and BMR breadth squared in Model 2) on Tobin’s Q growth while also accounting for other independent and control variables. Model 3 evaluates the joint effect of BMR breadth (and its squared term) and past profitability on Tobin’s Q growth, and Model 4 assesses the joint effect of BMR breadth (and its squared term) and innovation on Tobin’s Q growth. Model 5 represents the fully specified model assessing the effect of BMR breadth and its interaction with both past profitability and innovation as a robustness check. The analysis of interaction effects, below, is focused primarily on the more parsimonious Models 3 and 4 to avoid the potential danger of overfitting models by including too many terms for the number of observations.
Descriptive statistics and correlation table for weighted variables.
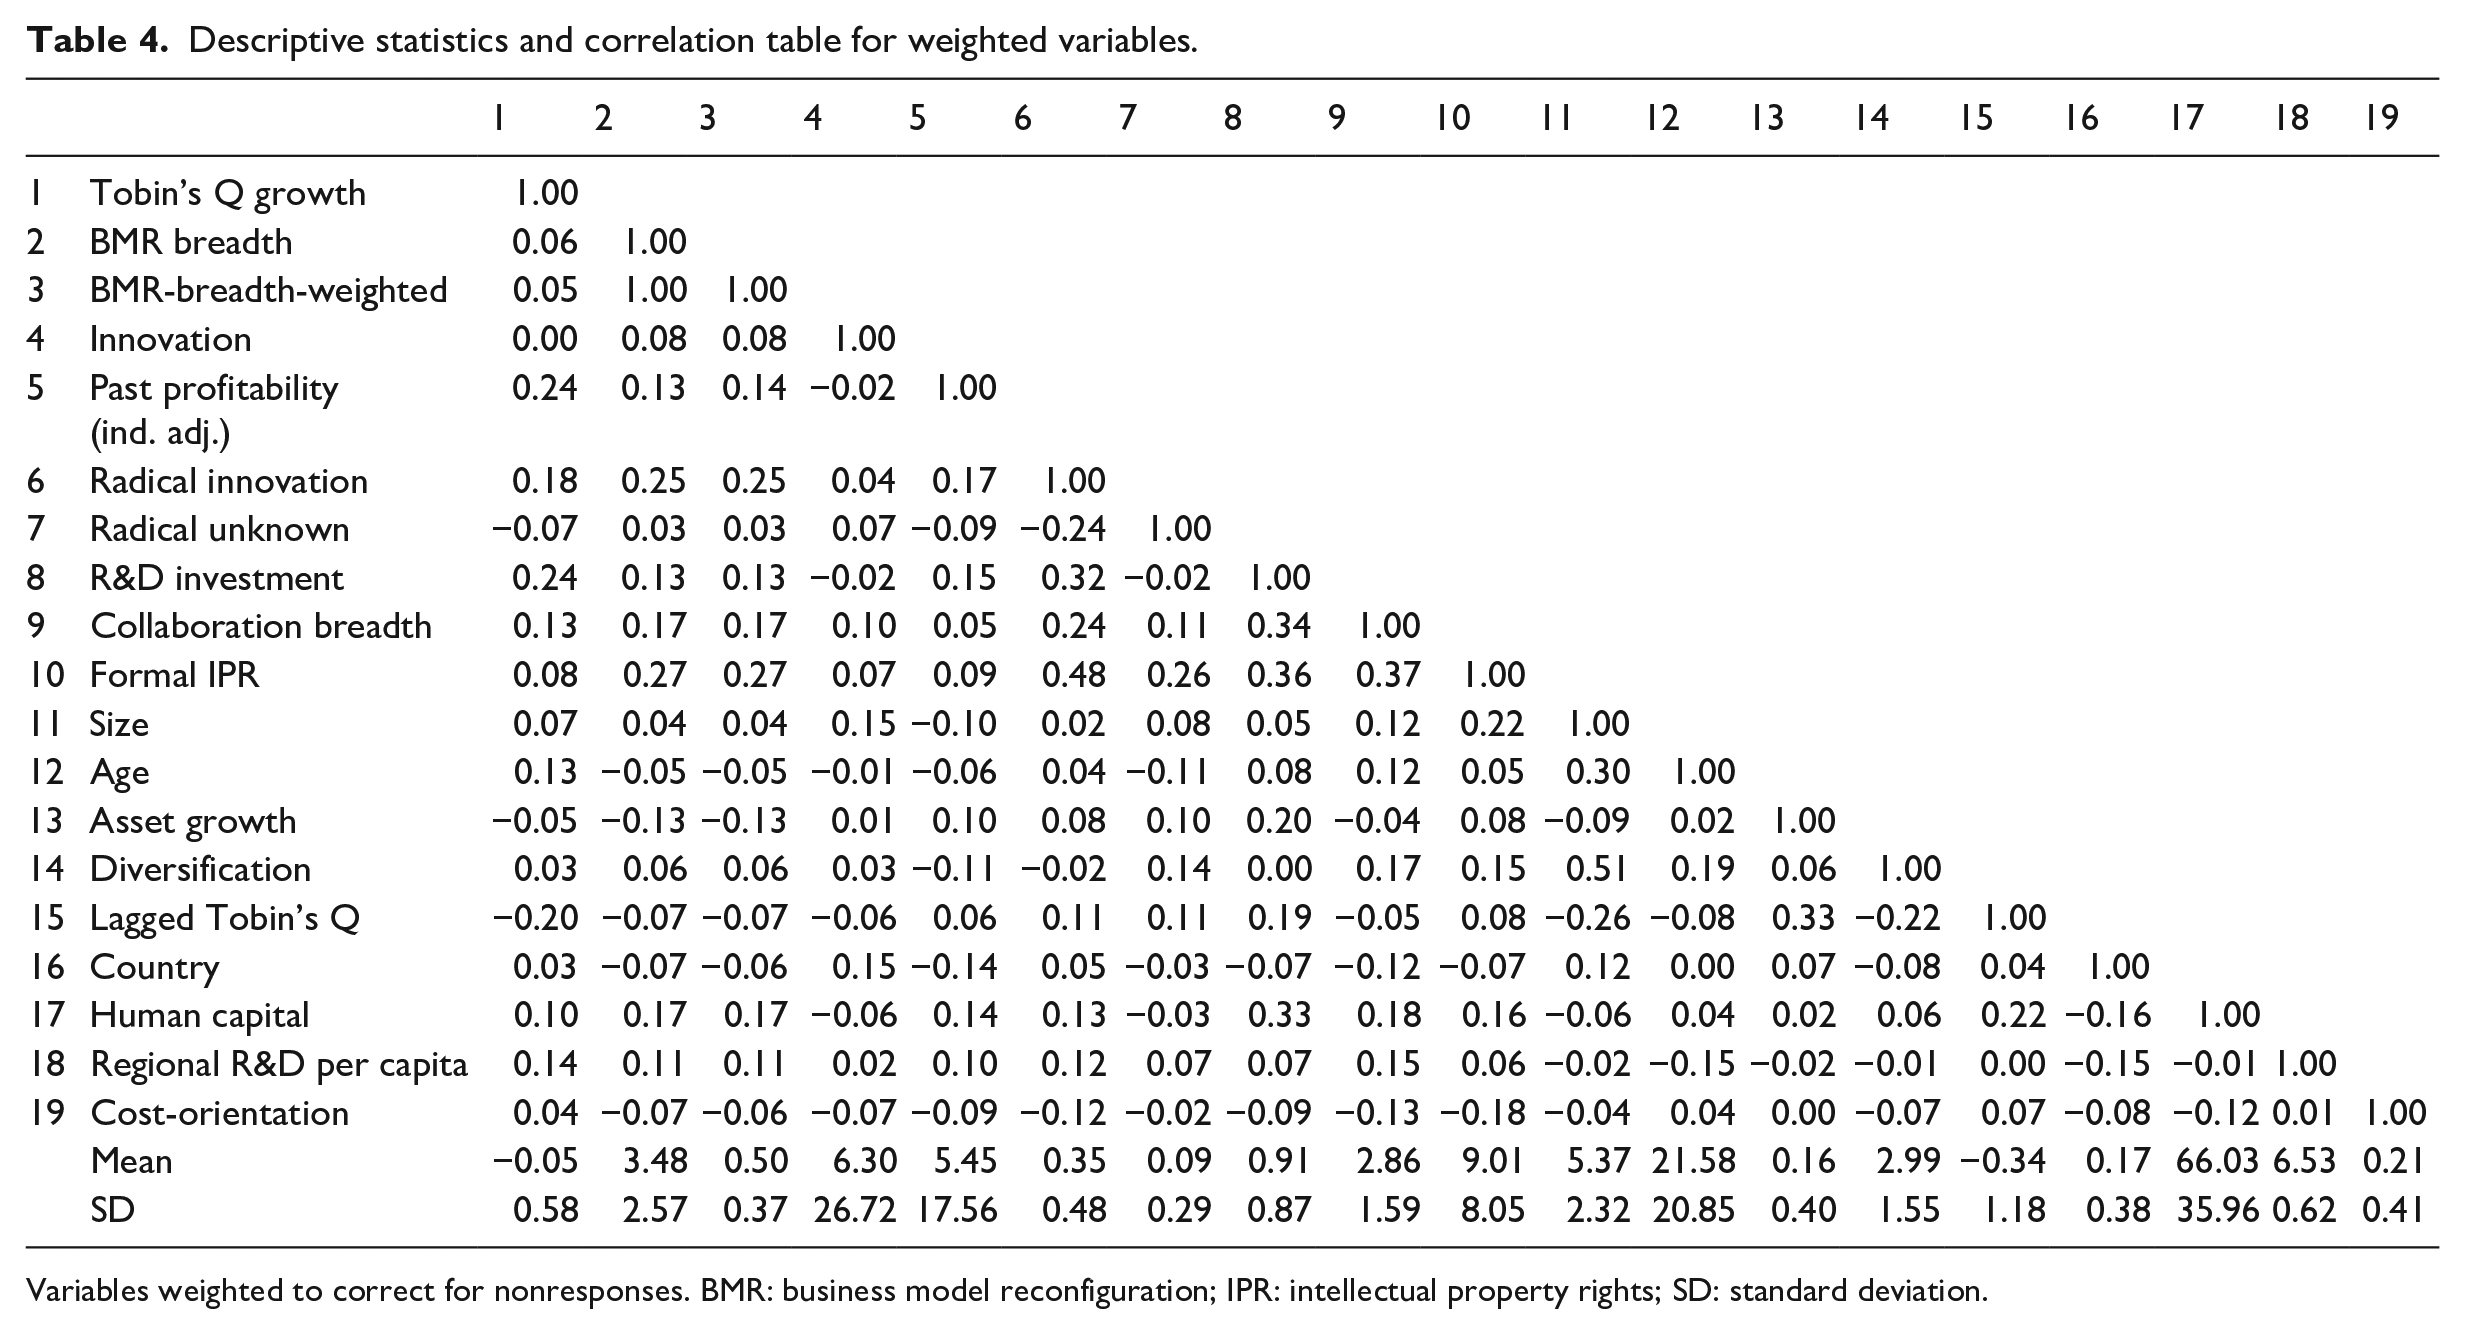
Variables weighted to correct for nonresponses. BMR: business model reconfiguration; IPR: intellectual property rights; SD: standard deviation.
Weighted least squares regression results (N = 198).
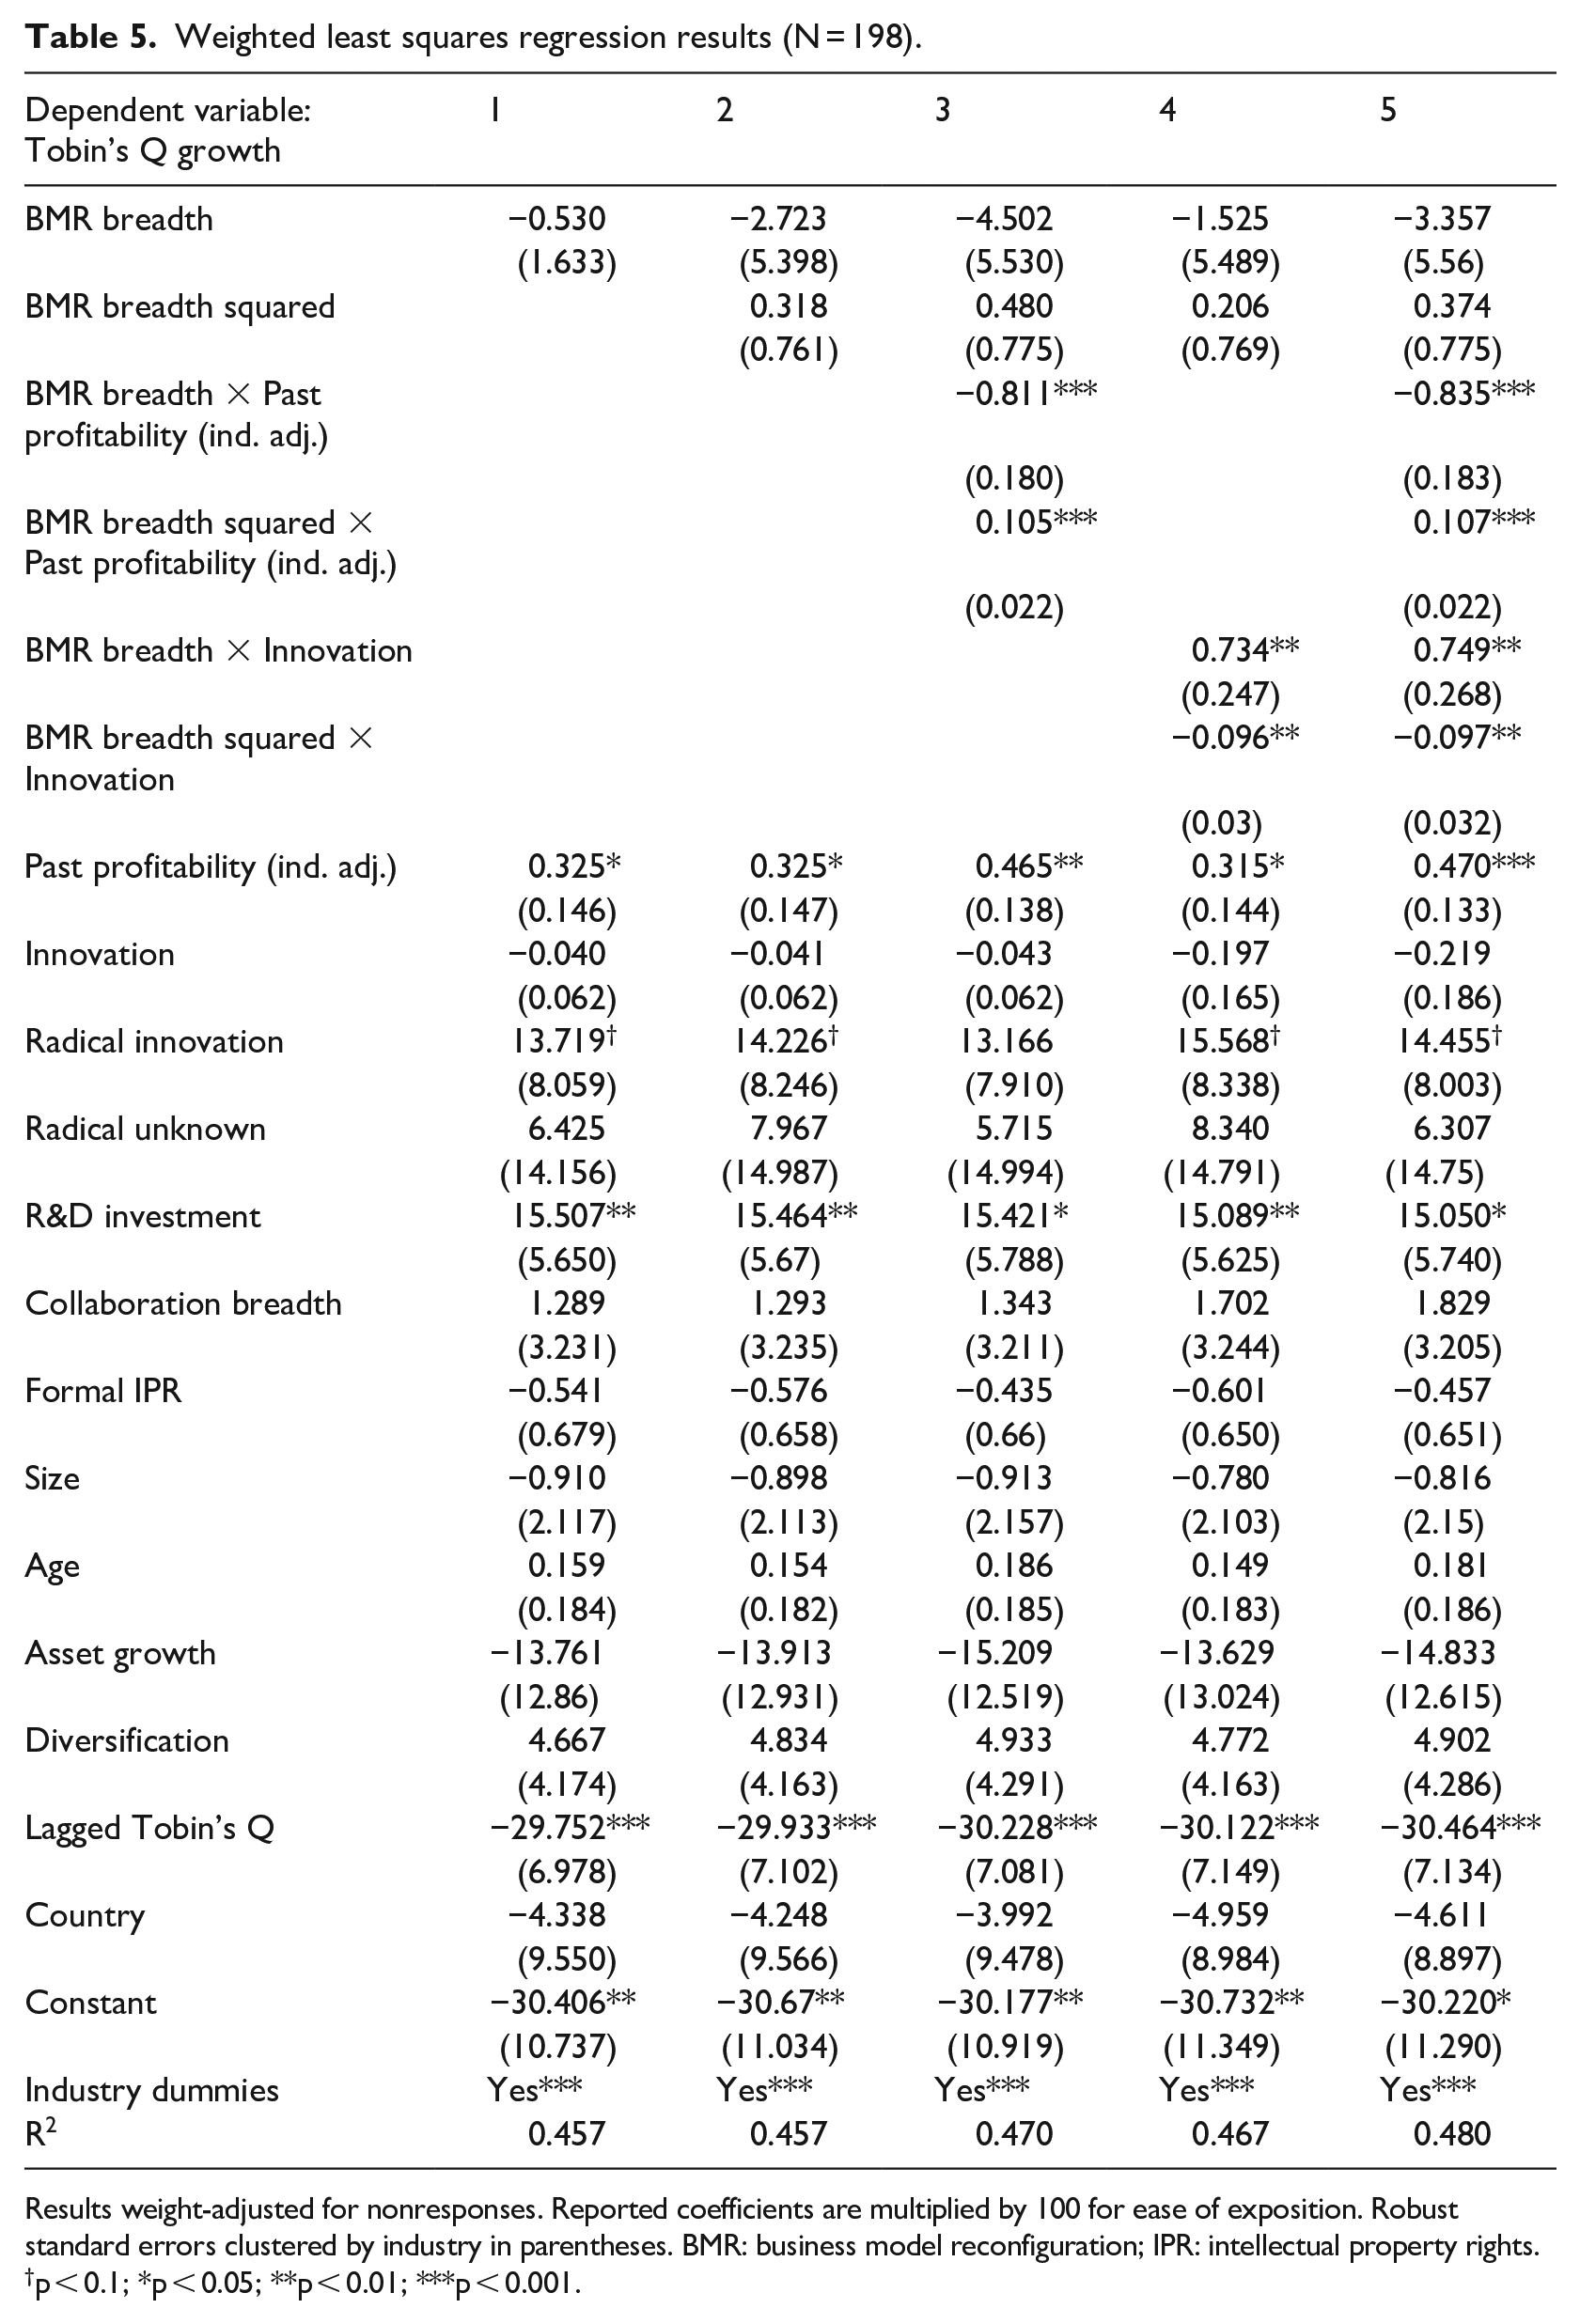
Results weight-adjusted for nonresponses. Reported coefficients are multiplied by 100 for ease of exposition. Robust standard errors clustered by industry in parentheses. BMR: business model reconfiguration; IPR: intellectual property rights.
p < 0.1; *p < 0.05; **p < 0.01; ***p < 0.001.
As far as the direct effect of BMR breadth is concerned, the coefficients of the first- and second-order terms associated with BMR breadth are statistically insignificant across the five models estimated. Thus, we did not find support for Hypothesis 1, which predicted an inverted U-shaped relationship between BMR breadth and firm performance when all the firms are pooled together irrespective of their past profitability and innovation.
In Hypothesis 2, we had predicted a flexing of the BMR performance link for firms that showed high past financial performance in comparison with their competitors. In line with this argument, Model 3 shows a significantly positive interaction effect for BMR breadth squared and past profitability (β = 0.105, p < 0.001) and a significantly negative interaction effect for BMR breadth and past profitability (β = –0.811, p < 0.001) on Tobin’s Q growth. To facilitate a better understanding of this finding, we graph the interaction according to the guidelines of Aiken et al. (1991). Figure 4 graphs the predicted association. When past profitability is high, the curve linking BMR breadth and Tobin’s Q growth becomes convex. We used a Wald test to check the statistical significance of the slope of the curves at different levels of BMR breadth (Haans et al., 2016). The slope of the curve is significantly negative when BMR breadth equates to one element (slope = –0.14, χ2 = 4.91, p < 0.05) and three elements (slope = –0.05, χ2 = 3.24, p < 0.10), but it turns significantly positive when BMR breadth equates to six elements (slope = 0.09, χ2 = 3.28, p < 0.10). These results suggest that firms with records of strong performance may not benefit from BMR unless they reconfigure a broad range of business model elements. In the case of firms with poor past profitability (we use the minimum sample value of industry-adjusted past profitability = –1.19 because this is greater than the value of 1 standard deviation below the mean value), increasing BMR breadth has an insignificant effect on Tobin’s Q growth. The slope of the estimated curve ranges from 0.004 (χ2 = 0.01, p = 0.93) to −0.004 (χ2 = 0.07, p = 0.79) and to −0.017 (χ2 = 0.10, p = 0.75) when BMR breadth equates to one, three, and six elements, respectively. The more complex specifications in Model 5 confirm these results. Taken together, these patterns provide support for Hypothesis 2.
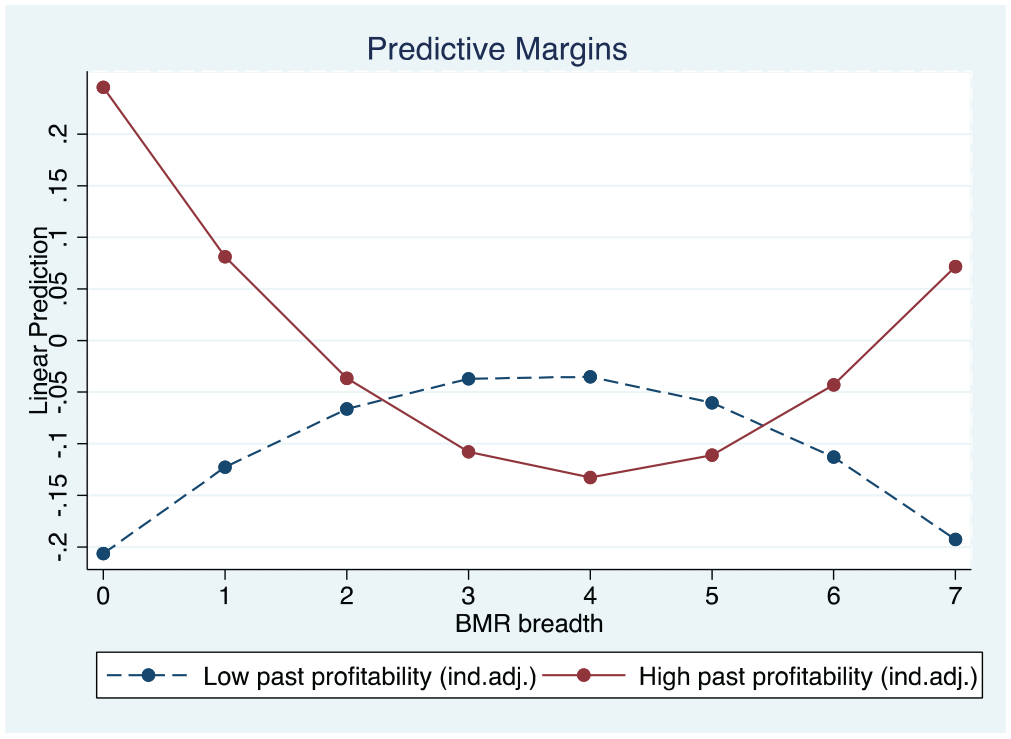
Relationship between BMR breadth and Tobin’s Q growth by past profitability.
Hypothesis 3 predicted a steeper inverted U-shaped curvilinear relationship between BMR breadth and performance as innovative activity increases. In line with this argument, in Model 4, we see a significantly negative interaction effect between BMR breadth squared and innovation (β = –0.096, p < 0.01) and a significantly positive interaction effect between BMR breadth and innovation (β = 0.743, p < 0.01) on Tobin’s Q growth. Figure 5 illustrates the predicted association at different levels of innovation. The curve linking BMR breadth and performance flips from a modest U-shape to an inverted U-shape when a firm introduces 8.4 innovations (which exceeds the weighted sample mean of 6.3). For a firm possessing “many” innovations (mean + SD = 33), we obtained an inverted U-shaped curve, with its turning point occurring at 3.8 business model elements. In the case of a firm possessing “many” innovations, when BMR breadth equates to one element the slope is significantly positive (slope = 0.13, χ2 = 3.52, p < 0.10), but when BMR breadth equates to six elements the slope becomes significantly negative (slope = –0.10, χ2 = 3.24, p < 0.10). For comparison purposes, we also generated a curve that becomes even steeper in depicting the relationship when firms introduce “very many” innovations (2 standard deviations above the mean). As seen in Figure 5, when innovation is low (a single innovation), Tobin’s Q growth is not significantly affected by BMR breadth. The slope of the curve is statistically insignificant when BMR breadth equates to one element (slope = –0.01, χ2 = 0.08, p = 0.78) or six elements (slope = 0.01, χ2 = 0.08, p = 0.78). Finally, we found evidence that the effect of BMR breadth on Tobin’s Q growth differs significantly between firms with “few” and “many” innovations when BMR breadth equals 3.8 (i.e. at the turning point; χ2 = 9.52, p < 0.01). All findings are confirmed by the more complex specifications in Model 5. Taken together, these patterns lend support to Hypothesis 3.
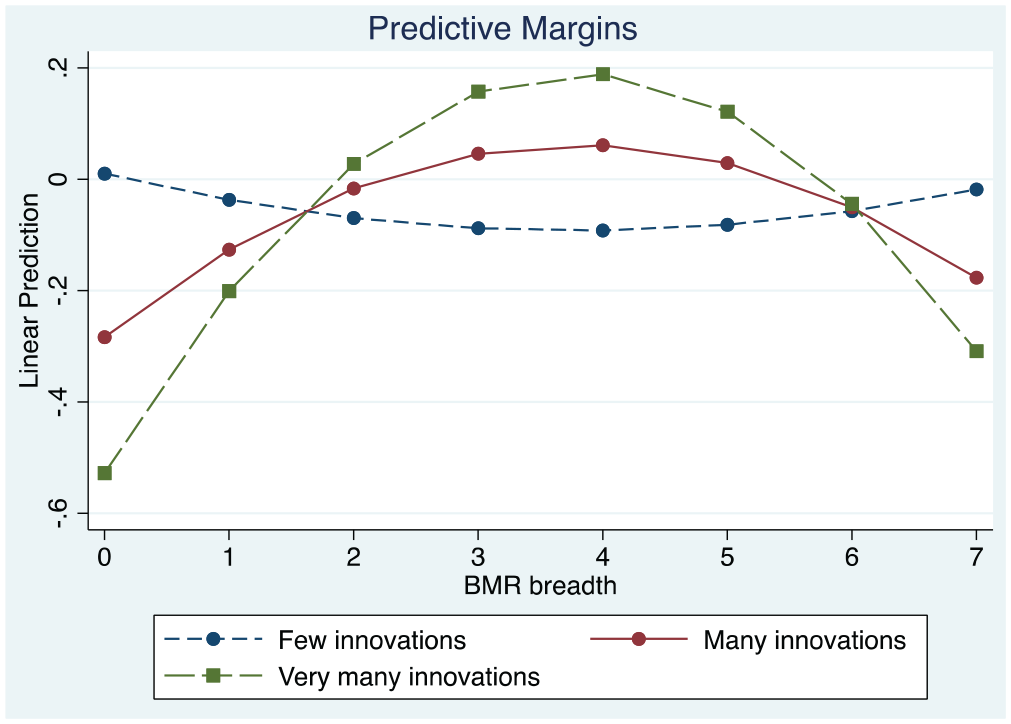
Relationship between BMR breadth and Tobin’s Q growth by innovative activity.
Sensitivity analyses
To explore the robustness of these results, we undertook a range of additional analyses. First, we used the CFA approach to test the sensitivity of our findings to the presence of BMR breadth endogeneity. As can be seen in Models 1 to 3 of Table 6, the second-stage regression results remain qualitatively identical to the results of Table 5. The coefficients of our key explanatory variables retain their sign, are of similar magnitude, and have similar levels of significance. Next, we checked the sensitivity of our findings to the measurement of BMR breadth. Instead of assuming changes across the seven business model elements to be equally important, we allowed for changes to differentially impact the index of BMR breadth, by drawing on our BMR-breadth-weighted variable. Thus, in Models 4 to 6 of Table 6, although the coefficients’ magnitude changes relative to the results in Table 5 (which was anticipated because of the different measurement scales of BMR breadth), all findings from Table 5 are corroborated.
Sensitivity analysis regression results (N = 198).
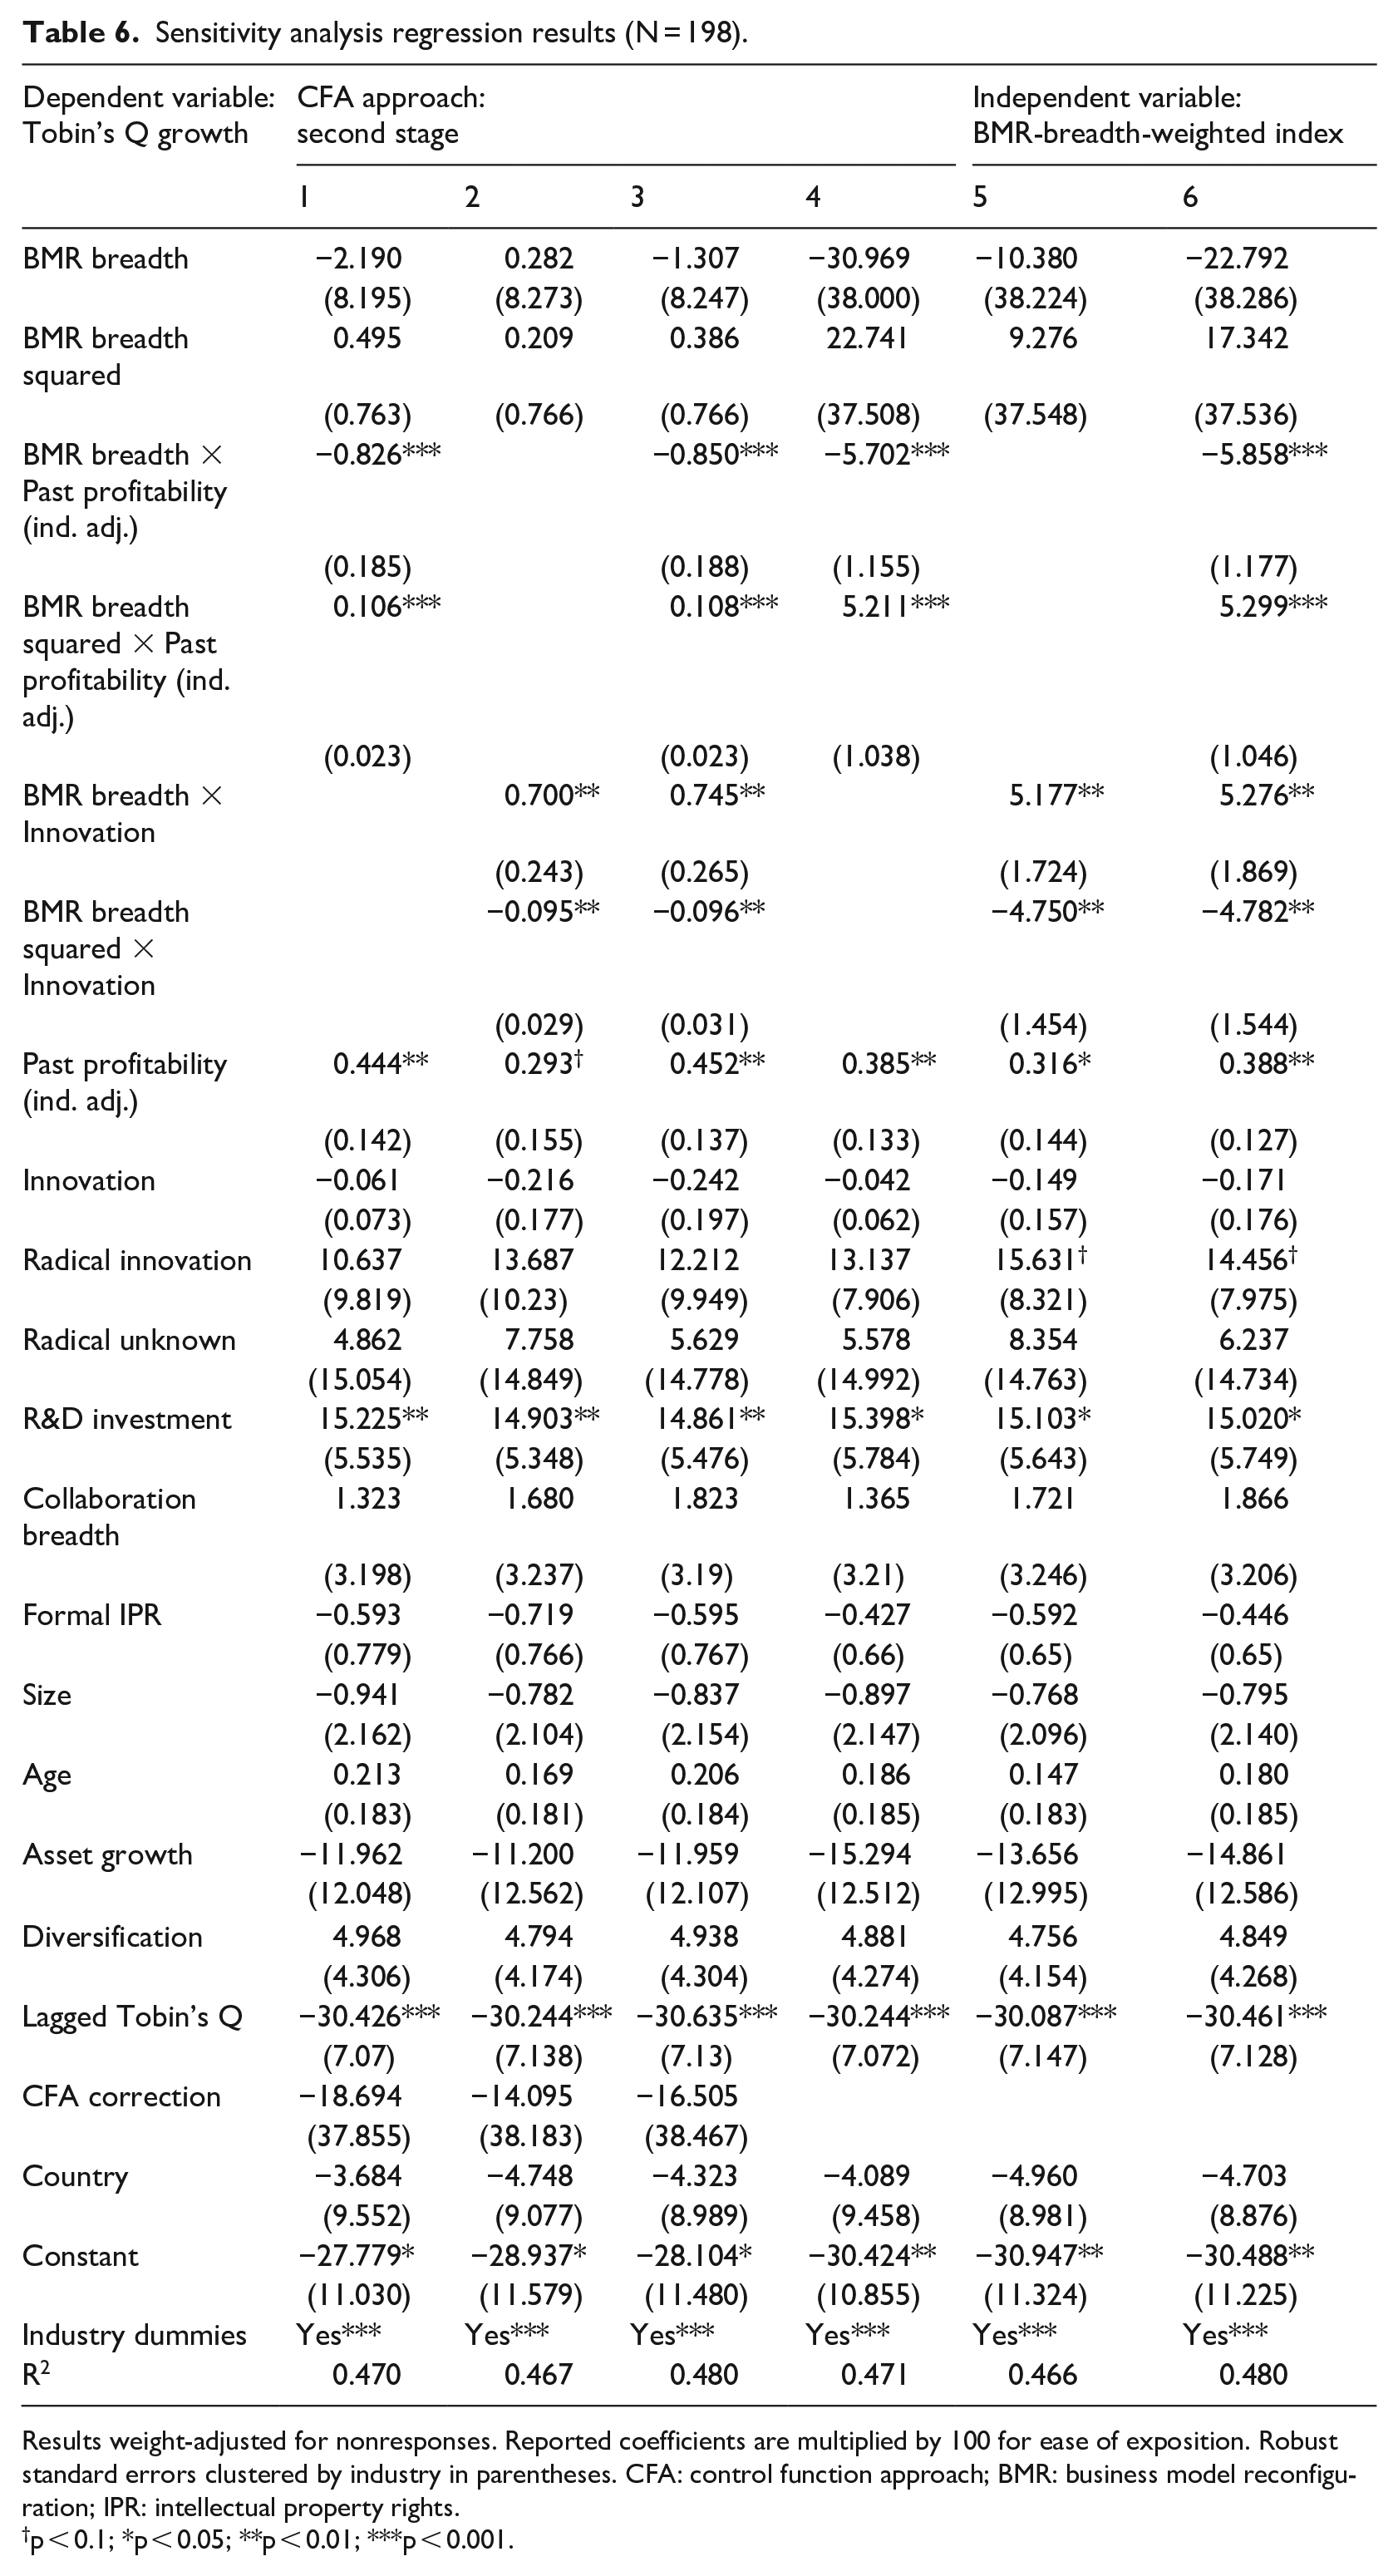
Results weight-adjusted for nonresponses. Reported coefficients are multiplied by 100 for ease of exposition. Robust standard errors clustered by industry in parentheses. CFA: control function approach; BMR: business model reconfiguration; IPR: intellectual property rights.
p < 0.1; *p < 0.05; **p < 0.01; ***p < 0.001.
Furthermore, acknowledging the different theoretical perspectives on the links between the business model and the competitive strategy, 11 we checked the robustness of our findings when we excluded strategy from the constituent elements of the business model and thus from the measure of BMR breadth. The BMR breadth index now runs from zero to six elements. Despite this change, all the findings continue to hold (results are available upon request). All these checks increase confidence in our findings.
Finally, we also explored an interaction of BMR breadth with both of our moderating variables at the same time. However, given the comparatively small size of our sample, it is unsurprising that the respective coefficients fail to achieve meaningful significance levels (β = 0.331, p = 0.18 and β = –0.040, p = 0.17 for the interaction with BMR breadth and BMR breadth squared, respectively).
Discussion
In this article, we conceived of business models as configured systems of interdependent elements and explored the opportunities and challenges of BMR. Our focus on the breadth of BMR serves as a lens to help us understand how such changes shape the performance outcomes of BMR within established firms. Although, a greater BMR breadth increases opportunities to improve performance, it also entails higher search costs and raises the likelihood of coordination failure. Our conceptual framework emphasizes the importance of finding the right balance between adaptation and stability in producing BMR that is truly performance enhancing. It also highlights the conditional nature of the advantages stemming from BMR.
Our analysis showed that, on average, BMR is not associated with significantly better or worse firm performance, irrespective of its breadth. Rather, and consistent with our expectations, our analysis demonstrates that the performance implications of the breadth of BMR are highly context specific and depend on a firm’s past performance as well as the level of innovation around which BMR is built. That is, BMR can be beneficial when it is initiated by firms that have achieved superior past performance and that embark on a broad (high-risk) search for a radically different business model 12 and also when initiated by firms that combine high levels of innovation with medium levels of BMR breadth. In all other instances, BMR efforts may either be in vain or may even harm performance, especially when firms deviate from previously well-performing business model configurations.
Implications for theory
Our study contributes to research on business models in three main ways. First, it sheds additional light on the theoretical and empirical links between BMR and subsequent performance within incumbent firms. Specifically, we highlight both the value-creating opportunities and the challenges associated with BMR and explore the delicate balance between them. Our results clearly reiterate that business model research needs to embrace the interdependency and complementary logic inherent in this perspective (Foss and Saebi, 2017, 2018; Siggelkow, 2011). In this context, ours is among the first empirical studies that can also showcase this argument empirically. As such, at the most general level, our results would imply that the BMR performance link is inextricably tied to a firm’s current competitive position and future ambitions. We also highlight how incumbents looking to apply new business model elements need to look beyond whether or not these are conflicting with their existing resource base (Kim and Min, 2015) or value-generating activity systems (Zott and Amit, 2007) and pay attention to interdependencies between the manifold elements that play a role in how firms create, deploy, or capture value in a way that has both internal and external fit (Siggelkow, 2001, 2002, 2011; Zott and Amit, 2008).
Second, in so doing, we unpack two specific contingencies driving the conditional value of BMR. Our findings relating to firms’ past performance not only lend additional credence to the largely simulation-based strategy literature from which we drew many of our initial arguments (Csaszar and Siggelkow, 2010; Rivkin and Siggelkow, 2003; Siggelkow and Levinthal, 2003), but also highlight how the issue of becoming stuck-in-the-middle (Velu, 2015) extends beyond new firms. In terms of BMR, it should largely be seen as an issue for currently successful, rather than unsuccessful, incumbents. In this result, we see a potential link to the literature around disruptive innovation (Christensen, 1997; Tripsas and Gavetti, 2000), as we are highlighting yet again that incumbent firms striving for future success may be impeded, rather than enabled, by trying to leverage their existing business approaches. Having said that, our data reveal some successful firms that have been able to shift their business model dramatically, so there may be great value in enquiring how to respond to disruption through BMR, or, possibly, how it is that BMR may—accidentally or purposively—enable disruption in the first place (Christensen et al., 2015; Hwang and Christensen, 2008; Markides, 2006).
In terms of our findings on the moderating effect of innovation, we give clear support to the argument that innovation may benefit from accompanying business model change (Chesbrough et al., 2006; Chesbrough and Rosenbloom, 2002; Teece, 2010), but also point to some important boundary conditions. Specifically, our results highlight a trade-off between the breadth of firms’ BMR and the novelty of the products and processes they introduce. Firms heavily active in innovation benefit most from a medium level of business model adaptation, rather than trying to establish their new products and processes within their existing business model or creating an entirely new one. To us, this would suggest treating business models used to deploy innovation as a form of related diversification. An intriguing question follows—which we cannot answer given the structure of our data—as to whether successful firms would first consider BMR or only adapt it subsequently having identified new technological opportunities. Finally, in this area, our results also reveal an interesting corner solution, in which firms not at all active in innovation get almost zero benefit from any form of BMR and may even benefit from not engaging in BMR at all. While we would hesitate to generalize from this empirical insight, it may nevertheless point to several interesting questions for future research: first and foremost, whether BMR on its own (i.e. without product or process innovation) can actually have any effect. Alternatively, our results may be read as an indication—to be corroborated by additional work—of the benefits of exploitation strategies. In this case, firms with no intent to innovate on the products and services they sell might be well advised to keep their business model unchanged, as the costs of searching for a new business model seem to be higher than any potential benefit they may achieve through BMR.
Third, we also make an empirical contribution to the business model literature. Specifically, in following the call to clarify business model and BMR constructs through the development of a new measurement scale (Arend, 2013; Foss and Saebi, 2017, 2018), our study may enable better exploration of the implications of BMR breadth across different industries and contexts in the future.
Implications for practice
The implications for practice arising from our study provide a cautionary note to expectations built on BMR. Importantly, our findings suggest that, like other popular management practices such as outsourcing or open innovation, BMR is not a silver bullet that will instantly or necessarily improve performance. Instead, we show how it is crucial to acknowledge that the systematic nature of BMR requires careful consideration of the existing complementarities among business model elements, firm position and strategy, as well as the coordination challenges of reconfiguration. It also requires an awareness of how to bring about changes in interdependent systems with consideration for, and the engagement of, a variety of internal and external stakeholders. In other words, BMR may indeed be a tool of great impact (Girotra and Netessine, 2014), but it needs to be carefully honed and grafted into the organization and aligned to other competitive moves.
Limitations and suggestions for future research
The findings of this study should be considered in the context of its limitations. As our approach focused on the breadth of BMR in terms of the number of changes in a firm’s business model, we offer no insights into how the depth of BMR in any one dimension, or the density of interdependencies across several dimensions, may be a further influence on performance. It is possible that specific patterns of business model change may result in greater coordination problems or, indeed, be associated with superior performance. Future research could use other measures of BMR or different analytical techniques—such as qualitative comparative analysis (see Aversa et al., 2015; Täuscher, 2017) or NK-models combined with empirical inquiries (Baumann et al., 2019)—to identify possibly sufficient conditions for the success of BMR activity. Here, we also note how a full configurational perspective remains absent from business model research, and, in particular, from the transactional view that is currently dominant (Massa et al., 2017).
In addition, although we measure innovation and BMR breadth, we do not examine the precise combinations of these two elements within the organization. It may be that the complementarity arising from BMR breadth and innovation is itself tied to the degree of interdependence between the innovation itself and the new or existing business models. It may also be that the coordination challenges of high levels of BMR and innovation can be attenuated by organizational design practices, such as modularity, which we do not observe. More research is required into how business models map onto different innovations and into how innovations themselves may generate new business models or BMRs.
We also concede that our research into BMR activity is limited here to firms that modify several of their existing business model’s constituent elements. We purposefully chose to avoid the complexity of cases in which firms add and run several business models simultaneously (Markides and Charitou, 2004; Velu and Stiles, 2013). There are instances, however, especially among new ventures, which often engage in a series of related business model experiments to deal with uncertainty (see, for example, Andries et al., 2013) when firms adopt new business models in parallel to their existing one. Our chosen approach to BMR, which was studied in the context of incumbent firms, aimed to increase the likelihood of establishing clarity regarding any relationship between BMR breadth and firm performance (see also Amit and Zott, 2001).
Furthermore, our analysis focused on KIBS firms from the United Kingdom and the United States, which may limit its wider generalizability. Although such firms are an important and growing part of the economic system, they differ from more traditional manufacturing firms. It may be hard for market participants to fully quantify changes in their business models because of the immateriality of their outputs and the limited physical imprint of these changes. Moreover, by focusing exclusively on firms from these two countries, we have not been able to comment on any international differences in the BMR performance link. Future research should seek to compare BMR in manufacturing and services industries to help determine whether the industrial context shapes market responses to BMR. It would, likewise, be worthwhile studying BMR in firms from developing countries.
Finally, our estimation approach provides only a partial remedy for the potential endogeneity of BMR breadth. The use of the growth of Tobin’s Q, and not its level, with our two-stage estimation approach is far from being a definitive solution. It may be that BMR breadth spurs an increase in performance, and, in turn, more BMR breadth. Although our cross-sectional study serves as a useful starting point (Foss and Saebi, 2017), future work could adopt a research design with a temporal dimension and/or with instruments that allow for stronger causal identification.
In addition, and beyond the suggestion for future research already made above, we see one particularly promising avenue for future research, which follows from the literature on innovation studies from which we have borrowed the idea of breadth. Here, the concept of depth, meaning the frequency by which one element is repeatedly used (Laursen and Salter, 2006), and the degree of interdependence between elements—that is, the likelihood that one change will also require a change in another (MacCormack et al., 2006)—represent important concepts that could help business model literature expand further. Similarly, there may be great value to this literature in drawing further on recent advances in strategy literature in relation to modeling and simulations (Baumann et al., 2019; Posen et al., 2018; Puranam et al., 2015), as we have begun to do in this article.
Footnotes
Appendix 1
Acknowledgements
The article has benefited from the feedback provided by the editor and three anonymous referees. The authors gratefully acknowledge comments on earlier versions of the paper by the referees and audience at the Strategic Management Society and the Academy of Management annual conferences and workshops at Bath, TUM, Cambridge and Manchester. They also thank Charles Baden-Fuller, Tomi Laamanen, Bruce Tether, and Edmund Thompson for suggestions and Ian Miles, Marcela Miozzo, and Hsing-fen Lee for their contribution to developing and carrying out the survey.
Declaration of conflicting interests
The author(s) declared no potential conflicts of interest with respect to the research, authorship, and/or publication of this article.
Funding
The author(s) disclosed receipt of the following financial support for the research, authorship, and/or publication of this article: Desyllas acknowledges support from the Economic and Social Research Council (ESRC; No. RES-062-23-3250).