
Abstract
Accurate identification of modal parameters from ambient vibration data is critical for the assessment and monitoring of large-scale civil structures. However, long-term structural health monitoring data often suffer from noise, non-stationarity, and low-information intervals, which can compromise the reliability of operational modal analysis (OMA). To address these challenges, this study proposes an automated signal quality–based framework that integrates an aggregated statistical indicator, including standard deviation, skewness, kurtosis, root mean square value, crest factor, and total frequency energy, with multivariate variational mode decomposition to enable robust modal identification using short data segments. Multichannel acceleration data are segmented and ranked based on multiple statistical and signal-based features to automatically select the most informative segment across all sensors. The selected segment is then analyzed to extract natural frequencies, damping ratios, and mode shapes while preserving inter-channel dependencies. The proposed framework is validated using full-scale ambient vibration data from three large civil structures (Milad Tower, Canton Tower, and Hardanger Bridge). The results demonstrate stable and accurate modal identification from short data records, with consistent modal parameters across different segment durations. Comparative evaluations against established OMA methods (FDD, EFDD, SSI-COV, and SSI-DATA) and conventional signal processing techniques (VMD, EMD, PSD, and FFT) confirm that the proposed approach achieves superior performance, particularly in identifying higher-order modes, while maintaining stable and reliable performance under varying environmental and operational conditions in long-term monitoring scenarios.
Keywords
Introduction
Ensuring the structural safety and continued serviceability of critical civil infrastructure such as long-span bridges and tall towers is essential for both public welfare and economic continuity. These structures are not only functional components of transportation and communication networks but also symbols of technological achievement and urban development. Their failure can result in significant social and economic consequences, making their monitoring and maintenance a top engineering priority.1,2 To address these needs, Structural Health Monitoring (SHM) has emerged as a powerful approach for assessing and maintaining structural integrity. SHM involves the systematic observation of structural behavior over time using data acquired from sensors installed on the structure. The primary objective of SHM is to detect damage at an early stage by monitoring changes in a structure’s dynamic characteristics.3,4 Central to this assessment is the accurate identification of modal parameters, specifically natural frequencies, damping ratios, and mode shapes.5–7 These parameters are highly sensitive to changes in the physical properties of a structure, such as stiffness, mass distribution, and boundary conditions and can therefore serve as reliable indicators of structural health.8,9
Despite the critical importance of modal identification in SHM, the accurate and efficient extraction of these parameters remains a complex task. This complexity is magnified in real-world contexts where structures are exposed to dynamic environmental and operational loads, such as wind, traffic, and seismic activity. Such loads often induce non-stationary and non-linear responses in the structural signals, which significantly complicate the analysis process. Furthermore, the immense volume of data generated by dense sensor networks introduces additional challenges, including high computational demands, noise contamination, data redundancy, and potential sensor malfunctions.10–15 Traditional signal processing methods, such as the Fast Fourier Transform (FFT) and Short-Time Fourier Transform (STFT), have been widely used to extract modal parameters from vibration signals. However, these techniques are primarily suited to stationary signals and are not sufficiently robust in the presence of nonlinear or non-stationary behaviors. The assumption of signal stationarity limits their effectiveness in practical SHM scenarios where time-varying dynamics are common.16–18
To overcome these limitations, adaptive signal decomposition techniques have been introduced. Empirical Mode Decomposition (EMD) was one of the first methods developed to handle non-stationary and nonlinear signals. EMD decomposes signals into a set of intrinsic mode functions (IMFs), each representing a simple oscillatory mode. Its enhanced variants, such as Ensemble Empirical Mode Decomposition and the EMD with Hilbert-Huang Transform, have further improved performance by reducing mode mixing and enhancing stability.19–22 Nevertheless, these methods still suffer from some key limitations, including sensitivity to signal noise, mode mixing in certain conditions, and limited applicability to univariate signals. In response, Variational Mode Decomposition (VMD) was proposed to address these issues by reformulating signal decomposition as an optimization problem. 23 VMD offers improved robustness to noise and a more precise resolution of signal components with close frequencies. It also allows for the decomposition of signals into modes with specific bandwidths, enhancing interpretability and analytical precision. Yet, even VMD is designed primarily for univariate signals and does not fully capitalize on the multichannel nature of data acquired in modern SHM systems.24–27
To exploit the rich spatial information captured by multiple sensors, Multivariate Variational Mode Decomposition (MVMD) extends the VMD framework to multichannel data. MVMD enables the simultaneous processing of multiple sensor signals, preserving the inter-channel relationships that are often critical in identifying consistent modal parameters across the structure. This multivariate approach allows for more accurate, consistent, and robust identification of dynamic features, particularly in scenarios involving complex or subtle structural changes. 28 Although MVMD offers significant benefits, most existing implementations assume that the entire recorded dataset must be processed to achieve accurate results. This assumption is inefficient and can be counterproductive, especially when large portions of the data are irrelevant or contaminated with noise. 29 In reality, only certain time segments may contain dominant structural responses that are useful for modal analysis. Processing the entire dataset in such cases not only increases computational costs but may also obscure important features due to the inclusion of low-quality data.
This study primarily aims to automatically calculate the natural frequencies of structures, in addition to identifying their mode shapes and damping ratios. This study introduces a novel and automated framework designed to enhance the efficiency and accuracy of MVMD-based SHM by selecting the most informative segment (the optimal segment) of the data before performing signal decomposition. The proposed method (Segment-Optimized Multivariate Variational Mode Decomposition (SO-MVMD)) involves dividing the acceleration data into segments and computing six indicators for each segment: standard deviation, kurtosis, skewness, root mean square error (RMSE), crest factor, and total frequency energy. These metrics are normalized and aggregated to rank the segments in terms of their information content and dynamic richness. The segment with the highest combined score is selected as the most representative portion of the dataset. This selected “best section” is then analyzed using MVMD to extract modal parameters. This dual-stage process reduces computational demands, increases noise resilience, and enhances the clarity of the extracted dynamic features. It also offers practical benefits, such as reducing the reliance on complete datasets, thereby increasing the method’s robustness against missing or corrupted data.
The effectiveness of this framework is demonstrated through its application to three real-world structures: the Hardanger Bridge in Norway, the Canton Tower in China, and the Milad Tower in Iran. Each of these structures presents unique challenges due to their scale, exposure to environmental loads, and sensor configurations. In all cases, the proposed method was able to accurately extract natural frequencies, damping ratios, and mode shapes from a limited portion of the dataset, confirming the power and suitability of the MVMD technique when combined with signal quality–driven data segmentation.
While MVMD has been previously employed for multichannel vibration analysis, it is not introduced in this study as a novel decomposition technique. The primary contribution of this work lies in the development of an automated, signal quality–driven data segment selection strategy that is applied prior to the decomposition stage. This strategy objectively evaluates and ranks short-time data segments using a composite score derived from multiple complementary statistical and signal-based indicators, including standard deviation, skewness, kurtosis, root mean square (RMS) value, crest factor, and total frequency energy. By integrating this segment optimization step with MVMD, the proposed framework enables reliable and efficient decomposition-based modal identification from partial, noisy, and long-term ambient vibration data. This integration improves data efficiency, enhances robustness against noise and non-stationarity, and increases the consistency of the extracted modal parameters. The effectiveness and practical relevance of the proposed framework are demonstrated through comprehensive validation on three full-scale and structurally diverse civil structures, highlighting its applicability to real-world monitoring scenarios.
Presentation of proposed method (SO-MVMD)
The methodology begins with a critical data preprocessing stage focused on identifying the most informative, optimal, and stable segments of measured acceleration signals. This is achieved by evaluating each time window using a combination of statistical and signal-based indicators, including standard deviation, kurtosis, skewness, RMSE, crest factor, and total frequency energy. These indicators collectively assess the signal’s variability, symmetry, energy content, impulsiveness, and frequency characteristics. Analyzing them concurrently ensures the selected data segment captures meaningful dynamic behavior while maintaining stability and robustness against noise. This initial step is crucial for ensuring subsequent analyses are based on data that accurately reflect the structure’s dynamic response.
Following this optimal segmentation, a multi-stage signal decomposition framework is implemented. The Daubechies 5 (db5) wavelet is applied first to handle the non-stationary nature of structural vibration data, providing a detailed time-frequency representation that isolates the free vibration response after excitation. Subsequently, MVMD processes multichannel signals jointly, preserving phase and frequency alignment across channels. This is essential for identifying consistent and physically meaningful mode shapes and natural frequencies and extracting IMFs that reveal key dynamic characteristics. This integrated approach, combining indicator-based selection, wavelet analysis, and MVMD, offers a robust, noise-resilient, and computationally efficient framework for SHM and modal parameter identification in large-scale civil structures.
Identifying the best data segment
In SHM and dynamic signal analysis, the quality of the data used in feature extraction plays a crucial role in the reliability of the final results. 30 One of the key steps in the proposed methodology is the selection of the best and optimal data segment from the recorded acceleration signals. Instead of analyzing the entire signal, some parts of which may contain noise, irrelevant fluctuations, or stationary phases, a more focused approach is used. The entire raw signal collected from each sensor is divided into several smaller, consecutive segments of equal length. This segmentation makes it possible to evaluate localized characteristics of the signal and identify which part contains the most useful information for dynamic analysis. For each of these smaller segments, six important statistical and signal-based indicators are calculated: standard deviation, skewness, kurtosis, RMSE, crest factor, and total frequency energy. These indicators were carefully chosen because they each offer a different perspective on the behavior and quality of the signal.
Standard deviation is a statistical measure of the dispersion or spread in a dataset. In the context of vibration signals, it quantifies how much the acceleration values deviate from their mean, indicating the signal’s variability or dynamic activity. Higher standard deviation values reflect greater fluctuations in the signal, which may correspond to structural vibrations or dynamic events, making this indicator useful for detecting active or responsive parts of the signal. Skewness measures the asymmetry of the data distribution around its mean and indicates whether a signal has a bias toward higher or lower values. A skewness value of zero represents perfect symmetry in the signal. Positive skewness suggests a longer tail on the right side of the distribution, meaning there are more high-value peaks, while negative skewness indicates a tail on the left, reflecting more low-value occurrences. This indicator is particularly useful for detecting nonlinear behaviors, irregularities, or imbalances in the structural response that may arise in specific time windows.
Kurtosis is a statistical measure that evaluates the “tailedness” or peakedness of a data distribution. In the context of vibration signal analysis, it is used to identify how sharply the signal values peak and whether there are outliers or sudden, impulsive events. A kurtosis value of 3 corresponds to a normal (Gaussian) distribution. Values greater than 3 suggest the presence of sharp peaks or heavy tails, which often reflect dynamic structural phenomena such as impacts, resonance, or sudden changes. This makes kurtosis a valuable indicator for detecting unexpected or transient structural responses. The RMSE is a widely used measure that reflects the overall energy or magnitude of a signal segment. In this context, RMSE does not refer to error relative to a model but rather to the RMS value of the signal’s amplitude. It is used to identify segments with higher energy levels, which often correspond to periods of meaningful structural activity or excitation. Conversely, segments with lower RMSE values are typically dominated by background noise or stationary phases and are therefore less informative for structural analysis.
The crest factor is defined as the ratio of the peak amplitude of a signal to its RMS value. It measures how extreme the highest peaks are in relation to the average energy of the signal. A high crest factor indicates the presence of sharp transients or sudden spikes, which are often associated with structural anomalies, impacts, or resonance phenomena. Total frequency energy quantifies the energy of the signal in the frequency domain. It is calculated by applying the FFT to convert the time-domain signal into its frequency components and then summing the squared magnitudes of these components. This indicator captures how much energy is distributed across the entire frequency spectrum. A segment with higher total frequency energy is more likely to contain a broad and rich range of structural vibrations, making it especially valuable for extracting modal characteristics and performing spectral analysis.
The formulas for all six indicators used to evaluate the data segments (standard deviation, skewness, kurtosis, RMSE, crest factor, and total frequency energy) are presented in full in Table 1. Each formula is accompanied by a clear explanation of its components to support accurate implementation and interpretation.31,32
Formulas for the six indicators used to evaluate data segments.
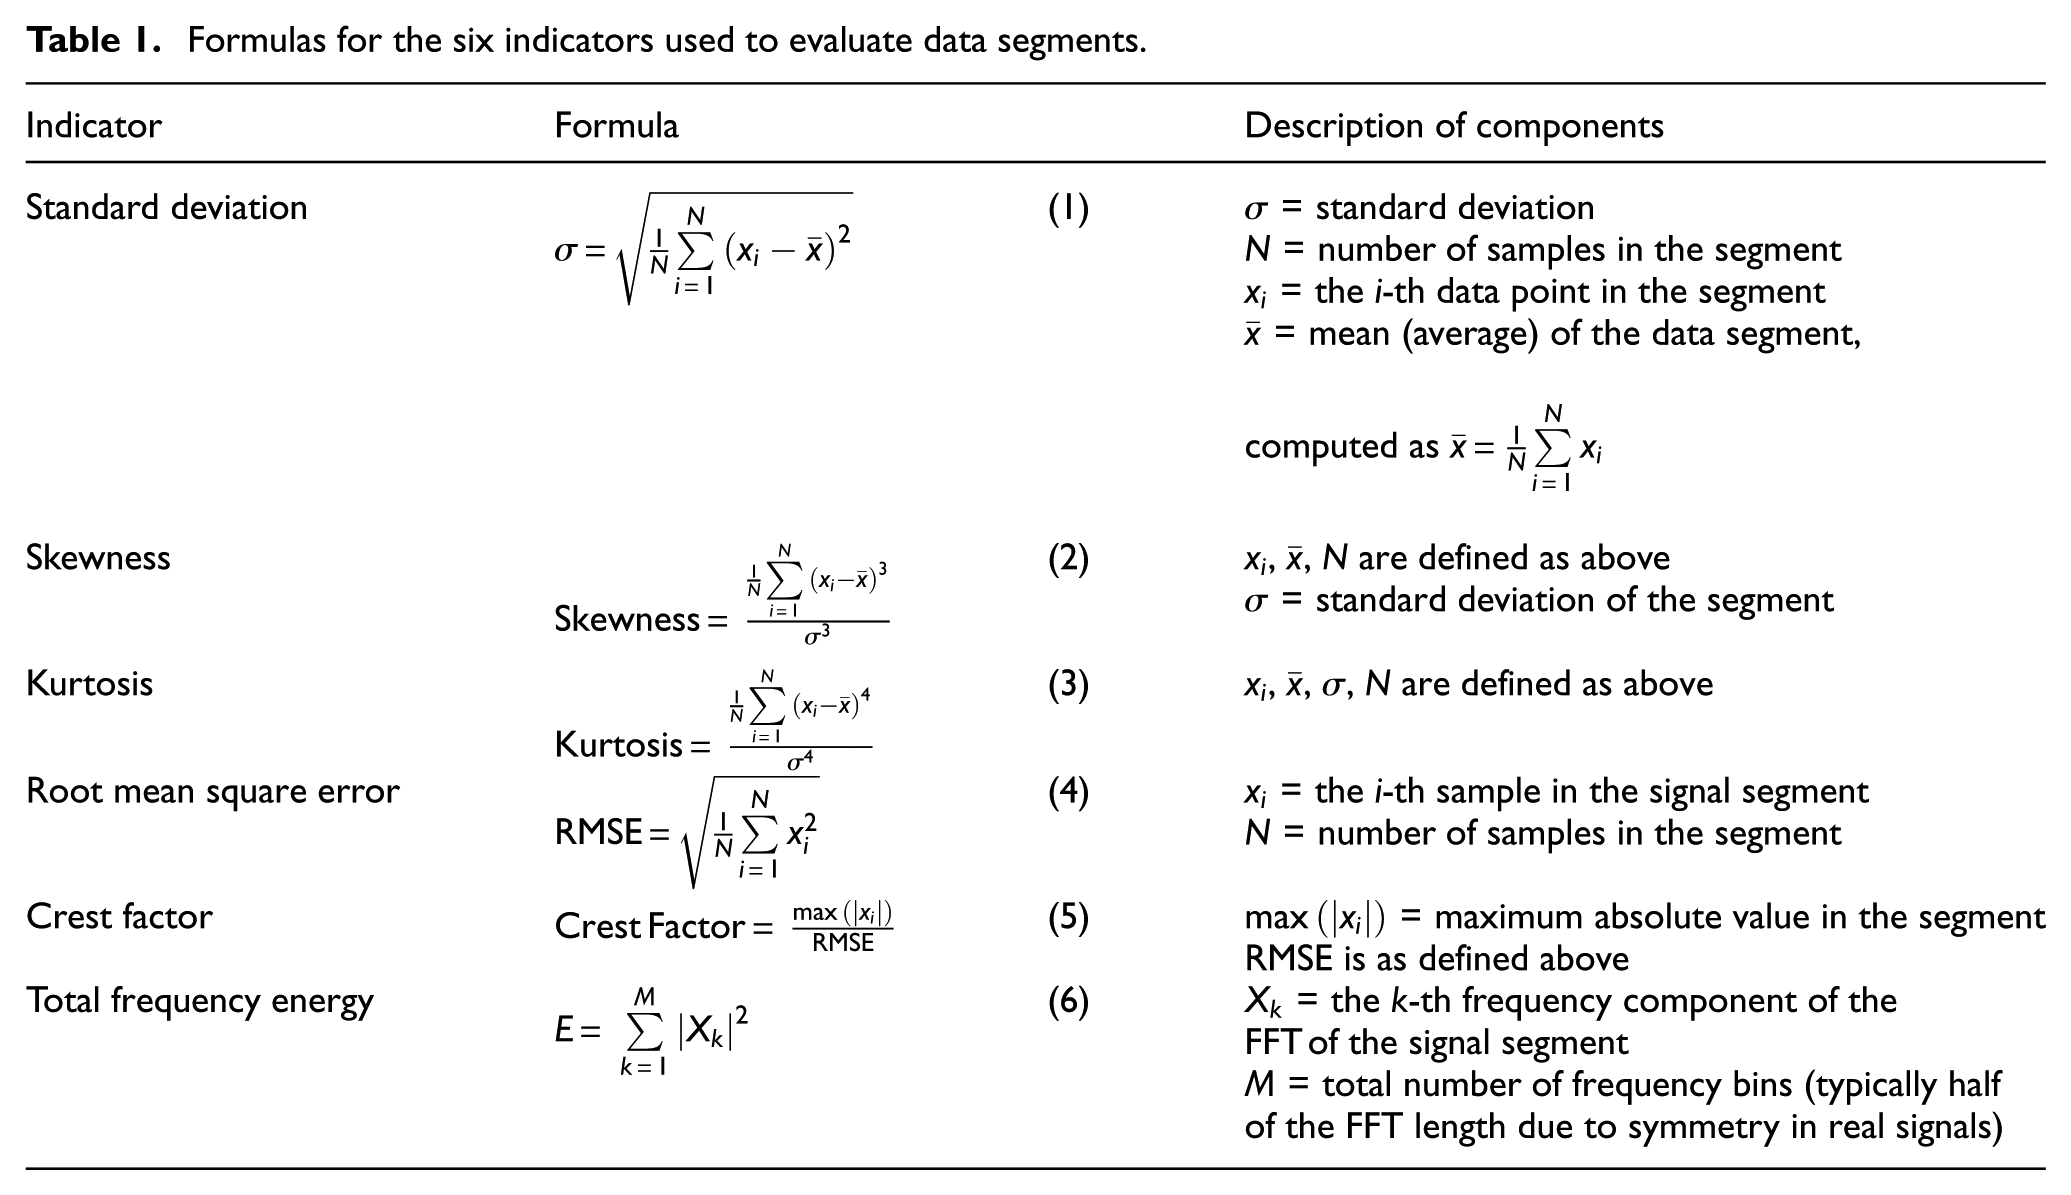
After calculating these six indicators for each segment, the values are normalized to a range between 0 and 1. This normalization step is essential because each indicator operates on a different numerical scale. For instance, kurtosis values may range into the 10s, while skewness might be near zero, and energy measures might have significantly larger values. Without normalization, indicators with inherently larger scales would dominate the evaluation process. By converting all values into the same scale, each indicator is given equal weight in the analysis, ensuring a fair and balanced comparison among segments. Once normalized, the values of all six indicators are summed and then averaged for each segment (Aggregation of Six Indicators (ASIs)), as shown in Formula (7). This cumulative score reflects how dynamically rich and informative each segment is. The segment that obtains the highest total score, meaning it performs best across all six criteria, is selected as the best segment for that specific sensor. This ensures that the selected portion of the signal contains high energy, meaningful variation, frequency content, and other statistical features that are vital for accurate structural analysis.

Since the structure is typically monitored using multiple sensors, this entire process is repeated independently for each sensor. In other words, the signal from each sensor is segmented, analyzed, and scored using the same method. After identifying the best segment for each sensor, the final selection process involves determining which segment shows the highest consistency across all sensors (the optimal segment). The segment that is most frequently identified as the best by different sensors is considered to be the overall best data segment. This approach ensures that the chosen segment reflects not just localized activity but also global structural behavior that is evident across the entire system.
Variational mode decomposition and multivariate VMD
Variational mode decomposition
VMD is a modern, adaptive signal decomposition technique that addresses many of the shortcomings of traditional methods such as EMD. While EMD relies on a sifting process that lacks theoretical rigor and suffers from issues like mode mixing and sensitivity to noise, VMD is founded on a well-posed variational framework and is robust to noise, sampling variations, and nonlinear signal behavior. The core idea of VMD is to decompose a given input signal
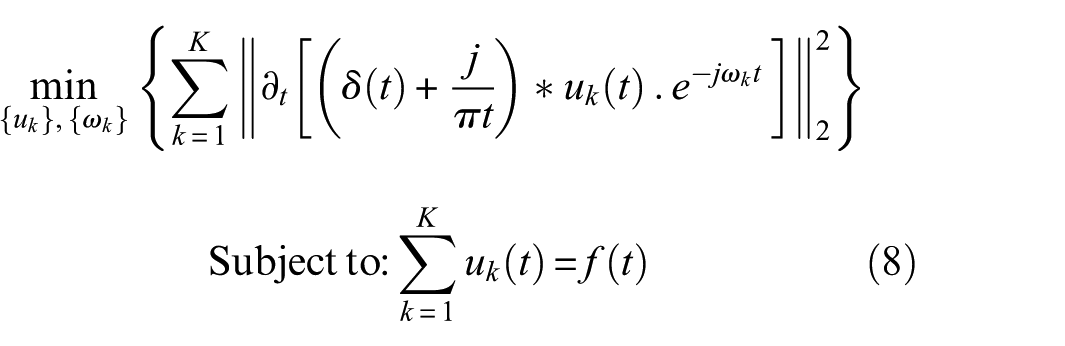
To solve this constrained optimization problem, an augmented Lagrangian method is employed:
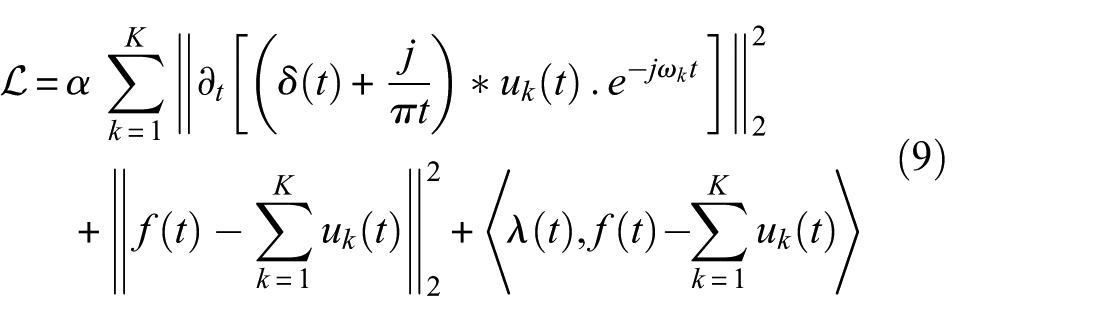
In the formula,
VMD is a non-recursive signal processing technique that simultaneously extracts all modes, thereby avoiding the accumulation of errors common in sequential methods. It adaptively allocates bandwidth by dynamically optimizing the center frequencies of the modes, enabling precise decomposition even in the presence of noise. With a strong mathematical foundation, VMD is robust to signal irregularities and noise, outperforming traditional methods like EMD and STFT. These characteristics make VMD particularly well-suited for applications such as SHM, where it effectively isolates dynamic components from complex, non-stationary signals encountered in real-world infrastructure.
Multivariate variational mode decomposition
Although VMD offers significant benefits, it is designed for univariate signals, making it less suitable for systems with multichannel or spatially distributed data, such as in SHM applications involving multiple sensors. To overcome this limitation, MVMD extends VMD to handle multichannel (vector-valued) input data by preserving inter-channel dependencies during decomposition.28,34 MVMD assumes that the multichannel data share common oscillatory modes with joint center frequencies. Let the multichannel input be

The optimization problem becomes:
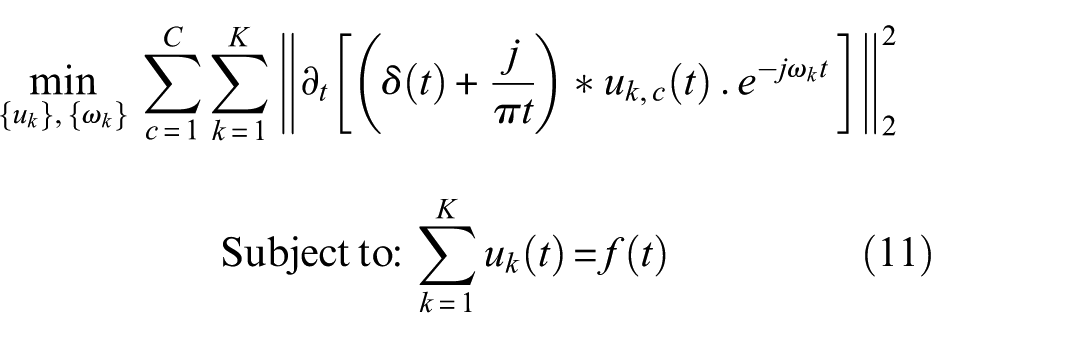
This ensures that the modes across all channels are aligned in frequency and consistent in shape, facilitating spatial correlation, and mode shape identification. MVMD extends the capabilities of VMD by processing multiple sensor channels simultaneously, thereby preserving phase and frequency coherence across spatially distributed data. This multichannel approach enhances mode consistency, ensuring that each extracted mode captures a unified structural response rather than isolated, channel-specific behavior. MVMD enables robust and accurate extraction of natural frequencies, which in turn facilitates the reliable estimation of other modal parameters such as damping ratios and mode shapes, even in the presence of noise or incomplete data. Furthermore, it supports efficient data utilization by allowing high-resolution decomposition using optimally selected segments rather than the entire dataset, making it particularly effective for large-scale, real-world SHM applications.
The MVMD parameters used in this study were selected according to the physical characteristics of each structure, the recommendations of the original MVMD algorithm, and preliminary stability checks performed on the measured data. For each case study, the number of modes, penalty factor, initialization scheme, and convergence tolerance were chosen to ensure reliable mode separation and stable convergence. The selected values for all three structures are summarized in Table 2. These settings were found to be effective and produced consistent modal decompositions across different segment durations, confirming that the identification results are not sensitive to small variations in the MVMD hyperparameters.
MVMD parameter settings for the three case-study structures.
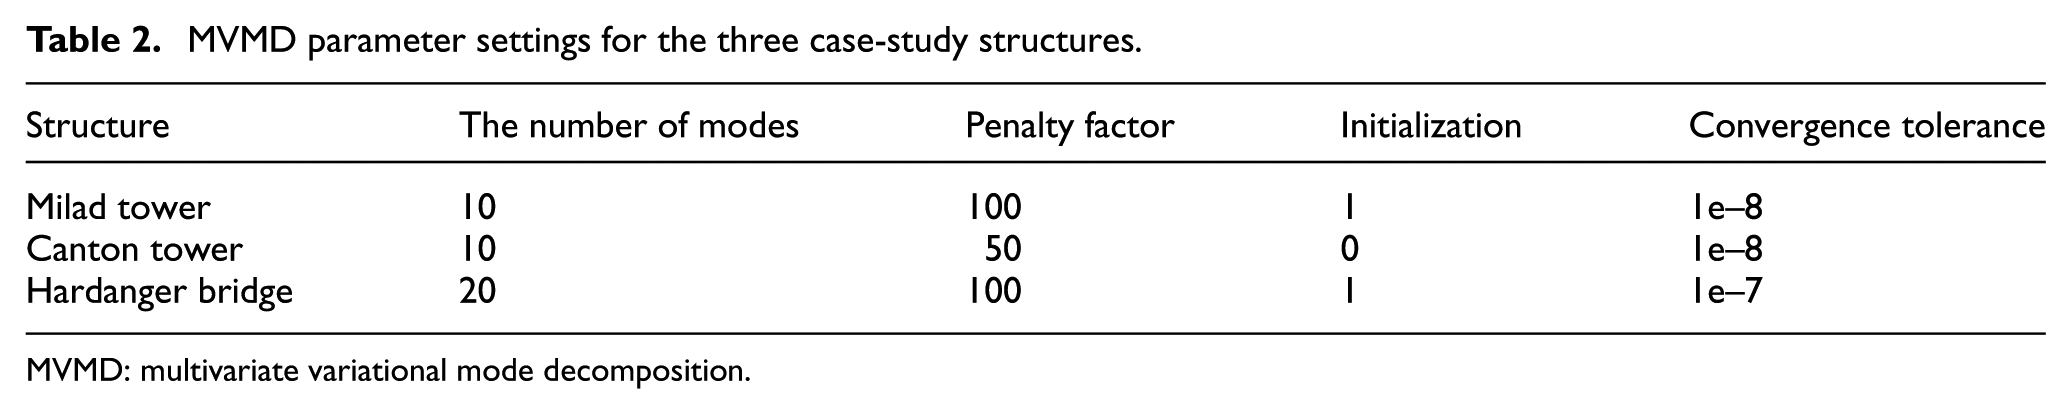
MVMD: multivariate variational mode decomposition.
Wavelet transform
The Wavelet Transform (WT) is a powerful signal processing tool widely used for analyzing non-stationary and time-varying signals. Unlike traditional Fourier-based methods that only provide frequency information, the WT offers a joint time-frequency representation by decomposing signals into components localized in both time and scale (frequency), making it particularly well-suited for structural dynamic analysis and damage detection in civil structures.35,36 The core concept of WT involves the projection of a signal onto a set of functions called wavelets, which are generated by dilating (scaling) and translating a prototype wavelet function, known as the mother wavelet. The Continuous Wavelet Transform of a signal
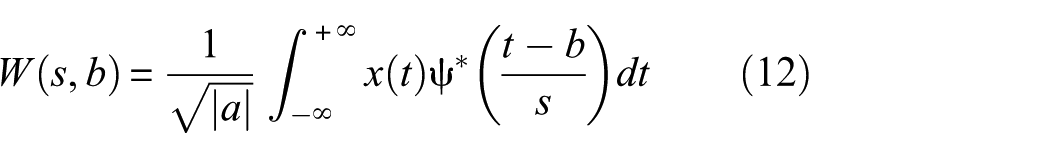
In the formula,
In this study, the db5 wavelet was selected as the mother wavelet for the decomposition process. Daubechies wavelets, introduced by Ingrid Daubechies, are a family of orthogonal wavelets known for their compact support and excellent performance in capturing both smooth trends and abrupt changes in signals. The db5 wavelet, in particular, offers a good balance between time and frequency resolution and has five vanishing moments, enabling it to effectively represent polynomial trends of up to fourth degree. This makes db5 well-suited for structural response signals, which often contain both transient events and harmonic components. By using the db5 wavelet, the time-frequency content of the recorded structural signals is decomposed into multiple levels, allowing the identification of features such as local energy concentrations, transient modal behaviors, and potential damage-induced irregularities. This decomposition facilitates a more accurate modal parameter identification, especially when used in combination with advanced techniques like MVMD.
Damping ratio estimation from ambient vibration data
The damping ratio (
Half-power bandwidth method
One widely used frequency-domain technique to estimate damping from ambient vibrations is the half-power bandwidth method. This method relies on identifying a resonance peak in the frequency spectrum of the structure’s response. Under ambient excitation, the structure’s power spectral density (PSD) or Fourier amplitude spectrum is computed from the measured acceleration time histories at one or more points. Each clear peak in the spectrum corresponds to a natural frequency (
Identify the resonant peak: Determine the natural frequency
Find half-power frequencies: On the amplitude spectrum (or PSD) plot for that mode, locate the two frequencies
Calculate damping ratio: Compute the damping ratio

which is derived from the classical single-degree-of-freedom resonance curve. Here
Repeat for other modes: The above process is repeated for each prominent spectral peak corresponding to a structural mode. This yields the set of modal damping ratios for the structure’s measured modes.
In applying the half-power method to ambient data, it is important to have sufficient frequency resolution in the spectrum (achieved by using long data lengths or zero-padding) so that the half-power points can be distinguished. Additionally, modes that are closely spaced in frequency or have significant mode coupling can make it difficult to identify
Case study
To validate the proposed SHM and signal analysis method, it was applied to three large-scale civil structures of differing types: the Milad Tower, the Canton Tower, and the Hardanger Bridge. These case studies encompass two super-tall towers and a long-span suspension bridge, providing a broad evaluation of the method’s performance on structures with unique dynamic characteristics. For each structure, a detailed description is given alongside an overview of the field measurement data collected by their SHM systems (Figure 1).
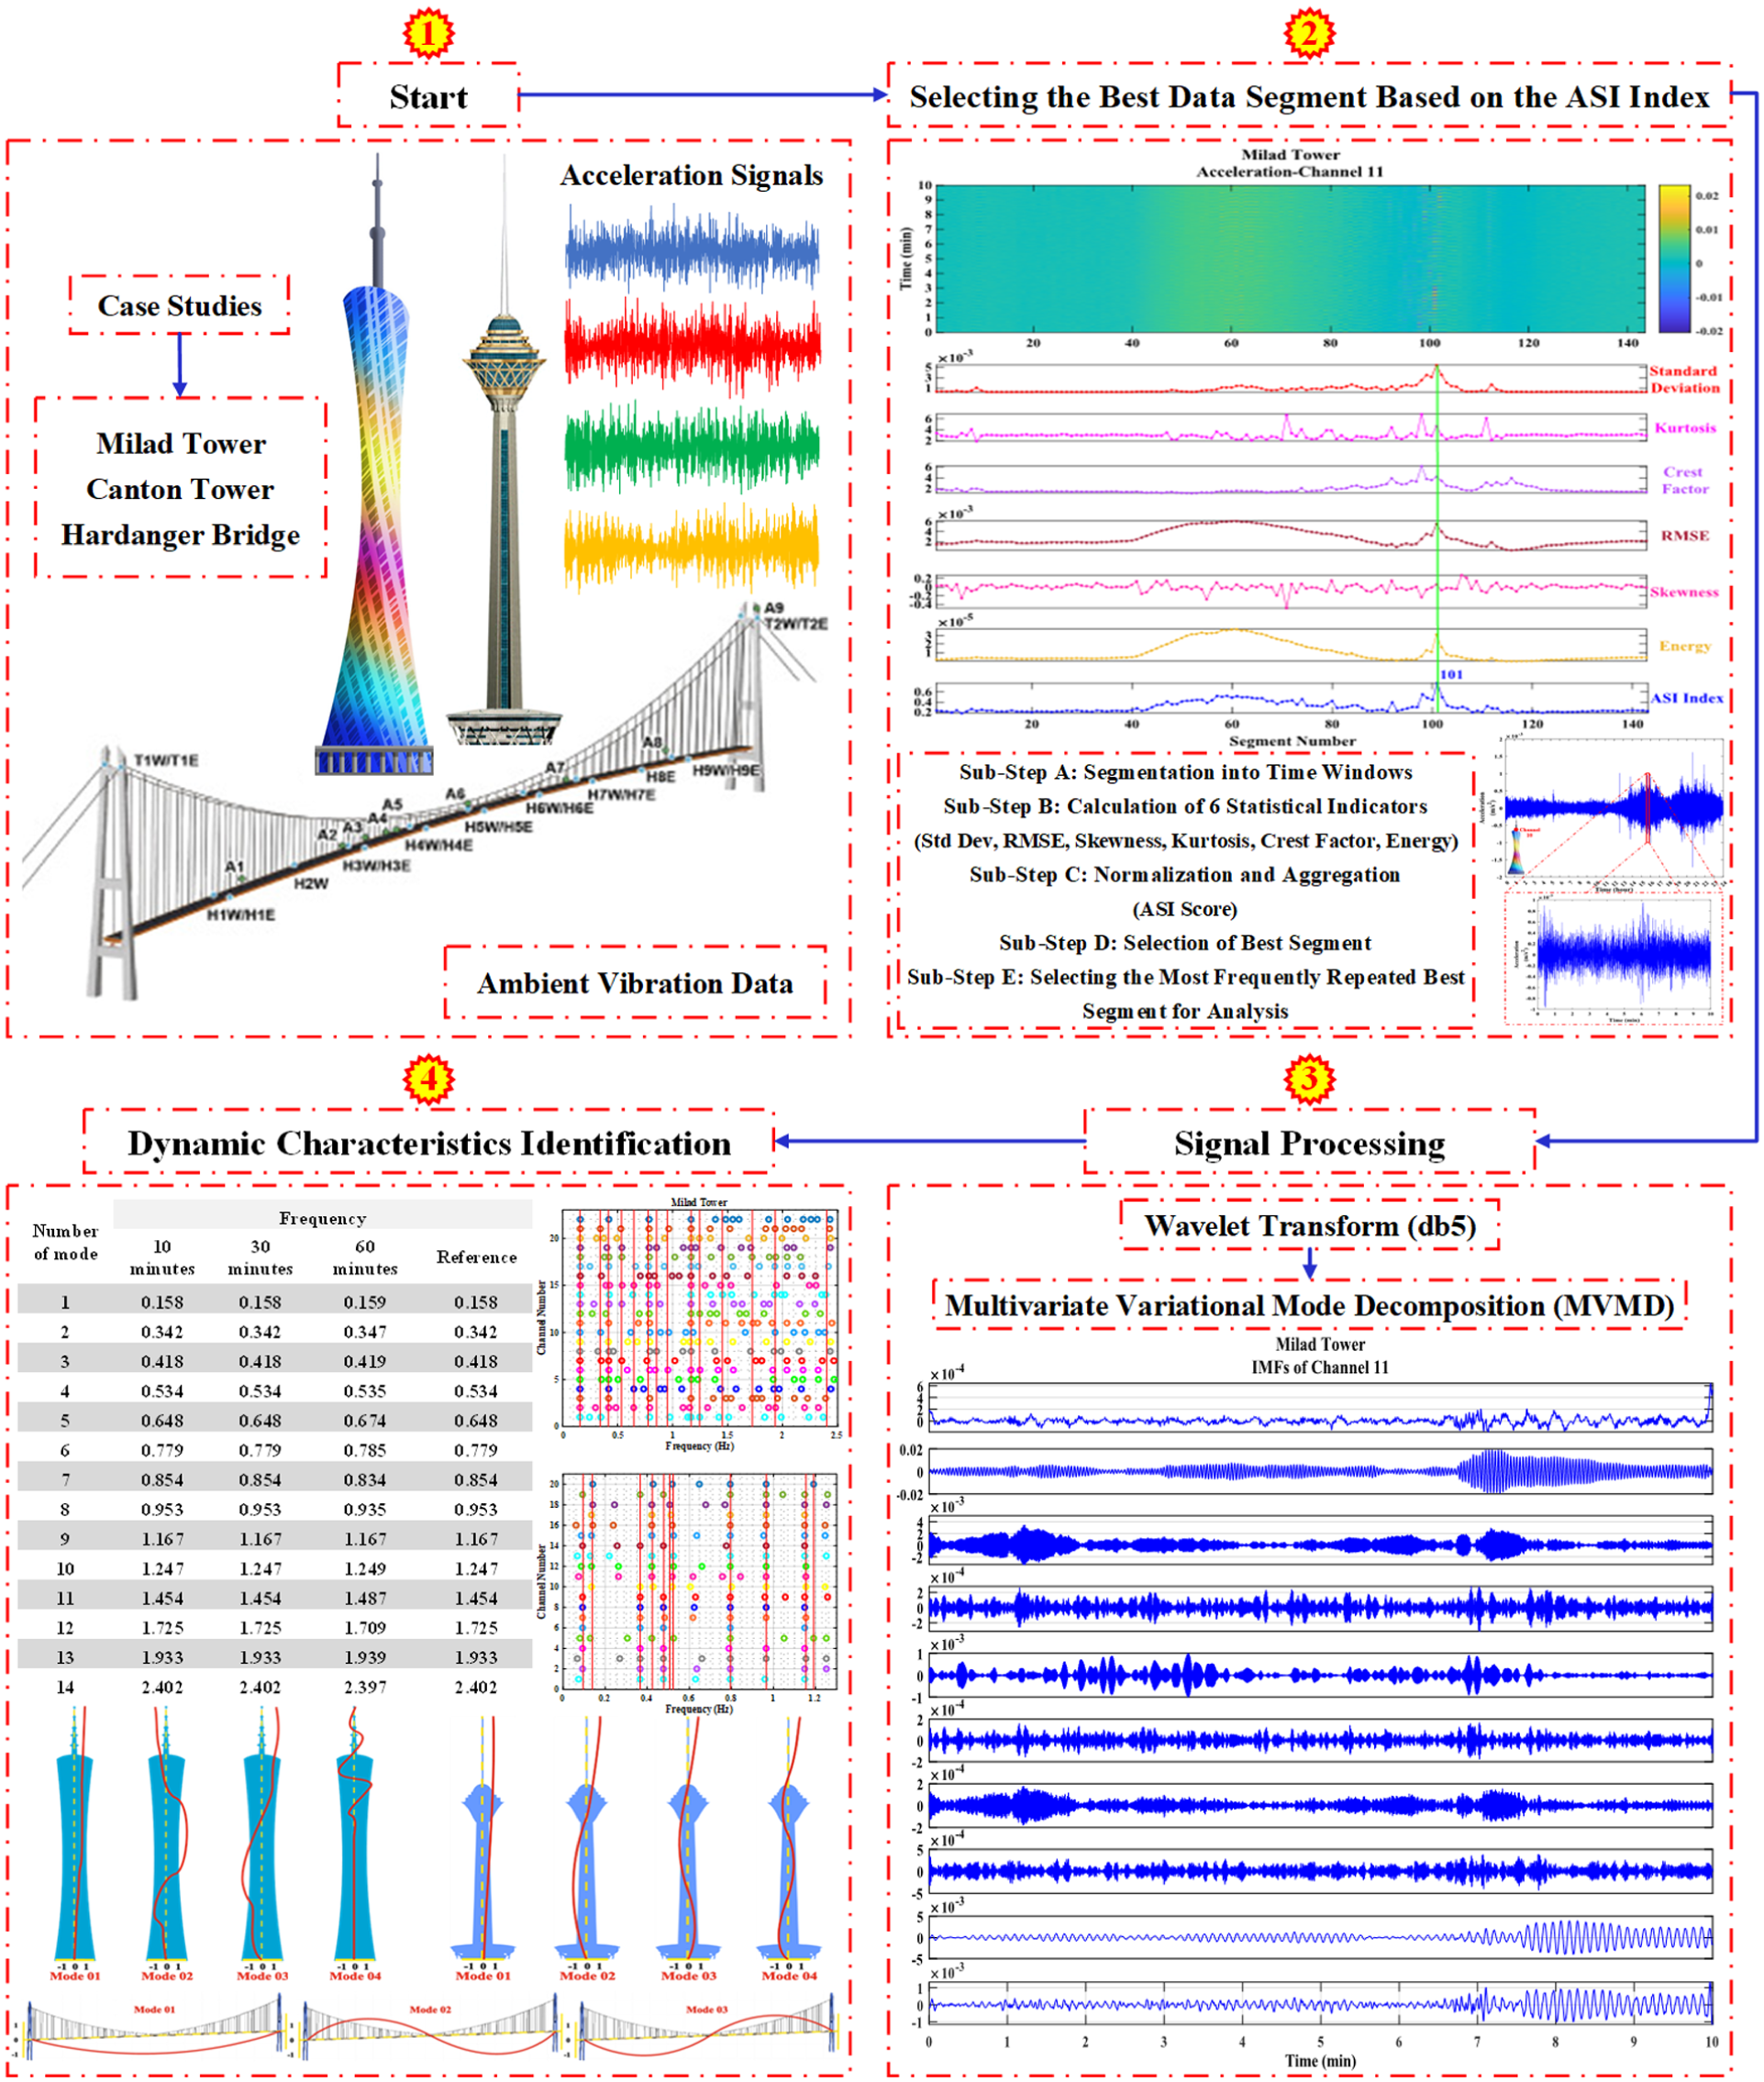
Research workflow: overview of the proposed method.
Milad Tower (Tehran, Iran)
The Milad Tower (Figure 2) is a multi-purpose telecommunication and observation tower in northwestern Tehran, Iran. Standing 435 m tall from base to the tip of its antenna, it ranks as the sixth-tallest telecommunication tower in the world and the tallest in Iran. The tower was completed in 2007 and officially inaugurated in 2008 after about 11 years of construction. Milad Tower’s design features an octagonal reinforced-concrete shaft topped by a broad steel head structure and antenna mast. In particular, the structural system consists of a deep concrete foundation (extending about 14 m below ground), a concrete shaft rising to 302 m, a 12-story steel-framed head (pod) from 240 to 302 m elevation, and a tapered steel antenna mast reaching the full height of 435 m. 37 This head structure, about 60 m in diameter, includes public spaces such as observation decks and a revolving restaurant, reflecting the tower’s mixed use as both a communications hub and an urban tourist destination. The tower’s location in a seismically active region (just a few km from the North Tehran and Ray faults) makes its dynamic behavior and health monitoring particularly important. 38 Both wind and earthquake effects govern the design; thus, Milad Tower was conceived with a robust structural form and dampers to ensure stability under lateral loads. 39
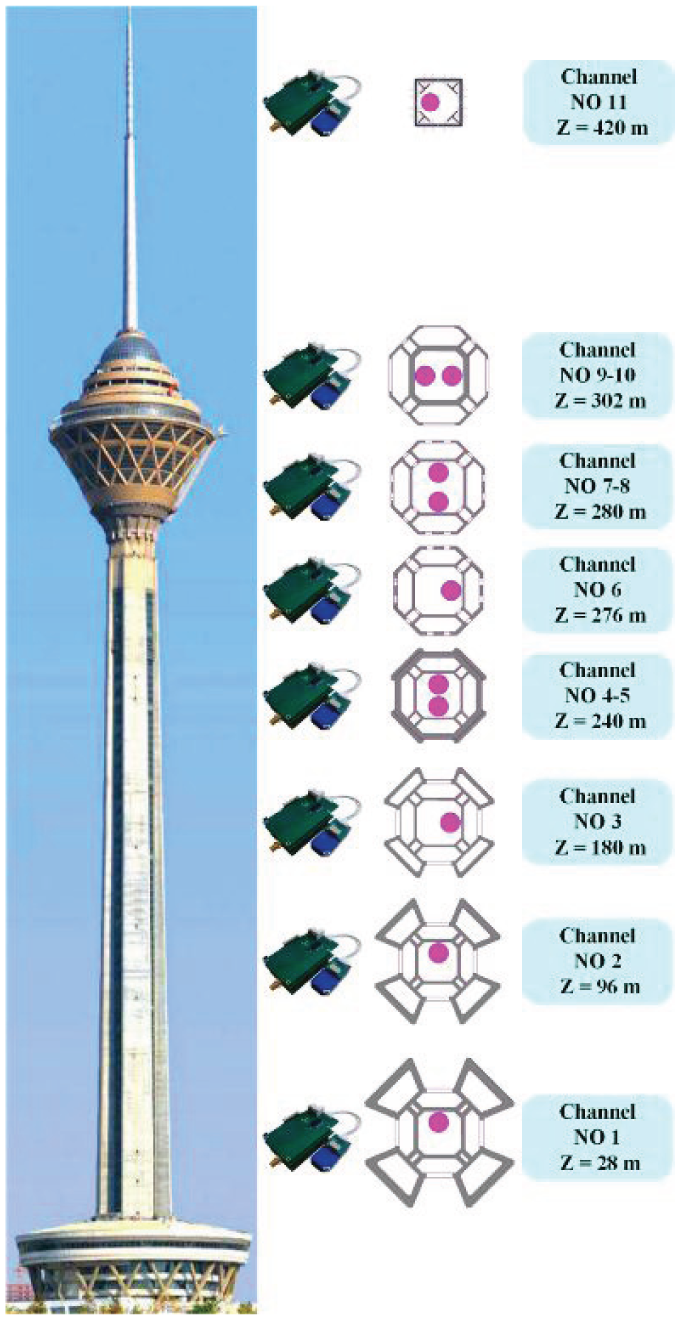
Milad Tower: accelerometer locations and channel numbers.
Field measurement data
Milad Tower is equipped with a long-term SHM system to continuously record its response to environmental excitations. The tower has been instrumented with a network of accelerometers at multiple heights, along with meteorological sensors, to capture both structural vibrations and wind conditions. 37 Twenty-two accelerometers in both horizontal and vertical directions were deployed across eight levels of the tower, from 28 to 420 m in height (shown in Figure 2). These sensors record ambient vibration data in the tower’s two horizontal directions (along orthogonal axes) to track its sway and bending modes. Typically, these accelerometers sample accelerations at 10 Hz, which is sufficient to capture the tower’s lower natural frequency range (up to around 5–10 Hz). 10
In addition to acceleration, Milad Tower’s SHM system measures wind parameters that drive the tower’s response. Long-term ambient vibration recordings have been collected over several years, including extended periods of strong winds to excite the higher modes. 40 The rich dataset obtained comprising synchronized wind and acceleration measurements has been used to identify Milad Tower’s modal properties and to validate the proposed signal analysis method for detecting changes in its dynamic behavior. By analyzing this field data with the new method, researchers can verify that the tower’s natural frequencies and damping ratios are correctly extracted and that any anomalies (due to, e.g., sensor faults or environmental influences) are appropriately handled. Figure 3 displays the data recorded from Channel 11 in Milad Tower over a 24-h period on May 21, 2015. The most informative segment of this data, selected using the method introduced in the previous section, is also indicated.
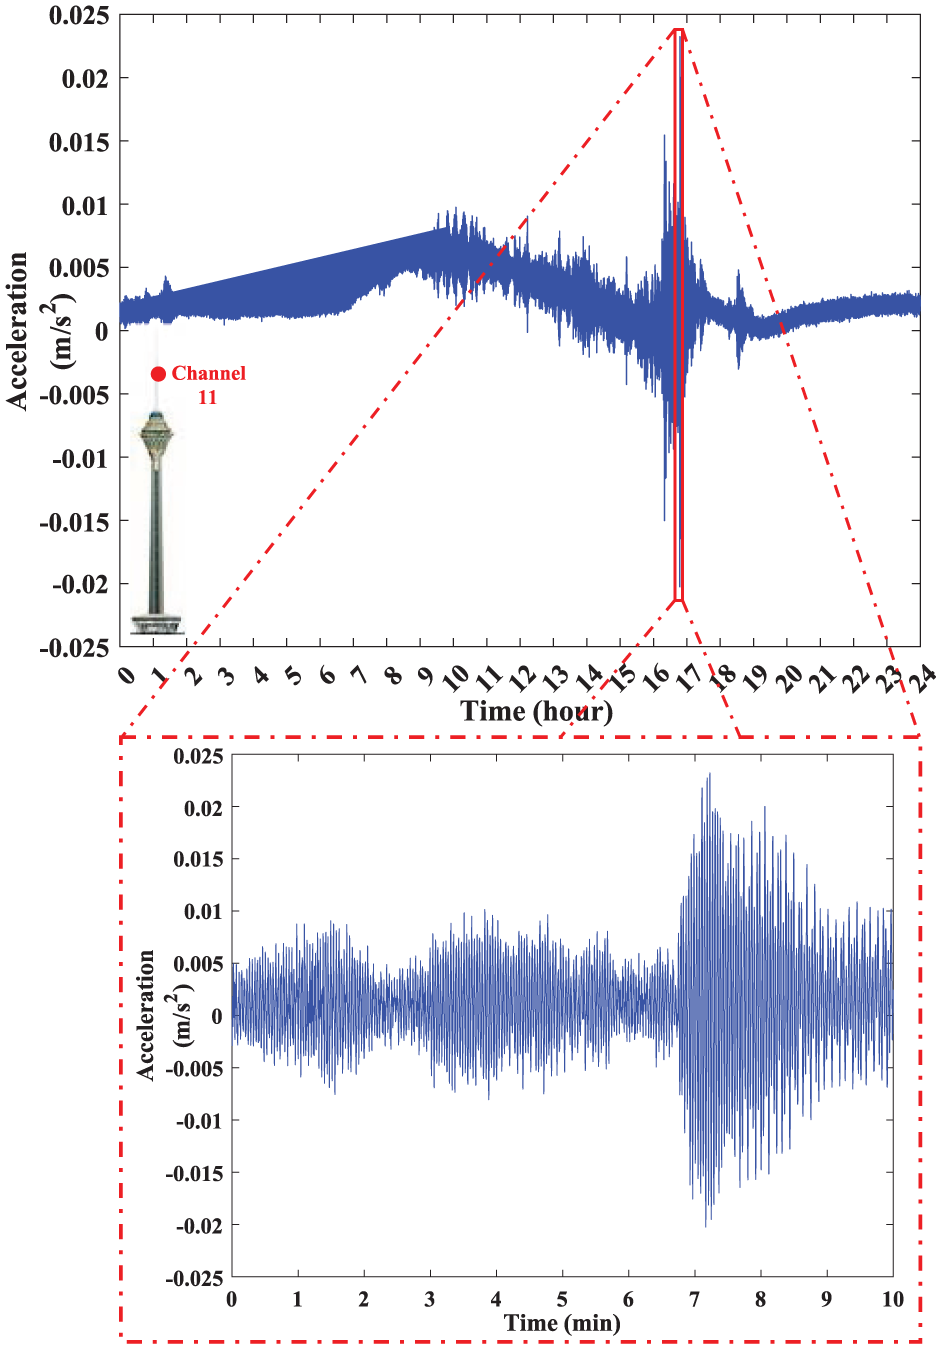
24-h acceleration record of Milad Tower, highlighting optimal 10-min segment.
Canton Tower (Guangzhou, China)
The Canton Tower (Figure 4) is an iconic 610 m tall broadcast and observation tower in Guangzhou, southern China. Completed in 2010 and opened for the 2010 Asian Games, it briefly held the title of the world’s tallest tower before being surpassed by Tokyo Skytree. The tower’s design is distinguished by its twisted hyperboloid form, often nicknamed the “slim waist” due to a narrowing midsection. Structurally, Canton Tower employs a composite tube-in-tube system: a reinforced concrete core (housing elevators and utilities) is encircled by an outer steel lattice shell that gives the tower its curved profile. The outer steel frame is composed of 24 elliptically arranged columns interconnected by rings and bracings, which twist by 90° from base to top, creating the open lattice appearance. At the base, the steel columns are about 2 m in diameter, tapering to about 1.1 m at the top, and are infilled with concrete for stiffness and fire protection during construction. The tower contains multiple functional levels including observation decks, sky gardens, revolving restaurants, and communications equipment platforms. Because of its slenderness, the Canton Tower was designed with a tuned mass damping system: two 650-ton water tanks combined with active mass dampers were installed near the top to mitigate wind-induced sway and ensure occupant comfort. Guangzhou’s location at the edge of a typhoon-prone coastal region makes extreme wind a governing design factor, and extensive wind tunnel tests and simulations were conducted during design. 12 The result is a structure that balances lightweight architectural elegance with the necessary stiffness and damping to withstand typhoon winds and seismic effects.
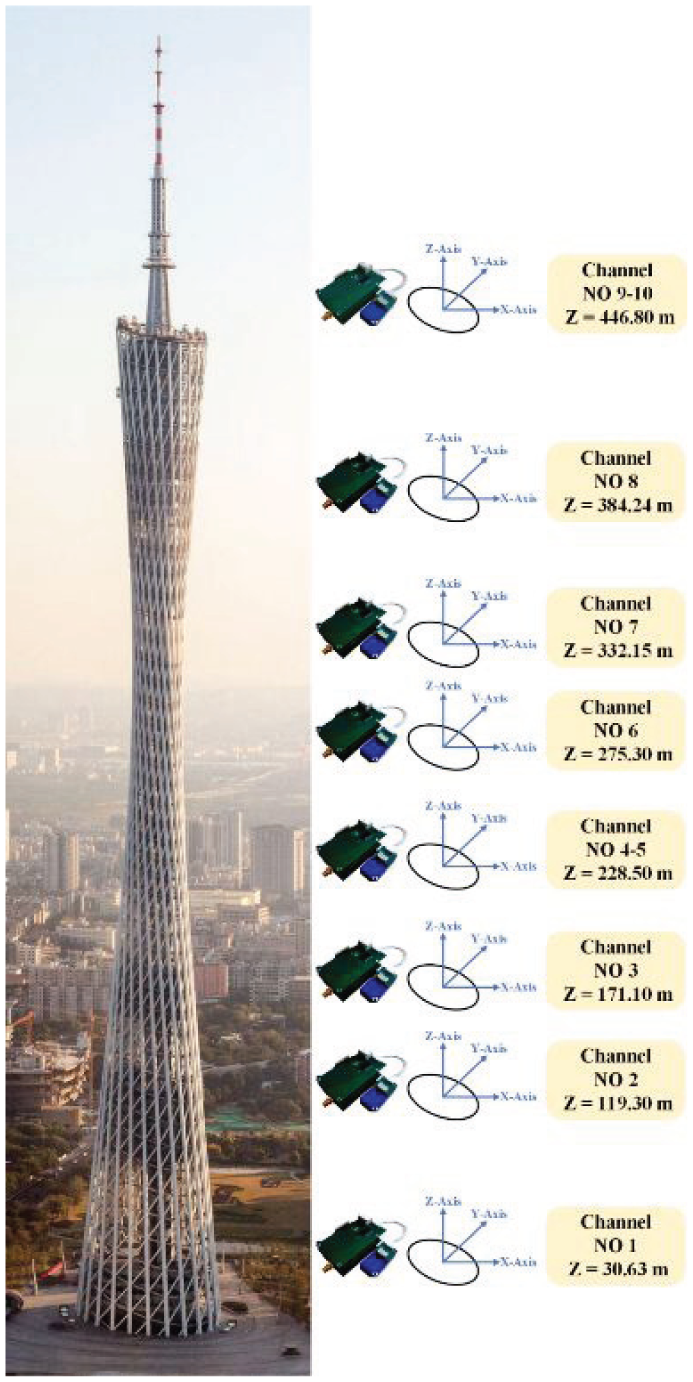
Canton Tower: accelerometer locations and channel numbers.
Field measurement data
Canton Tower hosts one of the world’s most comprehensive structural monitoring systems, implemented to study its performance under actual operational conditions (especially typhoons). This extensive system includes ten channels specifically used for this study, installed to measure ambient and wind-induced accelerations. 12 These accelerometers are sampled at frequencies up to 50 Hz to capture higher-mode vibrations of the slender tower. 10 The broader system also incorporates other sensor types, such as anemometers, strain gauges, and displacement sensors, to monitor environmental loads and various structural responses. This full-scale monitoring has enabled detailed modal analysis of the Canton Tower, for instance, identifying its natural frequencies and damping ratios from ambient vibration, and provides a valuable benchmark for the proposed signal analysis method.41–43
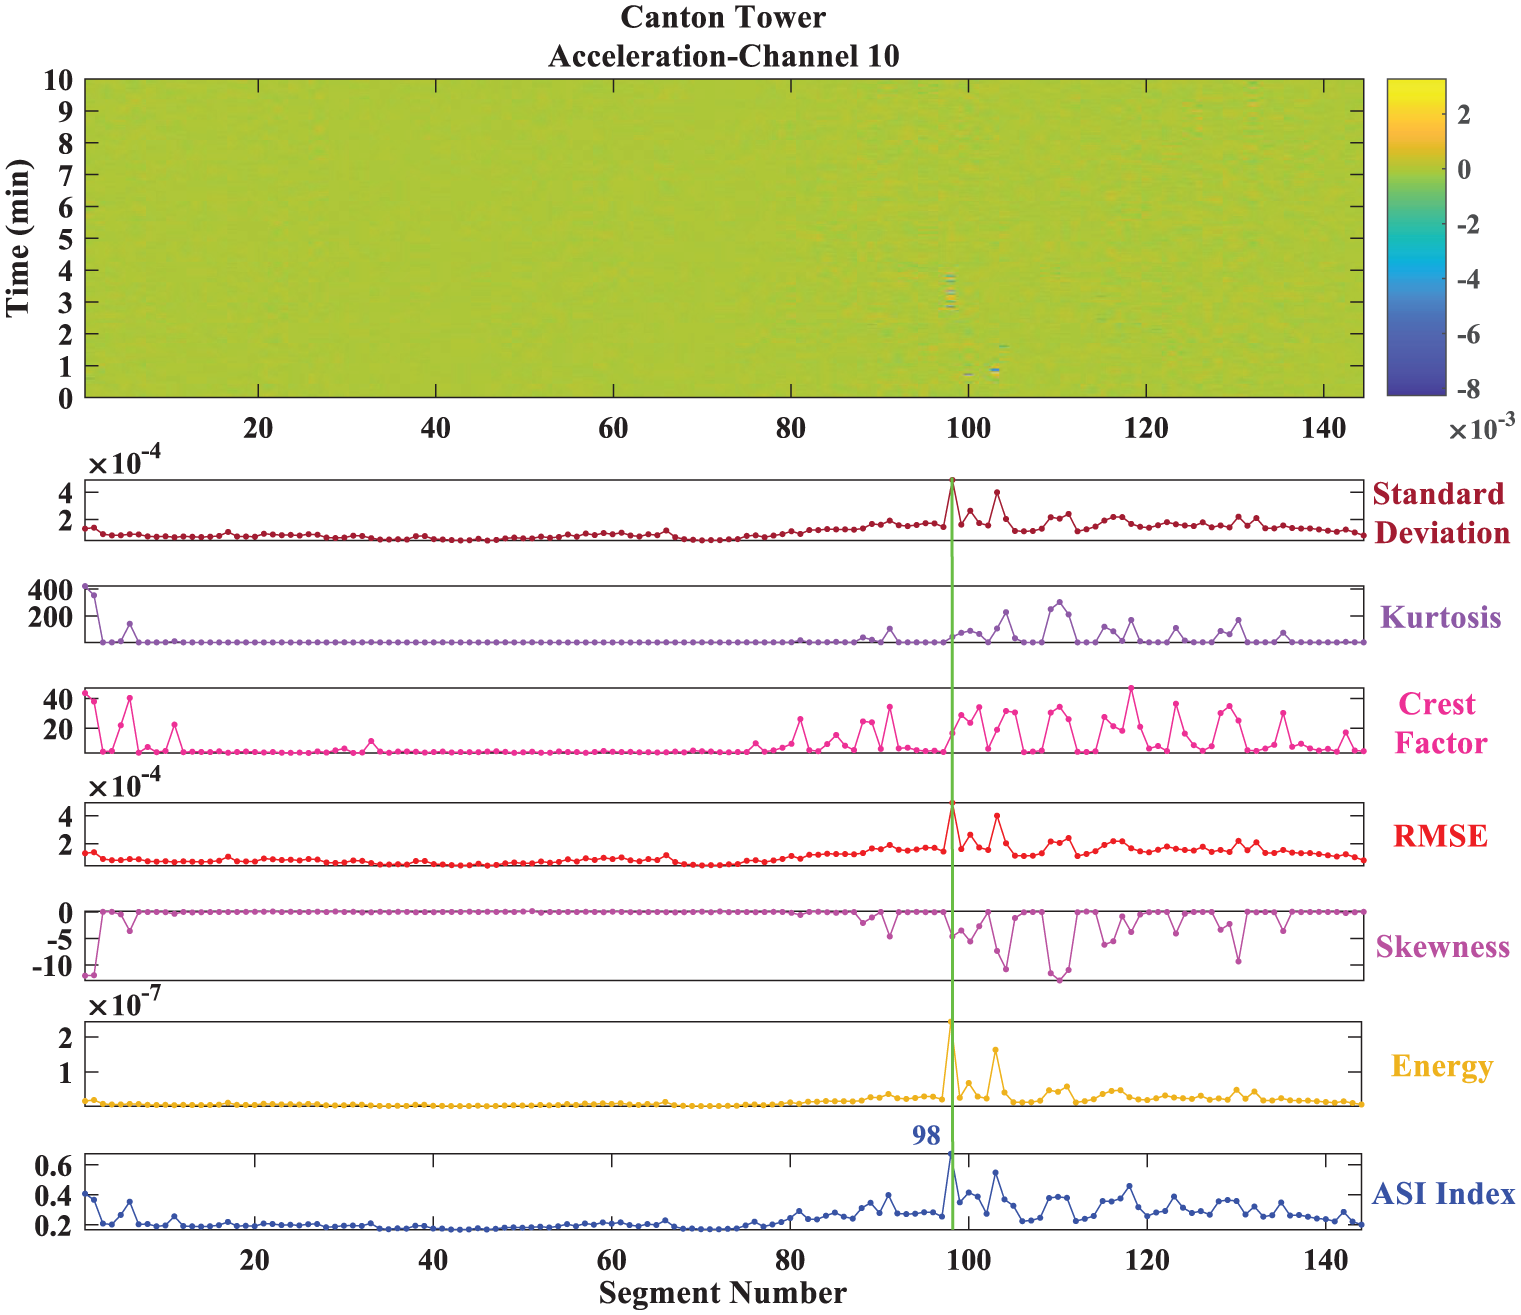
By applying the method to Canton Tower’s field data, researchers can test its ability to extract meaningful features (e.g., changes in modal frequencies with amplitude, or detection of any abnormal responses) from a complex, real-world dataset. Figure 5 displays the data recorded from Channel 10 in Canton Tower over a 24-h period on January 21, 2010. The most informative segment of this data, selected using the method introduced in the previous section, is also indicated.
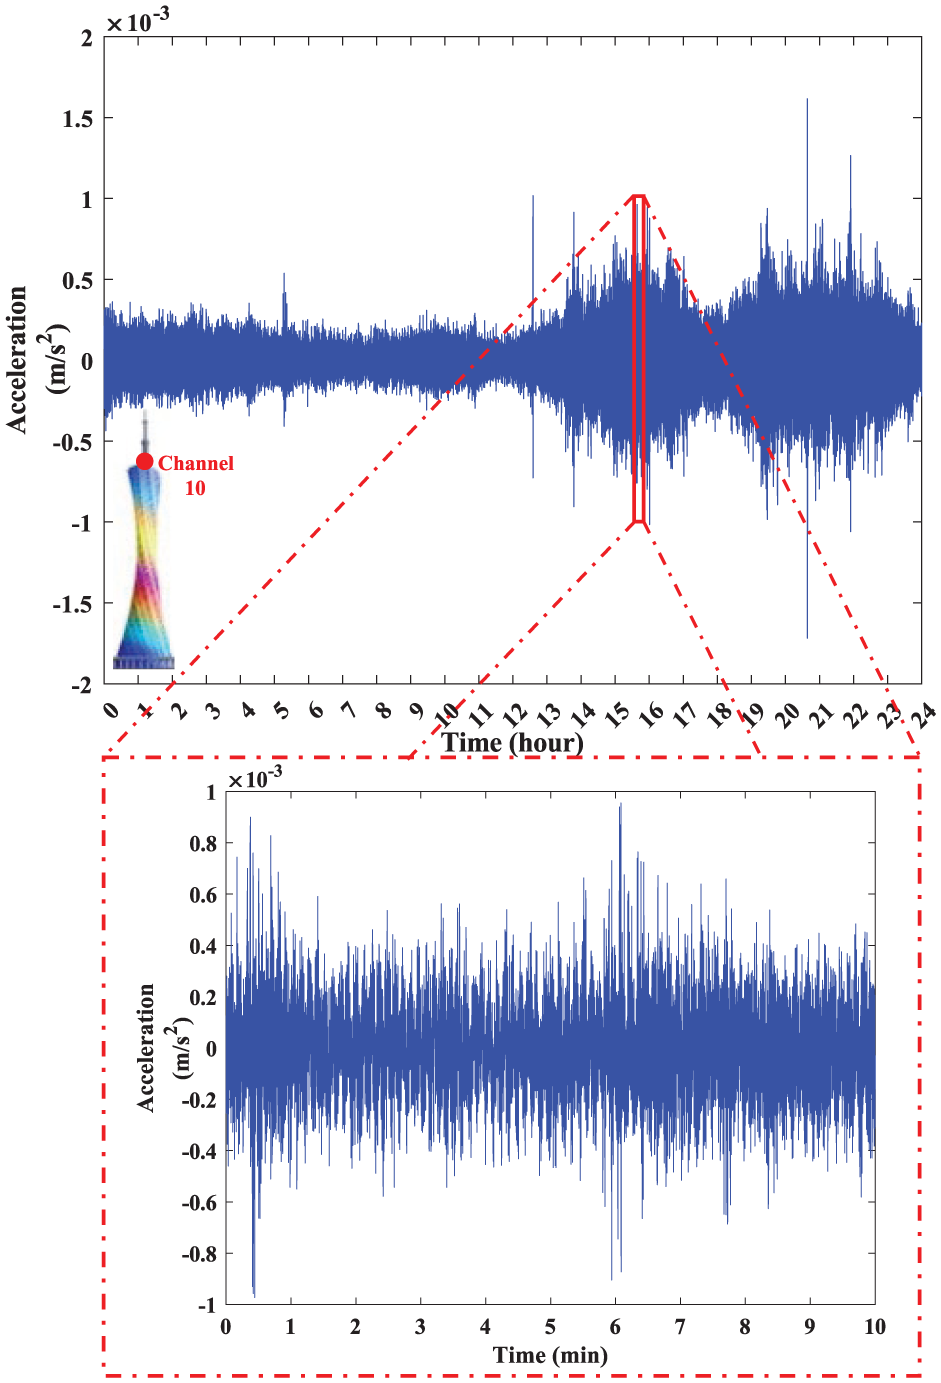
24-h acceleration record of Canton Tower, highlighting optimal 10-min segment.
Hardanger Bridge (Vestland, Norway)
The Hardanger Bridge (Figure 6) is a long-span suspension bridge in western Norway, opened to traffic in 2013. Spanning the Hardangerfjord between mountainous shores, it has a total length of about 1380 m, with a record-setting main span of 1310 m. This makes Hardanger Bridge the longest suspension bridge in Norway. The bridge carries two lanes of highway traffic and a pedestrian/cyclist path, providing a crucial connection that replaced a former ferry route. The design of the Hardanger Bridge features two 200 m tall concrete towers (pylons) rising from the fjord shores to support the main cables. These towers were constructed by slip-forming and anchor the main suspension cables that drape across the span and into rock tunnel anchorages at each end. The bridge deck is a streamlined steel box girder with a wedge-shaped cross section, chosen to reduce wind resistance. 44 The girder’s slender profile (only about 3 m deep) required careful aerodynamic design to ensure stability against wind-induced oscillations. With a 55 m clearance above the fjord water level, the bridge accommodates ship traffic while experiencing strong winds funneling through the fjord. The scenic and harsh environment (deep fjord and steep mountains) also dictated unusual design elements: the bridge’s end spans transition directly into tunnels on both sides, and the anchorage structures are embedded in mountain tunnels. Overall, the Hardanger Bridge represents state-of-the-art long-span bridge engineering, balancing the demands of length, slenderness, and environmental loading. Its location in complex terrain, prone to significant wind turbulence, makes monitoring its dynamic performance a high priority for engineers.
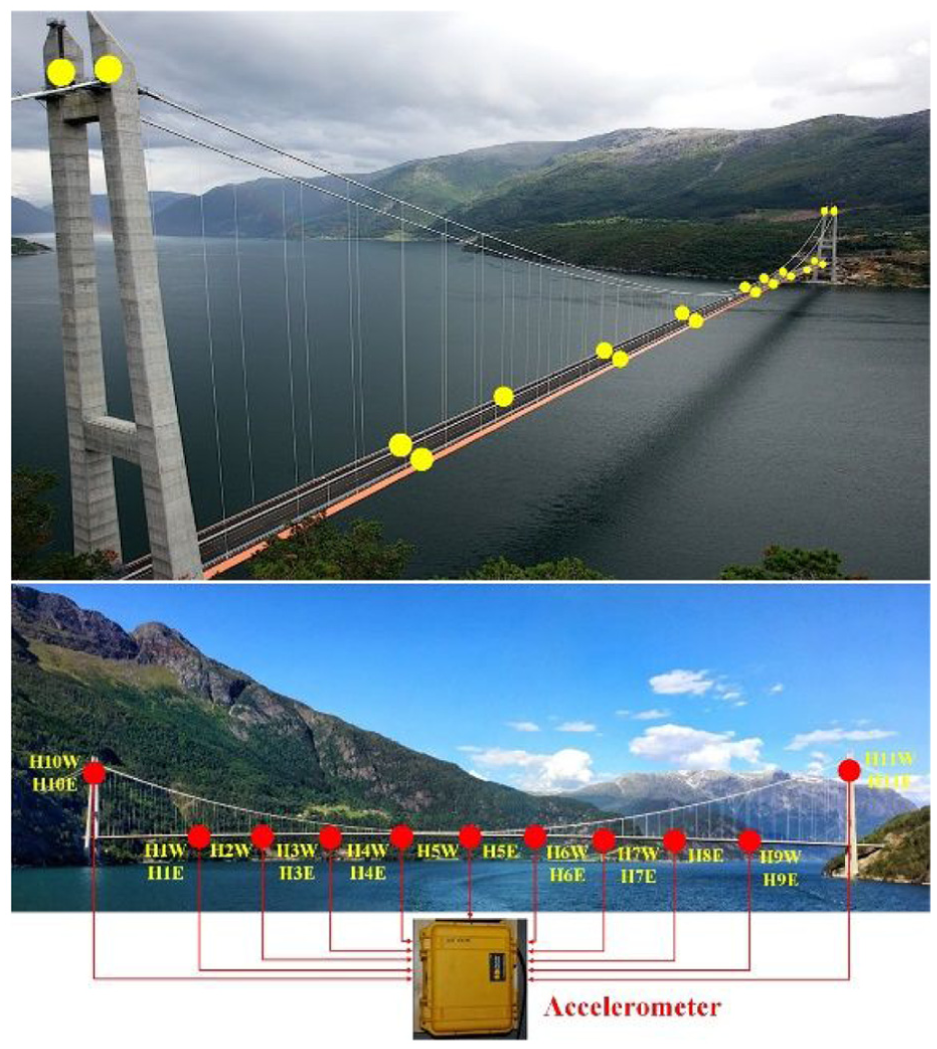
Hardanger Bridge: accelerometer locations and sensor names.
Field measurement data
An extensive SHM system was installed on the Hardanger Bridge to observe its behavior under wind and traffic, with particular focus on wind-induced vibrations. The monitoring system includes 20 triaxial accelerometers and 9 three-dimensional anemometers strategically placed on the bridge. The accelerometers are deployed along the span and on the towers: specifically, 16 accelerometers are mounted on the main span girder (at mid-span and several intermediate points) and 4 on the towers. 45 Each accelerometer records vibrations in three orthogonal directions (vertical, lateral, and longitudinal), enabling capture of the bridge’s multi-mode oscillations (sway, heave, torsion) during ambient excitation. The sonic anemometers (e.g., Gill WindMaster 3D instruments) are installed at various positions along the deck and at the tower tops. These devices measure the wind speed and direction in three axes at a sampling rate high enough to characterize gusts and turbulence impacting the bridge. The anemometer data, combined with the concurrent acceleration records, allows direct correlation of wind events with structural response. For instance, during storms, the system has recorded wind speed variations along the span and the corresponding increase in lateral and torsional vibration levels of the deck. All sensor data are continuously logged and transmitted to a remote operations center. The Hardanger Bridge monitoring project (led by NTNU, the Norwegian University of Science and Technology) uses these measurements for research on bridge aerodynamics and load effects. 46 Figure 7 displays the data recorded from Sensor H5W in Hardanger Bridge over a 5-h period on January 15, 2018. The most informative segment of this data, selected using the method introduced in the previous section, is also indicated.
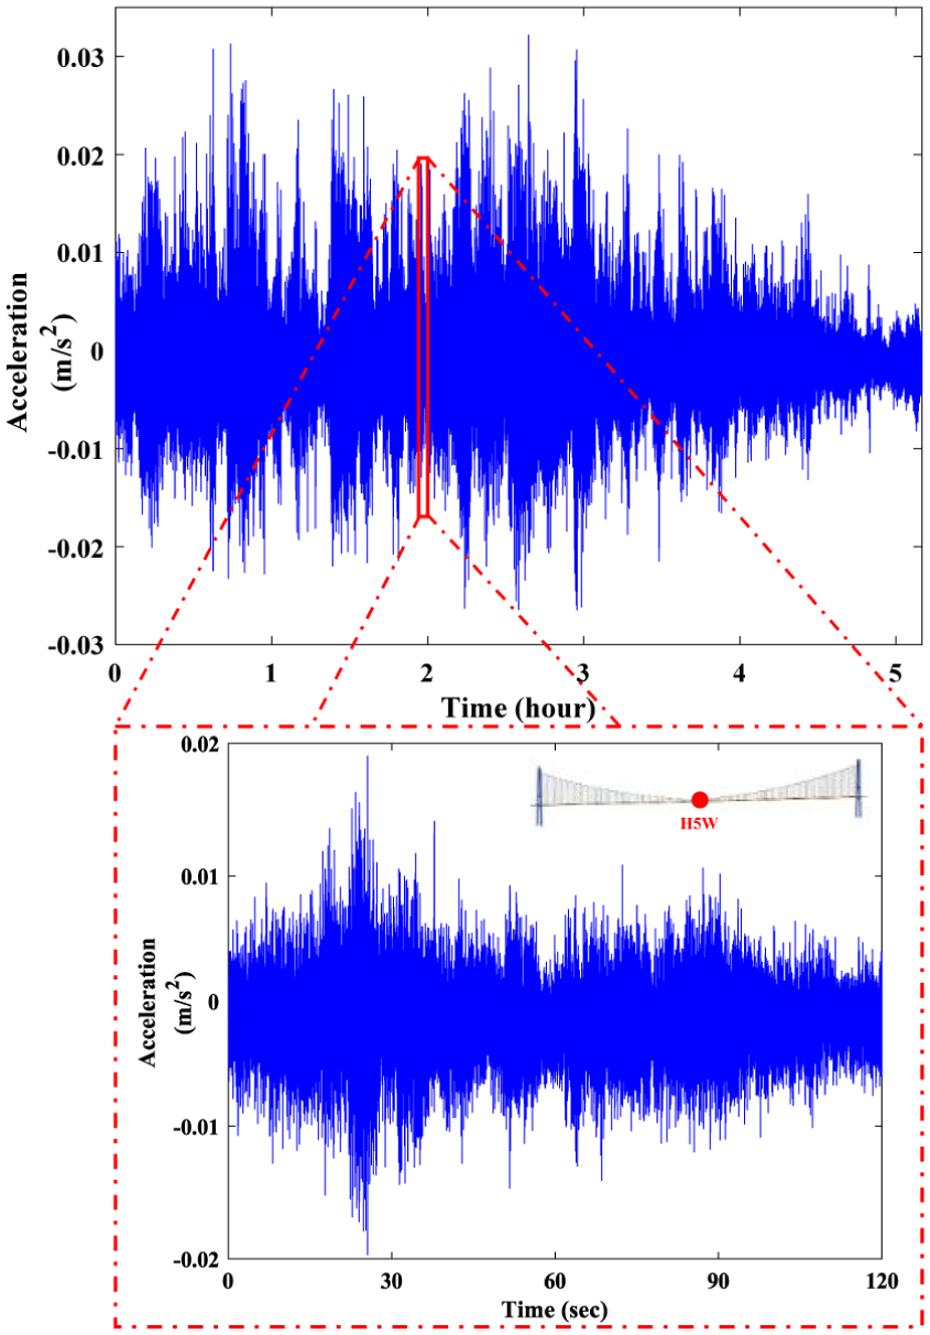
5-h acceleration record of Hardanger Bridge, highlighting optimal 2-min segment.
Each of these case studies, two towers and one bridge, confirms that the SHM and signal analysis approach is capable of handling real-world data complexity. The Milad and Canton Tower examples show successful identification of structural behaviors under ambient and wind loading in vertically cantilevered structures, while the Hardanger Bridge example extends the validation to a flexibly suspended structure under wind. In all cases, the method (SO-MVMD) accurately extracted key dynamic features (natural frequencies, mode shapes, damping) and demonstrated robust performance in reconstructing structural responses from limited or noisy data. These results build confidence that the proposed SHM methodology can be reliably applied to monitor the health and ensure the safety of diverse civil infrastructure systems.
Result
This section presents the practical implementation of the proposed SO-MVMD framework on three real-world structures to assess its performance in identifying their dynamic characteristics. These structures include the Milad Tower in Iran, Canton Tower in China, and the Hardanger Bridge in Norway. They were specifically chosen due to their structural complexity, significant height, and the availability of extensive monitoring datasets. The primary goal is to evaluate the effectiveness and accuracy of the proposed approach in extracting critical modal parameters, including natural frequencies, damping ratios, and mode shapes, from real ambient acceleration measurements and also find out the natural frequencies of the structures automatically.
To achieve this objective, the acceleration data recorded from multiple sensors are initially segmented into shorter time intervals. A novel statistical indicator, combining six important features, standard deviation, RMSE, skewness, kurtosis, crest factor, and signal energy, is utilized to automatically select the most informative, representative, and optimal segments. Subsequently, the DWT is applied to filter out noise and isolate the target frequency range effectively. Afterwards, MVMD is employed to decompose the preprocessed signals into (IMFs). Finally, modal parameters are systematically identified, analyzed, and discussed in detail. The results obtained are compared with previously published reference values and other techniques, wherever possible, to verify the accuracy and robustness of the proposed methodology.
Identifying the dynamic characteristics of Milad Tower
To demonstrate the applicability of the proposed framework, the ambient acceleration data collected from Milad Tower are analyzed. The tower is equipped with 22 accelerometers configured across 11 channels to capture dynamic responses in both horizontal and vertical directions. These sensors are strategically placed at multiple elevations including 28, 96, 180, 240, 276, 280, 302, and 420 m to represent the full height of the structure (Figure 2). The frequency band targeted for dynamic identification lies within 0.078 to 2.5 Hz.
In the preprocessing stage, the acceleration signals are divided into time segments of 10, 30, 60 min. Each segment is evaluated using a composite statistical metric detailed in section “Identifying the best data segment.” As described in equations (1)–(6), this indicator incorporates features such as standard deviation, RMSE, skewness, kurtosis, crest factor and energy to quantify the segment’s suitability for modal analysis. According to equation (7), the segment with the highest indicator value is selected as the optimal candidate per channel.
An example of this process is illustrated in Figure 8, which shows time-domain and signal quality metrics for channel 11 under 10-min segmentation. In particular, the green-highlighted line in Figure 8 corresponds to a time interval with an elevated maximin value of ASI index, making it a strong candidate for extracting modal information. As can been seen in the Figure 8, segment 101 is selected as the best and optimal for Channel 11.
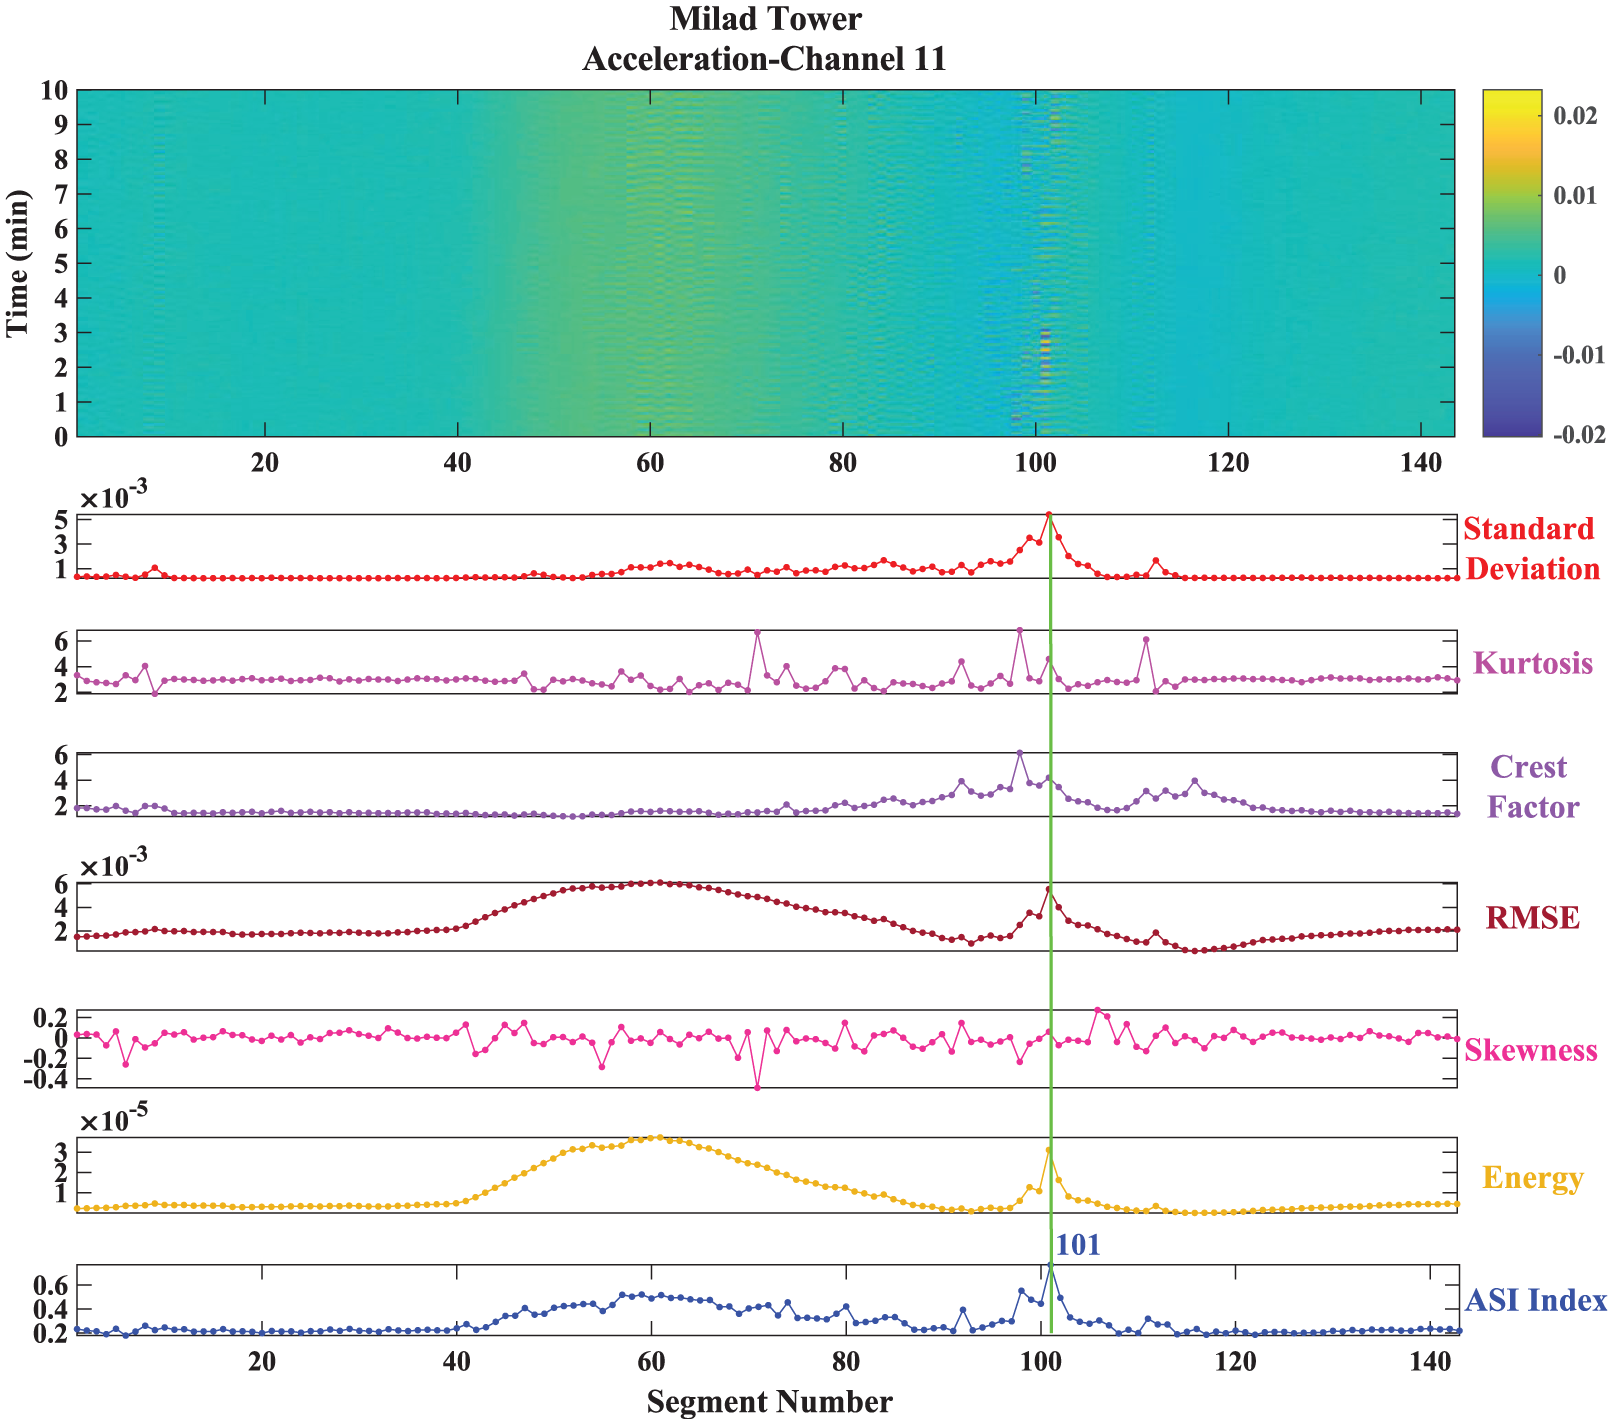
Analysis of Milad Tower acceleration data: statistical and signal parameters in 10-min segments.
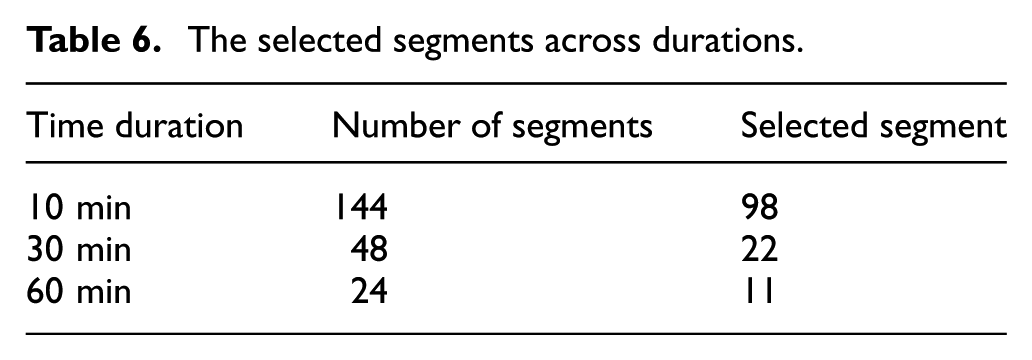
The same strategy is adopted for all channels to find out the best segment. The segment most frequently identified across all 11 channels is chosen to represent the entire structure. For the 10-min case, the best segments for x-direction channels (from 1 to 11) are: 100, 101, 101, 101, 101, 101, 101, 101, 101, 101, and 101; for the y-direction, the corresponding segments are: 98, 98, 100, 98, 100, 100, 98, 98, 98, 98, and 98. Based on this aggregation, segment 101 emerges as the most frequently selected and is adopted as the final segment for analysis. This methodology is repeated for all other time windows, and the selected segments across durations are summarized in Table 3. To further examine the stability of the ASI-based segment selection for the Milad Tower, a sensitivity analysis was conducted by perturbing all six ASI weights by ±10% over 100 random trials. For each perturbed weighting set, the ASI score was recalculated and the optimal segment was re-selected. Across all trials, the selected segment remained unchanged, demonstrating that the ASI-based ranking procedure is highly robust to moderate variations in the weighting scheme and that the chosen segment provides a reliable basis for the subsequent SO-MVMD modal identification.
The selected segments across durations.

Following the selection of the optimal data segment, the WT is applied as a preprocessing step to suppress noise and isolate the target frequency range. Specifically, the acceleration signals are reconstructed using inverse WT, retaining only the frequency components within the desired band. Based on the sampling rate, each signal is decomposed into six levels. To effectively filter the data for Milad Tower, the approximation coefficients at level 6 (A6) and the detail coefficients at level 1 (D1) are removed. This strategy enables both noise reduction and accurate frequency targeting. It is important to note that this preprocessing approach is consistently applied across all selected segments, regardless of duration, namely, 10, 30, and 60-min intervals.
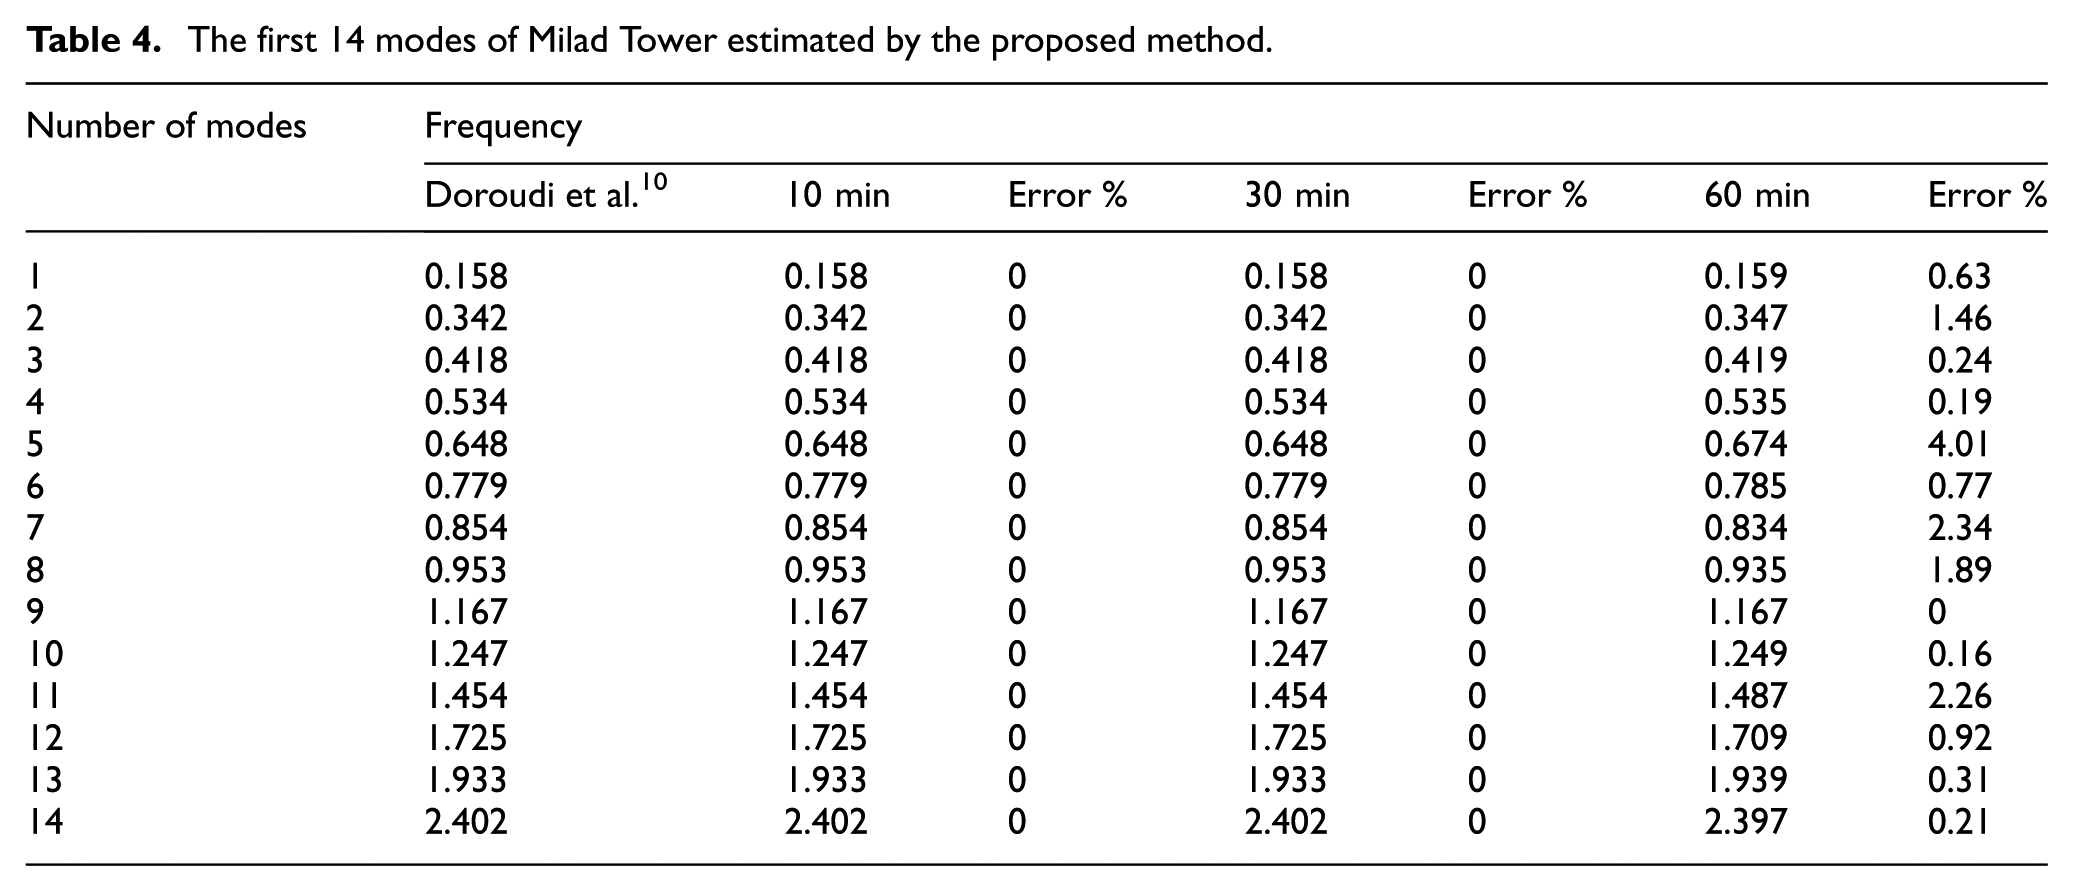
Figure 9 presents the Intrinsic IMFs extracted from the Milad Tower’s acceleration response over a 10-min interval. The subplots display the decomposed original signal from Channel 11 in the x-direction, into 10 distinct IMFs. To identify the full range of frequencies, the mode with the highest amplitude is extracted from each IMF across all channels. By aggregating and sorting these dominant modes, the significant frequency components can be effectively determined and organized. Table 4 summarizes the extracted frequencies obtained by the proposed approach. The results across all three segment durations (10, 30, and 60 min) are highly consistent, with differences generally remaining below 4%. In particular, the frequencies identified from the 10 and 30-min segments are identical for all modes (0% deviation), which is fully in line with previous findings reported in Doroudi et al. 10 and confirms the stability of the method for these window lengths. For the 60-min window, only small deviations are observed, with a maximum variation of 4.01% across all modes. Overall, these results demonstrate that the proposed framework is highly robust and essentially insensitive to the choice of segment duration, when the window size increases from 10 to 60 min.
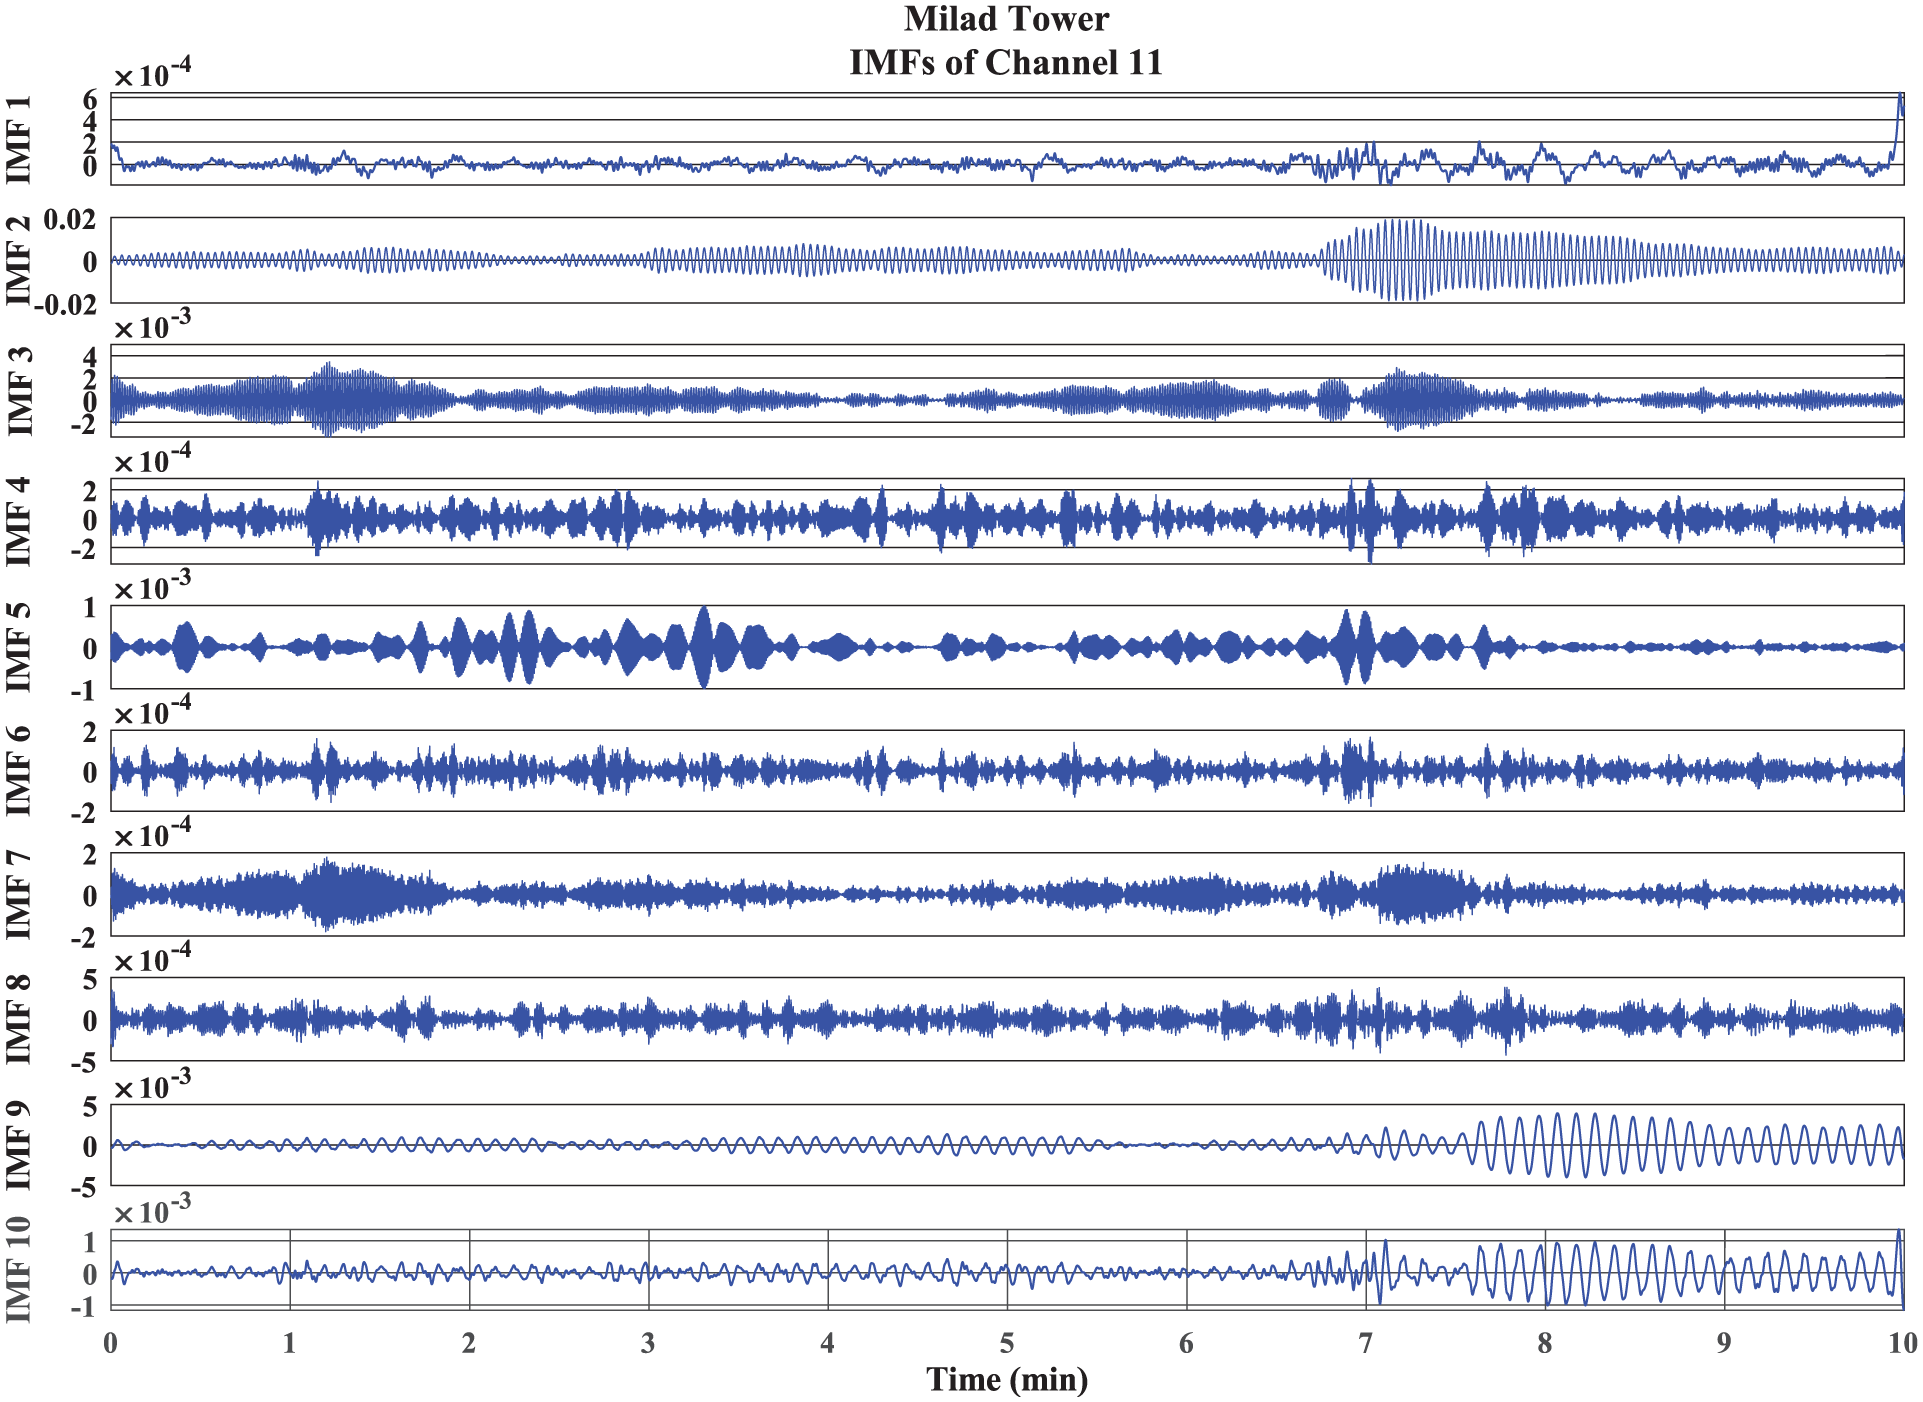
The IMFs of channel number 11 at x-direction for 10-min time duration for Milad Tower.
The first 14 modes of Milad Tower estimated by the proposed method.
PSD method with the same filtering approach with proposed method is used for comparison with proposed method. Figure 10 presents the extracted frequencies for all channels using the PSD method, applied to the best segment identified within the 10-min time duration. In this figure, the colored circles represent the extracted frequencies for individual channels, while the red lines indicate the frequency values of the Milad Tower. As illustrated, PSD-based methods with filtering, produce several invalid or inconsistent frequency components.
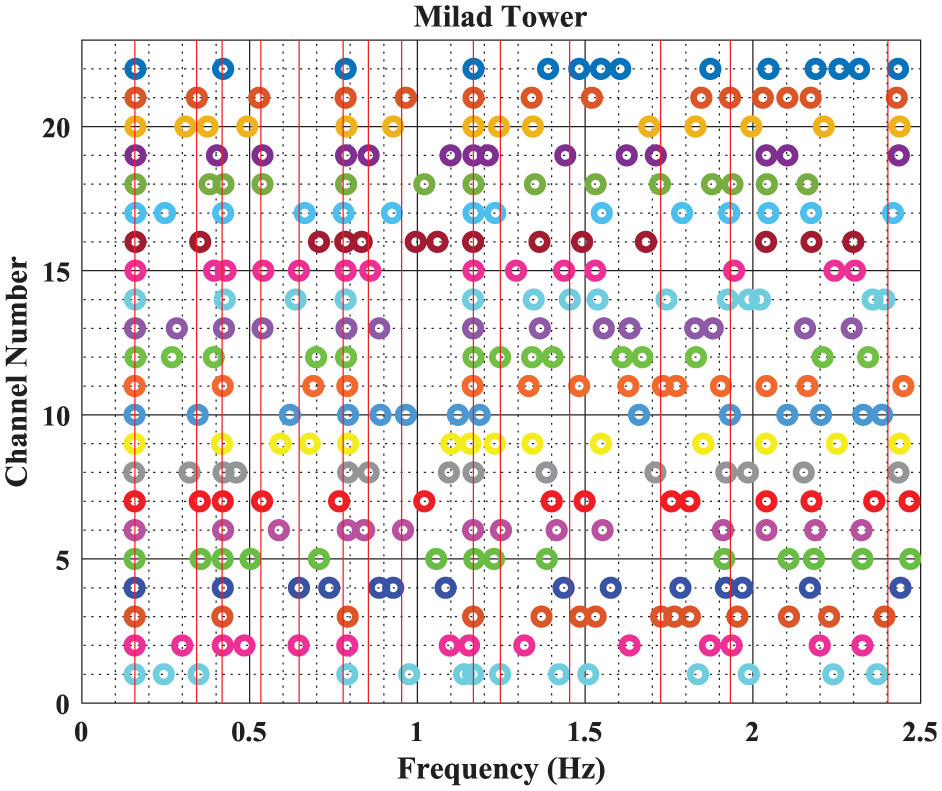
PSD-extracted frequencies from optimal 10-min segments (all channels).
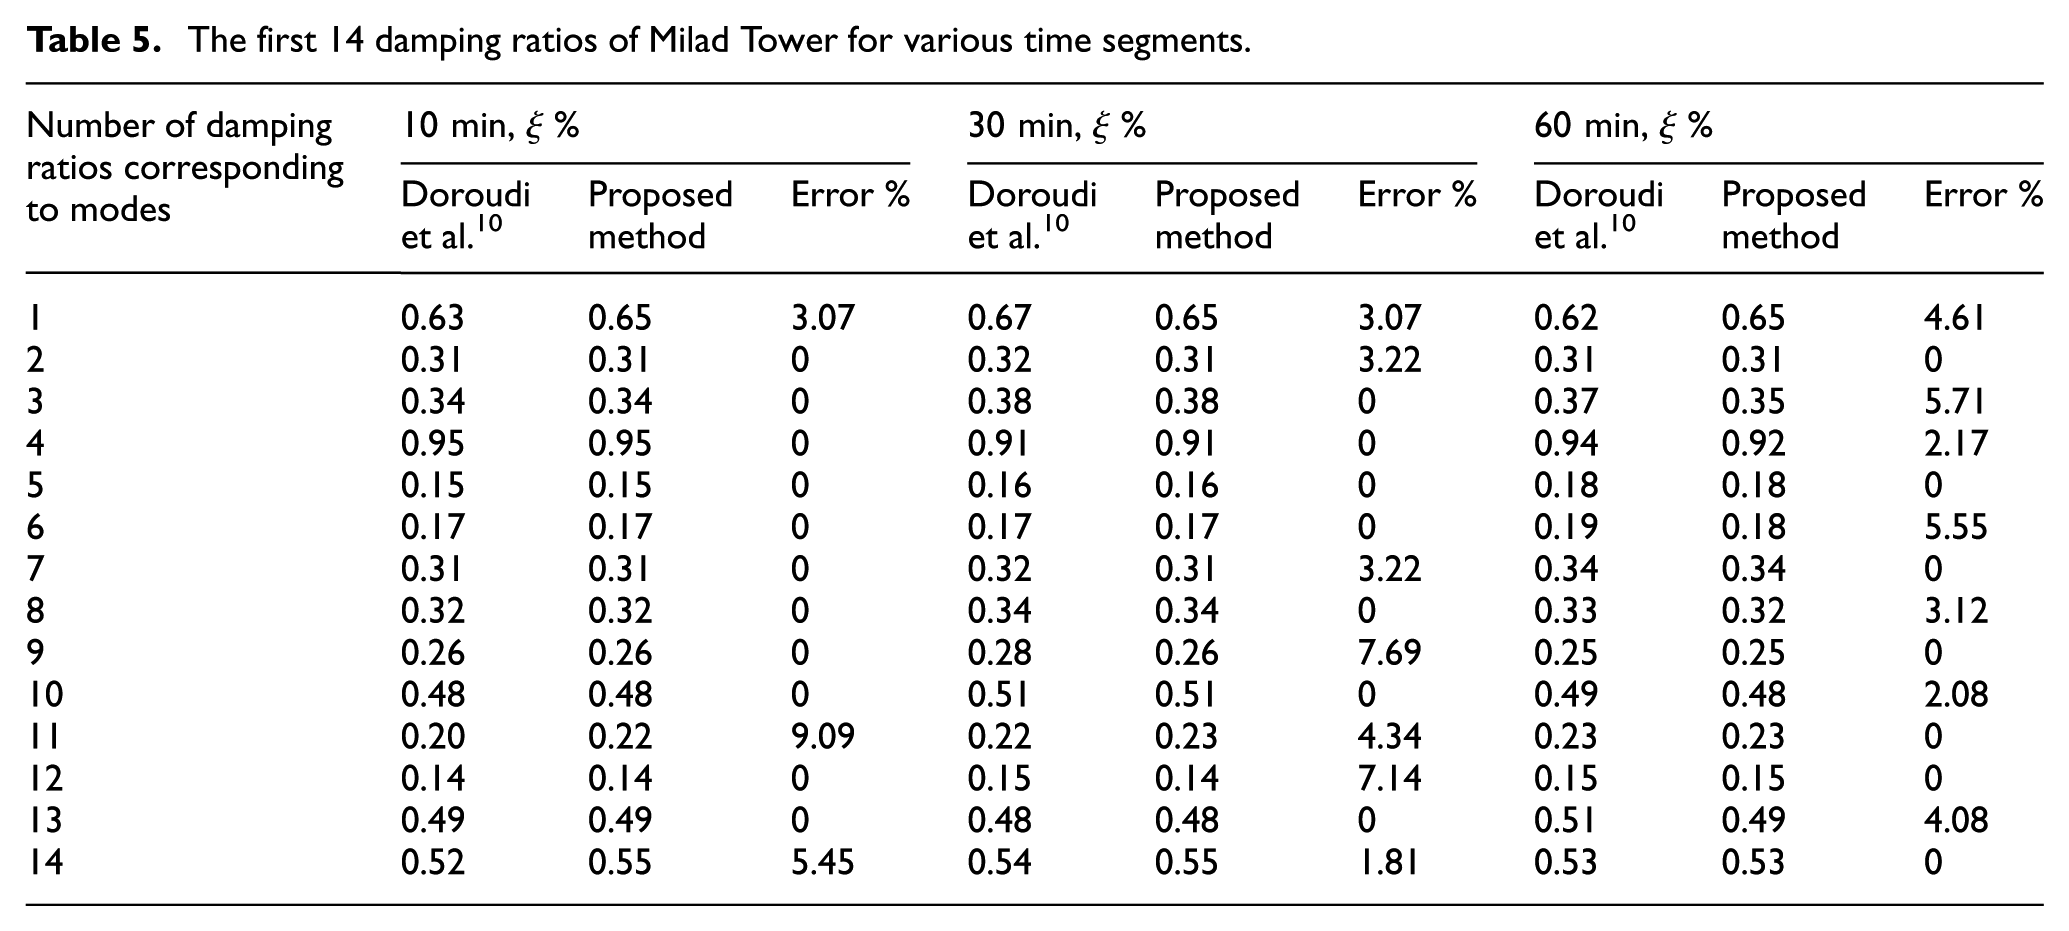
Figure 11 illustrates the first 14 natural mode shapes of the Milad Tower, corresponding to the frequencies obtained via the proposed method for the 10-min segment. Subsequently, the damping ratios of the Milad Tower are estimated using the half-power bandwidth method. As described in section “Half-power bandwidth method,” the peak frequency is determined via MVMD, and the associated damping ratio was calculated in accordance with equation (13). Table 5 presents the estimated damping ratios for the 14 dominant modes of the Milad Tower across the 10, 30, and 60-min data segments. The results remain highly consistent across all durations, with the majority of modes showing negligible variation and differences typically limited to only a few percent. Even for the modes exhibiting slightly larger deviations, the maximum discrepancy across all segment lengths does not exceed approximately 9%, which is within the expected range for damping estimates derived from ambient vibration measurements. The close agreement between the different time segments, as well as the strong consistency with previously published reference values in Doroudi et al., 10 further confirms the robustness, accuracy, and reliability of the proposed MVMD-based damping estimation framework.
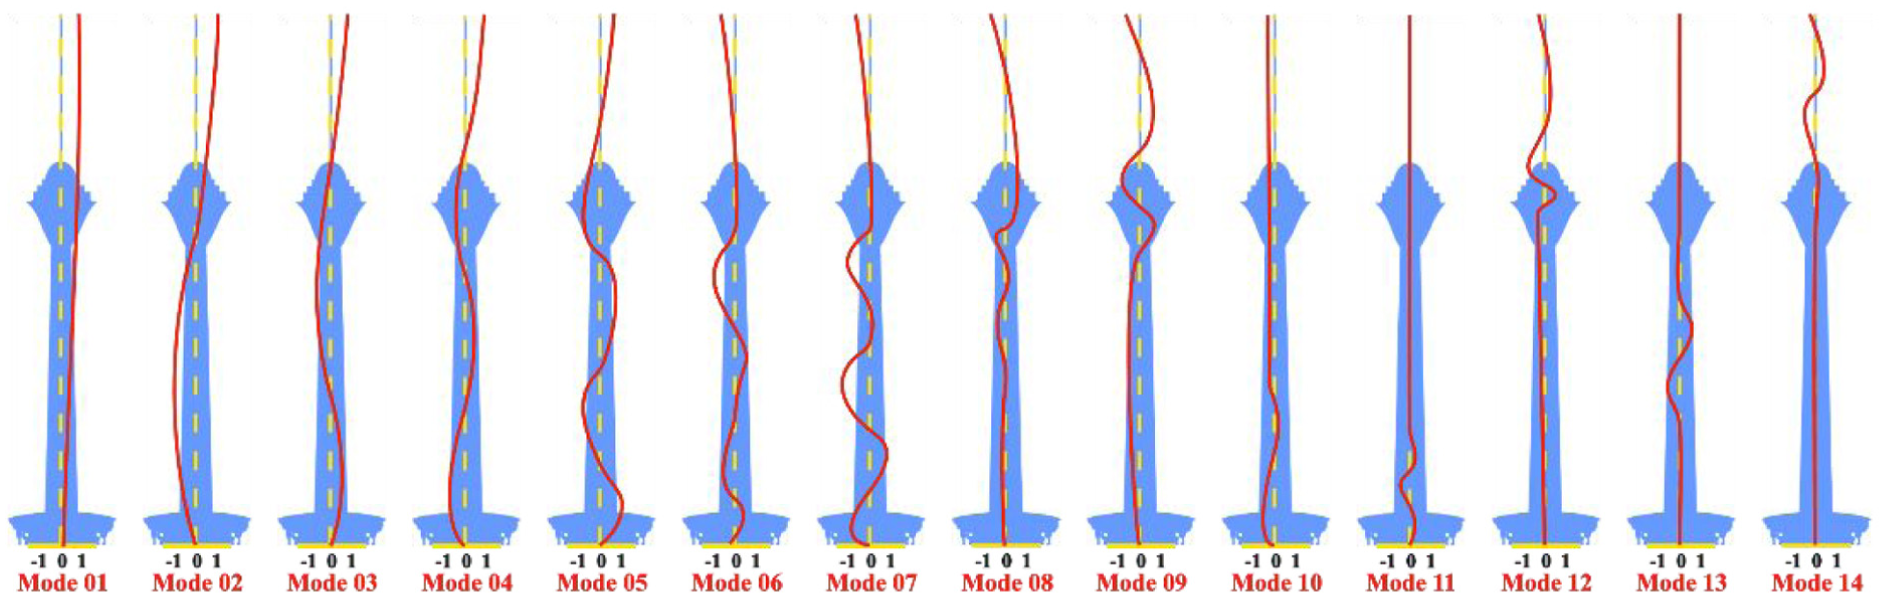
Identified mode shapes for the first 14 modes of Milad Tower.
The first 14 damping ratios of Milad Tower for various time segments.
Identifying the dynamic characteristics of Canton Tower
A similar analytical approach is adopted for the Canton Tower case. In this scenario, 10 channels are used, encompassing 20 accelerometers installed in both x- and y-directions. These sensors are located at elevation levels of 30.63, 119.30, 171.10, 228.50, 275.30, 332.15, 384.24, and 446.80 m. The frequency band of interest spans from 0.0488 to 1.5 Hz. The acceleration signals are segmented into durations of 10, 30, and 60 min. Based on the selection criteria detailed in section “Identifying the best data segment” and governed by equations (1)–(7), the optimal segment is identified for each sensor. Table 6 summarizes the most representative segments across all time divisions. Moreover, Figure 12 presents the time-domain responses, standard deviation, RMSE, skewness, kurtosis, crest factor and energy interaction for Channel 10 in the x-direction when using 10-min segmented signals. As illustrated in Figure 12, the computed ASI index identifies segment 98 as the optimal selection for Channel 10 in the x-direction, corresponding to the 10-min time window. This indicates that, for this specific channel and time duration, segment 98 offers the most suitable data quality for further analysis. Following the same methodology employed in the Milad Tower case, the most appropriate segments for all channels and time intervals in the Canton Tower dataset are selected accordingly. A comprehensive summary of these selected segments across all considered durations is provided in Table 6. A similar ASI weighting sensitivity check was conducted for the Canton Tower following the same procedure applied to the Milad Tower. The six ASI weights were perturbed by ±10% over 100 random trials, and for each perturbed weighting set the ASI score was recomputed and the optimal segment was identified again. As in the Milad Tower case, the selected segment remained unchanged across all trials, confirming that the ASI-based ranking for the Canton Tower is also highly robust to moderate variations in the weighting scheme and that the selected segments provide a reliable input for the subsequent SO-MVMD modal identification.
The selected segments across durations.
Analysis of Canton Tower acceleration data: statistical and signal parameters in 10-min segments.
The preprocessing workflow for the Canton Tower follows the same approach applied to the Milad Tower. Based on the sampling frequency, each signal is decomposed into nine levels using WT. To isolate the target frequency band and suppress noise, the approximation coefficient at level 9 (A9) along with the detail coefficients from levels 1 through 4 (D1–D4) are set to zero. This filtering strategy is consistently applied to all optimal segments selected across different time intervals, including 10, 30, and 60 min.
Figure 13 presents the IMFs derived from Channel 10 in the x-direction for the 10-min segment. Then, the dominant frequency of each IMF is extracted based on the highest amplitude observed in the PSD. This process is repeated for all IMFs to capture the full spectrum of natural frequencies related to the structure. The identified modes are then sorted to determine the set of significant frequencies for the Canton Tower.
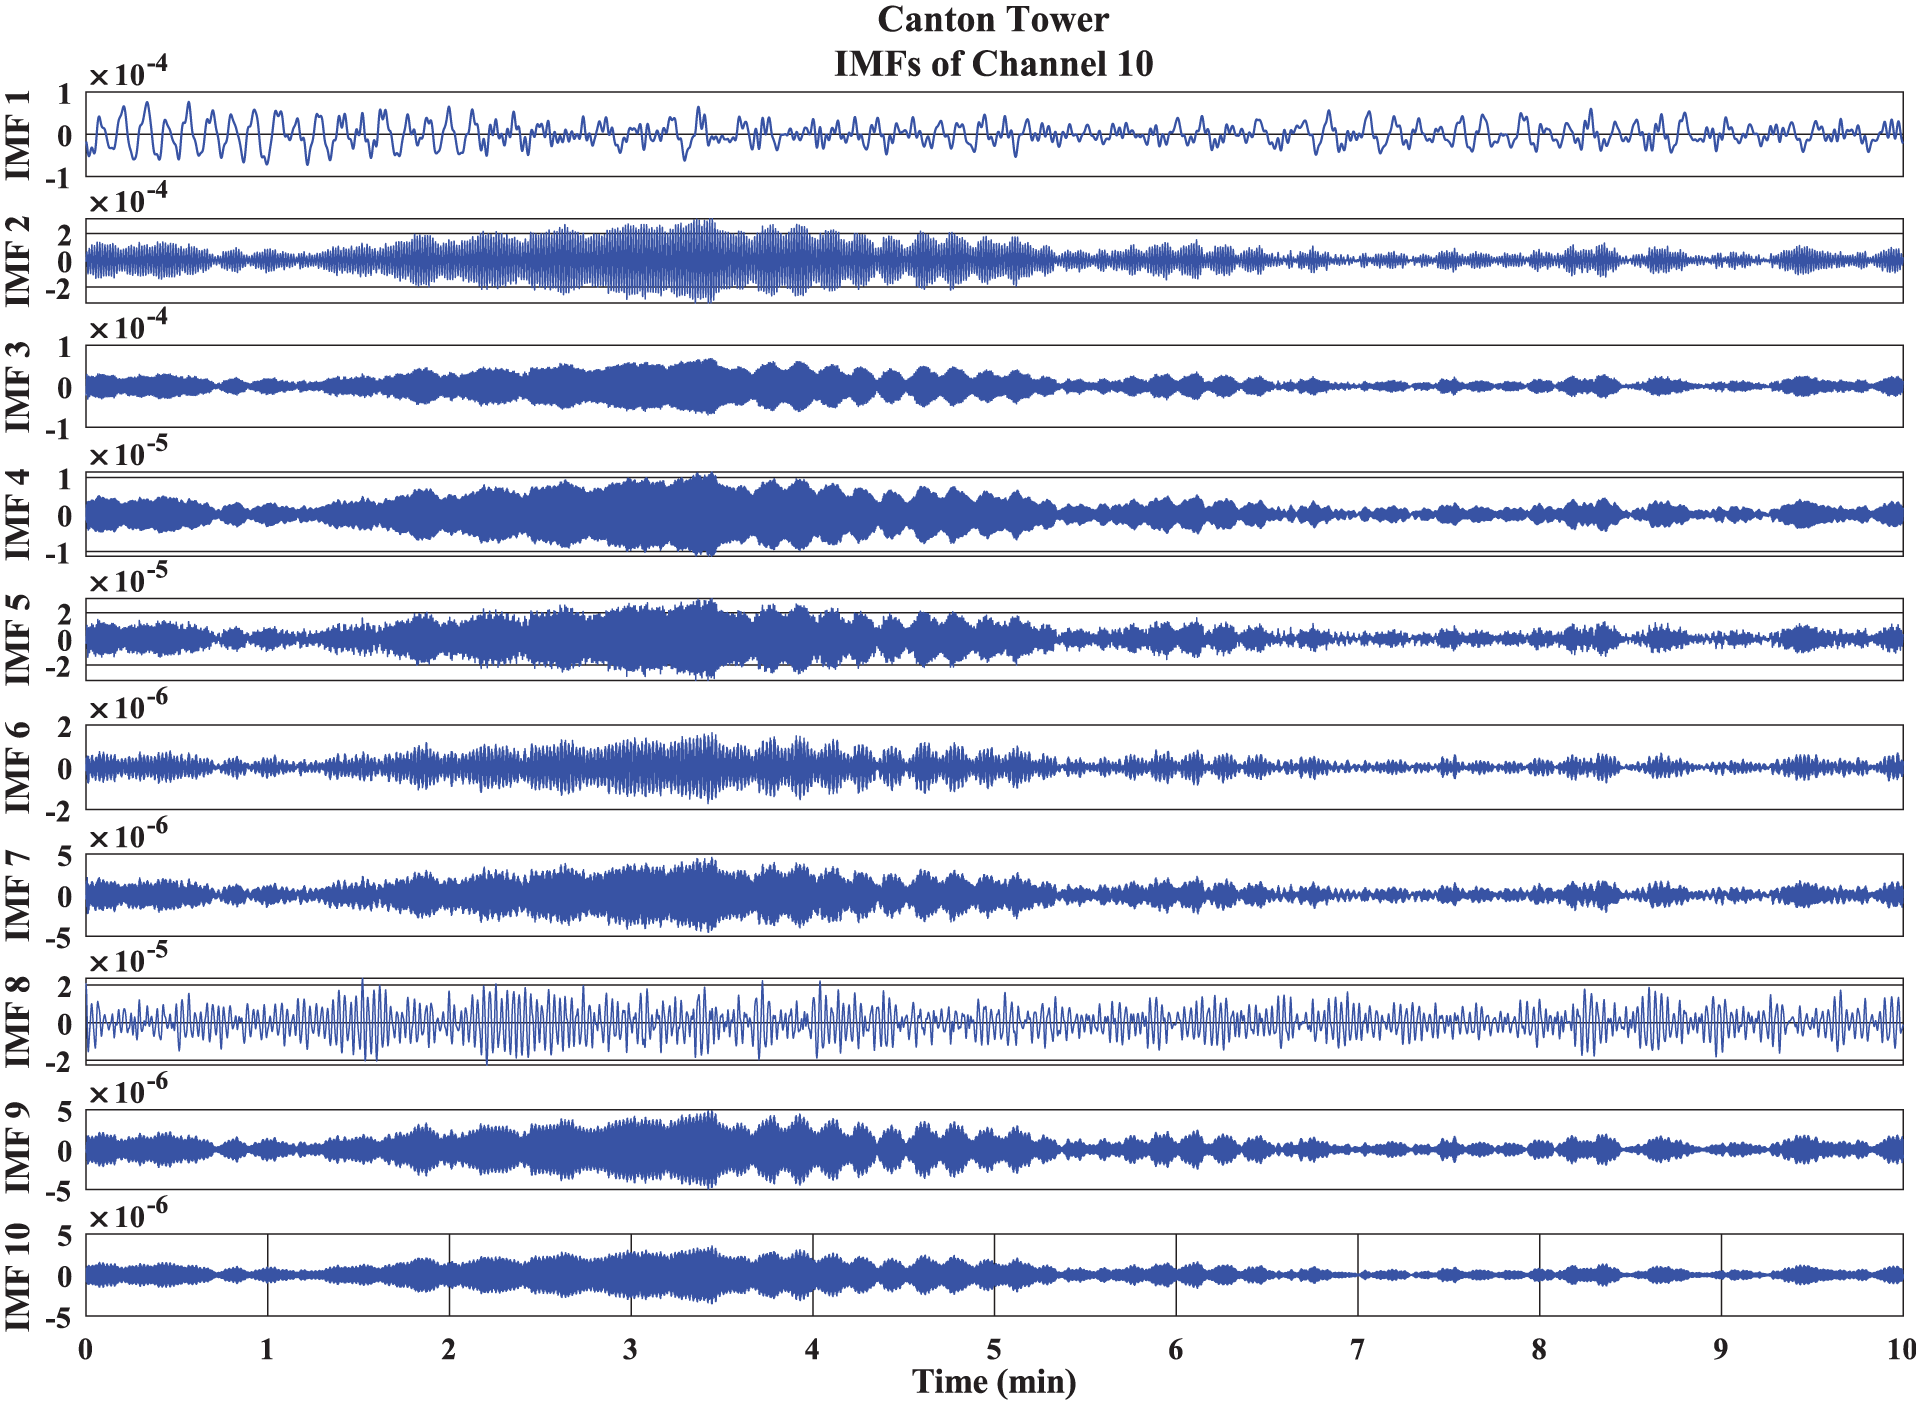
The IMFs of channel number 10 at x-direction for 10-min time duration for Canton Tower.
Doroudi et al., 10 Niu et al., 47 Zhang et al. 48 were selected as benchmarks to validate and compare the analytical results of the proposed method. Table 7 presents the comparison, where the error is defined as the deviation between the mean frequency values reported in these references and the modal frequencies extracted by the proposed method across various time durations. As shown in Table 7, the errors for all three segment durations (10, 30, and 60 min) remain below 1% for every identified mode, demonstrating strong consistency with previously established results. In particular, the frequencies obtained from the 10 and 30-min windows are identical or nearly identical for all modes, with deviations below 0.3%. The results from the 60-min window coincide exactly with those from the shorter windows, resulting in a maximum variation of only 0.63% across all modes. These observations confirm that the proposed approach is highly accurate and essentially insensitive to the choice of segment duration, providing stable modal identification for the Canton Tower.
The first 11 modes of Canton Tower estimated by the proposed method.
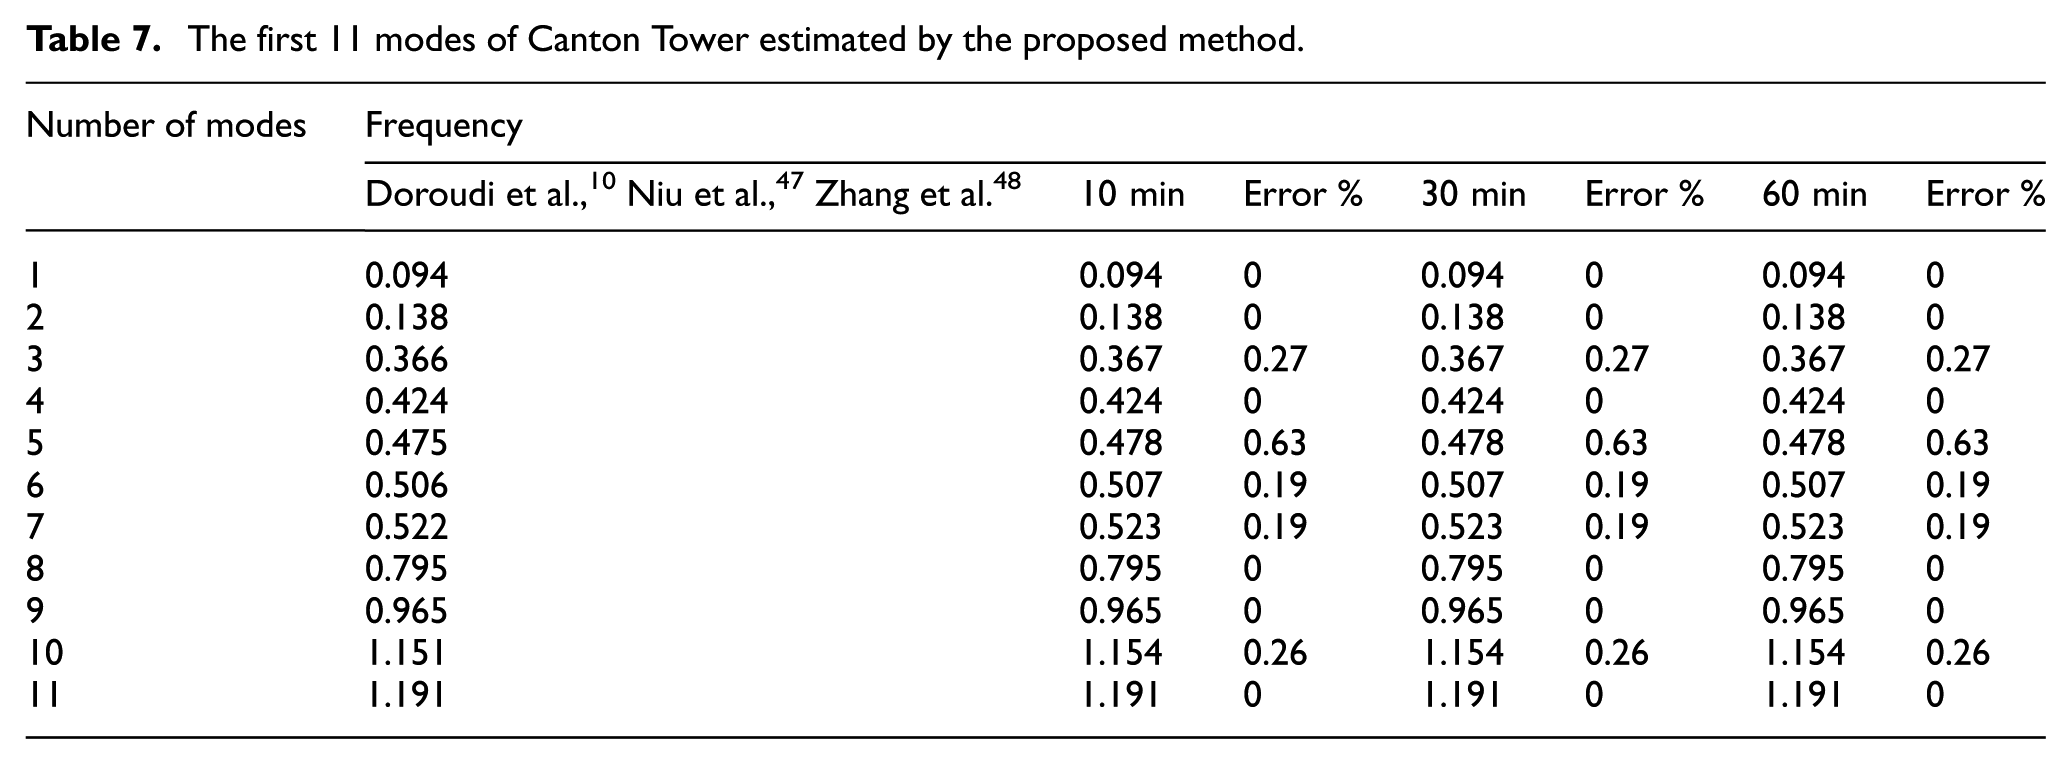
Figure 14 illustrates the frequencies extracted from all channels for the best 10-minu segment using filtered PSD analyses. Colored circles represent the identified frequencies, while the red lines indicate the reference average frequencies. It is evident from the Figure that PSD yields several spurious frequencies, highlighting the limitations of traditional PSD methods and the robustness of the proposed technique.
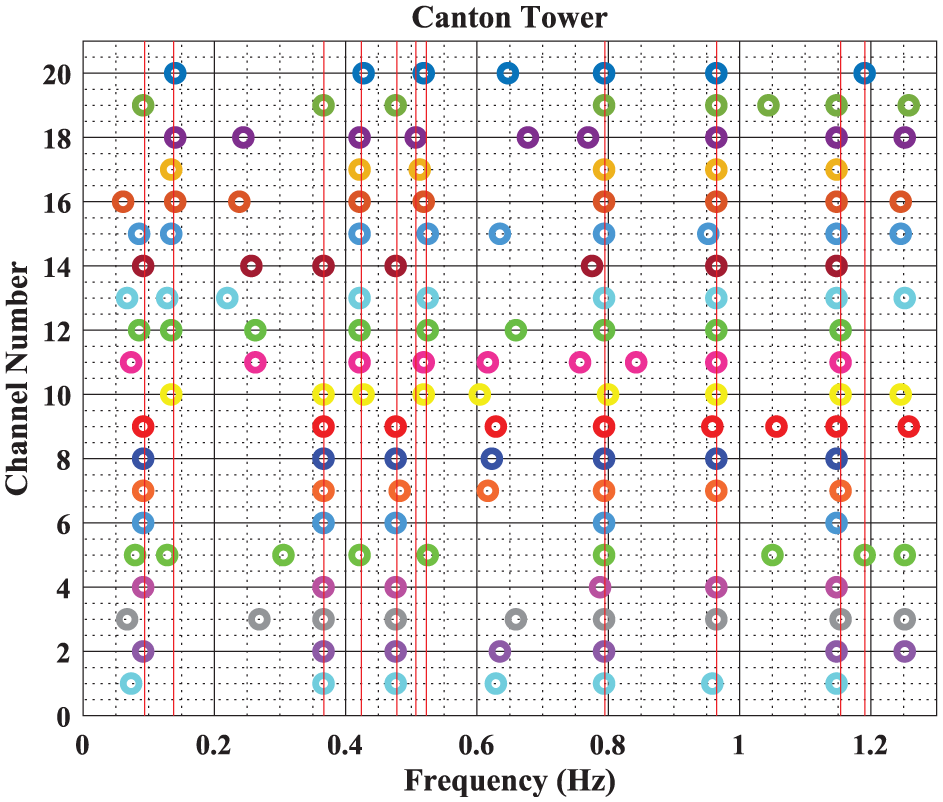
PSD-extracted frequencies from optimal 10-min segments (all channels).
Figure 15 presents the mode shapes of the Canton Tower corresponding to the identified frequencies obtained by the proposed method using the 10-min segmented time duration. The first 11 mode shapes exhibit close agreement with those reported in previous studies, such as Doroudi et al., 10 Zhang et al. 48
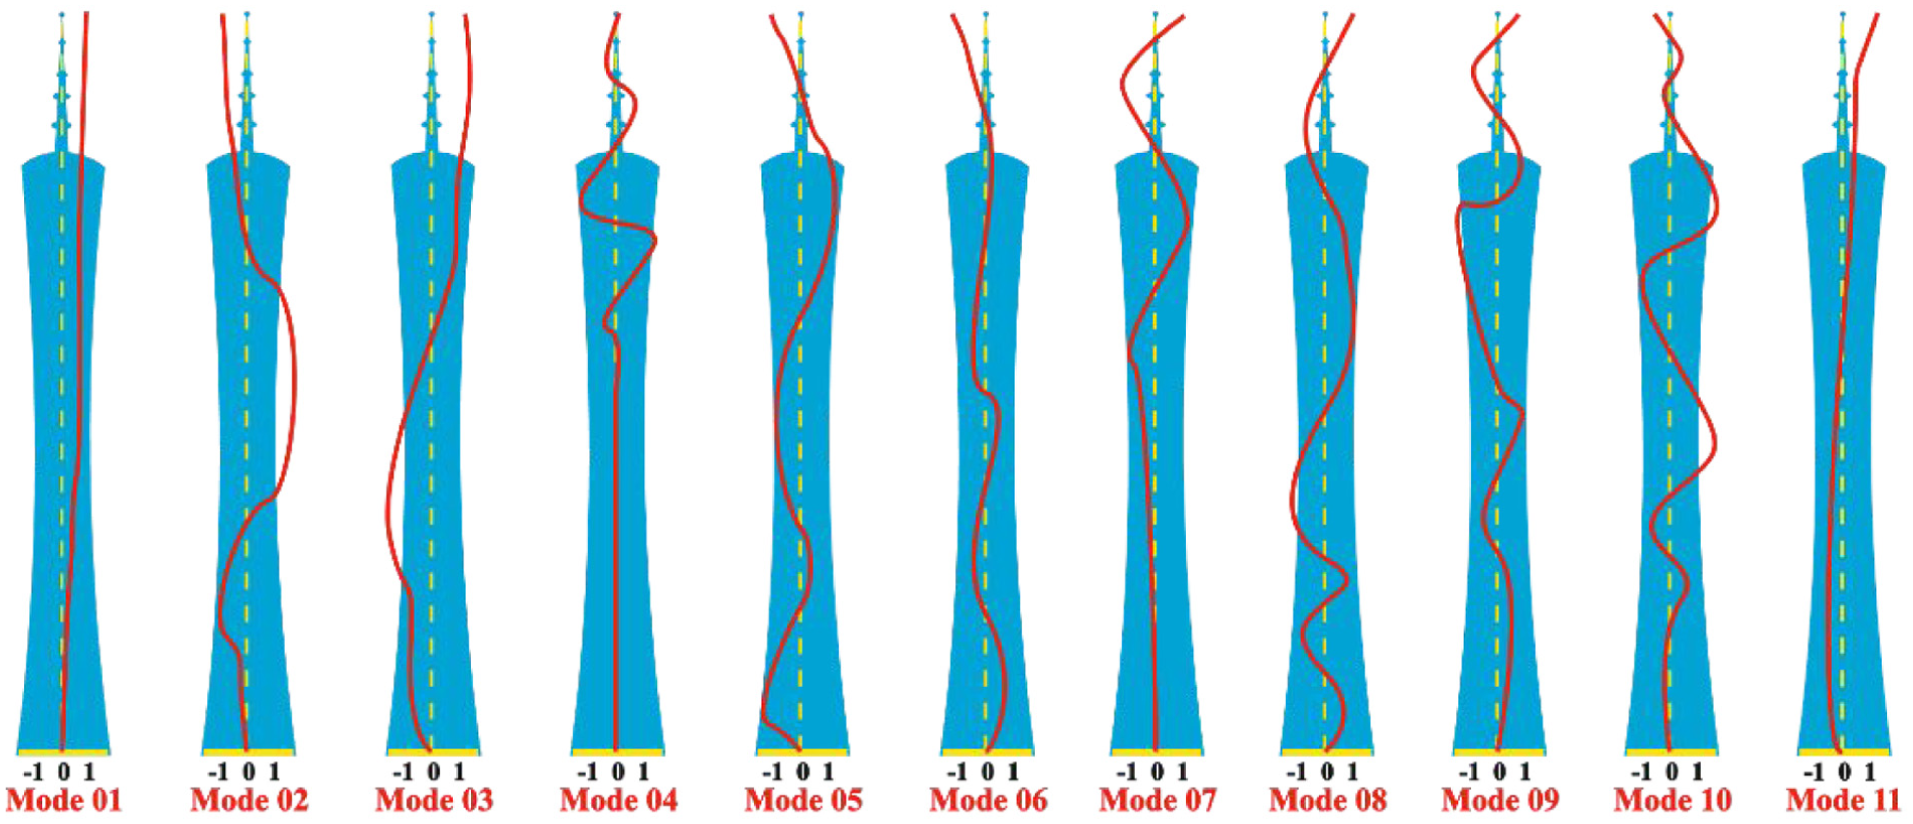
Identified mode shapes for the first 11 modes of Canton Tower.
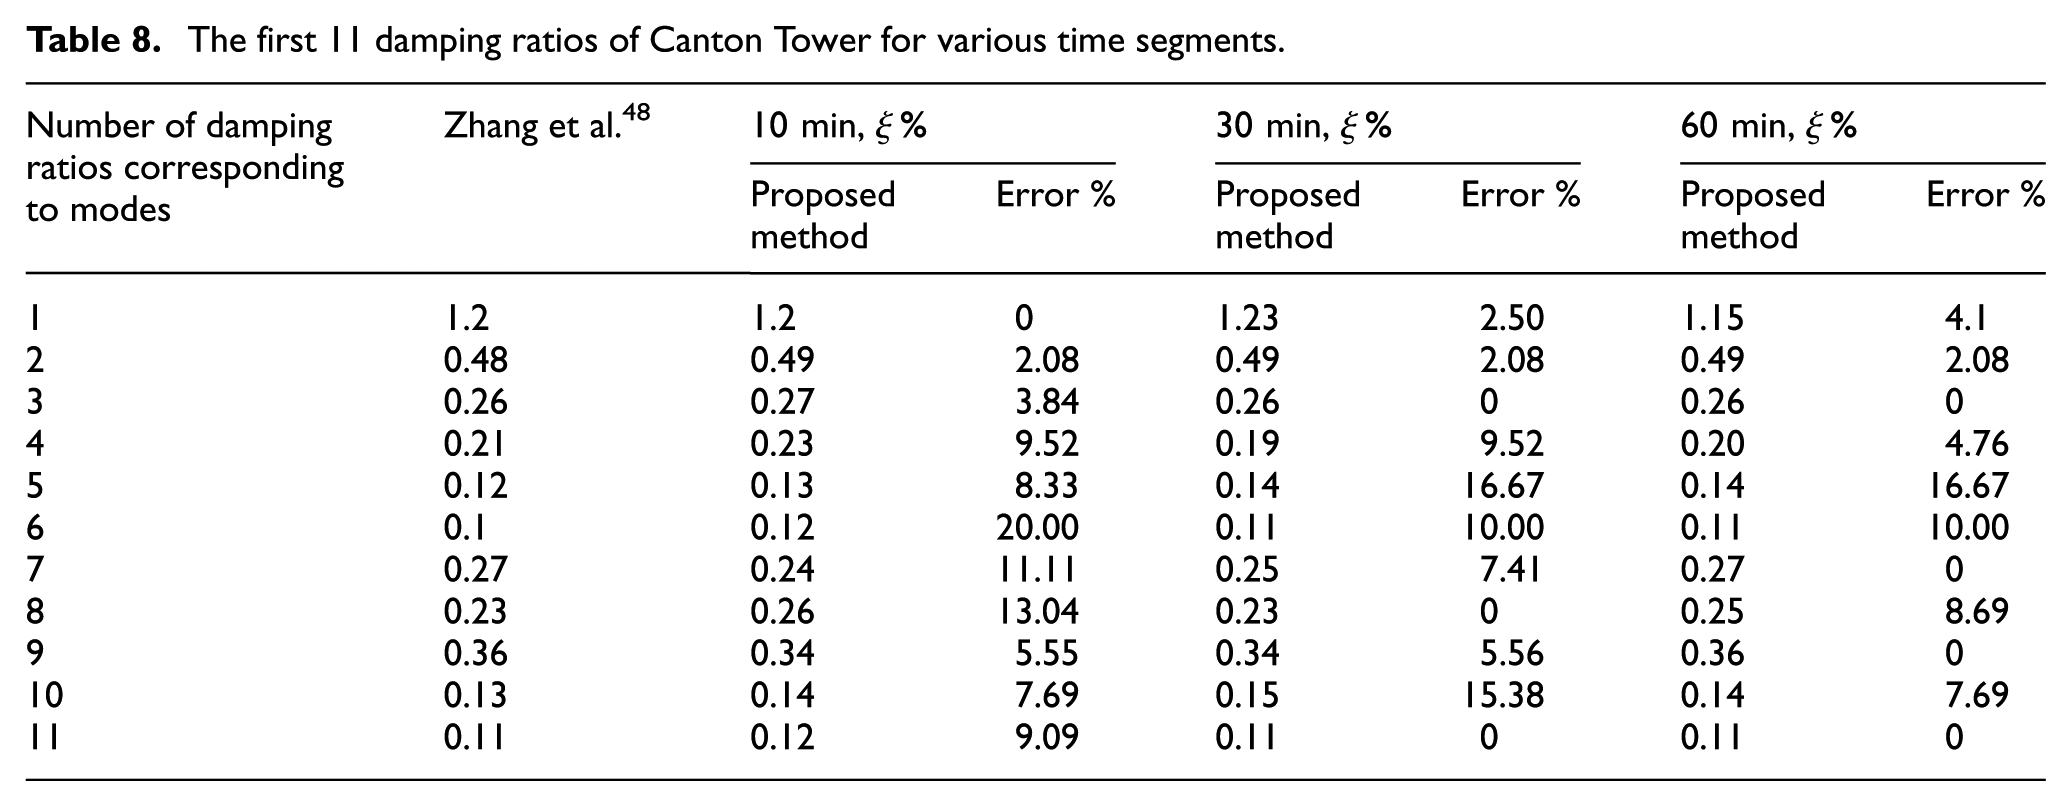
Subsequently, the damping ratios for each mode are estimated using the half-power bandwidth method. As described in section “Half-power bandwidth method,” the peak frequency (fpeak) is extracted via the MVMD process, and the corresponding damping ratio is calculated using equation (13). Table 8 summarizes the estimated damping ratios for all 11 identified modes across the three segmented time durations. Overall, the variations in the estimated damping ratios are small for most modes, with several exhibiting negligible differences between the 10, 30, and 60-min windows. A few modes show slightly larger deviations, which is expected due to the natural sensitivity of damping estimation in ambient vibration analysis. The obtained values are generally higher than the average reference values reported in Zhang et al., 48 a difference that can be attributed to inherent uncertainties and methodological variability in damping identification. Despite these variations, the overall consistency across segment durations confirms the reliability of the proposed approach.
The first 11 damping ratios of Canton Tower for various time segments.
Identifying the dynamic characteristics of Hardanger Bridge
A similar analytical procedure is employed for the Hardanger Bridge. In this case, 20 channels of acceleration data are utilized, corresponding to sensors installed along the deck and towers of the structure. These accelerometers capture vibrations in both longitudinal and transverse directions, providing a comprehensive dataset for identifying the dynamic characteristics of the bridge under ambient excitations.
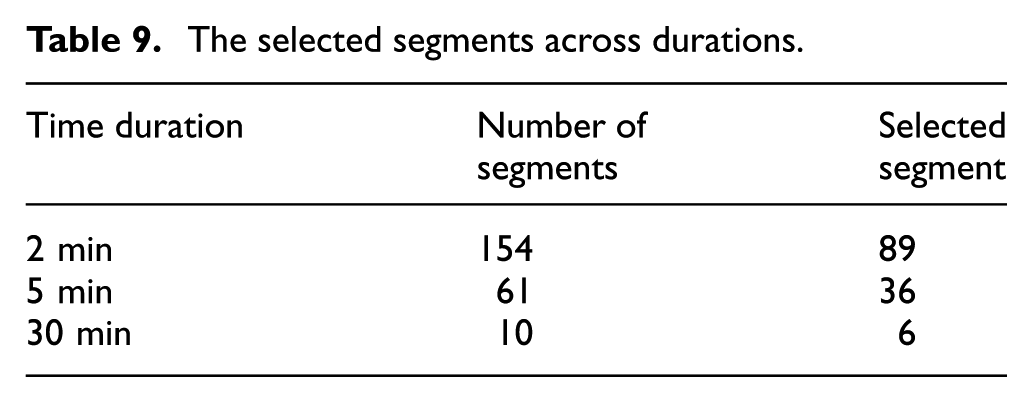
According to the selection process described earlier and guided by the evaluation metrics, the most suitable segment for each sensor is determined. For instance, in the case of sensor H5W in the x-direction with a 2-min segmentation, Figure 16 illustrates the temporal characteristics of the signal, and the computed ASI metric identifies segment 89 as the most representative data portion for that configuration. This confirms that segment 89 contains the highest-quality information for subsequent analysis. The same assessment strategy used for the Milad Tower is extended to the Hardanger Bridge data, ensuring consistent selection of high-fidelity segments across various time durations. All selected optimal segments for the tested intervals are consolidated in Table 9. To further evaluate the stability of the ASI-based segment selection for the Hardanger Bridge, a sensitivity analysis was performed by perturbing the six ASI weights by ±10% over 100 random trials. For each perturbed weighting set, the composite index was recomputed and the optimal segment was re-selected. In all trials, the same segment was consistently identified as optimal. This result confirms that the ASI-based ranking procedure is highly robust to moderate changes in the weighting scheme and that the chosen segment remains reliable for the subsequent SO-MVMD modal identification.
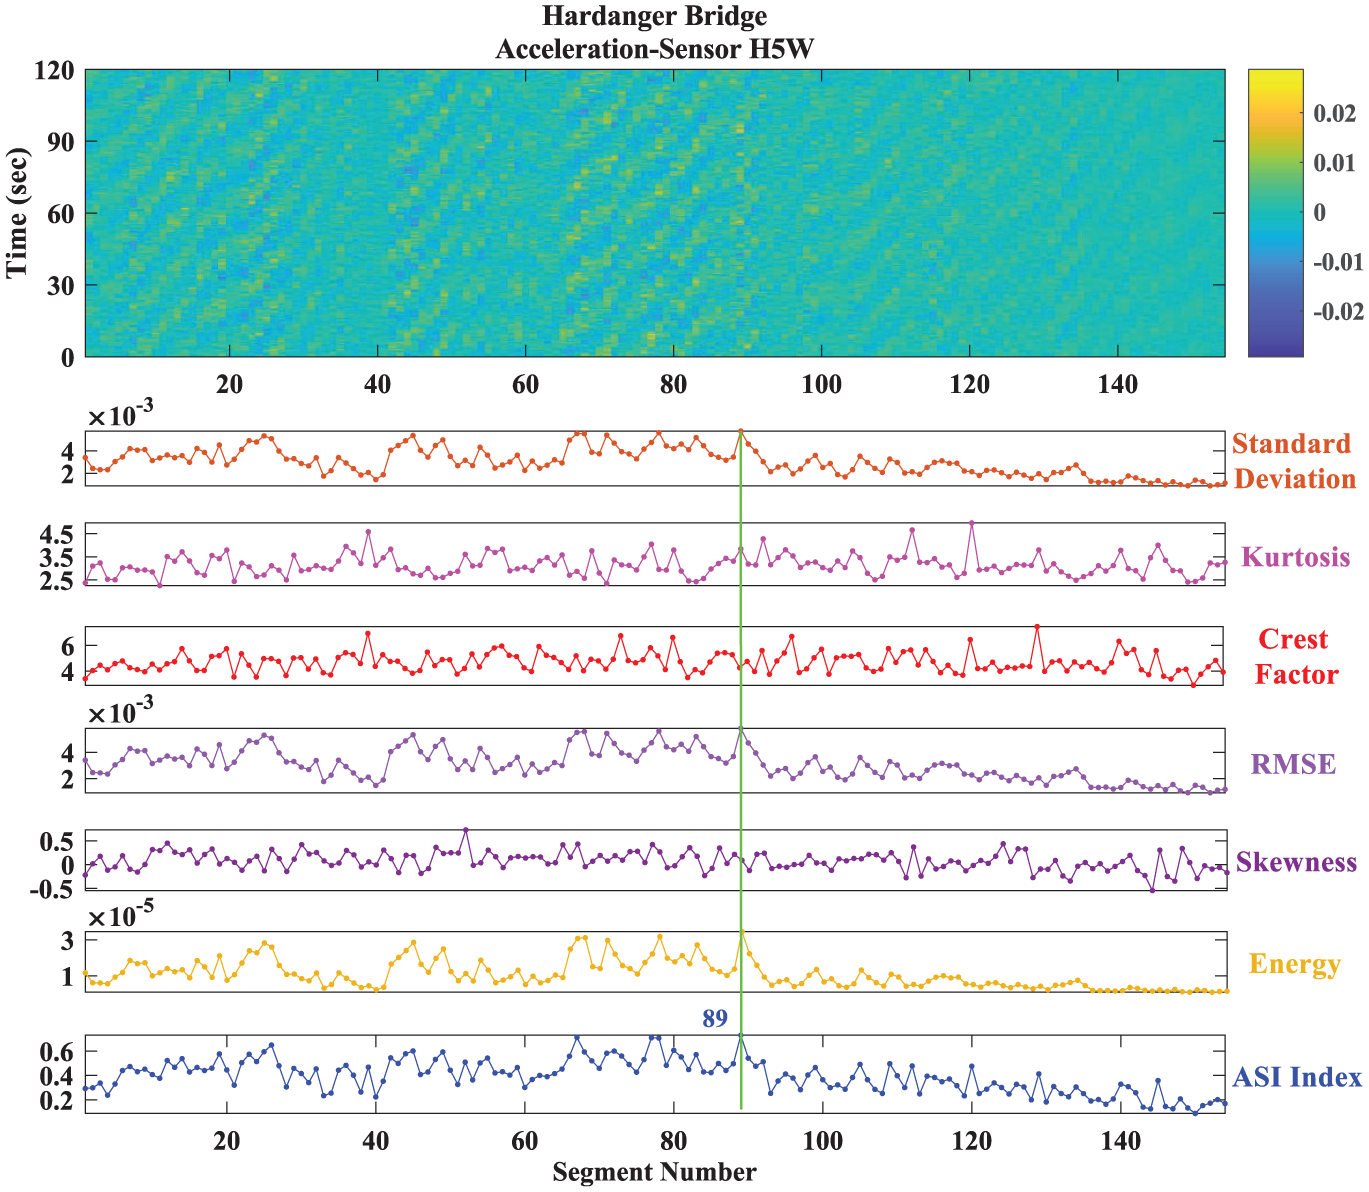
Analysis of Hardanger Bridge acceleration data: statistical and signal parameters in 2-min segments.
The selected segments across durations.
The preprocessing procedure for the Hardanger Bridge follows to the same methodology used for the Milad Tower and Canton Tower. Given the 200 Hz sampling frequency, each acceleration signal is decomposed into 13 levels using discrete WT. To recollect the frequency components within the desired range (approximately 0.0244–0.78125 Hz) and effectively eliminate noise, both the approximation coefficient at level 13 (A13) and the detail coefficients from levels 1 through 7 (D1–D7) are discarded. The remaining coefficients from levels D8 to D12 are used to reconstruct the filtered signal. This wavelet-based filtering process is uniformly applied to all selected optimal segments across different time intervals such as 2, 5, and 30 min.
Figure 17 illustrates the set of IMFs obtained from sensor H5W in the x-direction of the Hardanger Bridge for a 2-min time segment. The first plot shows the preprocessed signal after wavelet-based filtering, followed by ten IMFs resulting from the MVMD decomposition. The dominant frequency for each IMF is determined by locating the peak amplitude in its corresponding PSD. This analysis is repeated for all IMFs to extract the full range of modal frequencies linked to the dynamic behavior of the bridge. The detected frequency components are then sorted to construct the set of prominent vibration modes.
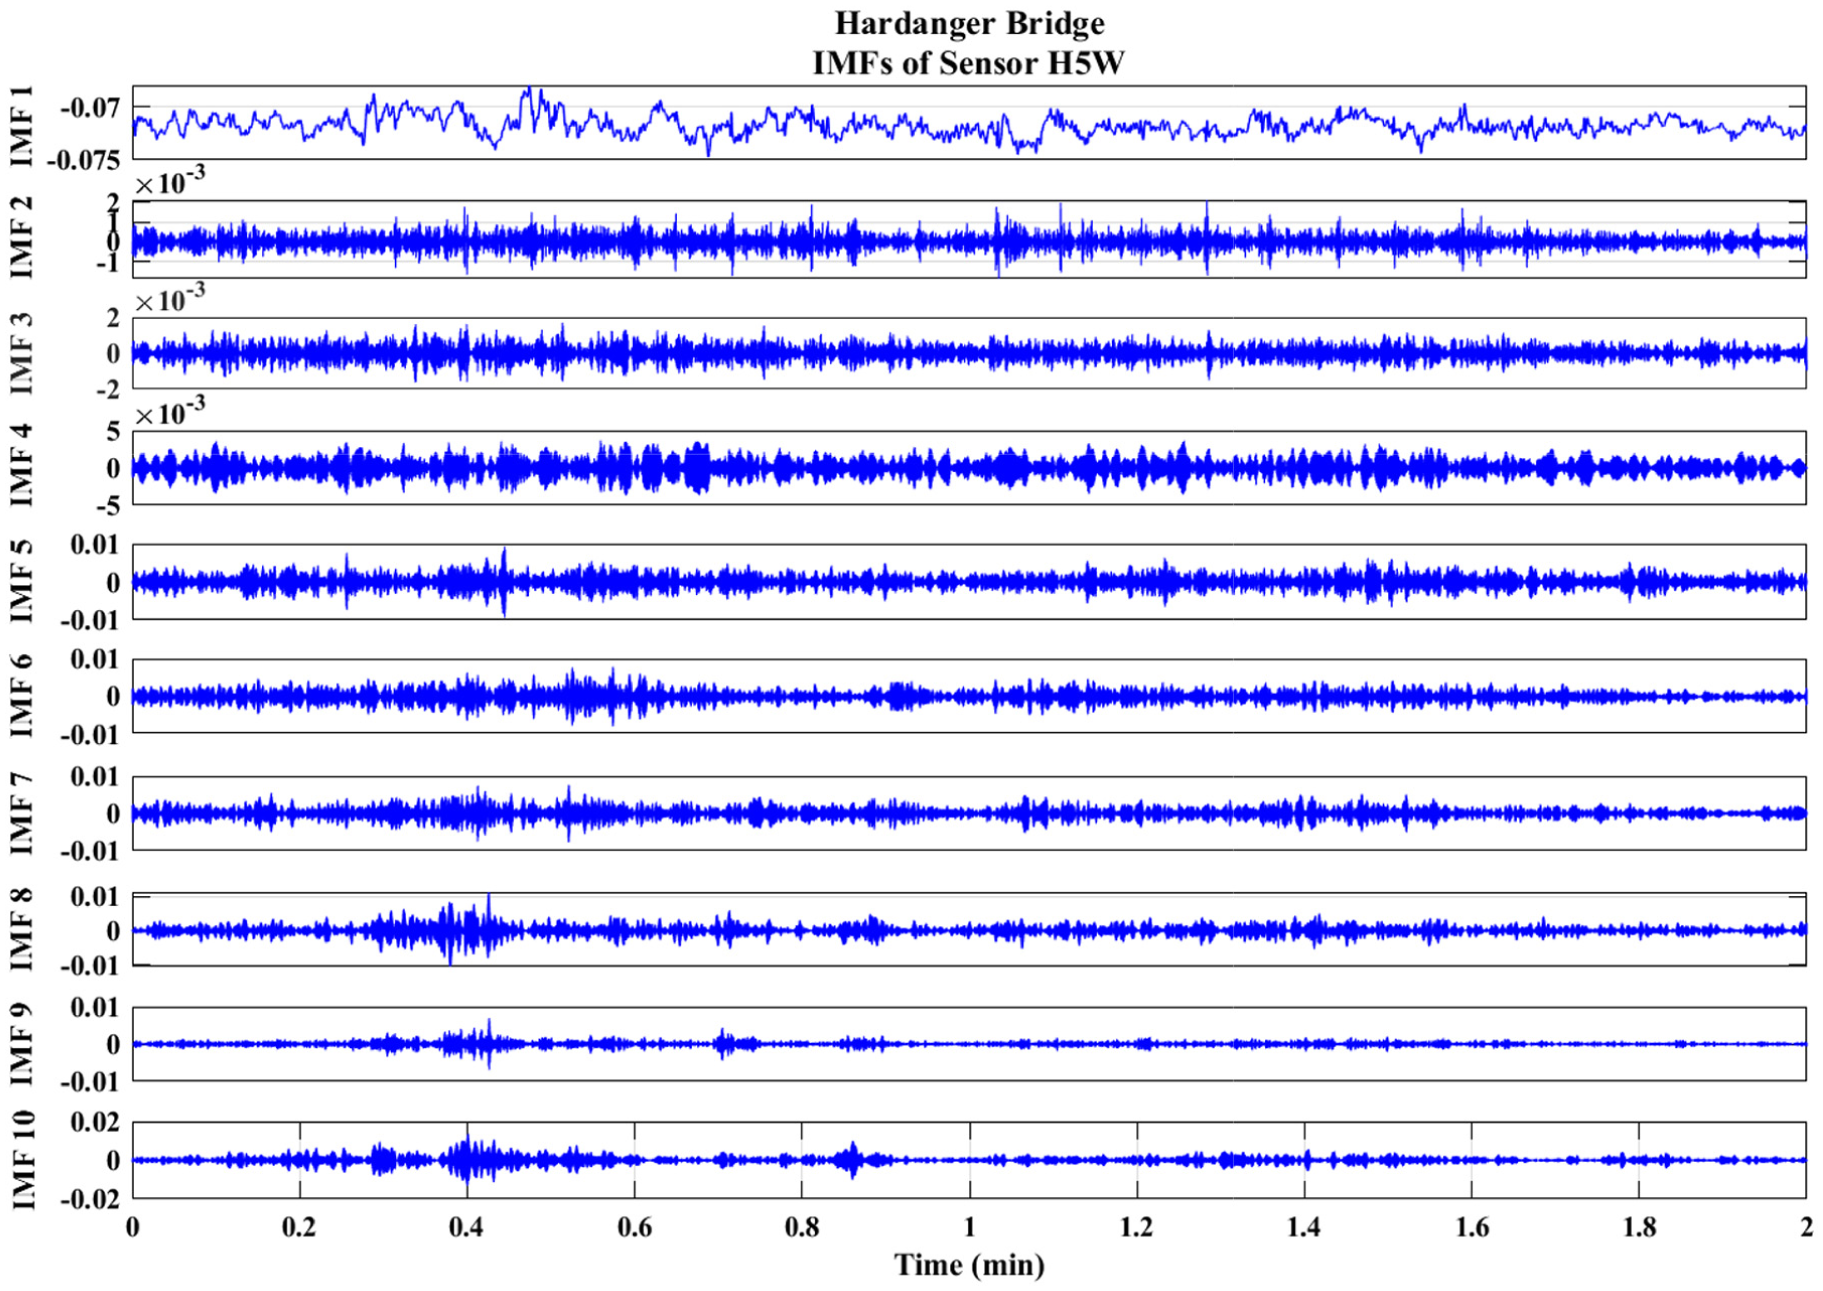
The IMFs of sensor H5W at x-direction for 2-min time duration for Hardanger Bridge.
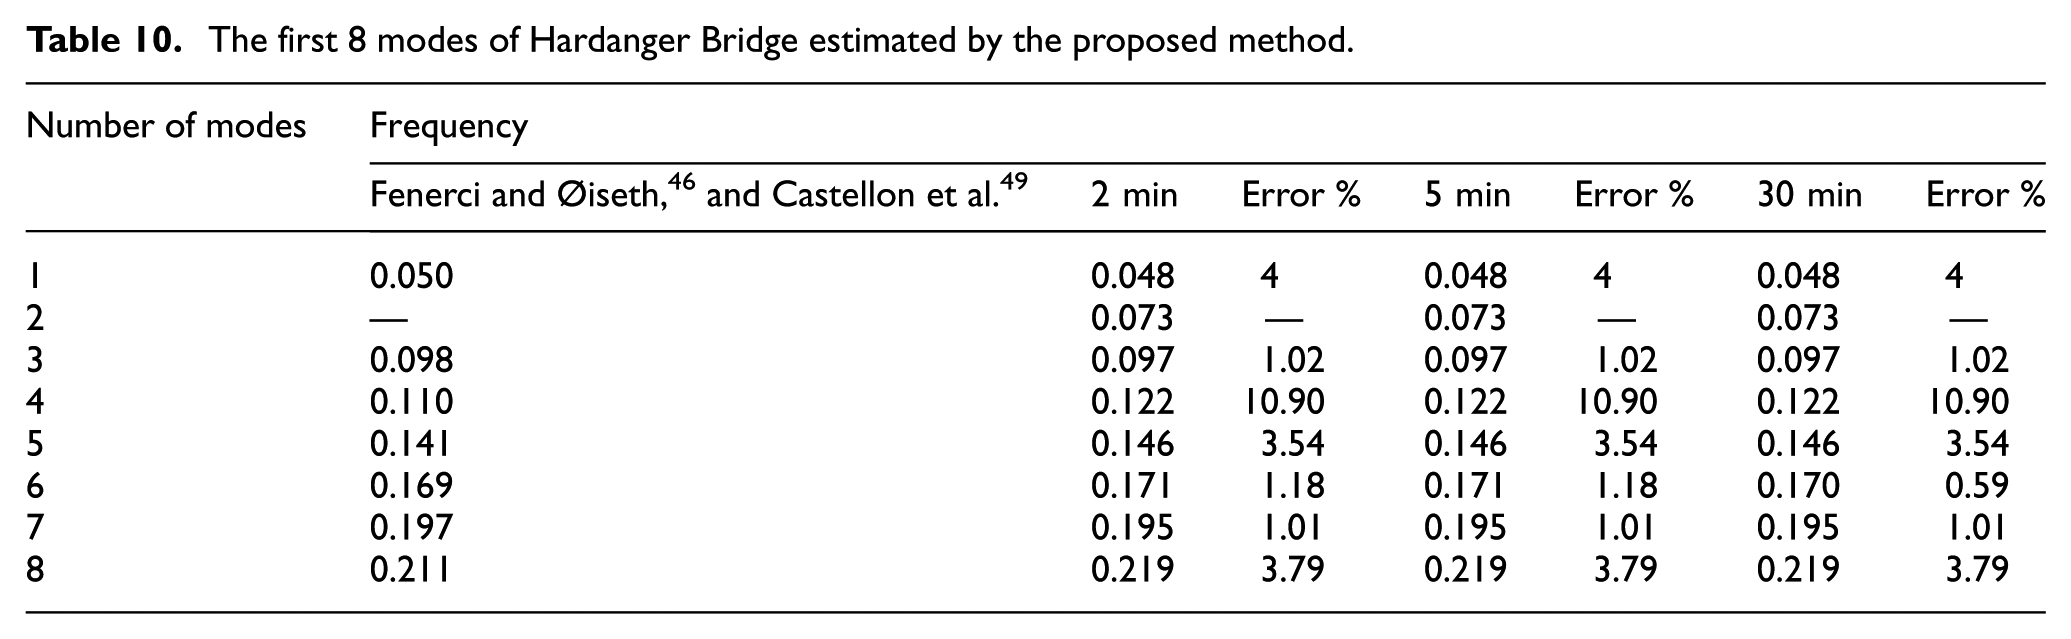
As shown in Table 10, the first eight identified frequencies of the Hardanger Bridge obtained from the 2, 5, and 30-min segments are very close to each other. For six out of the eight modes, the deviations remain below 4%, demonstrating a high level of consistency across different window lengths. The results from the 2 and 5-min segments are identical for all modes, and the 30-min window produces the same frequency estimates as well, confirming the stability of the proposed method. The largest deviation occurs for Mode 4 (10.90%), which is consistent with previous studies46,49,50 reporting that this mode is inherently sensitive in long-span suspension bridges. Overall, these observations confirm that the proposed approach remains reliable and robust with respect to segment duration for the Hardanger Bridge case.
The first 8 modes of Hardanger Bridge estimated by the proposed method.
Like Milad and Canton towers PSD with filtering method is used to compare with the proposed method, which is shown in Figure 18. As can be seen in figure, PSD with the filtering method is not successful enough to find out the frequencies of the bridge automatically. Finally, the damping ratios corresponding to the identified frequencies are presented in Table 11. As seen in the table, the estimated damping values for the 2, 5, and 30-min segments are very close to each other, indicating a high level of stability in the proposed method. The differences between the time durations are generally small, with nearly identical results for the 5 and 30-min windows and only minor deviations observed in the 2-min case. Because damping estimation in ambient vibration analysis is inherently uncertain, the obtained values do not perfectly match those reported in previous studies. Nevertheless, the overall consistency across all time durations confirms the robustness and reliability of the proposed damping identification approach for the Hardanger Bridge.
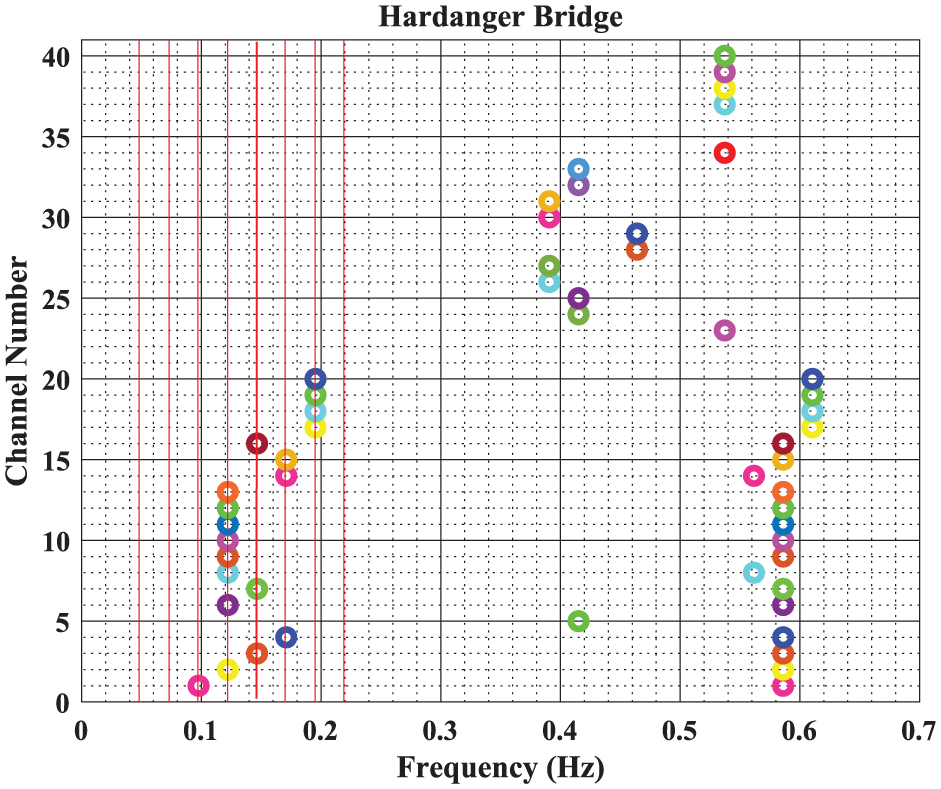
PSD-extracted frequencies from optimal 2-min segments (all channels).
The first 8 damping ratios of Hardanger Bridge for various time segments.
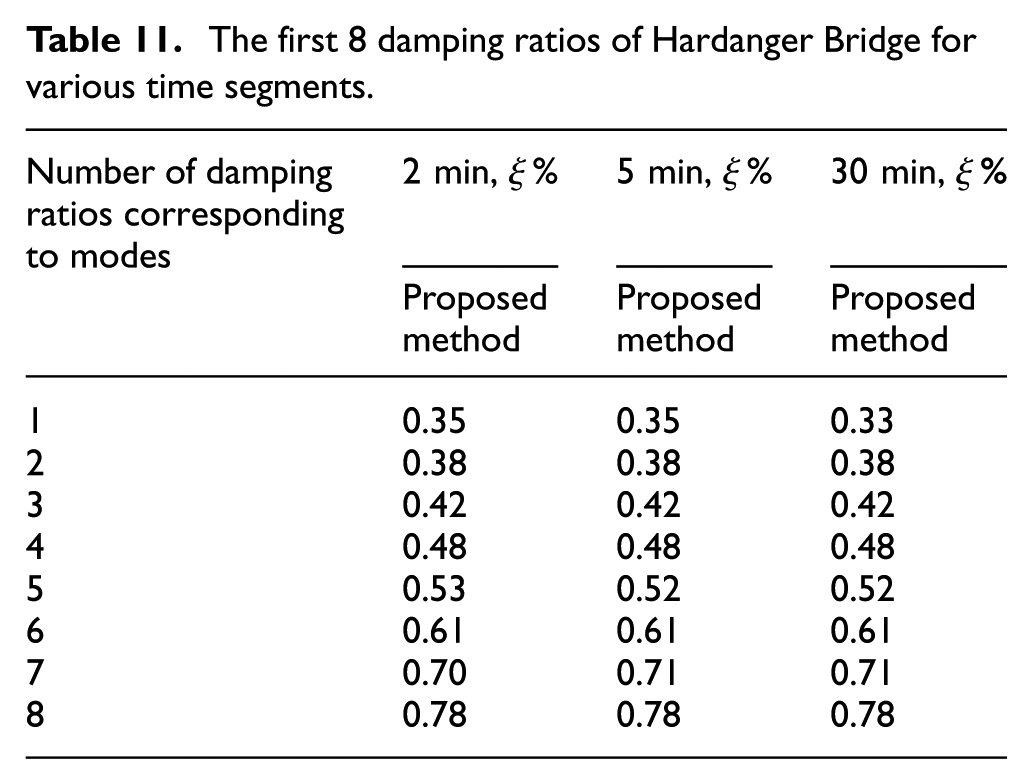
Figure 19 presents the mode shapes of the Hardanger Bridge corresponding to the identified frequencies obtained by the proposed method using the 2-min segmented time duration. The first 8 mode shapes exhibit close agreement with those reported in previous studies, such as Fenerci and Øiseth, 46 and Petersen et al. 50
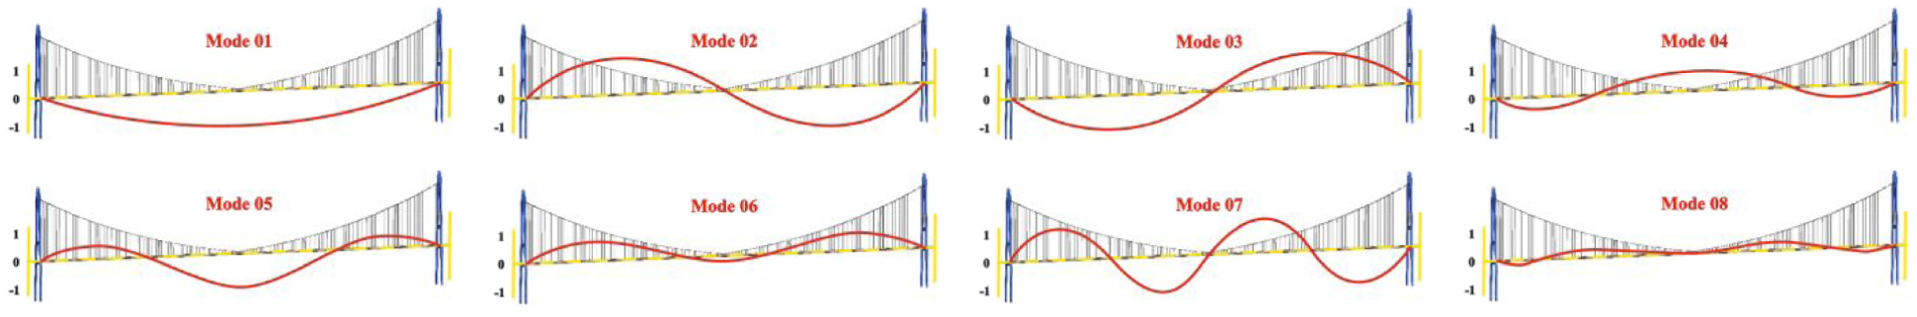
Identified mode shapes for the first 8 modes of Hardanger Bridge.
The primary objective of this study was to develop an automated framework for identifying the natural frequencies of super-tall buildings and long span bridges, facilitating structural condition assessment. Based on the results, the proposed method demonstrates high accuracy in detecting modal frequencies across multiple sensor inputs positioned at various heights, outperforming conventional approaches in both reliability and consistency. Moreover, the method effectively suppresses spurious or irrelevant frequency components compared to the traditional PSD-based approach. An additional advantage is its computational efficiency, the results obtained from various segmented time durations are highly consistent, indicating that shorter segments can yield reliable outcomes, thus reducing processing time without compromising accuracy.
Performance comparison with state-of-the-art modal identification methods
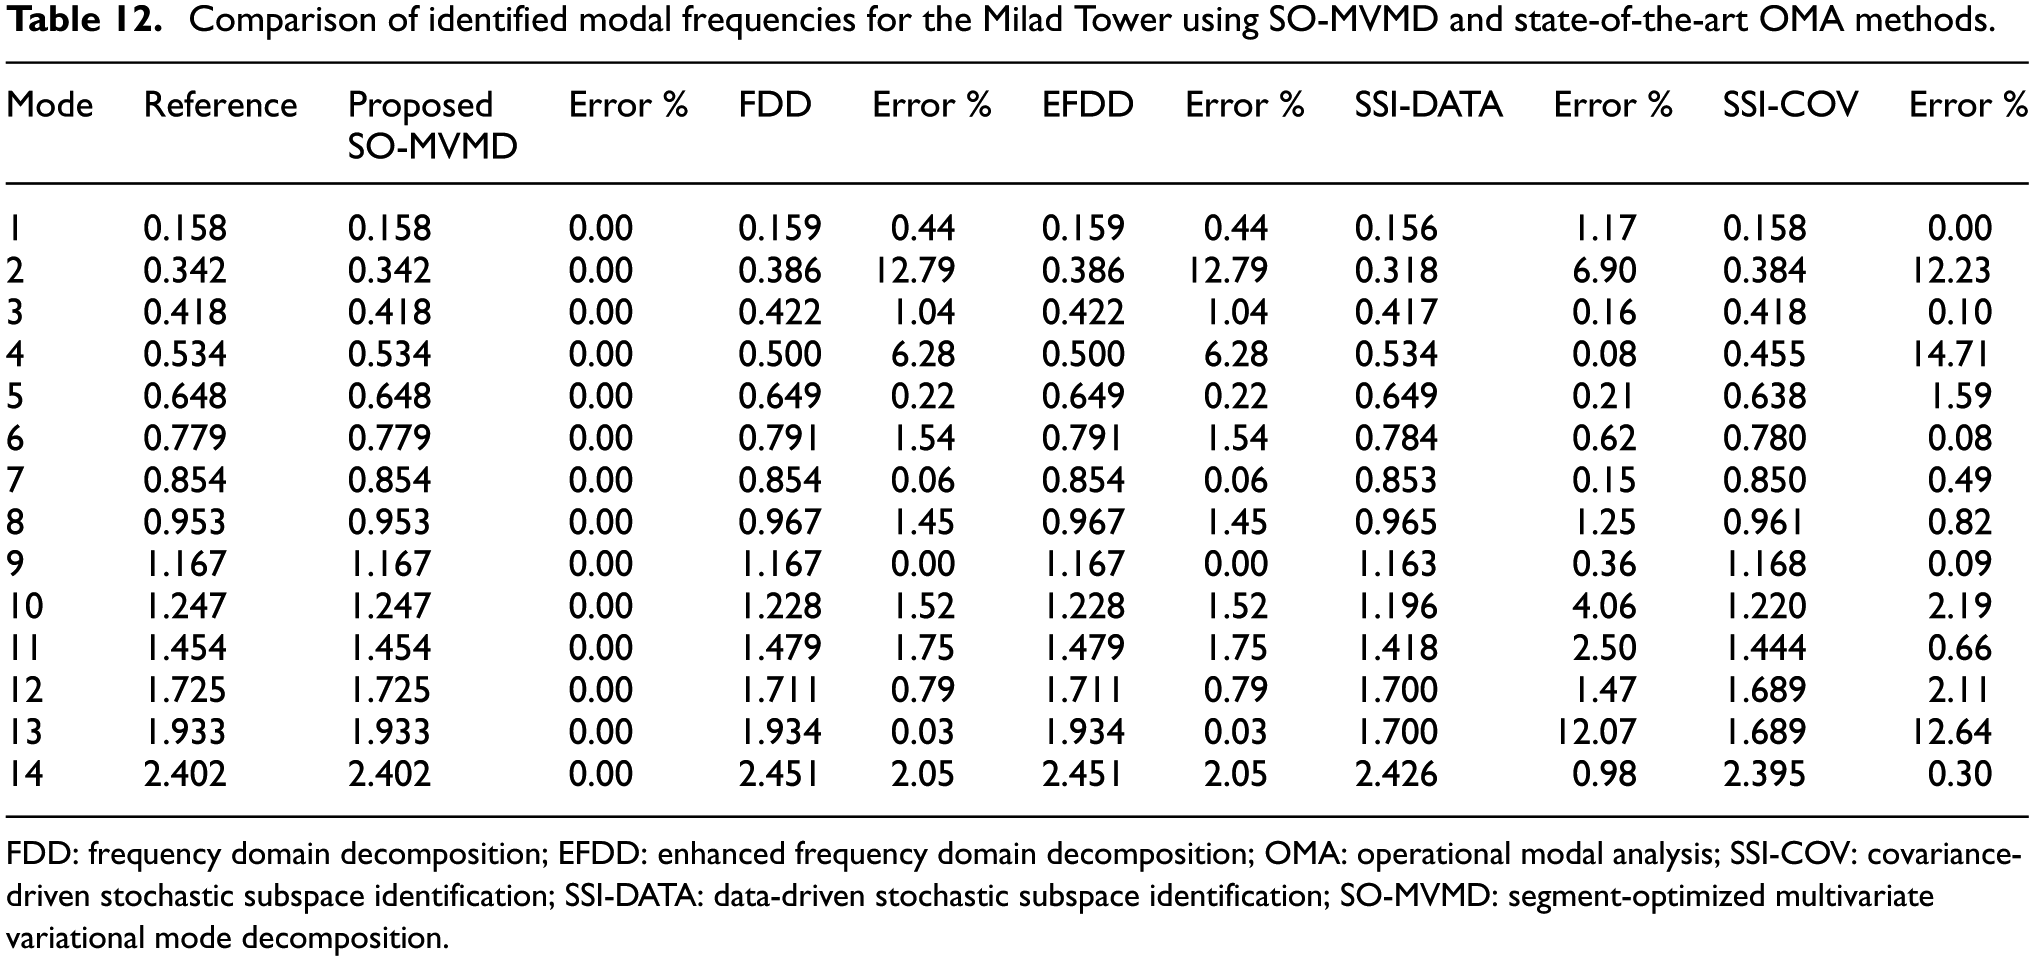
The proposed SO-MVMD framework is compared with four established operational modal analysis (OMA) methods: frequency domain decomposition (FDD), enhanced frequency domain decomposition (EFDD), covariance-driven stochastic subspace identification (SSI-COV), and data-driven stochastic subspace identification (SSI-DATA). These techniques represent widely accepted state-of-the-art approaches in both the frequency and time domains, and their inclusion enables a meaningful assessment of the SO-MVMD performance relative to standard OMA practices. All methods are applied to the same optimal segments selected by the ASI procedure to ensure a consistent and unbiased comparison. Since the optimal segments for the Milad Tower, Canton Tower, and the Hardanger Bridge were obtained using the smallest time windows (10, 10, and 2 min, respectively), the same segment durations are used in this comparative study. The results for all three structures are summarized in Tables 12–14.
Comparison of identified modal frequencies for the Milad Tower using SO-MVMD and state-of-the-art OMA methods.
FDD: frequency domain decomposition; EFDD: enhanced frequency domain decomposition; OMA: operational modal analysis; SSI-COV: covariance-driven stochastic subspace identification; SSI-DATA: data-driven stochastic subspace identification; SO-MVMD: segment-optimized multivariate variational mode decomposition.
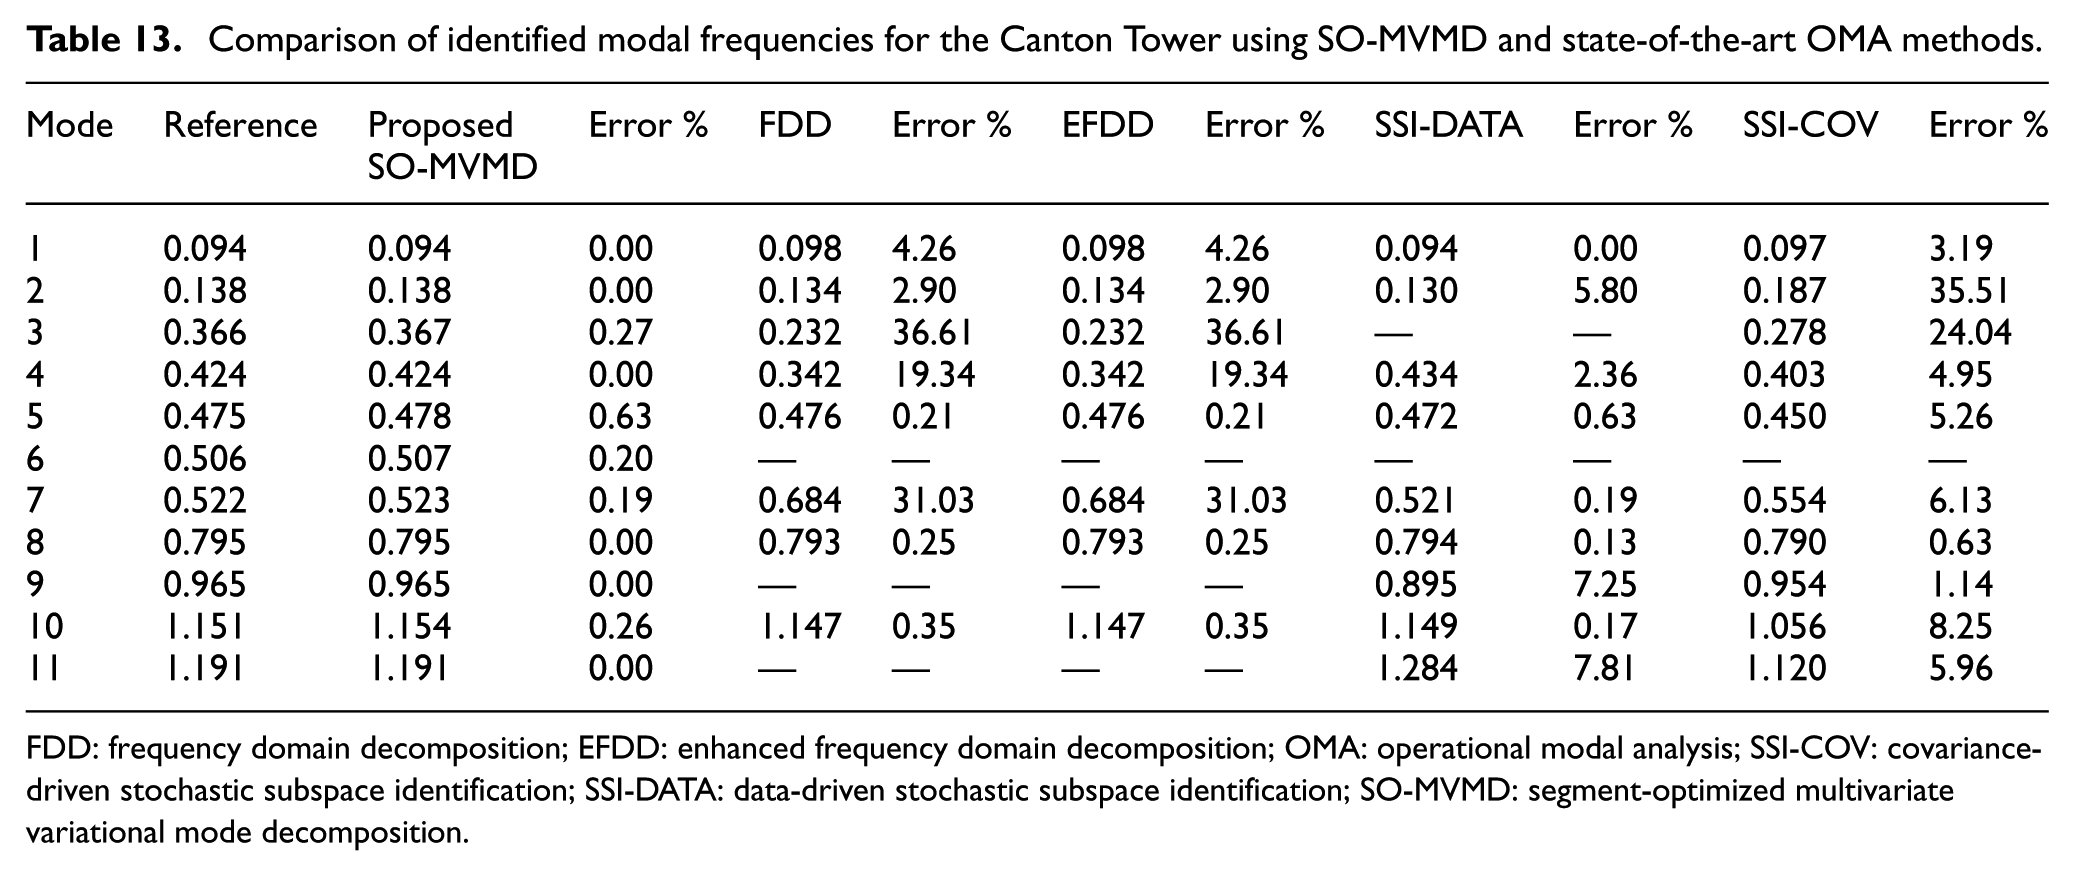
Comparison of identified modal frequencies for the Canton Tower using SO-MVMD and state-of-the-art OMA methods.
FDD: frequency domain decomposition; EFDD: enhanced frequency domain decomposition; OMA: operational modal analysis; SSI-COV: covariance-driven stochastic subspace identification; SSI-DATA: data-driven stochastic subspace identification; SO-MVMD: segment-optimized multivariate variational mode decomposition.
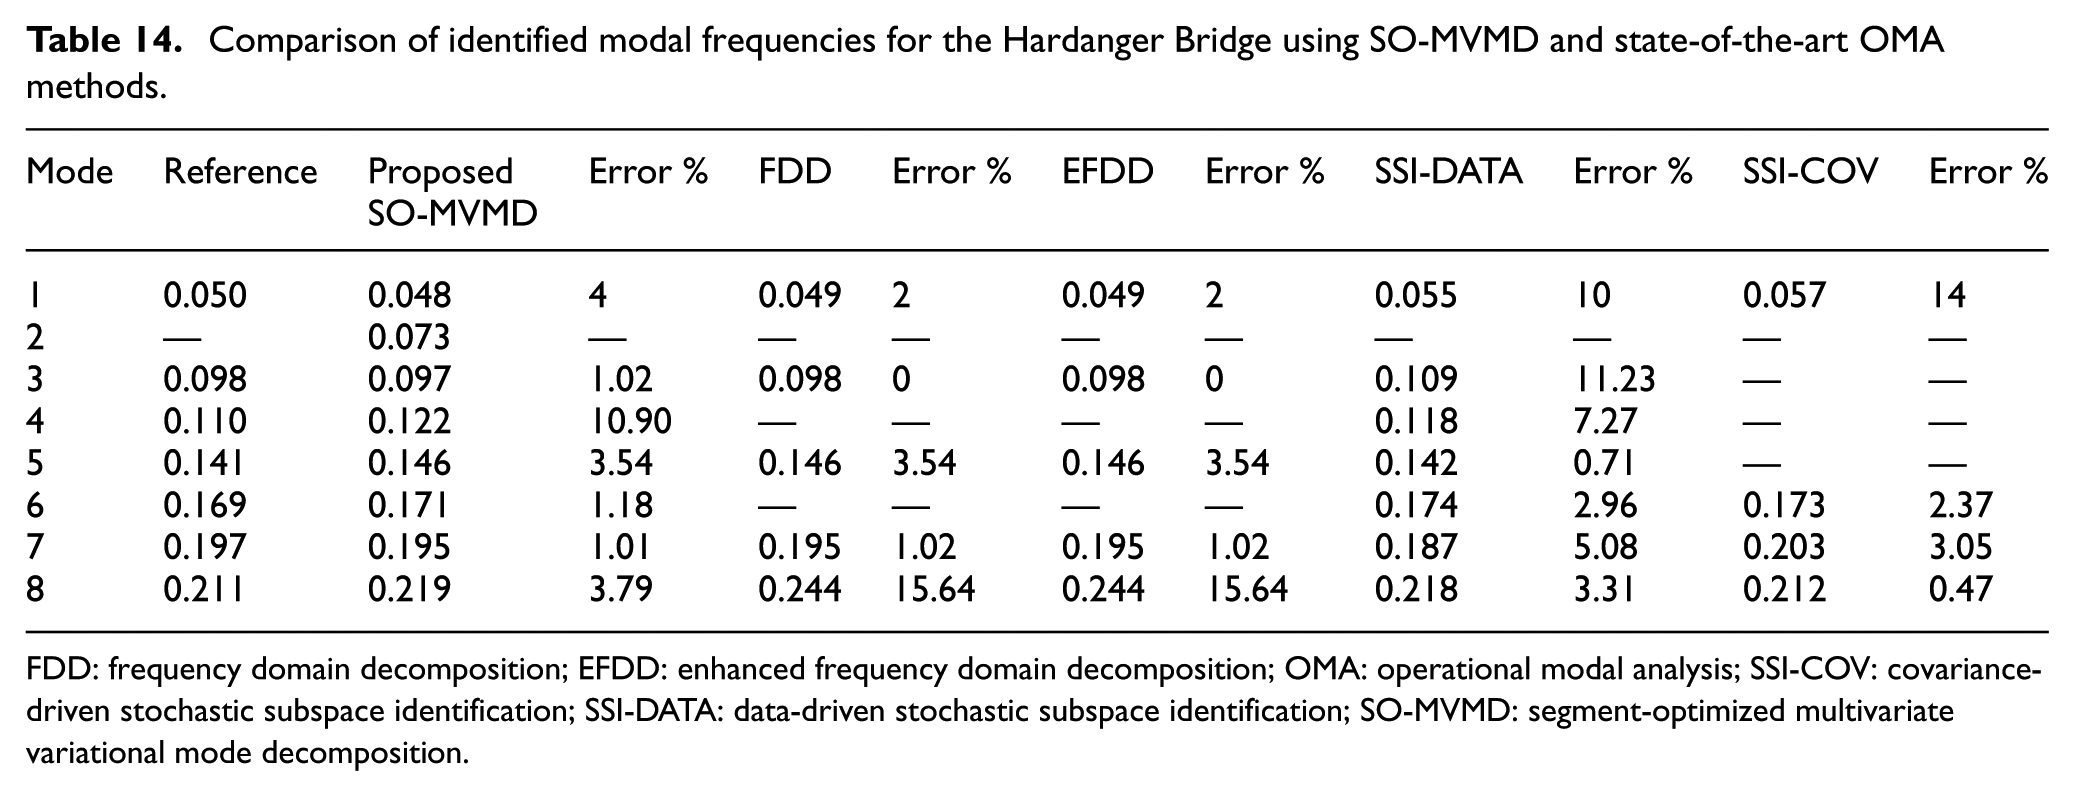
Comparison of identified modal frequencies for the Hardanger Bridge using SO-MVMD and state-of-the-art OMA methods.
FDD: frequency domain decomposition; EFDD: enhanced frequency domain decomposition; OMA: operational modal analysis; SSI-COV: covariance-driven stochastic subspace identification; SSI-DATA: data-driven stochastic subspace identification; SO-MVMD: segment-optimized multivariate variational mode decomposition.
The results of the Milad Tower case study, summarized in Table 12, demonstrate the strong agreement between the proposed SO-MVMD framework and the reference modal frequencies. For all fourteen modes, the proposed method reproduces the reference values with zero deviation, indicating highly stable decomposition and accurate identification of both low and higher-order modes. In contrast, the four benchmark OMA techniques exhibit varying levels of deviation from the reference. FDD and EFDD generally yield small errors for the lower modes but show increasing discrepancies for several mid and high-frequency modes. SSI-DATA and SSI-COV display larger variations, particularly for the higher modes where errors exceed 10% in some cases. Despite these differences, all methods correctly capture the overall modal pattern, but the proposed framework provides the closest match to the reference values across all modes. This comparison highlights the robustness and precision of SO-MVMD when applied to ambient vibration data from a tall tower structure.
The results for the Canton Tower, summarized in Table 13, highlight the strong performance of the proposed SO-MVMD framework compared with several widely used OMA techniques. The proposed method produces modal frequencies that closely match the reference values, with absolute errors remaining below 1% for all identified modes. In contrast, the benchmark methods show a broader range of deviations. FDD and EFDD demonstrate acceptable accuracy for some modes but exhibit large errors for others, particularly for Modes 3 and 7, where deviations exceed 30%. SSI-DATA and SSI-COV also display notable variability, with errors above 5% for several modes and more substantial deviations for the higher modes. It is also important to note that some methods were unable to detect specific modes, as indicated by missing entries in the table. This incompleteness reflects challenges posed by noise, weak modal energy, or method-specific limitations when applied to ambient vibration data. Overall, the comparative results show that the proposed SO-MVMD approach provides more consistent and reliable modal identification for the Canton Tower than the conventional frequency- and time-domain techniques included in this study.
The results in Table 14 illustrate the comparative modal identification performance for the Hardanger Bridge under a selected measurement condition. The proposed SO-MVMD model shows strong agreement with the reference frequencies, with absolute errors generally remaining within a few percent. FDD and EFDD provide accurate estimates for several modes, but they also exhibit substantial deviations for others, particularly Mode 8, where both methods reach errors exceeding 15%. SSI-DATA offers reliable estimates for most modes, producing smaller deviations than the frequency-domain methods in many cases, although noticeable discrepancies appear for Modes 3 and 7. SSI-COV shows moderate performance, with errors that are acceptable for some modes but significantly larger for others, such as Modes 1 and 7. Overall, the comparison demonstrates that the proposed SO-MVMD approach yields the most consistent and physically reasonable modal frequencies across the full modal range, while several conventional OMA techniques show variable accuracy and occasionally large deviations from the reference values.
Performance assessment under different environmental and operational conditions
This subsection evaluates the stability and effectiveness of the proposed SO-MVMD framework under different environmental and operational conditions. The Hardanger Bridge and the Milad Tower provide multi-day datasets that capture variations in wind intensity, ambient excitation, and measurement noise, allowing a meaningful assessment of robustness. In contrast, the Canton Tower dataset contains measurements from only a single day and therefore cannot be used for multi-day variability analysis. For the two multi-day datasets, modal identification was carried out using the minimum effective segment durations determined by the ASI procedure (2 min for the Hardanger Bridge and 10 min for the Milad Tower). The identified modal frequencies across different days remain highly consistent, with only minor fluctuations observed in higher modes where signal-to-noise ratios are lower. These results demonstrate that the SO-MVMD method maintains stable and reliable performance despite environmental and operational variability. The corresponding multi-day comparisons and absolute percentage deviations from the reference modes are summarized in Tables 15 and 16.
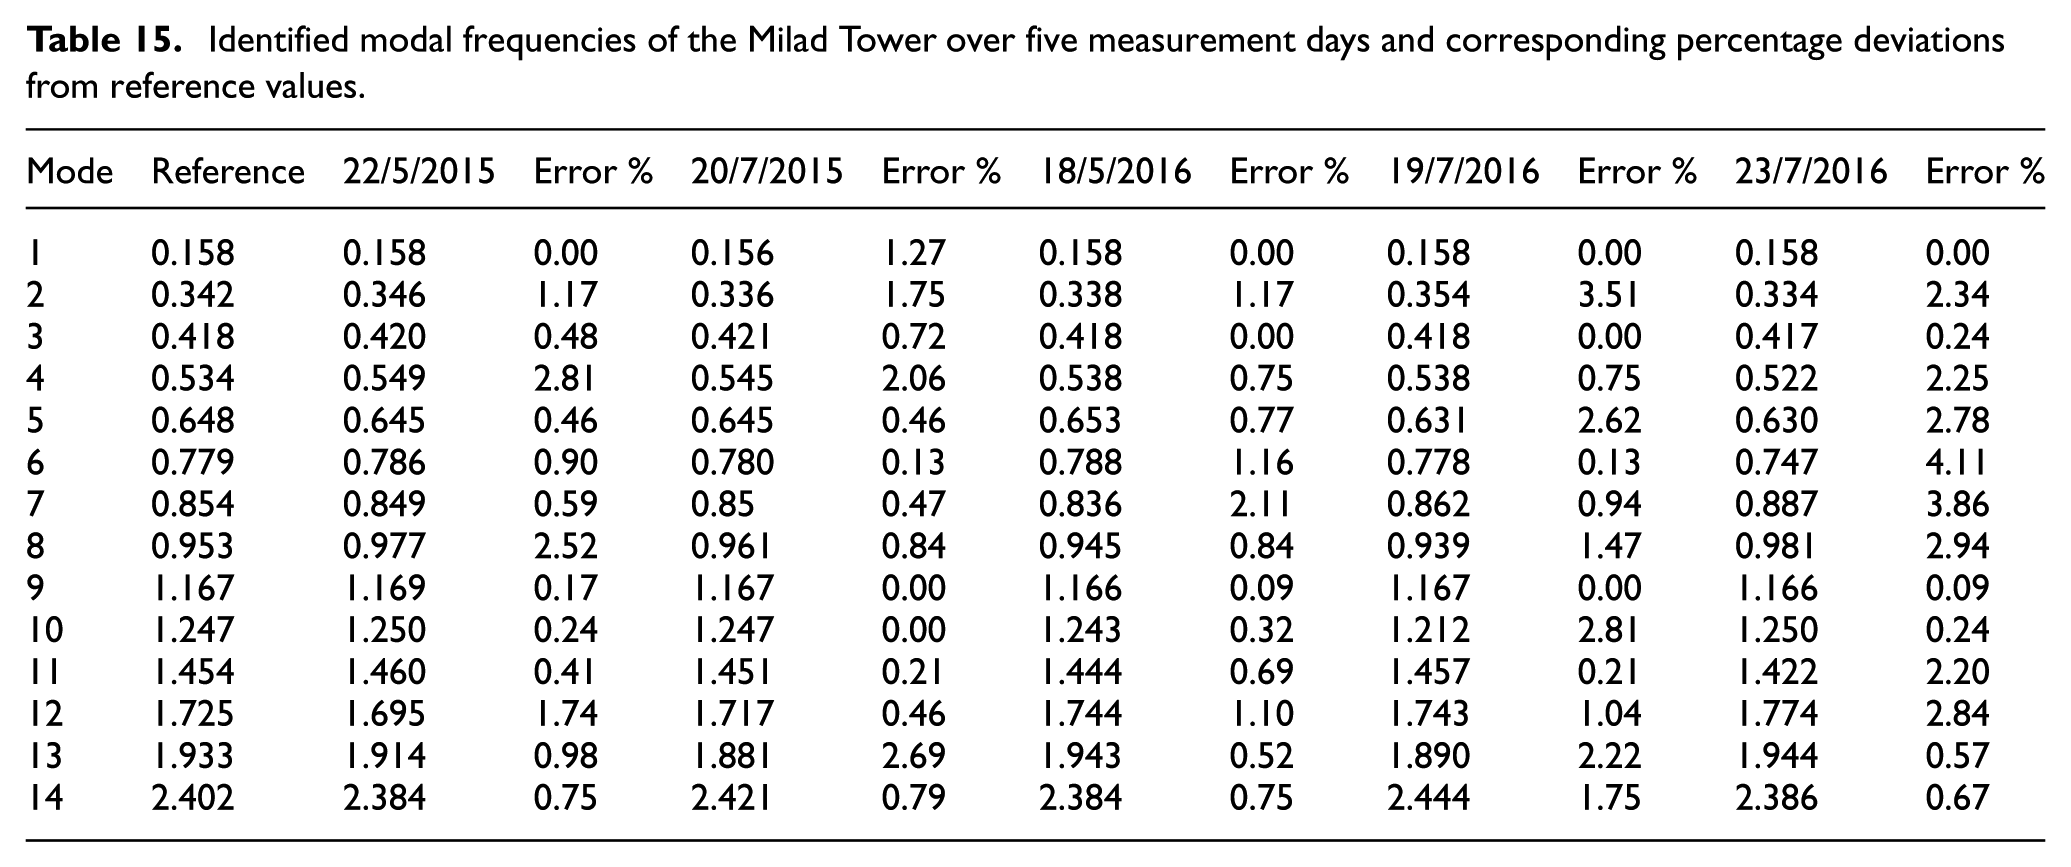
Identified modal frequencies of the Milad Tower over five measurement days and corresponding percentage deviations from reference values.
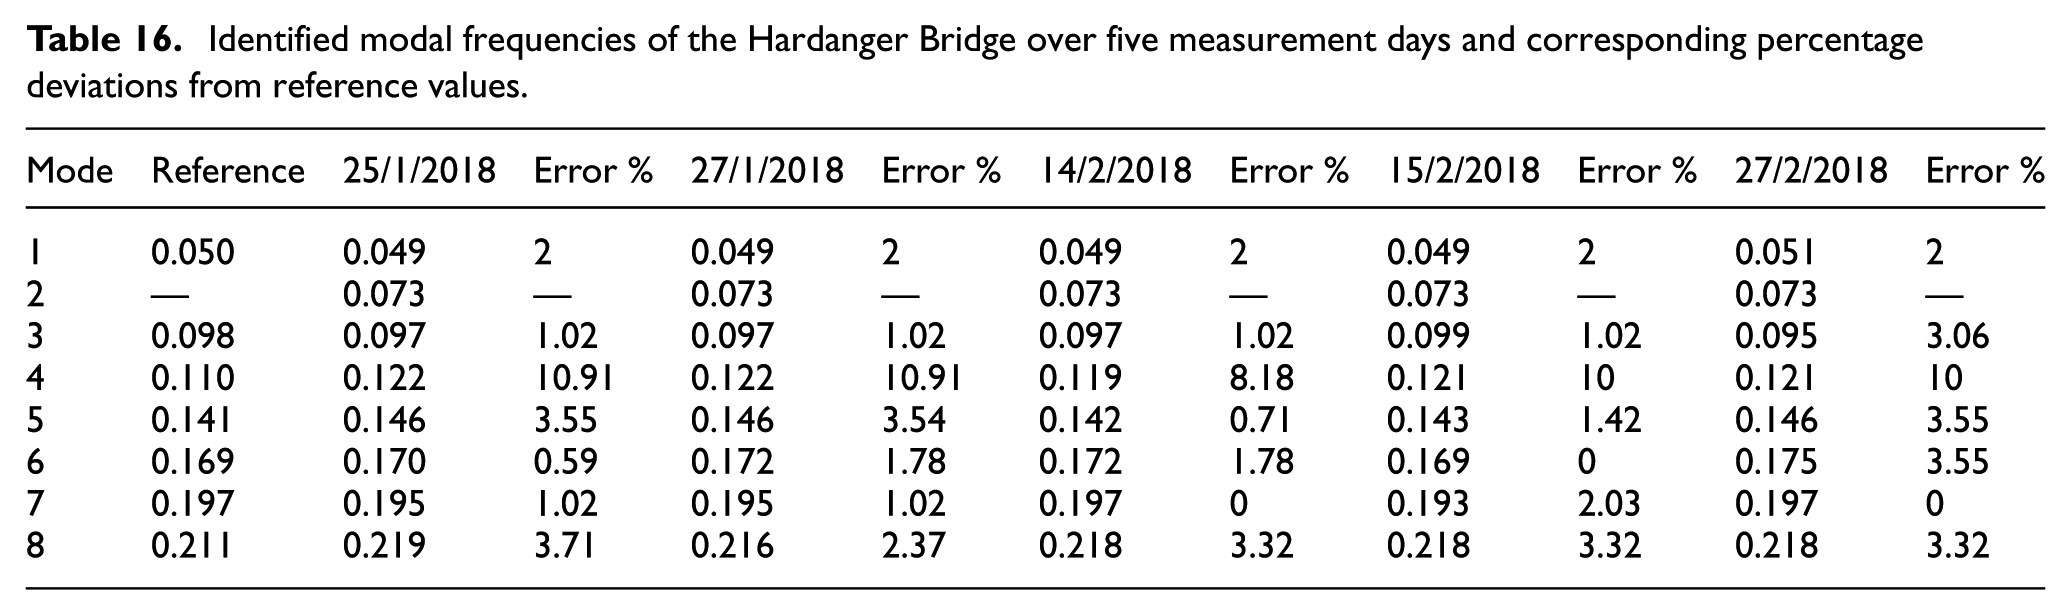
Identified modal frequencies of the Hardanger Bridge over five measurement days and corresponding percentage deviations from reference values.
The results in Table 15 demonstrate the stability of the identified modal frequencies of the Milad Tower across five different measurement days, each representing distinct environmental and operational conditions. For the majority of modes, the deviations from the reference frequencies remain below 1%–3%, indicating strong consistency despite variations in ambient excitation or atmospheric conditions. The lower modes (Modes 1, 3, 9, and 10) exhibit particularly high stability, with errors that are effectively zero or close to zero across all days. Moderate variations appear in the mid-range modes, especially Modes 5 through 8, where fluctuations between approximately 1% and 4% reflect the influence of changing wind levels and operational noise. The highest modes (Modes 12–14) show slightly larger deviations on certain days, which is expected due to their lower signal-to-noise ratio and higher sensitivity to environmental disturbances. The measurements from July 23, 2016 generally display the largest deviations among the five datasets, suggesting more pronounced environmental variability on that day. Overall, the results confirm that the extracted modal frequencies remain highly consistent across different days and conditions, demonstrating strong robustness of the identification process under realistic operational and environmental variations.
The multi-day results presented in Table 16 demonstrate the stability of the identified modal frequencies for the Hardanger Bridge across five different measurement dates in early 2018. For the majority of modes, the deviations from the reference values are consistently small, typically within the range of 1%–4%, indicating that the environmental and operational variations across the different days had only a limited influence on the estimated modal properties. The lower modes, including Modes 1, 3, and 7, exhibit particularly high stability with nearly identical values across all days. Moderate fluctuations appear in Modes 4, 5, and 6, where environmental effects or changes in excitation level introduce slightly larger deviations, most notably for Mode 4, which shows errors between 8% and 11% depending on the date. Higher modes, such as Mode 8, also display small but noticeable variations, though the deviations remain below 4% for all cases. Overall, the results indicate that the modal characteristics of the structure remain highly consistent across the observed period, and the identified frequencies demonstrate strong robustness against day-to-day changes in environmental and operational conditions.
Performance assessment (MVMD vs VMD, EMD, PSD, and FFT)
To provide a robust validation of the proposed method, a comparative analysis was performed against four widely adopted structural modal identification techniques: VMD, EMD, PSD, and FFT. All conventional methods were applied to the same optimal segment identified by the SO-MVMD framework to ensure a fair and consistent comparison. This comparative study focused exclusively on frequency estimation accuracy, and damping ratios were not considered in the current assessment. The extracted natural frequencies and the associated percentage errors for the Milad Tower, Canton Tower, and Hardanger Bridge are presented in Tables 17–19, respectively.
The first 14 modes of the Milad Tower estimated by SO-MVMD and other methods for a 10-min time window.
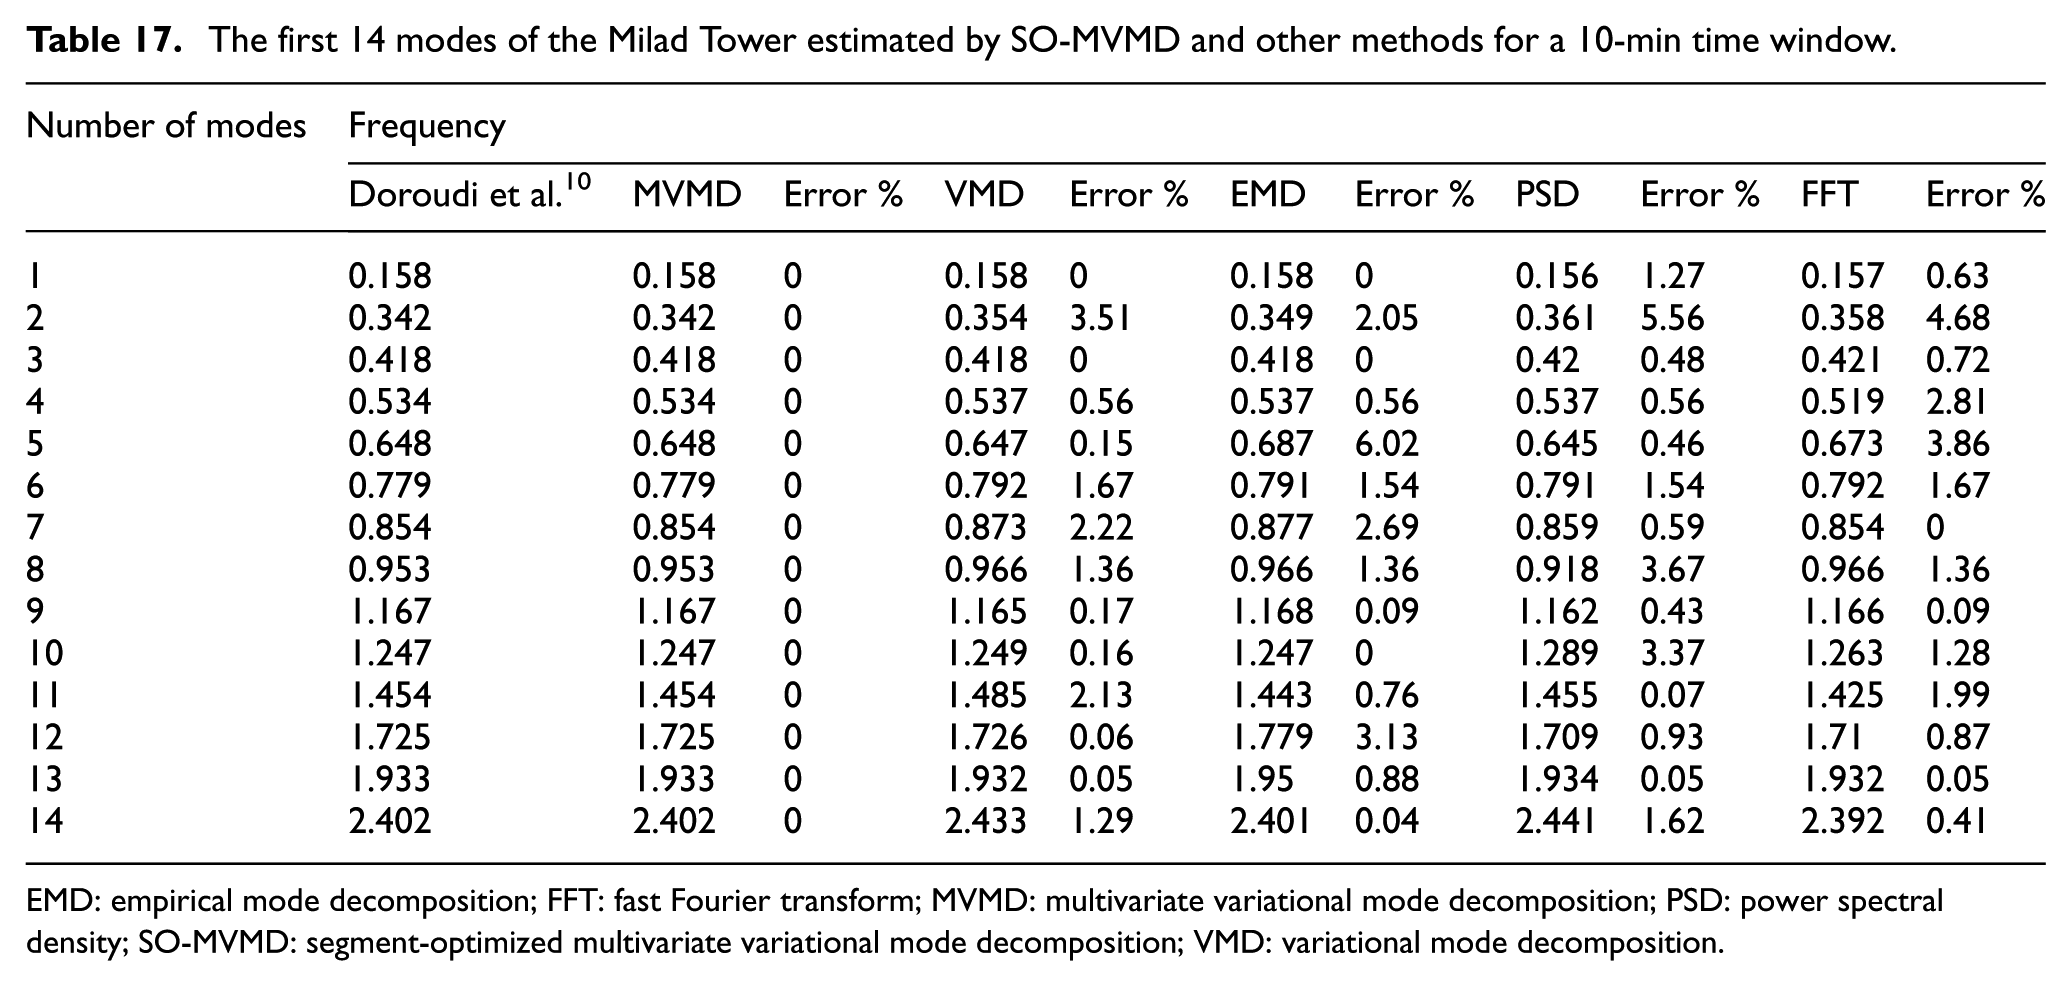
EMD: empirical mode decomposition; FFT: fast Fourier transform; MVMD: multivariate variational mode decomposition; PSD: power spectral density; SO-MVMD: segment-optimized multivariate variational mode decomposition; VMD: variational mode decomposition.
The first 11 modes of the Canton Tower estimated by SO-MVMD and other reference methods for a 10-min time window.
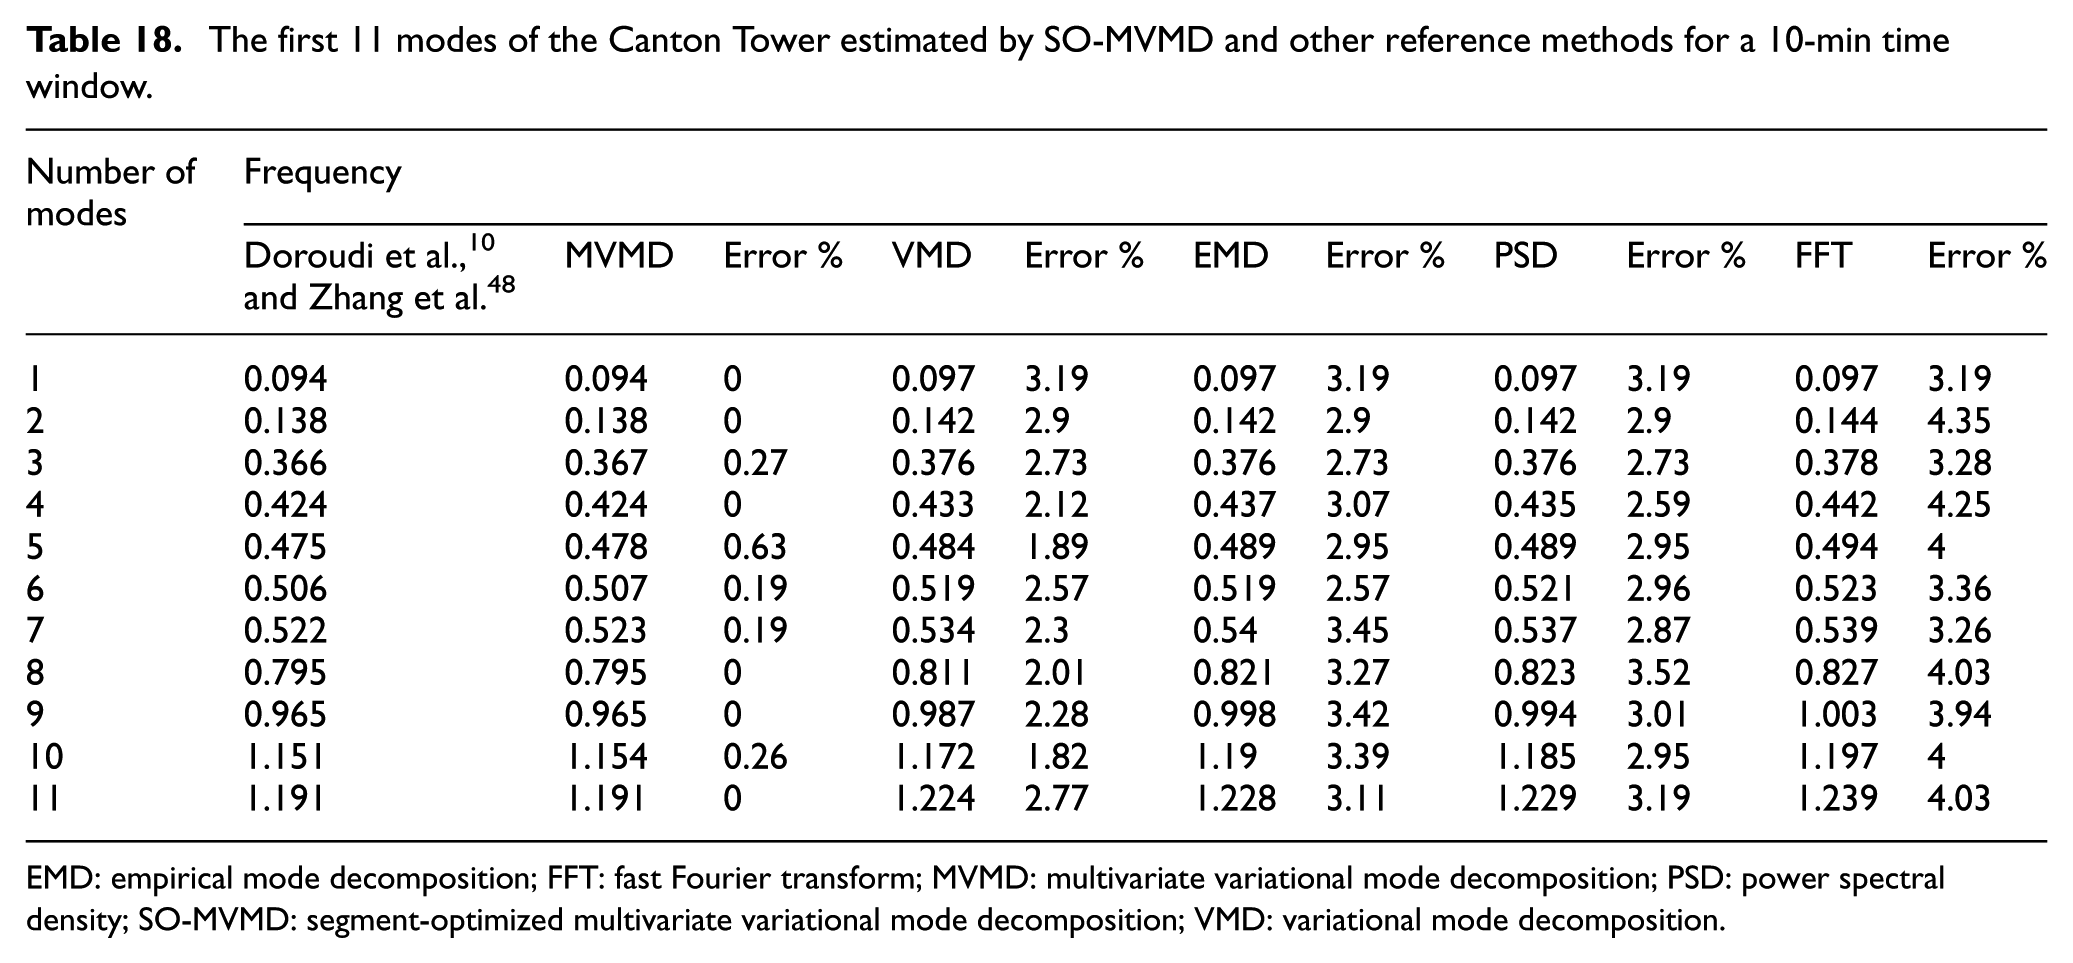
EMD: empirical mode decomposition; FFT: fast Fourier transform; MVMD: multivariate variational mode decomposition; PSD: power spectral density; SO-MVMD: segment-optimized multivariate variational mode decomposition; VMD: variational mode decomposition.
The first 8 modes of the Hardanger Bridge estimated by SO-MVMD and other reference methods for a 2-min time window.
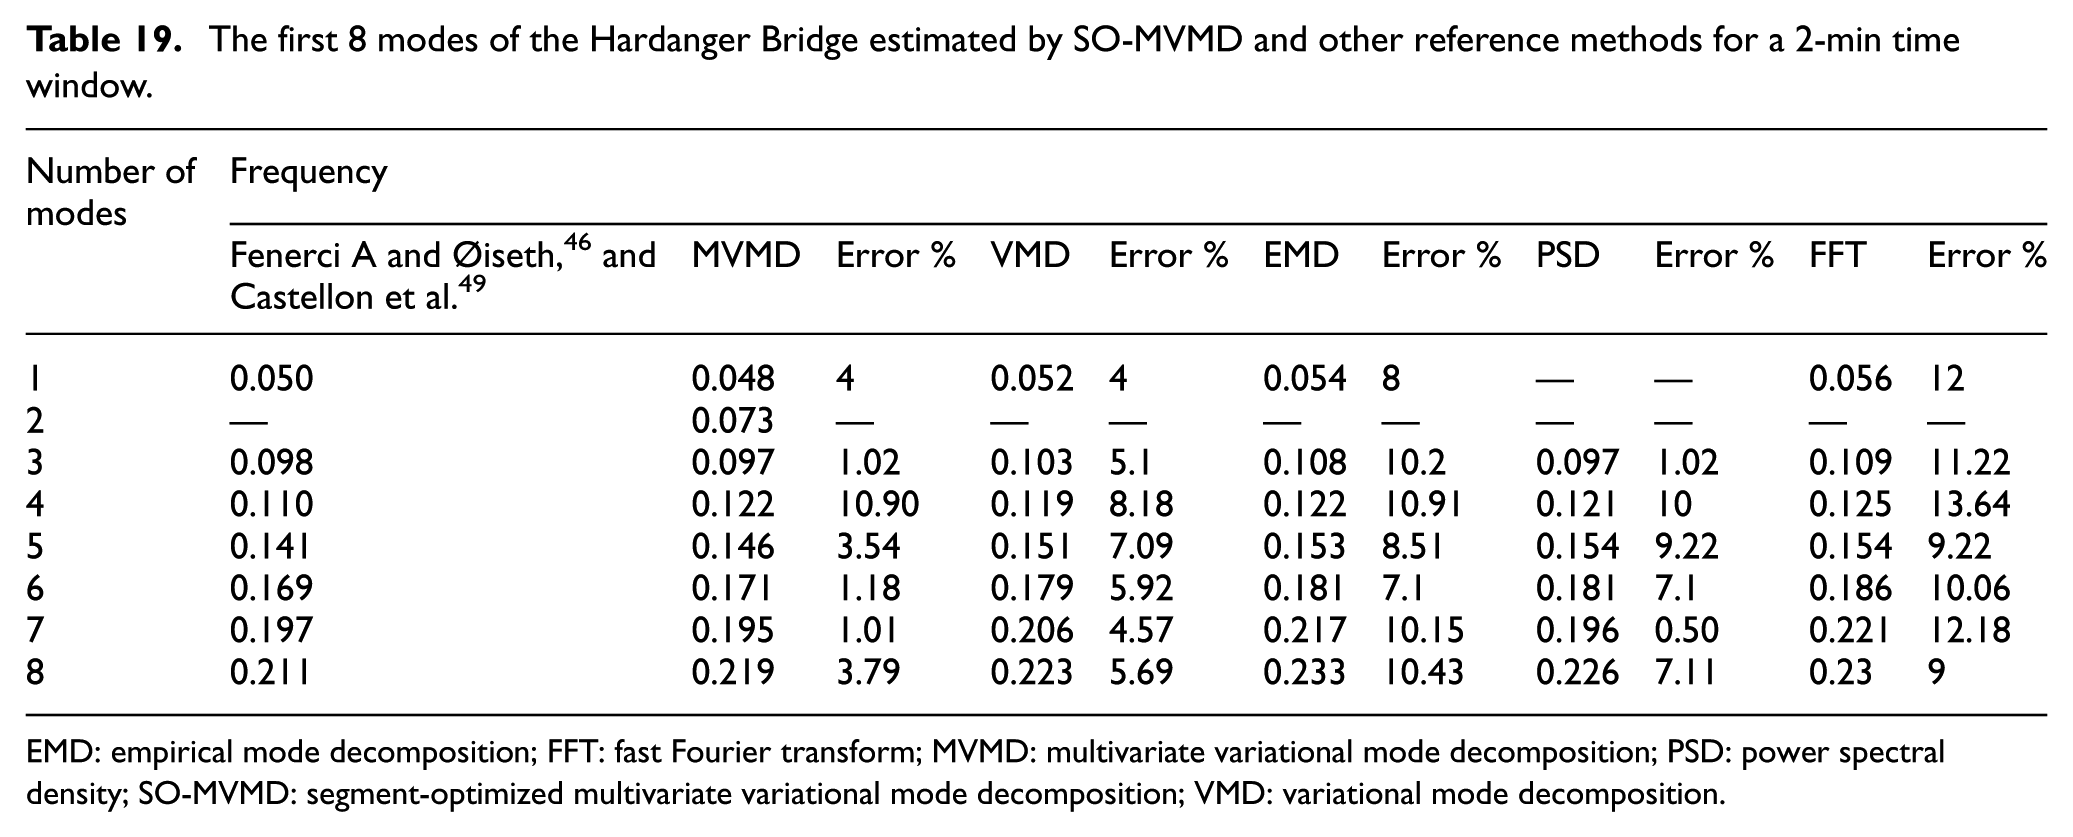
EMD: empirical mode decomposition; FFT: fast Fourier transform; MVMD: multivariate variational mode decomposition; PSD: power spectral density; SO-MVMD: segment-optimized multivariate variational mode decomposition; VMD: variational mode decomposition.
Across all three structures, which represent diverse structural typologies (two tall buildings and one long-span suspension bridge), the proposed method consistently demonstrated superior performance in identifying the natural frequencies. For the Milad Tower (Table 17), the frequency extracted using MVMD exhibited the lowest percentage error when benchmarked against the reference data. A similar trend of reduced error was observed in the analysis of the Canton Tower (Table 18) and the Hardanger Bridge (Table 19). In nearly every comparison, the proposed method achieved substantially lower percentage errors compared to the frequencies obtained using VMD, EMD, PSD, and FFT. This consistent outcome across varied structural types and frequency ranges suggests that the MVMD algorithm is significantly more robust and effective at separating intrinsic modes and accurately identifying the true natural frequencies from complex structural response signals. These results strongly support the efficacy of the proposed SO-MVMD method as a highly accurate tool for OMA.
Discussion
The SO-MVMD framework demonstrates clear advantages in accuracy, robustness, and computational efficiency for SHM. Across three diverse case studies: the Milad Tower, Canton Tower, and Hardanger Bridge; the method consistently identified modal parameters that closely matched reference results, confirming its reliability for both tall buildings and long-span bridges. As summarized in Table 20, the proposed method achieved the lowest mean frequency errors across all structures: 0.00% for Milad Tower, 0.14% for Canton Tower, and 3.18% for Hardanger Bridge. These values represent significant improvements over existing signal-processing methods such as VMD, EMD, PSD, and FFT, whose corresponding errors ranged from approximately 1% to 10%. This consistency across distinct structural typologies underscores the accuracy and adaptability of SO-MVMD under varying noise and excitation conditions.
Mean error comparison: proposed method and other reference methods versus references.
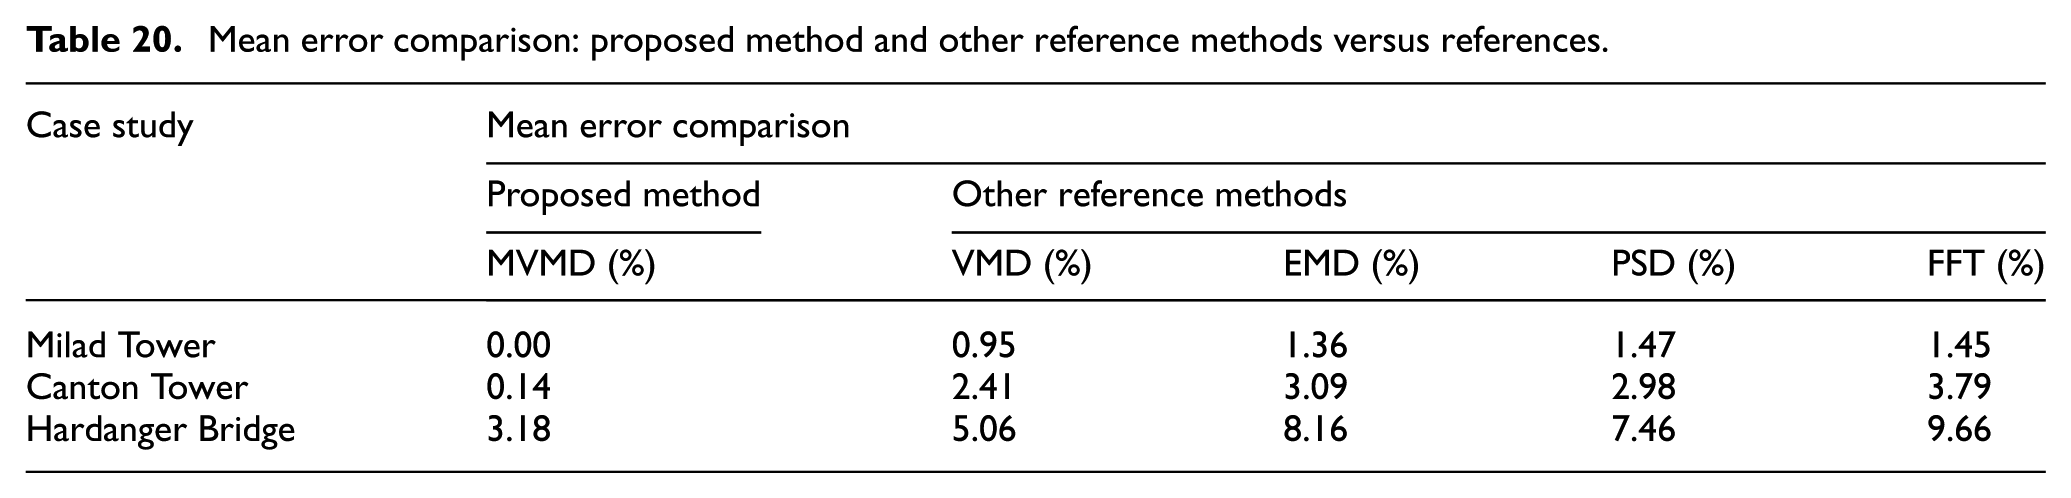
Table 21 compares SO-MVMD against conventional approaches in terms of accuracy, robustness, and computational efficiency. Unlike FFT/PSD, which are sensitive to noise and non-stationarity, or EMD, which suffers from mode mixing, the multivariate and segment-optimized design of SO-MVMD achieves Very High performance in all three criteria. By exploiting inter-channel correlation and processing only statistically optimal data segments, the method minimizes spurious components and substantially reduces computational load, an advantage for long-term or real-time SHM. The findings (see also Tables 17–19 and related figures) indicate that even short data segments (e.g., 10 min) provide sufficient information for reliable modal identification, enabling faster and more scalable monitoring. This efficiency directly benefits large-scale SHM deployments, where data storage, processing speed, and sensor reliability are critical constraints. The framework’s capacity to maintain accuracy under variable environmental and operational conditions also suggests strong potential for autonomous, continuous monitoring systems.
Performance benchmarking against other methods.
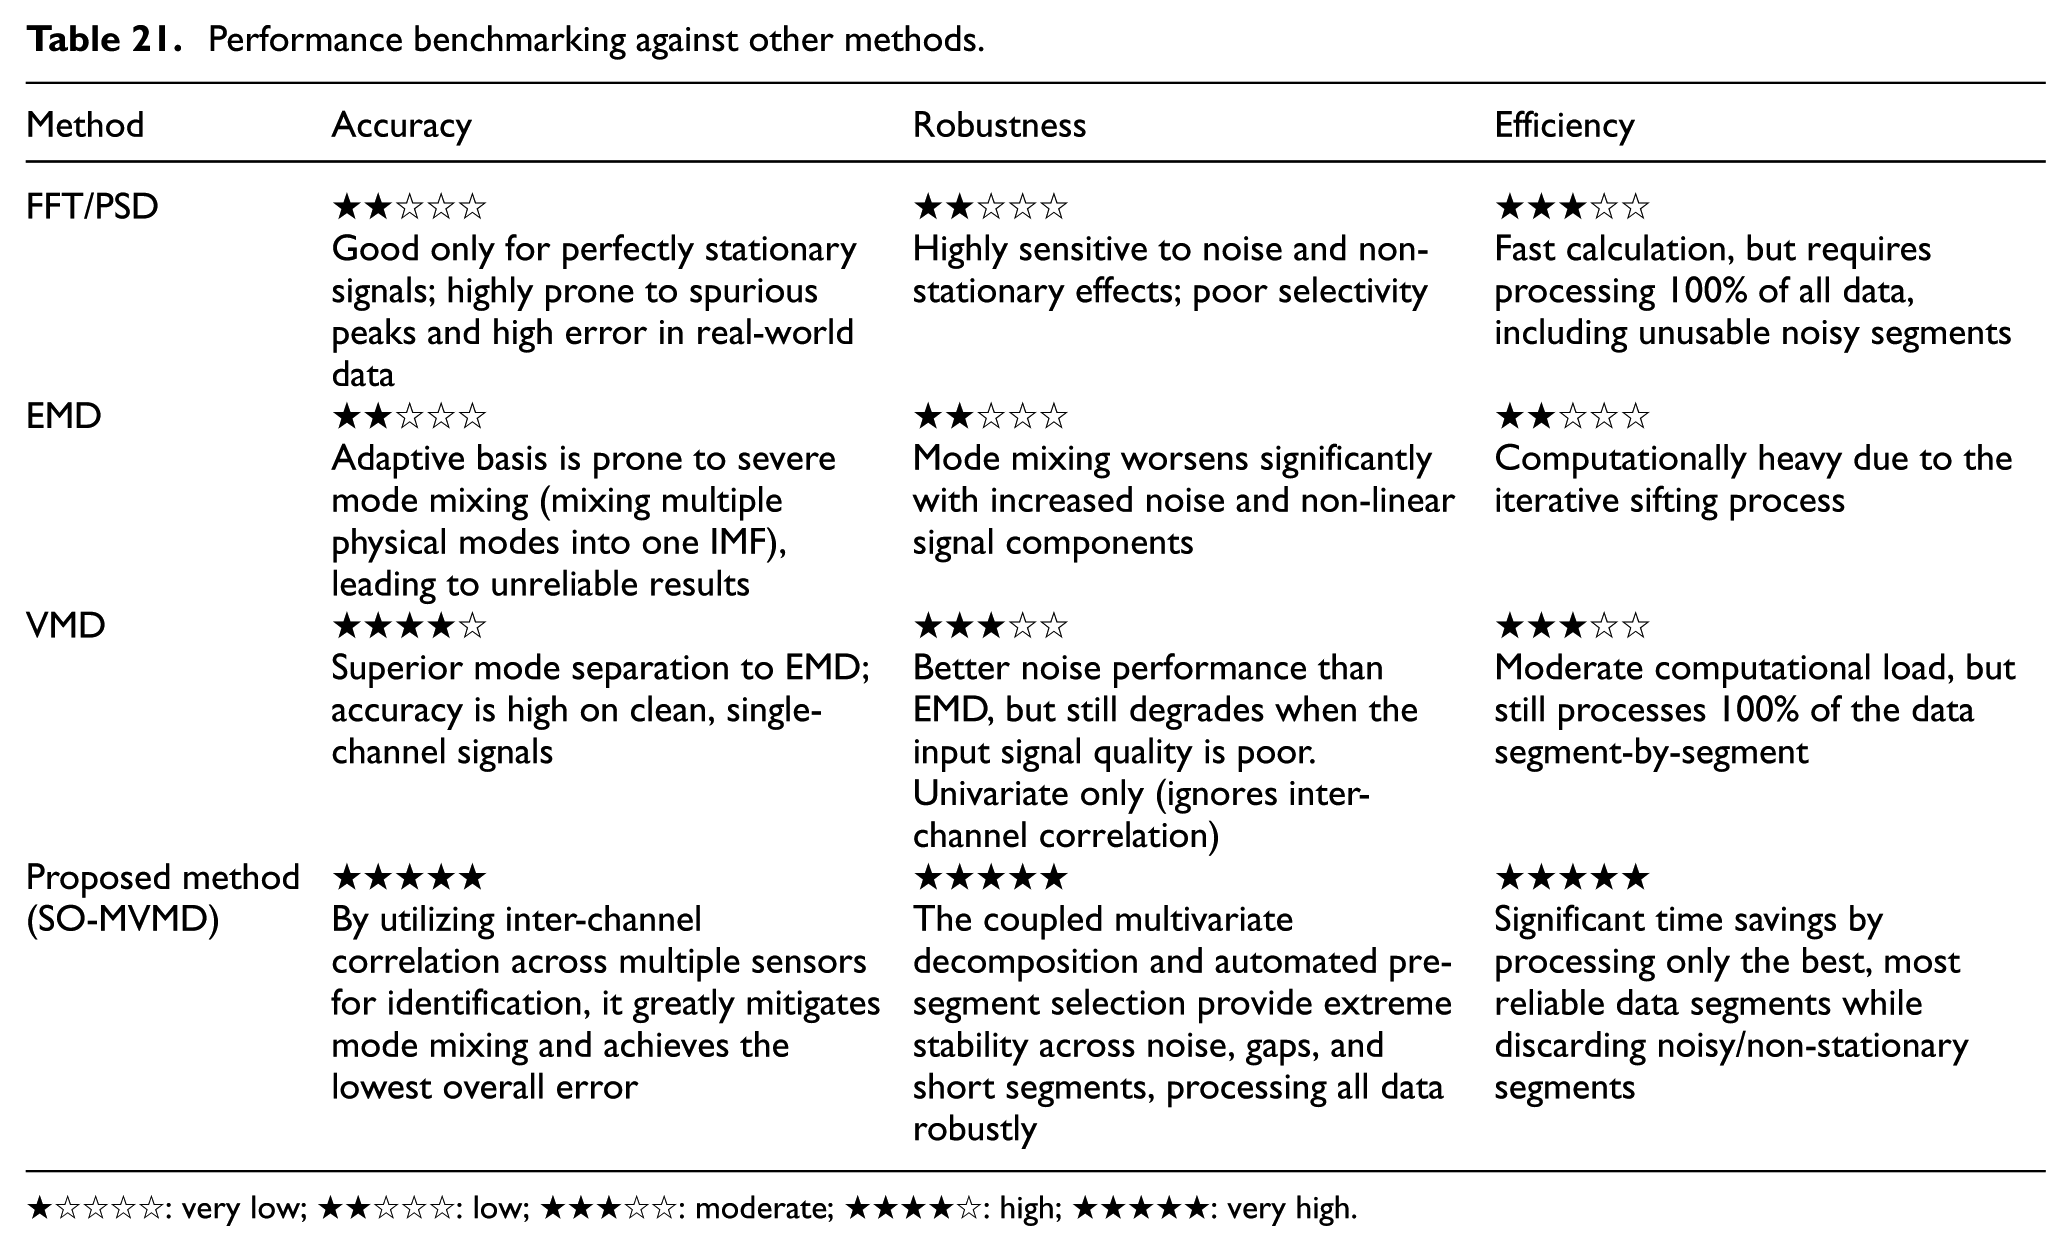
★☆☆☆☆: very low; ★★☆☆☆: low; ★★★☆☆: moderate; ★★★★☆: high; ★★★★★: very high.
The integration of statistical segment selection with multivariate decomposition represents a methodological advancement beyond traditional single-channel or full-record analysis. By combining time- and frequency-domain indicators for segment quality, SO-MVMD effectively isolates information-rich portions of the signal while preserving cross-sensor coherence. This hybrid approach mitigates noise amplification and enhances modal interpretability, particularly for complex structures exhibiting coupled lateral–torsional behavior, as observed in the Hardanger Bridge case. In summary, benchmarking results confirm that the proposed SO-MVMD outperforms conventional SHM signal-processing techniques in accuracy, robustness, and efficiency. The framework offers a practical, automated, and scalable solution for identifying modal parameters from ambient vibration data, paving the way for intelligent, data-driven SHM of modern infrastructure. It should be noted that while segments with higher ASI values are prioritized for analysis, this selection does not guarantee purely modal responses. High-energy or high-kurtosis segments may still contain transient disturbances, environmental noise, or non-structural effects. However, the subsequent multivariate decomposition and the preservation of cross-channel coherence effectively mitigate these influences, ensuring that the extracted modal parameters remain reliable. Therefore, the ASI-based ranking serves as a heuristic tool to identify dynamically informative segments rather than a definitive measure of modal purity.
In addition, the comparative results presented in sections “Performance comparison with state-of-the-art modal identification methods” and “Performance assessment under different environmental and operational conditions” provide further insight into the practical advantages of the proposed framework. The comparison with state-of-the-art OMA methods, including FDD, EFDD, SSI-COV, and SSI-DATA, shows that the proposed SO-MVMD framework achieves more consistent and reliable modal identification, particularly for higher-order modes and short data segments. This improvement can be attributed to the quality-aware segment selection stage, which ensures that only information-rich data are processed, and to the multivariate nature of MVMD, which preserves inter-channel coherence.
Furthermore, the evaluation under different environmental and operational conditions confirms that the proposed framework maintains stable performance despite variations in excitation level, wind conditions, and measurement duration. The ability to extract consistent modal parameters from short and non-continuous data segments highlights the robustness and practical applicability of the method for long-term monitoring scenarios. These findings reinforce that the main contribution of the proposed approach lies in its engineering effectiveness and reliability in real-world SHM applications, rather than in introducing a new decomposition theory.
Conclusion
This study presented an automated and quality-aware framework, referred to as SO-MVMD, for decomposition-based operational modal identification using ambient vibration data. The proposed framework integrates a statistical data segment selection strategy with MVMD to improve the efficiency, robustness, and reliability of modal parameter extraction without modifying the underlying decomposition algorithm. By focusing the analysis on the most informative short time segment, the framework reduces noise influence, avoids unnecessary processing of low-quality data, and enables accurate modal identification from partial datasets. The applicability and effectiveness of the proposed framework were demonstrated through comprehensive validation on three large-scale and structurally diverse civil structures under different environmental and operational conditions.
The main findings and conclusions of this study are summarized as follows:
An automated and quality-aware SO-MVMD framework was developed for operational modal identification based on ambient vibration measurements.
A statistical segment selection stage was introduced prior to decomposition, enabling objective identification of the most informative short time data segment.
Six complementary statistical and signal-based indicators were used to evaluate segment quality, ensuring robust selection without reliance on learning or training procedures.
The proposed framework significantly improves computational efficiency and noise robustness by avoiding the processing of low-information or contaminated data.
MVMD preserves inter-channel dependencies, allowing reliable extraction of natural frequencies, damping ratios, and mode shapes.
Validation on the Milad Tower, Canton Tower, and Hardanger Bridge confirmed the adaptability of the framework to both super-tall buildings and long-span bridges.
Comparative studies with state-of-the-art OMA methods, including FDD, EFDD, SSI-COV, and SSI-DATA, as well as conventional signal processing techniques such as FFT, PSD, EMD, and VMD, demonstrated superior modal consistency and completeness, particularly for higher-order modes.
Evaluation under varying environmental and operational conditions showed that stable modal parameters can be obtained from short data segments, supporting the suitability of the framework for long-term structural monitoring applications.
Footnotes
Declaration of conflicting interests
The authors declared no potential conflicts of interest with respect to the research, authorship, and/or publication of this article.
Funding
The authors disclosed receipt of the following financial support for the research, authorship, and/or publication of this article: The study was inspired and partly supported by the senior Advance Queensland Fellowship awarded to the third author (grant no. AQIRF101-2022RD5). This support is gratefully acknowledged.