
Abstract
Over the years, wind turbine design has substantially changed to reduce cost and maximise performance, resulting in increased wind turbine height, blade size and power rating, seeking steadier wind at higher elevations while capturing more wind with longer blade lengths. This resulted in not only the vertical load but also the already dominating horizontal load and overturning moment caused by the wind acting on these turbine foundations, increasing significantly. Onshore turbine structures are often built on piled-raft foundations, which were historically not designed for dominant horizontal loads. Thus, with the increased popularity of these larger wind turbine models, the need arose to physically determine the response of these foundation types to large horizontal loads and overturning moments. In this article, a full-scale operational piled-raft foundation supporting a 117 m high onshore wind turbine in South Africa was instrumented and monitored for an extended period of time, focusing on the foundation’s response during turbine installation and the first year of operation. A good correlation between the wind data and foundation strains existed and is presented, with load sharing between the different foundation components also highlighted. The cyclic loading of the foundation from the wind resulted in the piles carrying increased loads over time compared to the loads carried after turbine installation (increasing from 35% to roughly 60% after 1 year of operation). The permanent bending moments in the piles also increased with time. Additionally, seasonal temperature variations caused significant strain changes in the raft, which cannot be ignored.
Keywords
Introduction
The increased reliance on renewable energy alternatives to combat climate change challenges is a rising global trend. Both onshore and offshore wind energy power generation have gained popularity and have become a fast-growing industry over the last 30 years, with South Africa investing heavily in the onshore technology market. 1 With the evolution of modern technology and the development of stronger, more durable materials, wind turbine manufacturers have, over the years, substantially changed the design of their turbines to reduce cost and maximise performance and efficiency. These improvements have resulted in increased turbine height, blade size and power rating, seeking steadier wind at higher elevations while capturing more wind with longer blade lengths. Thus, fewer wind turbines are needed to satisfy the electricity demand, effectively reducing the costs of purchasing and installing these structures.
Both onshore and offshore wind turbine installation present their share of advantages and challenges. As highlighted by DNV/RisØ 2 and Burton et al., 3 the use of onshore turbines typically benefits from easier accessibility, closer electrical grid connection, lower construction and maintenance costs and simpler foundation requirements. However, two of the major disadvantages being larger area demands, which are scarce in densely populated countries, 2 and the potential loss in power generation due to topological interferences. In contrast, offshore turbines can harness stronger and more consistent wind resources3,4 but demand more complex and costly foundation designs, with the design and selection also influenced by increased depth to seabed. The lower construction and maintenance costs of onshore wind turbines have led developing countries that are not densely populated, such as South Africa, opting for onshore wind farms.
Wind turbines constitute a particular type of structure that strongly depends on the efficiency of the foundation system. 5 This dependency is a consequence of the extremely high levels of eccentricity generated at the base of the tower, resulting from the uncommon combination of high flexural moment and relatively low vertical forces. Upon the successful selection of the type of foundation, numerous geotechnical and technical design criteria need to be considered to ensure a foundation that has sufficient stability and strength. The design process revolves around checks for ultimate limit state (ULS) conditions, serviceability limit state (SLS) conditions and, due to the cyclic nature of the loading, fatigue limit state conditions, addressing all geotechnical issues that may arise, including soil bearing capacity, overturning and sliding.3,6,7 To minimise excessive turbine tilt and the formation of gapping below the supporting foundation, additional checks include foundation settlement (both total and differential), crack width, as well as rotational foundation stiffness.7,8 Due to the dynamic nature of wind turbines, rotational stiffness and ground gapping are typically considered the most important and drive the size of foundations to avoid resonance of the foundation-turbine system.1,6,9 Resonance refers to the dynamic amplification of responses and is a function of the natural frequency of the turbine system, which, in turn, is dependent on the overall stiffness and mass of the foundation, and the cyclic characteristic of the supporting soil or ground1,10 and how these two components interact with one another.2,7
The increased heights of modern wind turbines result in greater vertical and horizontal loads as well as larger overturning moments, requiring the design of their foundations to be reconsidered. Generally, conventional raft foundations are preferred for supporting onshore wind turbines as the science is well-established and the construction is straightforward. However, with the increase in wind turbine heights, deep foundations, including piled-raft foundations, are typically required, as they provide benefits in terms of load-sharing capacity, settlement reduction and foundation stiffness. Researchers have also claimed that these foundations result in a more economical use of material in resisting the overturning moment of the turbine.3,11 The current understanding of how these foundations respond to dynamic horizontal loads and overturning moments, as well as interact with the non-linear soils supporting them is, however, limited. These foundation designs are typically based on simplified and semi-empirical methods not originally developed for wind turbine applications, with designs neglecting the contribution of the ground-contacting pile cap in carrying the loads. As wind turbine foundations are critical to the longevity of these renewable energy alternatives, 12 there is a need to physically determine the dynamic effect of these load combinations on the soil–structure interaction response of piled-raft foundation systems.
On account of the non-linear characteristics of soil and the cyclic nature of the applied wind loads on turbine foundations, potential changes and strain accumulation in the supporting soil must be accounted for as it can influence foundation response. Cyclic loading could likely lead to soil degradation, altering the rotational stiffness of the foundation, reducing the natural frequency of the wind turbine system and ultimately increasing the risk of the turbine becoming destabilised. Moss et al. 13 indicated that the cyclic response of soils and foundations is highly complex and likely misunderstood, resulting in most design methods still being based on a conservative rule of thumb.
The shakedown concept has typically been used to describe the cyclic behaviour of many conventional engineering structures in contact with soil, investigating the extent of permanent soil deformation under repetitive loading. Johnson 14 originally proposed this concept when he studied the permanent deformation of surface layer soils under rolling and sliding line contact. Depending on the magnitude of the applied loads and the number of load cycles, Johnson 14 found that the response of the soil can be classified into four categories, namely purely elastic, elastic shakedown, plastic shakedown and incremental collapse or ratcheting. These categories are characterised by the response of the soil either being elastic, becoming resilient after a post-compaction/densification period, regardless of the number of load cycles, or degrading with continuing incremental plastic deformation occurring with each additional load cycle. These categories were also later highlighted by Werkmeister et al., 15 who investigated the response of cyclic loading on unbounded granular materials for pavement engineering using triaxial tests.
Due to the cost and difficulty associated with full-scale testing, many researchers have resorted to using small-scale models to improve their understanding of the behaviour of complex engineering problems.16,17 Similarly, soil–structure interaction problems and the cyclic non-linear response of soils have typically been investigated using scaled models in a geotechnical centrifuge. 18 Thus, in an attempt to investigate the cyclic response of foundations under loading, including piled-raft foundations, several researchers conducted tests using this method.19–30 As seen from the cyclic load tests conducted on foundations in the geotechnical centrifuge by several researchers,19,23,24,26,28,31–33 the shakedown concept can be applied to the response of a piled raft, with the deformation depending not only on the magnitude of the applied load to the soil but also on the properties of that soil.
Over the years, full-scale structural health monitoring (SHM) has gained significant traction in determining the integrity of structures. Chen 34 noted that it is a vital part of cost-effective condition-based maintenance strategies and a powerful tool for damage assessment and performance evaluation of engineering structures over their lifespan. SHM can also be used to improve the current understanding of how structures behave under working loads and changing environmental conditions, 35 allowing for more economical, secure and sustainable designs in future. Due to the high cost of installing and monitoring sensors, SHM is typically still neglected when constructing new infrastructure, 36 with concerns regarding sensor durability, accessibility and harsh installation conditions within construction environments also being raised.37–39 With the focus on wind turbines, several commercial and research monitoring systems have been implemented, focusing predominantly on structural damage to blades, gearboxes and towers, with limited information provided on the structural behaviour of the foundations.12,38 Of the foundation monitoring research available, offshore wind turbine foundations have typically received more attention. Wymore et al. 37 have argued that this is likely due to offshore foundations being more complex, exposed to challenging conditions, and due to many questions still surrounding the design and deployment of these turbines at sea.
SHM of onshore wind turbine foundations has primarily been centred around failure mode-based monitoring and the development of early warning systems. One such monitoring system has been demonstrated by Currie et al., 40 who investigated the excessive movement around the bottom flange of embedded can turbine connections in raft foundations. They indicated that these movements resulted from cyclic wind loading, eroding the concrete around the bottom flange of the embedded can, creating a void within these regions, ultimately altering the stability and natural frequency of the turbine-foundation system. Similar observations were made by Bai et al. 38 who also measured displacement patterns near the bottom flange of an onshore wind turbine embedded can, allowing for crack occurrence and openings to be studied. They argued that voids and cracks at the bottom flange of the embedded can already occur at an early age, resulting from different shrinkage rates of the concrete around the inserted can. These cracks gradually grow and fluctuate according to wind speed changes. Monitoring cracks and their deterioration using fibre Bragg grating (FBG) on a wind turbine raft foundation has also been illustrated by McAlorum et al. 41
Although Wymore et al. 37 indicated that failure mode-based monitoring is valuable, more general concrete monitoring should also prove helpful as it can significantly reduce the operating and construction costs of structures. 42 In addition, Reese and Wang 9 have also noted the need for full-scale instrumentation and in-service wind turbine foundation monitoring. To date, the available published research however remains relatively limited. Temperature measurements are usually taken in the foundation to minimise thermal gradients causing stresses in the concrete of such large concrete masses after casting.43,44 Perry et al. 45 monitored the temperature of a large raft foundation during curing using several thermocouples. These temperature measurements were used to improve understanding of strength development and to estimate the initial performance of concrete using the ‘maturity’ method. Recent works from Rubert et al. 46 showed real-time strain monitoring of an onshore wind turbine raft foundation using FBG sensors at various points. They also compared the measured strain to finite element models, with the foundation resting on linear springs and found a good correlation with sensors placed at only two locations within the foundation. Yilmaz et al. 10 investigated the soil pressure distribution in lean clay foundation soils below two in-service raft foundations. The primary focus of the research was to compare the pressures in the soil with conventional assumptions adopted during the design of these foundations. They concluded from measurements and corresponding triaxial testing results that the reduced shear modulus concept adopted in design is three times smaller than the measured in situ values, resulting in the potential over-design of foundations, with the shear strain in the soil being significantly smaller than the assumed 10−3. Thus, soil degradation is effectively less of a problem than what is typically assumed during design.
Many questions, however, still arise regarding wind turbines supported by piled rafts, requiring further investigation beyond laboratory testing. Although the soil–structure interaction of piled-raft foundations under both static and cyclic vertical and horizontal loading can be studied in a controlled environment in a centrifuge, the efficacy of full-scale site testing remains. Environmental effects and seasonal temperature variations may also affect foundation response, which is typically neglected in laboratory settings. Several SHM projects have provided a better understanding of complex engineering problems. However, these projects have been lagging significantly in monitoring onshore wind turbines and their supporting foundations. Due to the cost constraints, SHM remains scarce, apart from the rapidly expanding wind energy market, with the majority of research focused on raft foundations, leaving much to be investigated when piles are introduced. In addition, this research has also primarily been focused on failure mode-base monitoring, giving little consideration to soil–structure interaction and how it can be used to improve our understanding of the design of future onshore wind turbine foundations.
Therefore, in this study, a full-scale piled-raft foundation supporting an onshore wind turbine in South Africa was instrumented and monitored for an extended period of time, with the main objective being to determine the actual response of an in-service piled-raft foundation supporting an onshore wind turbine. The scope of the study was restricted to a reinforced-concrete foundation constructed on dense silty-sand soil, having a circular piled raft, with piles resting on bedrock (socketed). Numerous instruments were embedded in the turbine foundation during construction and monitored continuously afterwards for different phases in the life of the turbine. These phases broadly included:
the early-age foundation response during the construction of the piles and raft;
the foundation response during the installation of the wind turbine structure before commissioning and commercial operations; and,
the foundation response during commercial operations after commissioning.
To supplement the foundation data, measuring equipment was installed at the base of the turbine tower to monitor the actual loads and moments experienced by the tower caused by the turbine’s weight and the externally applied wind load, both of which are ultimately transferred to the supporting foundation and the underlying soil. Measuring these loads and moments made it possible to calibrate the foundation system, allowing for the estimation of load sharing between the different foundation components, improving understanding of wind turbine foundation response, particularly, piled-raft foundation response. This article focuses on the last two phases highlighted above, with the early-age foundation response results (measured during raft construction) published in a separate article. 47 Some phenomena observed during construction, that influenced the measurement readings during turbine installation and operations, are however highlighted in this article.
Foundation description and site conditions
Foundation description and construction sequence
The instrumented foundation is located on the Wesley–Ciskei Wind Farm in South Africa and is the foundation of 1 of 10 newly constructed Vestas V126-3.45 MW wind turbines. Due to significant variations in the depth of bedrock across the entire farm, turbine foundation types for the ten new wind turbines varied between the conventional raft foundations and piled-raft foundations, all circular and constructed of reinforced concrete. The instrumented foundation was a piled-raft foundation, with Figure 1 showing a schematic of the foundation, indicating the main foundation components and respective dimensions. As the geotechnical report indicated that the safe permissible bearing capacity of the sand below this turbine was 150 kPa, a piled raft foundation was constructed. The raft had a base diameter of 15.5 m and a minimum thickness of 1.85 m, with the top of the raft having a slight inclination (or cross fall) of about 5°. The turbine was connected through an anchor cage cast into the raft to a 7.2 m diameter pedestal extending 0.9 m from the top of the raft. Ten 900 mm diameter augered piles were positioned along a perimeter with a radius of about 6.68 m from the centre of the raft, extending down to bedrock. Piles were socketed into bedrock (end bearing) and connected (or tied) to the raft through reinforcing bars sticking out from the top of the cast piles. Pile lengths varied from 16.7 to 17.9 m. Construction of this particular foundation started in February 2020, with all construction-related events completed by August 2020. Once the construction of the foundation was complete, backfilling of a 1.1 m deep soil layer followed. Wind turbine installation commenced a few months later in January 2021, with the assembly completed within a few days. The entire wind farm was commissioned in June 2021 and became fully operational in August 2021.
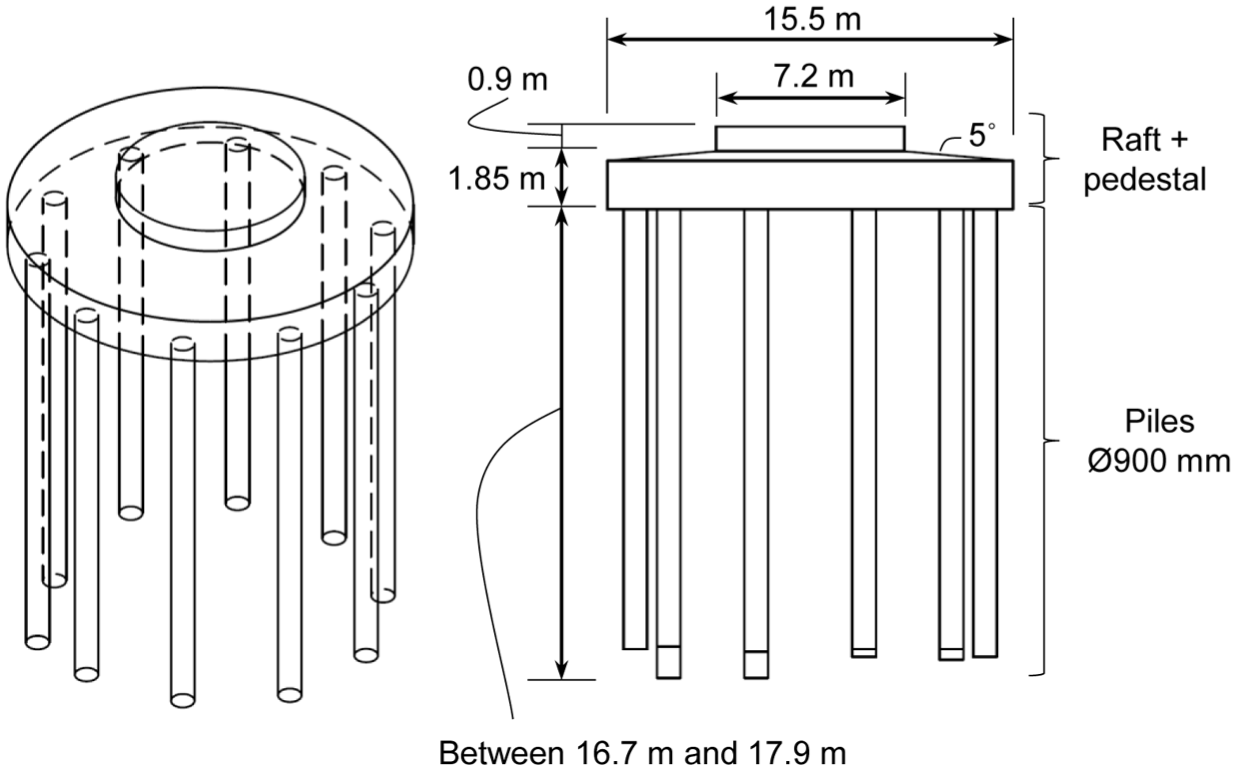
Foundation schematic.
Site conditions and geotechnical aspects
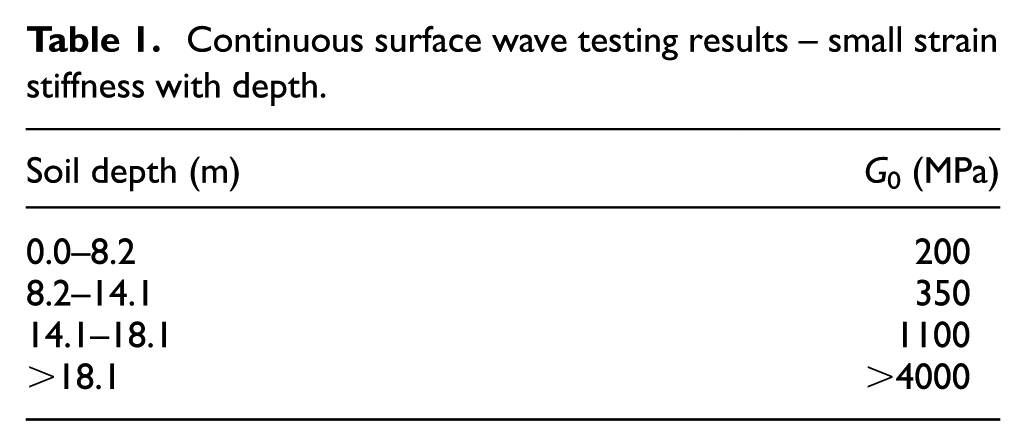
The instrumented foundation is situated on a hill at an elevation of 130 m above sea level, with a thick layer of silty aeolian sands present to depths of about 22 m. Based on results obtained from the geotechnical site investigation report, 48 the soil was classified as clayey sand with plastic fines, according to the Unified Soil Classification System. The Standard Penetration Test results indicating medium-dense to dense soil conditions over a depth range between 0.8 and 3 m. Borehole core samples indicated an in situ dry and wet density of 1482 and 1862 kg/m3 at depths between 1.1 and 1.3 m, and 1780 and 2070 kg/m3 at depths between 14.6 and 14.9 m, respectively. The underlying bedrock comprised alternating layers of mudstone, siltstone and sandstone, with the groundwater table located 25 m below the soil surface based on standpipe piezometer measurements. To assess the variation in small strain stiffness (G0) of the soil with depth, continuous surface wave testing was conducted, with the results summarised in Table 1.
Continuous surface wave testing results – small strain stiffness with depth.
Concrete properties
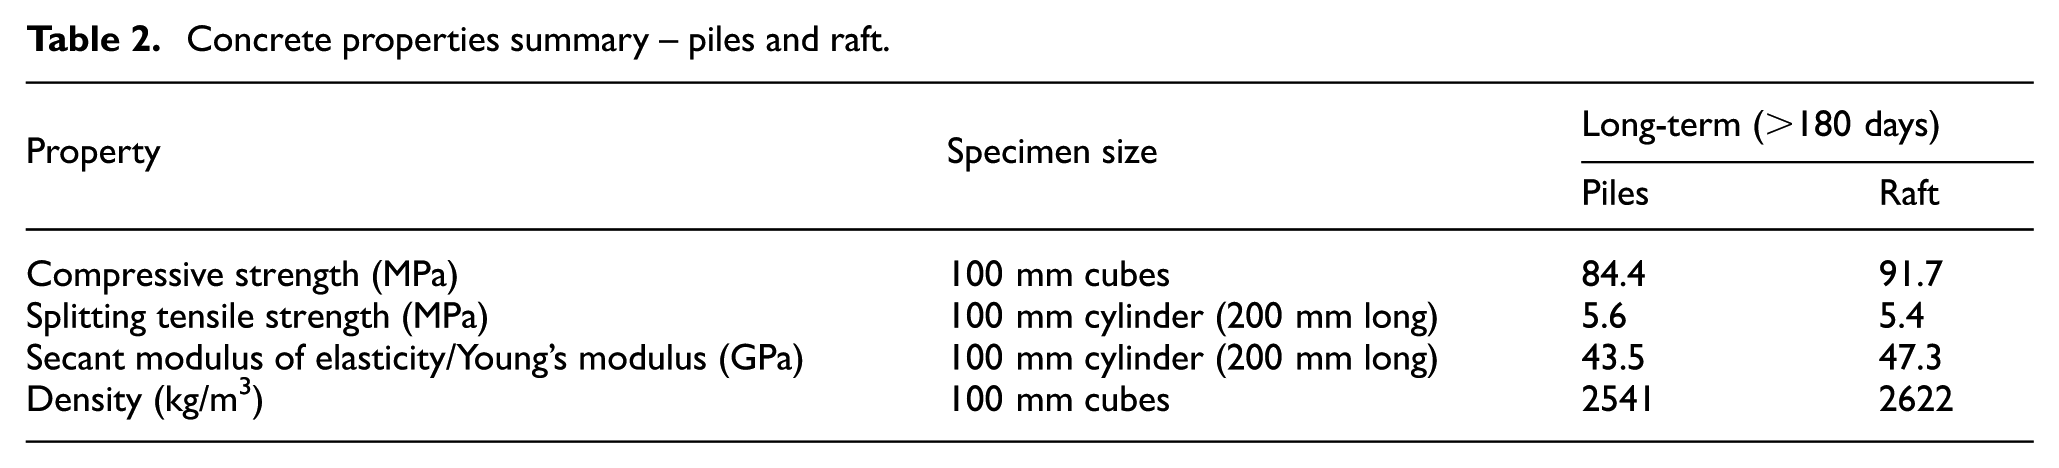
Samples of fresh concrete used to cast the different foundation components (piles and raft) were taken on-site. Table 2 indicates the sizes of the relevant specimens cast, with the material properties measured of the concrete including the density, compressive strength, indirect tensile strength, and the secant modulus of elasticity. Sample preparation and testing methods were in accordance with relevant British Standards,49–51 with specimens tested at the Civil Engineering Laboratory at the University of Pretoria. Although 28-day strengths were also measured, Table 2 presents long-term properties (>180 days) as they are more representative of the actual properties of the concrete.
Concrete properties summary – piles and raft.
Apart from taking concrete samples from the raft mix to obtain the material properties presented in Table 2, two additional 250 mm diameter, 500 mm high cylinders were cast. Each cylinder contained a vibrating wire strain gauge (VWSG) positioned in the centre, midway from the bottom (see Figure 2(a)), enabling the measurement of strains as the concrete shrinks. Soutsos and Domone 52 mentioned that the size and shape of concrete specimens significantly affect shrinkage, as the inner core of a specimen acts as a restraint against overall movement, with the rate of moisture loss, and hence shrinkage, depending on the rate of water transfer from the core to the surface.
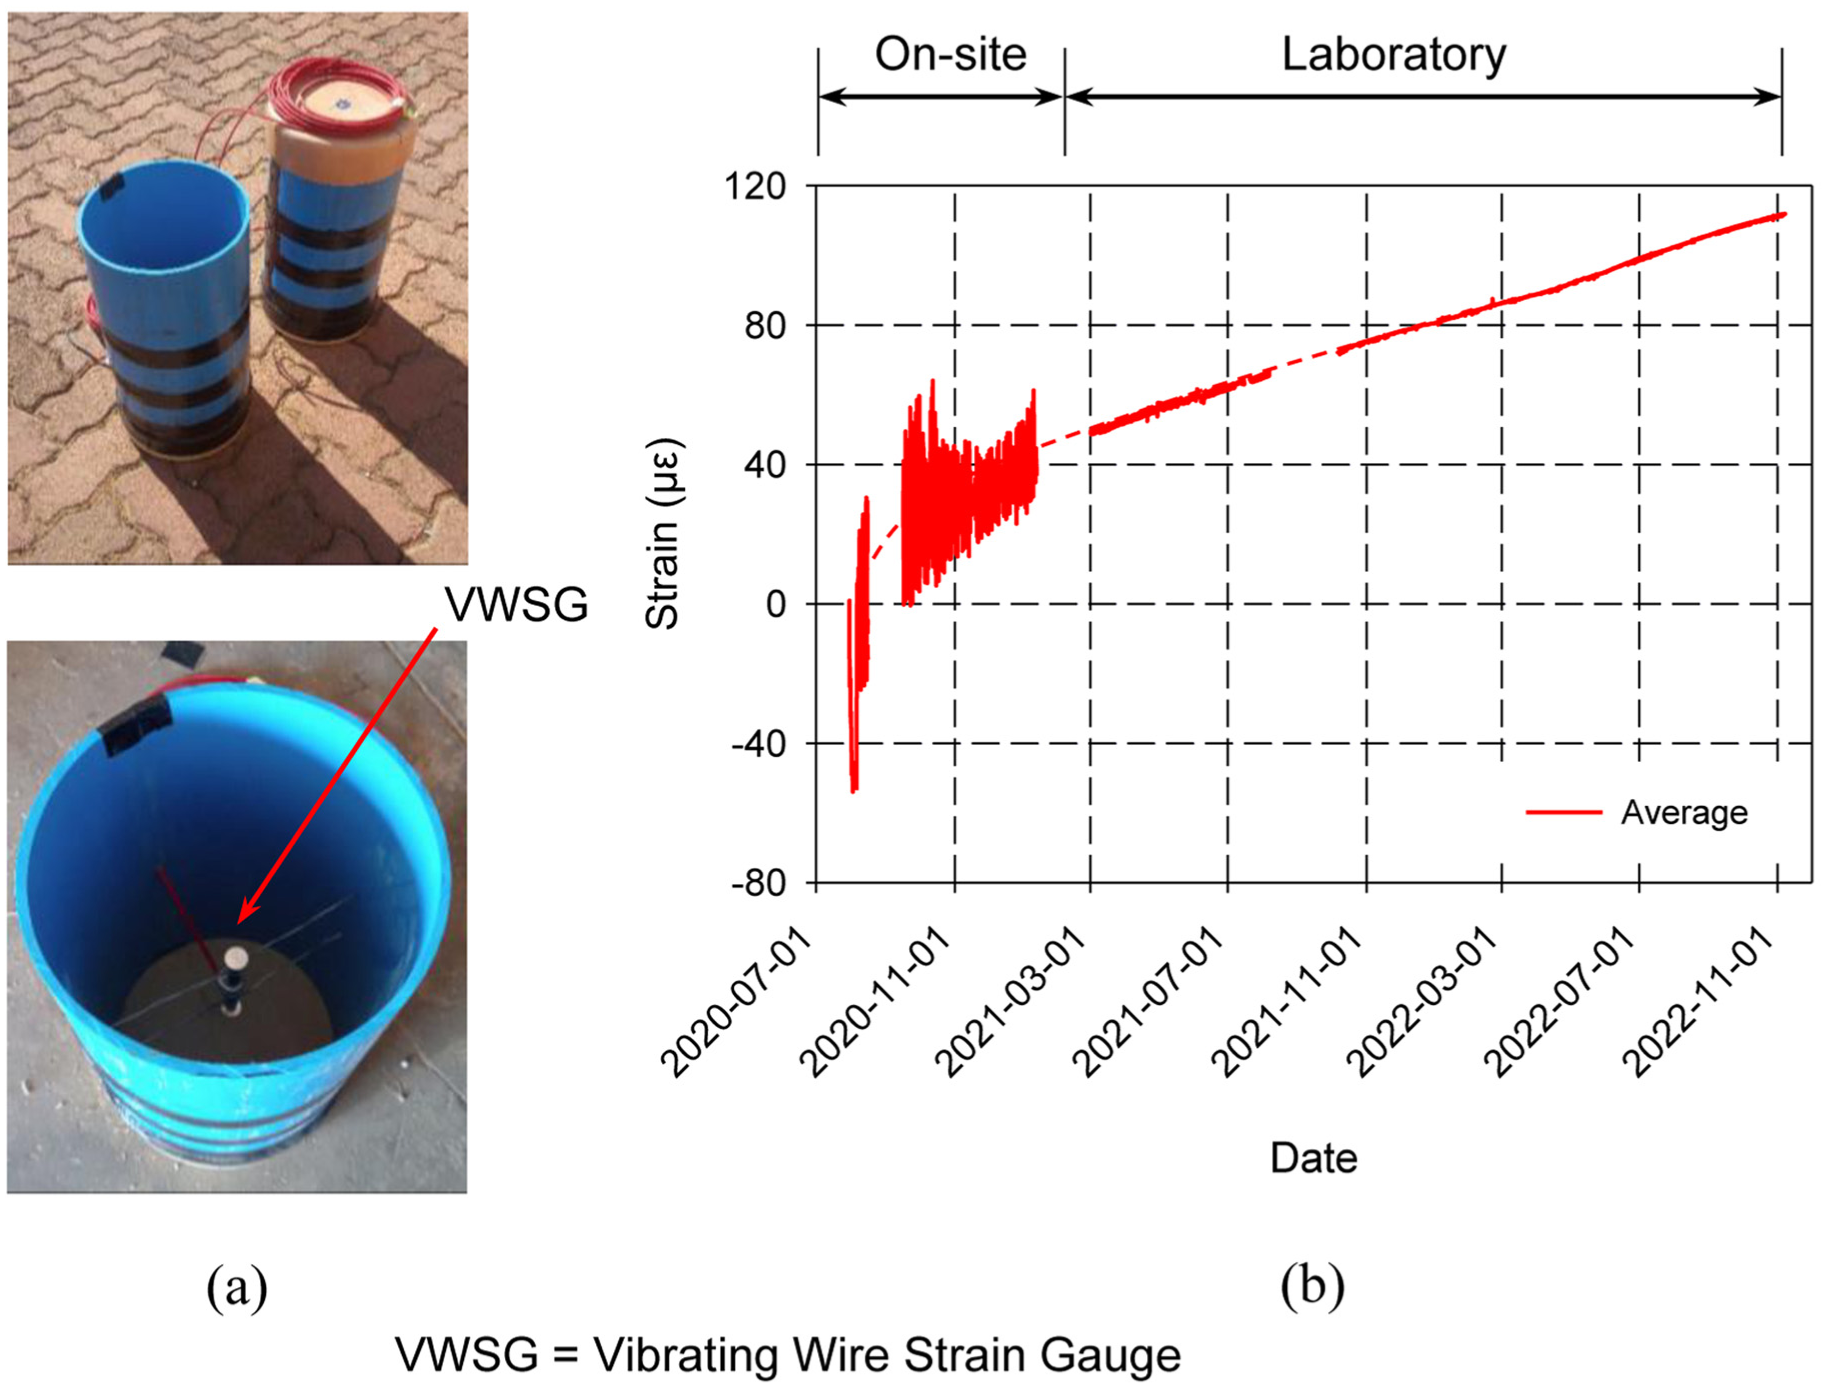
Shrinkage measurement: (a) reference cylinders and (b) measured mechanical strain.
Considering the size of the raft that was cast, it was necessary to estimate the shrinkage experienced by the concrete in the core of the raft, enabling its influence to be subtracted from the measured mechanical strains obtained from the foundation under working load conditions. For this reason, after casting, both cylinders were closed and sealed to prolong the shrinkage process, simulating conditions similar to that experienced by the core of the raft, where the shrinkage rate is restricted by both the size of the raft and the overburden and confining backfill. Figure 2(b) presents the average concrete shrinkage data obtained from the two cylinders, measured from the day of casting.
Initially, the fresh concrete experienced tensile (negative) strains due to the heat generated during the hydration process between the cement and the water, resulting in slight swelling of the cement paste. This normally occurs when the hydration reactions proceed most rapidly, typically within the first few days after cast. 52 After achieving a peak of swelling (at about −50 µε), the concrete started to shrink at a gradually decreasing rate, with shrinkage potentially contributing up to 120 µε to the measured strain in the raft. Shrinkage measurements within the first few months after casting appear to be ‘noisy’. According to Skorpen, 53 this ‘noise’ can be attributed to the heat sync effect of the cylinder and the continually changing surface temperatures resulting in small temperature (thermal) gradients through the cylinder. Both cylinders were kept on-site for the first 6 months, thus experiencing the same day–night temperature changes as the turbine foundation. Similar to the concrete specimens cast for obtaining the strength properties, both reference cylinders were transported to the University of Pretoria, where they were kept sealed in a temperature-controlled room at 25°C, with shrinkage measurements on both cylinders continuing. In addition, the thermal expansion coefficient of the concrete cast on-site, required for interpreting the data, was determined from the same two instrumented reference cylinders as 8.46 με/°C.
Monitoring system
Sensors, placement and labelling
During foundation construction and turbine installation, several instruments were embedded within the foundation system or installed inside the turbine tower as part of the SHM system. With the research focusing on static monitoring of the foundation, sensors were selected based on long-term reliability, durability during harsh installation conditions and environments, and ease of installation to limit any delays during construction.
Foundation
For the foundation, a total of 31 concrete embedment VWSGs with built-in thermistors were installed. These VWSGs measured the total strain in the surrounding concrete, with the total strain consisting of a combination of mechanical strain, caused by external loads acting on the concrete, and thermal strain, induced by temperature changes. To distinguish between the mechanical and thermal strains experienced by the concrete, the temperature of the gauge is recorded simultaneously. The thermal strain is then calculated by multiplying the coefficient of thermal expansion of the concrete by the measured temperature change, while the remaining portion of the total strain is attributed to mechanical effects. Equations (1) and (2) present the two equations that were used on all the measured VWSG data, as per the RST Instruments Vibrating Wire Embedment Strain Gauge Installation and User Manual 54 :


where R0 is the initial strain, R m is the strain at any given time m, T0 is the initial temperature, T m is the temperature at time m, C1 is the coefficient of thermal expansion of the VWSG steel wire (taken as 12.20 με/°C according to instrument calibration sheet), and C2 is the coefficient of thermal expansion of the surrounding concrete (taken as 8.46 με/°C). The relationship between the strain (R), in micro-strain, and the resonant frequency (f) at which the wire vibrates is given by Equation (3)54,55:

where CF is the strain gauge calibration factor, determined in factory during production either by calibrating a sample of gauges from each manufacturing batch or individually calibrating each gauge (for higher accuracy). 54 In this article, the calibration factor was based on a sample of gauges taken from the manufacturing batch.
A VWSG was located in each of the ten piles at a depth of 2.5 m below the bottom surface of the raft (see Figure 3). For the two piles in the prevailing wind direction (south-westerly according to initial investigative site reports), indicated by the dotted circles in Figure 3(a), additional VWSGs were placed at depths of 0.5 and 4.5 m, respectively (see Figure 3(b)). For Pile 54 P, sensors were placed on opposite sides of the pile at these three depths, allowing for the axial and bending stresses of the pile to be assessed. Based on initial numerical modelling, the maximum bending moment was expected towards the top of the piles, roughly within four to five pile diameters from the top, in line with previous research from Georgiadis et al. 56 and Zhu et al. 57 observed from experiments on scaled pile models. Thus, sensors were concentrated and only installed within this region instead of over the entire length of the pile. For explanation purposes, Figure 3(c) was included to indicate the position of the leeward and windward piles relative to the direction of the wind.
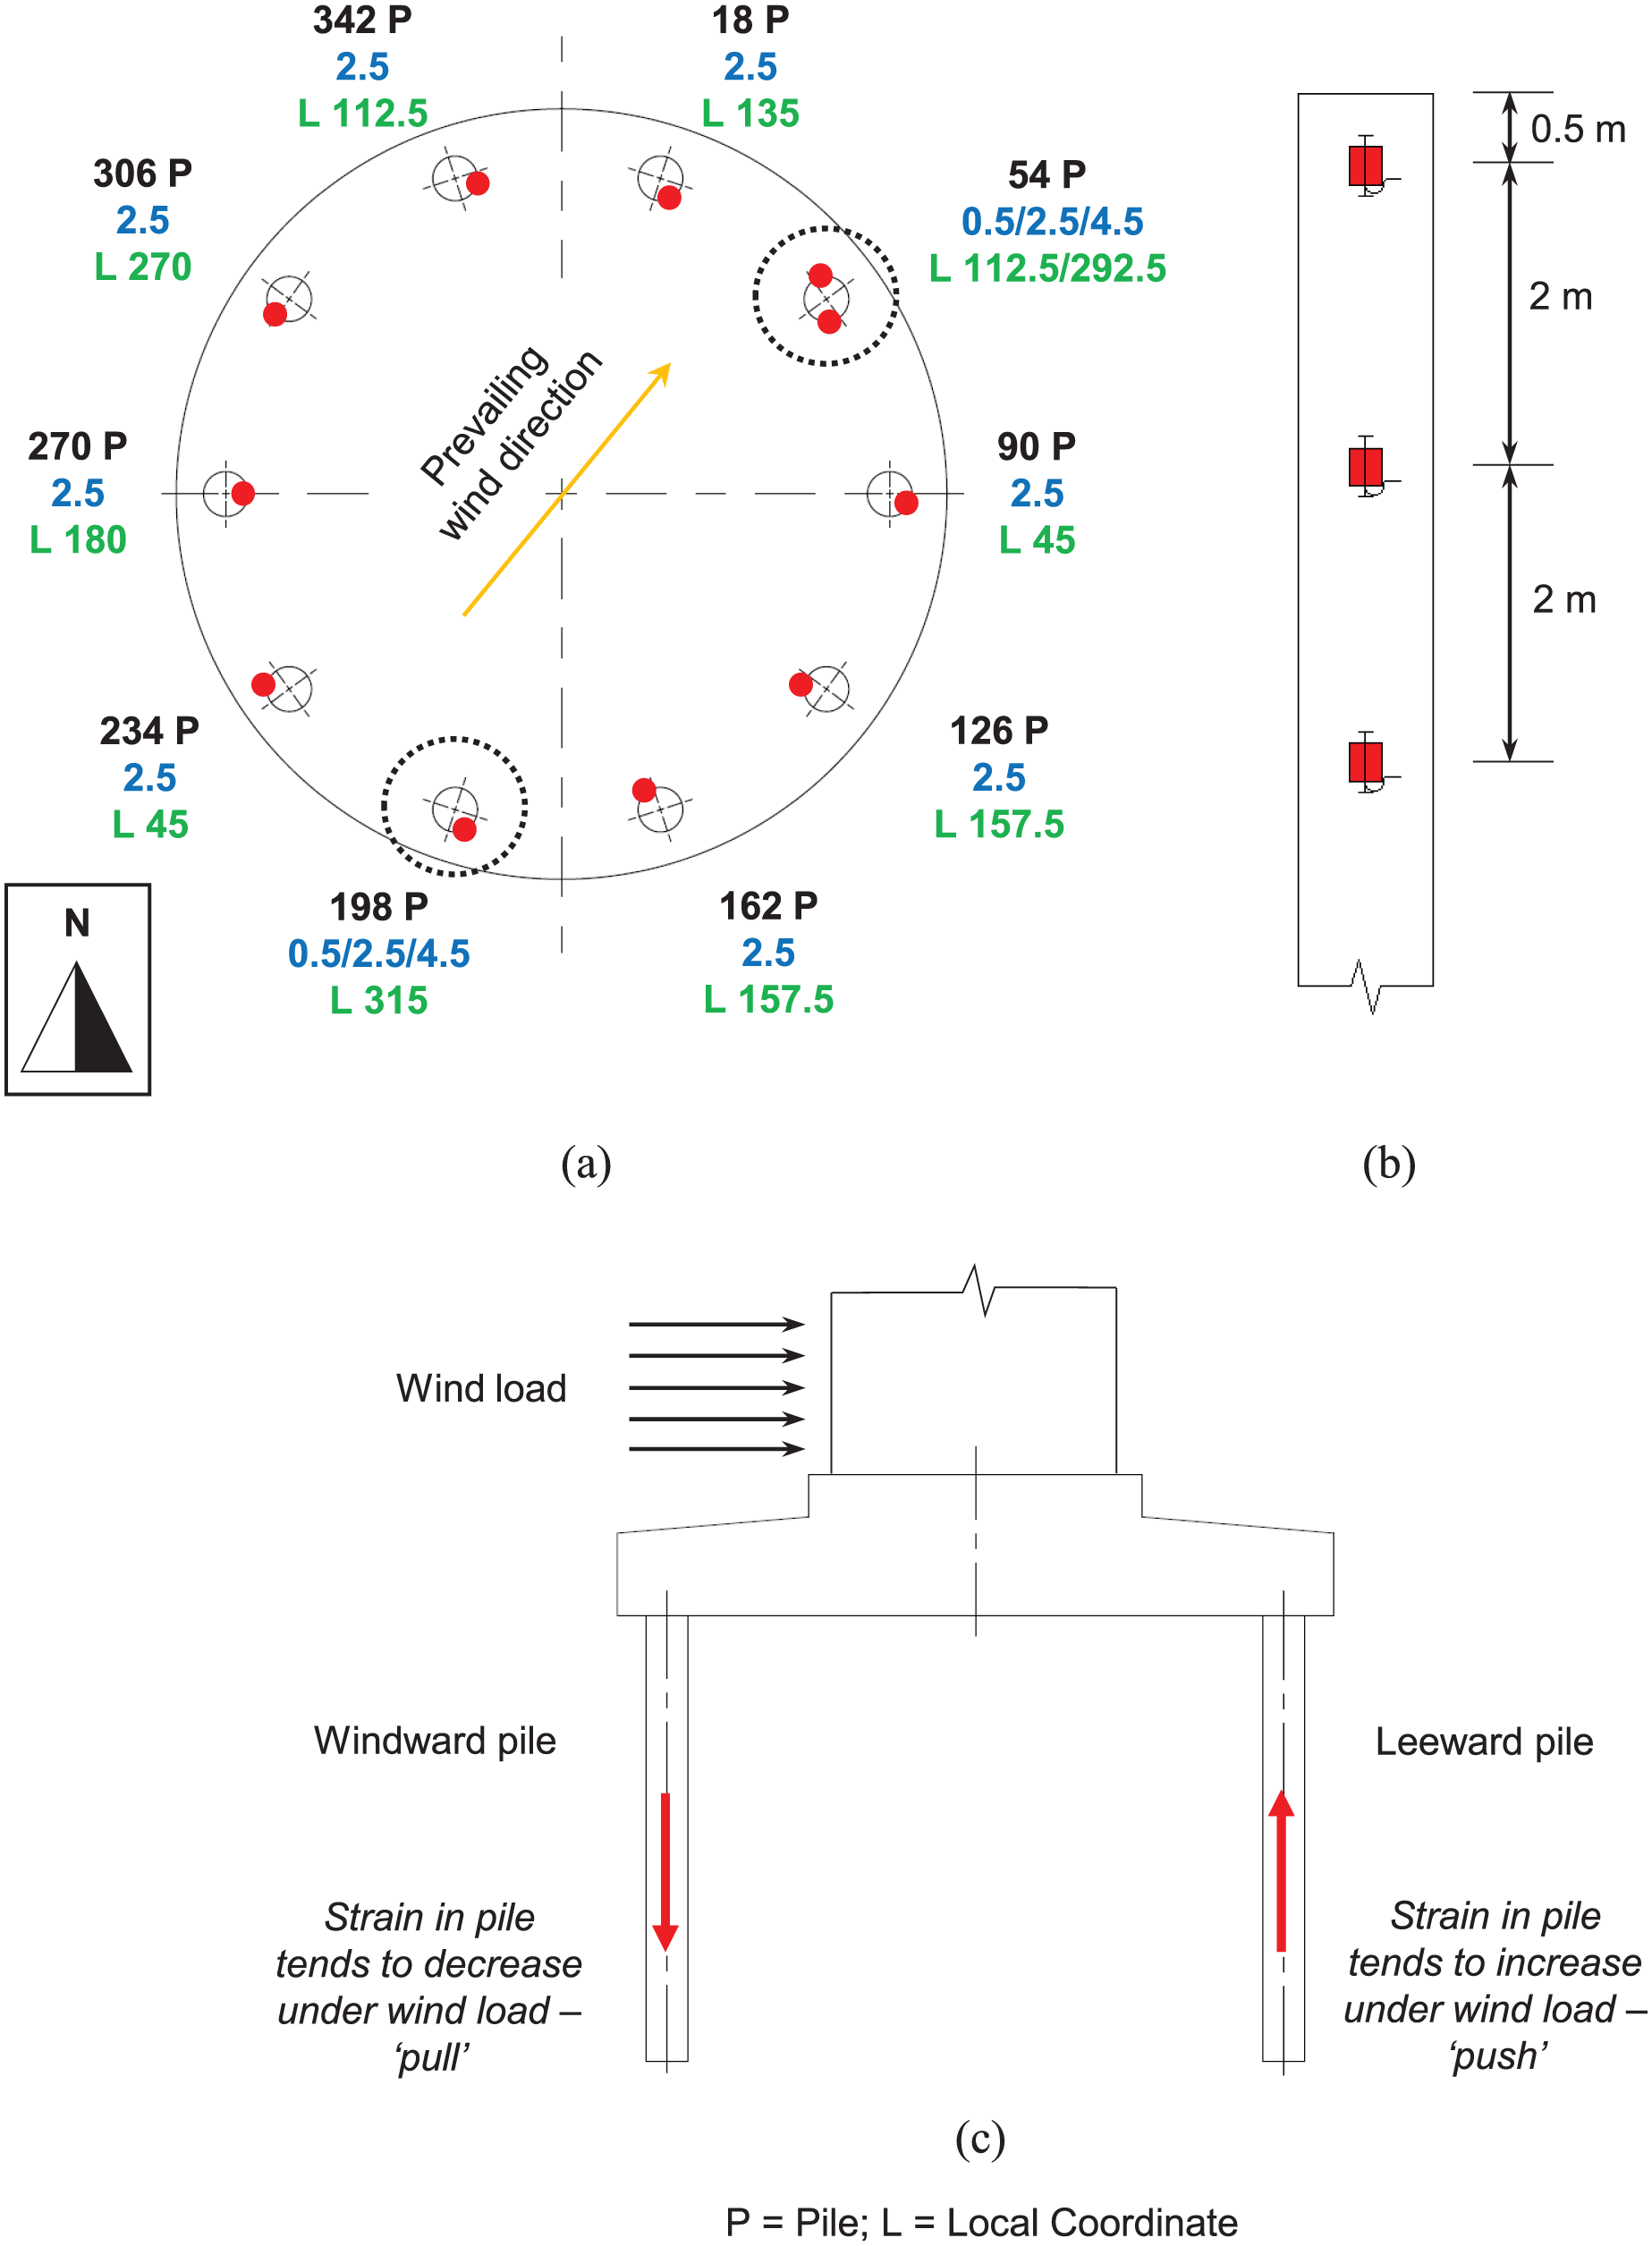
Instrumentation placement – piles: (a) plan view, (b) cross-section and (c) leeward-windward pile position relative to wind direction.
A global labelling coordinate system was applied to all the sensors installed within the foundation. Each pile in Figure 3(a) is labelled in black, with ‘P’ referring to ‘Pile’ and the accompanying number corresponding to the position of the pile from the centre of the raft relative to north, expressed in degrees. The number in blue denotes the VWSG depth below the bottom surface of the raft, either at 0.5, 2.5 or 4.5 m. Lastly, the green portion indicates each sensor’s position relative to the centre of each pile, with ‘L’ referring to ‘Local Coordinate’ and the corresponding number indicating the sensor’s position relative to the outside of the pile facing away from the foundation centre, expressed in degrees. For example, if the value reads ‘L 0’, the sensor is located on the outermost point on the side of the pile facing towards the outside of the foundation. Additionally, if the value reads ‘L 180’, the position of the sensor in the pile is facing towards the foundation’s centre and is the innermost point. For further explanation, these positions are also indicated by the circular red markers in Figure 3(a). The position of these sensors relative to the centre of each pile was not intentional but depended on construction activity during the installation of the pile reinforcing cage prior to pile casting.
The remaining 14 concrete embedment VWSGs were installed at four locations, in both the top and bottom of the raft, in either the radial or transverse directions, or both. Figure 4(a) and (b) presents the position of the VWSGs installed within the raft part of the piled-raft foundation. The positions of the sensors were selected where the highest bending moment was expected in the raft in the prevailing wind direction and the direction perpendicular to that. Similar to the labelling system used for the piles, the position of the VWSGs was expressed in degrees relative to North, as indicated in black, with ‘R’ referring to ‘Raft’. Furthermore, ‘B’ and ‘T’ (in blue) refer to the position of the sensor in either the ‘Bottom’ or ‘Top’ of the raft, whereas ‘Ra’ and ‘Tr’ in green indicate the sensor’s placement in either the radial or transverse directions.
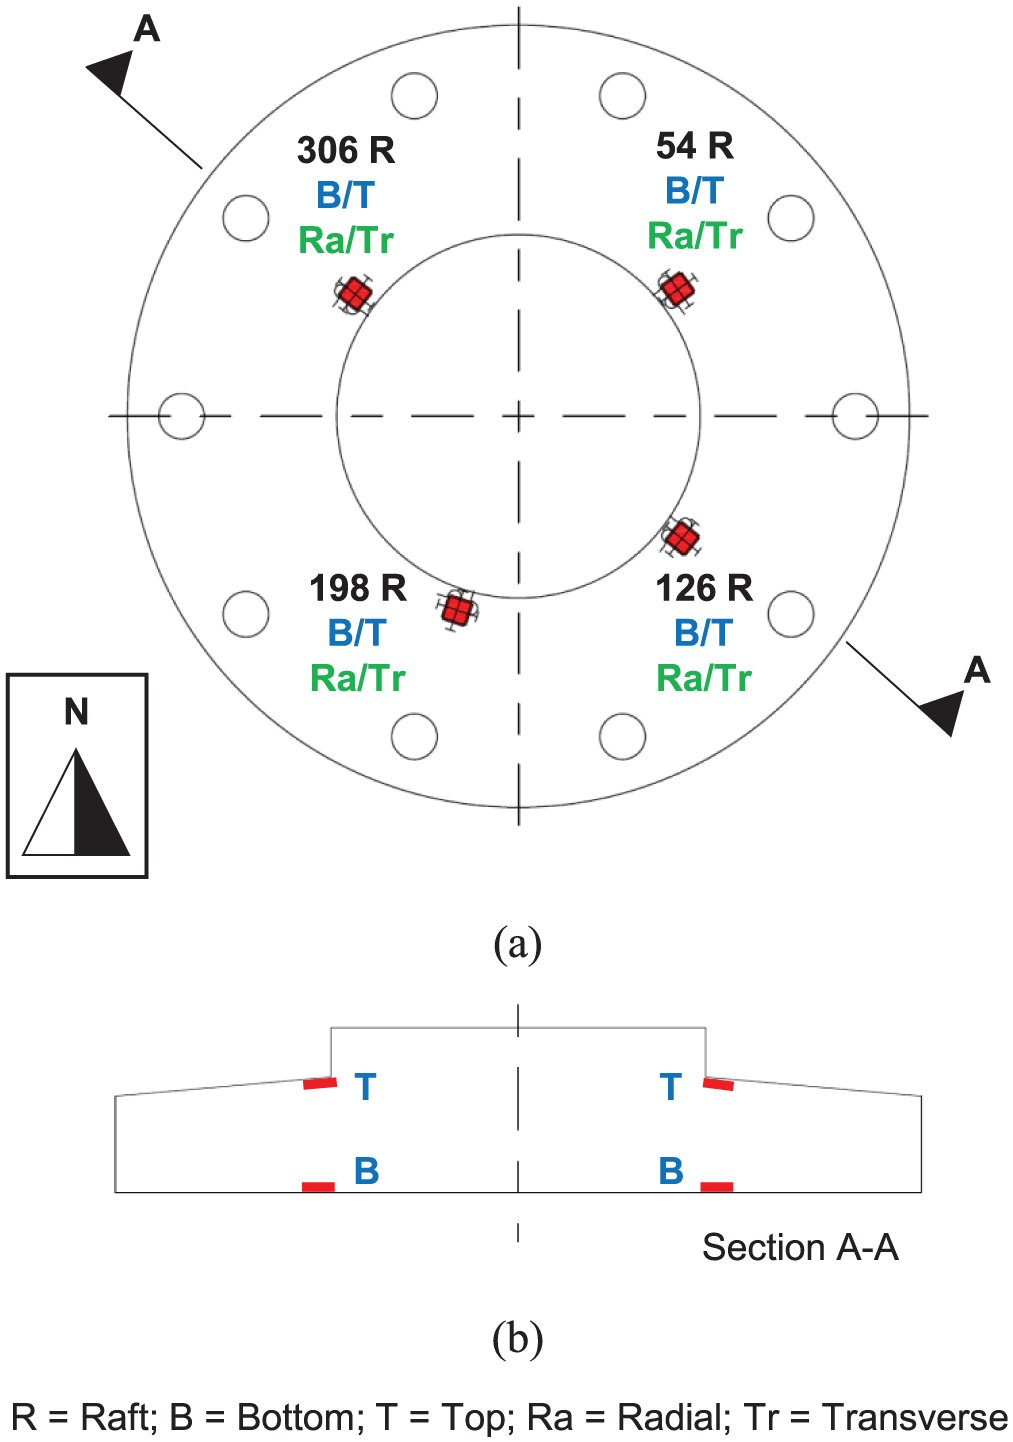
Instrumentation placement – raft: (a) plan view and (b) cross-section.
Wind turbine tower
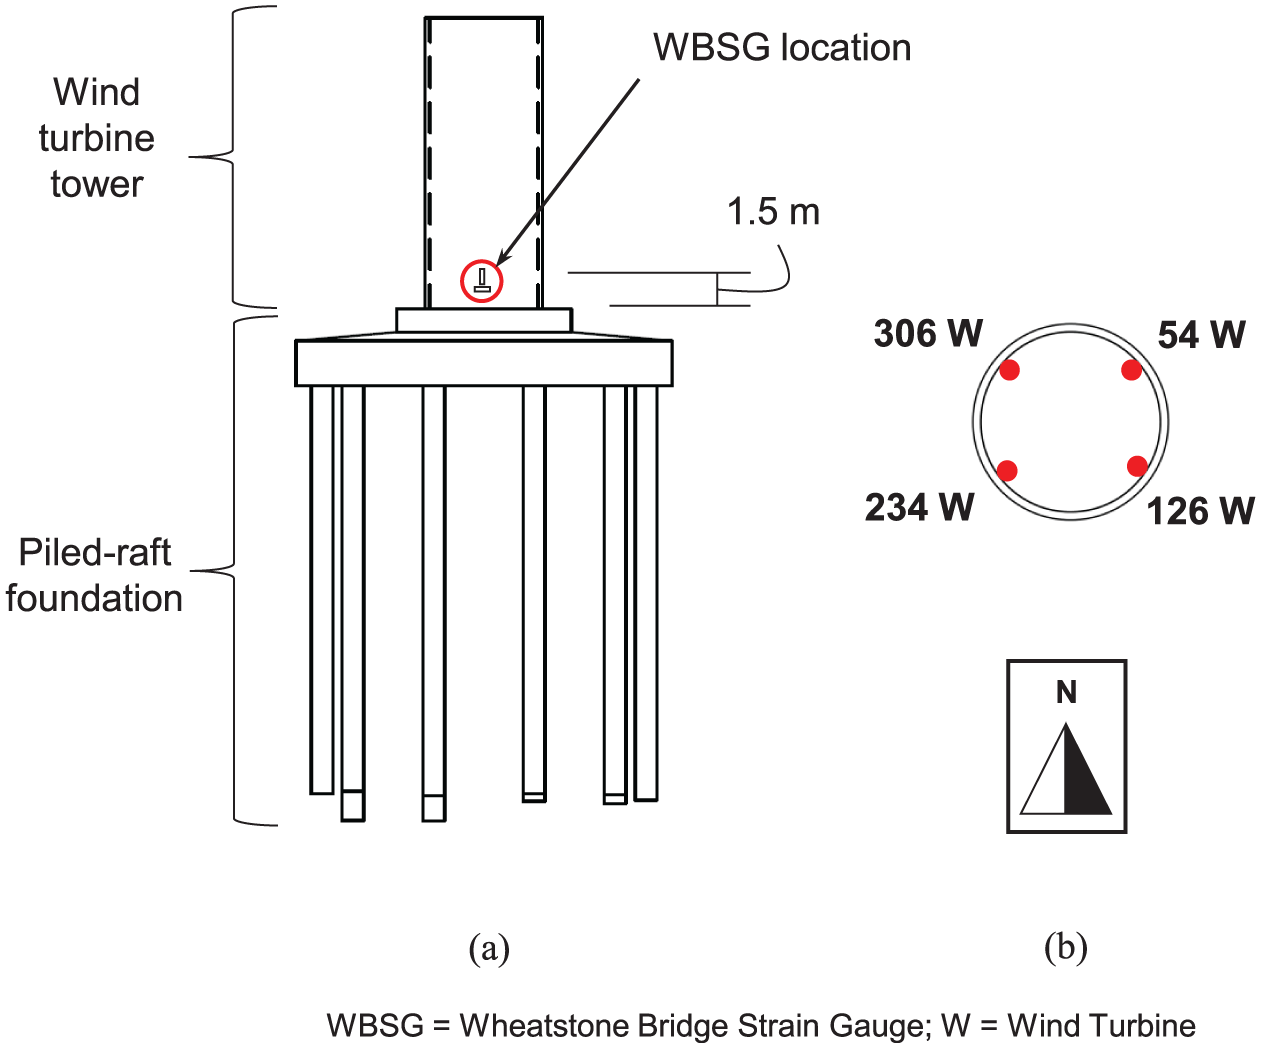
To assess the axial force and bending moment in the turbine tower, sensors were installed inside the bottom section of the tower before the top portion of the turbine was constructed. The placement of these sensors allowed for the tower’s response to be monitored during turbine installation and operation, aiding in quantifying the true magnitude of the loads and moments being transferred to the underlying foundation. Eight 120-ohm quarter-Wheatstone bridge strain gauges (WBSGs) were installed at the base of the wind turbine tower to obtain independent strain readings. WBSGs were positioned at four locations along the inside circumference of the bottom tower section (see Figure 5(a) and (b)), 1.5 m from the base of the tower. The location of the sensors was again selected to be in the predicted prevailing wind direction and the direction perpendicular to that. At each position, two gauges were placed perpendicular to one another, with the vertical gauges measuring axial strain and the horizontal gauges only used for temperature compensation. Each location in Figure 5(b) is labelled as indicated in black, with ‘W’ referring to ‘Wind Turbine’ and the accompanying number corresponding to the position of the strain gauges from the centre of the turbine and foundation relative to North, expressed in degrees.
Instrumentation placement – base of turbine tower: (a) cross-section and (b) plan view.
By measuring independent strain (quarter-Wheatstone bridges) on opposite sides of the tower, it was possible to distinguish between axial forces caused by the weight of the turbine structure and bending moments experienced by the tower caused by the wind. Equations (4) and (5) present the formulas for calculating these forces and moments, respectively, and were used to interpret all the measured data from the tower:
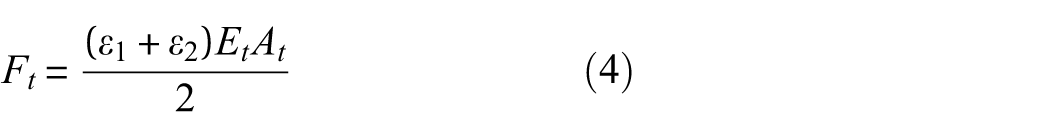
where F t is the axial force experienced by the tower, E t is the Young’s modulus of the tower steel (taken as 210 GPa 58 ), A t is the cross-sectional area of the bottom section of the tower, M t is the bending moment experienced by the tower, Z t is the elastic sectional modulus of the bottom section of the tower, and ε1 and ε2 is the temperature compensated strain measured on opposite sides of the tower. Both equations were derived from first principles as presented in Gere and Goodno. 58
Data logging
Measurements were only taken when construction activity allowed throughout the construction process of the foundation, as well as during turbine installation and after commissioning, to determine the foundation and turbine response under working load conditions (turbine operations). All measurements from the VWSG sensors embedded in the raft and piles were taken using a commercially available Campbell Scientific CR6 measurement and control datalogger, accompanied by two AM 16/32B multiplexers to increase the number of channels available to log simultaneously. In addition, a low-cost multichannel Arduino-based differential voltage data acquisition system developed at the University of Pretoria was used to measure the output of the WBSG strain sensors at the base of the turbine tower. 59 With the focus on static monitoring of the wind turbine tower and foundation, measurements on both systems were taken at 15-min intervals. Thus, synchronisation of data between the different systems did not present an issue.
Results and discussion
As a brief overview of the measured results, Figure 6 presents all the strain measurements in the raft and the piles for the entire monitoring period of 33 months, highlighting the different phases in the turbine’s lifespan. These phases start with the early-age response of the foundation during construction and end with the foundation response during turbine installation and initial operation. The data present the total strain measured in the foundation, including the strains induced by external loads (in this case, the self-weight of the tower and vibrations caused by the wind) and concrete shrinkage, as well as that caused by seasonal temperature changes. The monitoring schedule was interrupted from time to time before commercial turbine operation (see Figure 6), which can be attributed mainly to either construction activity on site or the reliance on battery power for obtaining measurements, as the turbine and loggers were not yet connected to the grid at these times. In addition, following turbine commissioning, data loss occurred due to the limited memory capacity of the loggers, poor cellular reception and the challenges of accessing the equipment regularly for data extraction at these remote sites. Future studies would thus benefit from loggers with larger storage and battery capacities, as well as more reliable data transmission systems to minimise data gaps and improve long-term monitoring reliability.
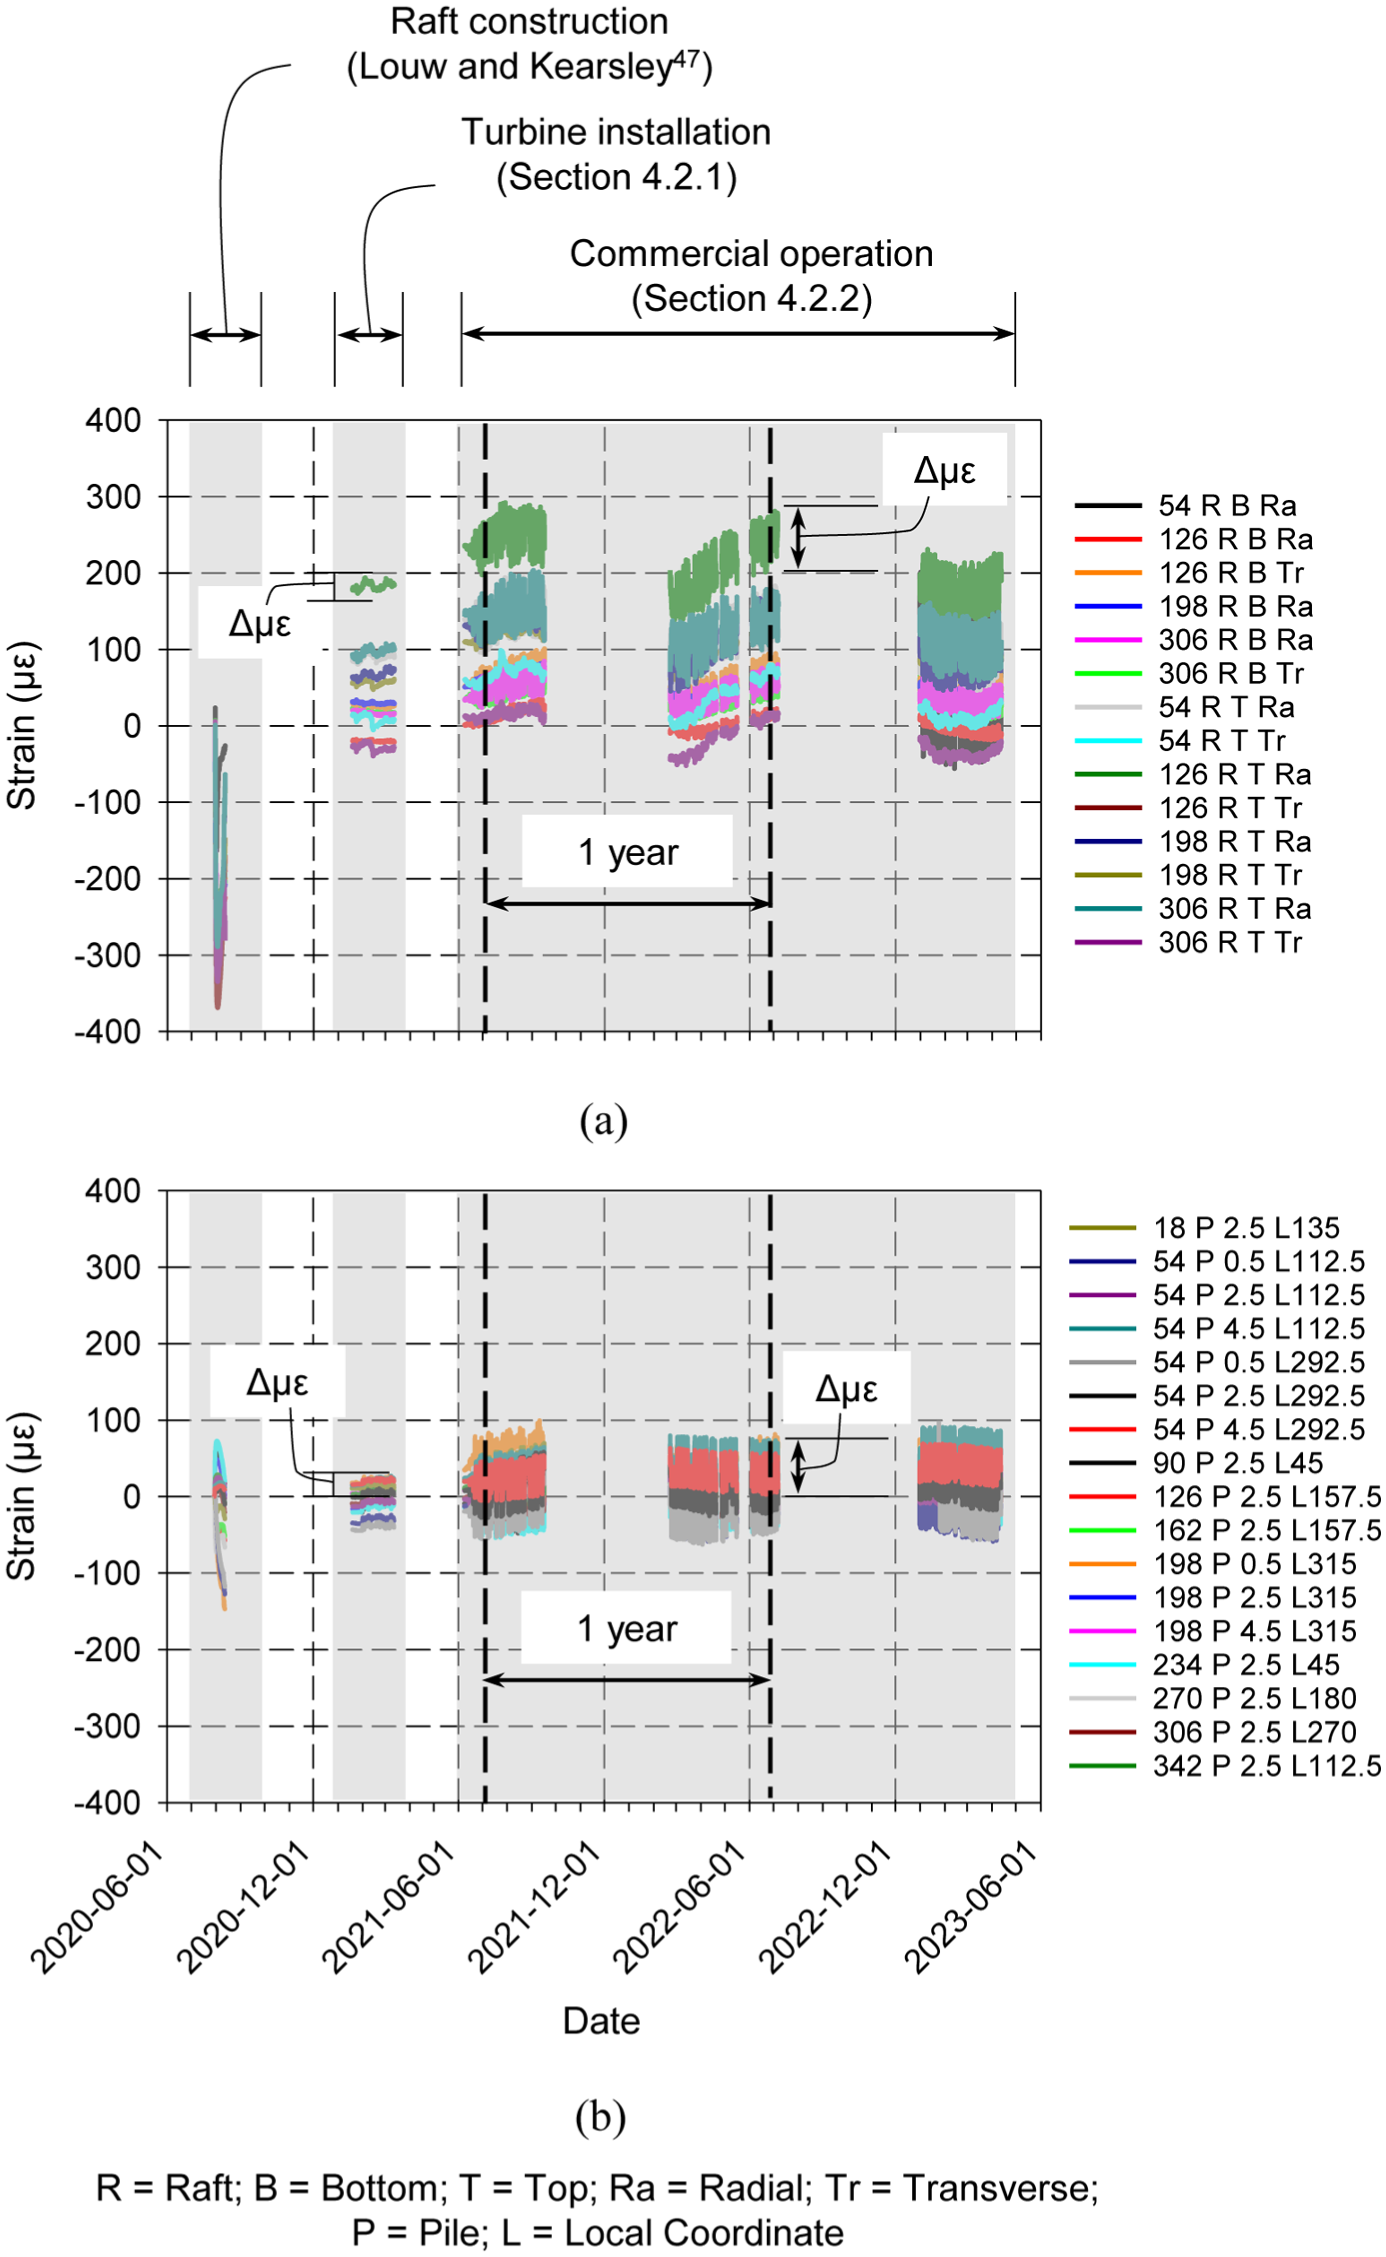
Total strain measurements: (a) raft and (b) piles.
As seen in Figure 6, the measured data were only zeroed at the start of foundation construction, and not re-zeroed after each gap in monitoring. Measurements were instead allowed to continue from their shifted values, ensuring that any changes occurring during the periods of missing data were still captured and could be accounted for in the analysis. As this article focuses solely on the last two phases, ‘Wind turbine installation before commercial operation’ and ‘Commercial operation after commissioning’ sections will concentrate on each of these phases individually, discussing the measured results, with ‘Wind data’ section discussing a brief overview of wind load effects. Most of the data presented is centred around mechanically induced strains. However, thermally induced strains are mentioned where they are deemed critical to the overall response of the foundation.
Apart from the strain measured during the construction phase of the raft (initial portion of the figure), which was mainly thermal, 47 the horizontal loads and overturning moments caused by the wind had a greater impact on the supporting foundation than the loads induced by the self-weight of the turbine. This is evident from the change in strain (Δμε) measured during turbine installation in both the raft and piles being greater under operational wind loading than under the turbine installation (as illustrated in Figure 6). Even though the foundation was buried below the soil after construction, seasonal variations (changes in thermal strain) between summer months starting in December and winter months starting in June can be observed from the raft strains. Given the large amount of data measured, the section on turbine operations in this article only focuses on the first year of operations, as indicated by the dashed lines in Figure 6. The sign convention adopted for plotting the site data followed standard geotechnical practices, whereby positive strain is considered compressive and negative strain is considered tensile. Subsequently, negative loads are indicative of tensile loads, while positive loads represent compressive loads.
Wind turbine installation before commercial operation
Apart from monitoring the response of the foundation during construction, no measurements were taken until the wind turbine was constructed. Before the final turbine assembly, the foundation was backfilled, and the bottom section of the tower was connected to the anchor cage. This meant that the strain in the foundation measured from this point onwards included the strain induced by concrete shrinkage of the raft, the soil backfill and the weight of the bottom turbine tower section.
Installation of the wind turbine top tower sections, the nacelle, drive train, rotor hub and rotor blades took place at the end of January 2021, with the assembly finished within a few days. Figure 7(a) and (b) indicates the axial force (F t ) and bending moments (M t ) measured at the base of the turbine tower during the period of turbine installation. As expected, the axial force in the tower increased as the turbine was erected. The mass of each wind turbine component was obtained from the wind turbine manufacturer and used to determine the theoretical total axial force expected at the base of the tower.
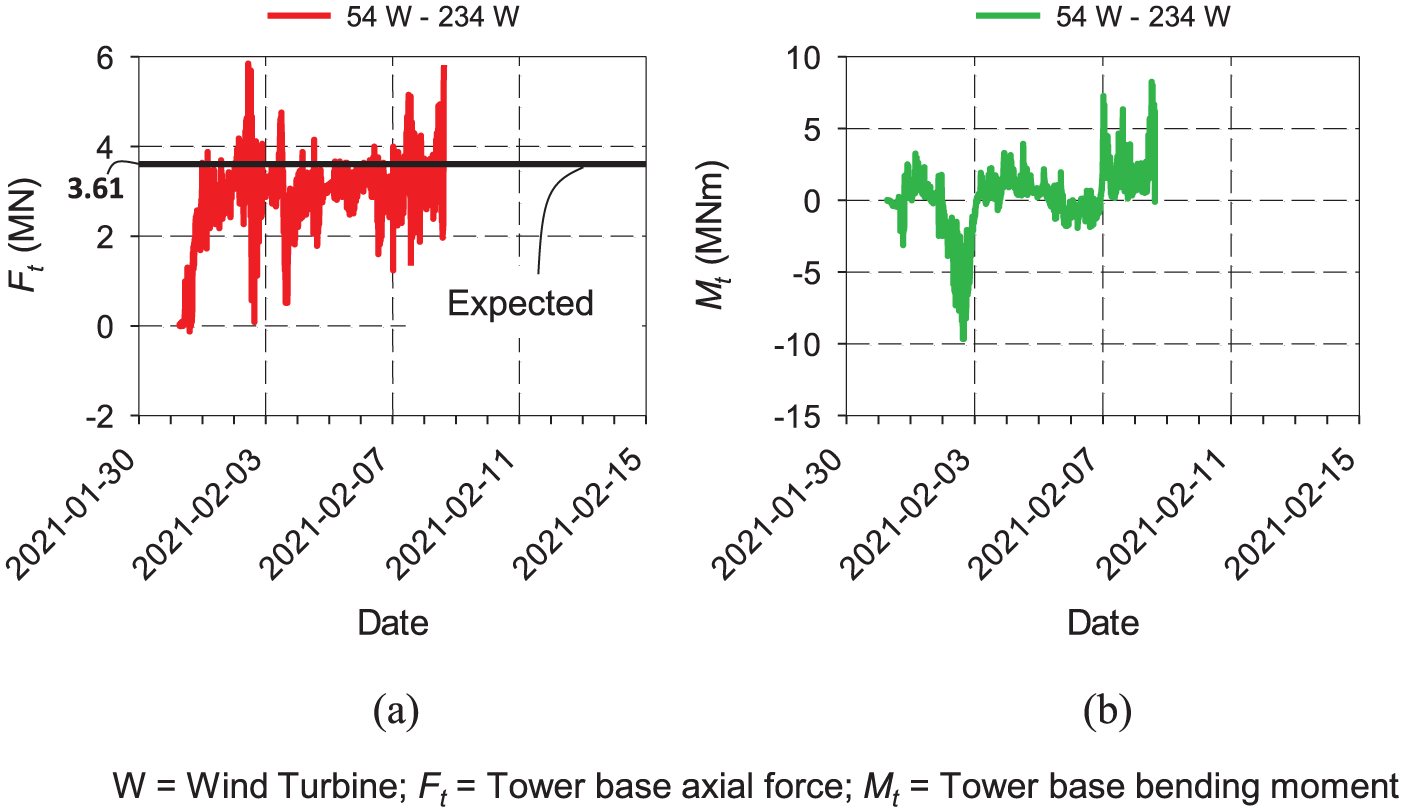
Turbine response: (a) axial force and (b) bending moment.
The expected axial force was calculated to be 3.61 MN, corresponding to a combined turbine mass of 368 tonnes, excluding the mass of the bottom tower section of 81 tonnes. This expected axial force is also reflected in Figure 7(a), showing good agreement with the measured axial forces. The axial forces remained relatively constant after that, with some variation caused by either construction activity or the wind acting on the turbine tower and stationary blades in the following days. During and after the 3 days of installation, small bending moments were observed, caused by the wind acting on the tower and stationary blades.
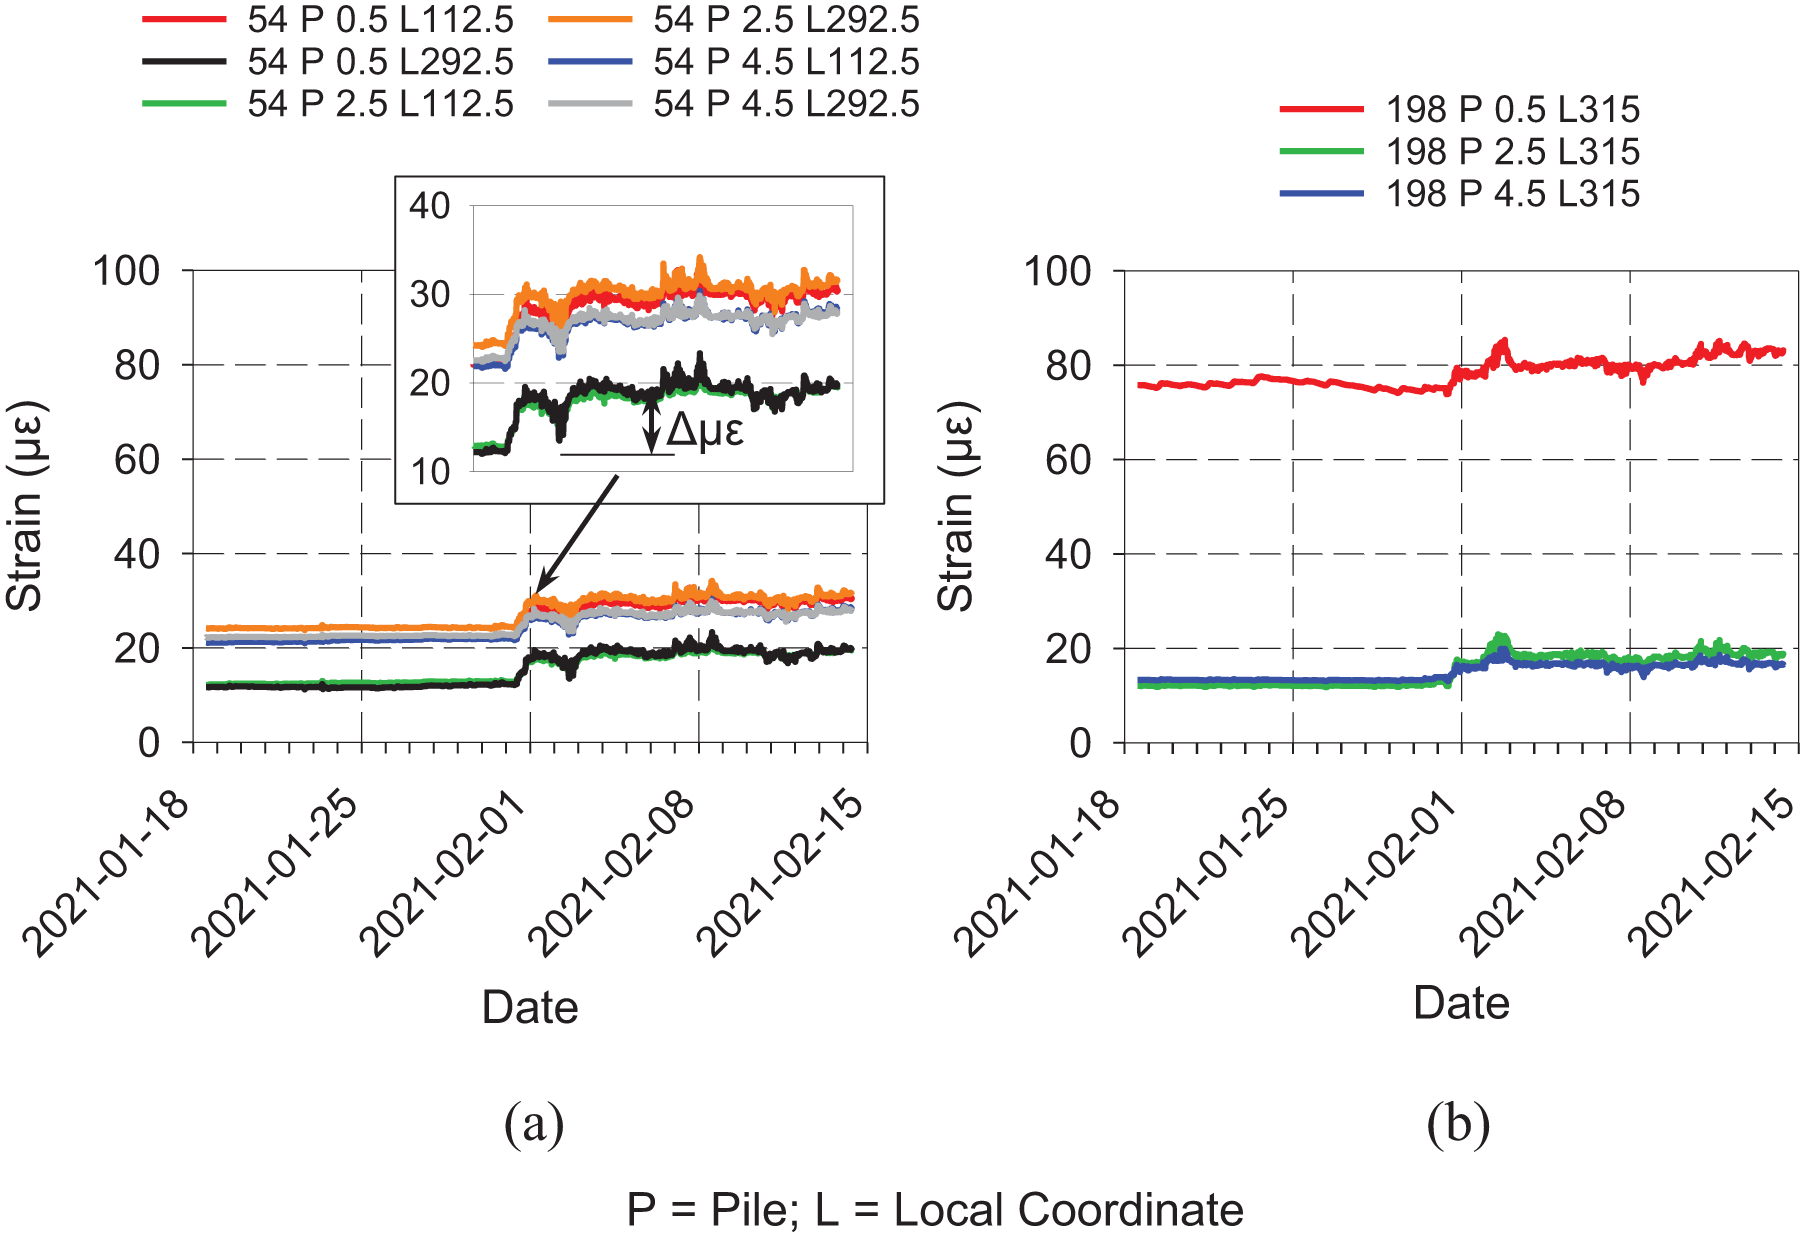
The effect of the wind turbine installation was more visible in the piles compared to the raft. Figure 8(a) and (b) indicates the mechanical strains measured in Pile 54 P and 198 P, respectively. As illustrated, both piles experienced increased compressive strain during installation, with the effect noticed at all three depths. Similar responses were observed in the other eight piles but are not presented here. Again, construction activity and wind acting on the newly erected wind turbine caused noticeable changes in the measured strains. Strains were also not zeroed, with the measurements presented in Figure 8, and in the remainder of this article, including all activities since foundation construction.
Pile mechanical strain response: (a) 54 P and (b) 198 P.
Given that the raft could be considered rigid, with a raft-soil stiffness ratio (K rs ) equalling 2.65, 60 limited rotation between the raft and the piles should occur during turbine installation (vertical loading). Thus, the change in strain in each pile, caused by the vertically imposed load from the turbine’s weight, can be assumed to be nearly entirely axial. Taking the change in strain (Δμε) in all ten piles at a depth of 2.5 m below the bottom surface of the raft before and after turbine installation, the total vertical load carried by the piles can be estimated using Hooke’s Law, the Young’s modulus of the concrete (E p ), as well as the cross-sectional area of the piles (A p ), where F p = ApEpΔμε. As an example, Figure 8(a) illustrates how Δμε was obtained for Pile 54 P, with all other piles showing similar trends. An estimated load of 1262 kN (F p ) was calculated to be carried by the piles, with the load not equally distributed among the 10 piles, potentially caused by the varying lengths of the piles. Based on the 3610 kN (F t ) applied vertical load caused by the additional turbine components during installation, the piles carried approximately 35% (F p /F t ) of the total self-weight of the wind turbine structure. No significant change in the mechanical strain at the top and bottom of the raft could be observed during turbine installation and is therefore not presented here. However, as expected, the sensors located at the bottom of the raft experienced a negative change in strain, with the sensors located at the top experiencing a positive change in strain measuring twice the strain at the bottom, with the difference suggesting the influence of the supporting soil below the raft. Additionally, the bottom and top of the raft experienced ‘tensile’ and ‘compressive’ strains, respectively, indicating that the raft acts as a beam, with the applied load causing a bending moment in the concrete section. The largest strain changes after installation seemed to be due to day–night temperature variation, resulting in thermally induced mechanical strain changes in the concrete section, as the bottom and top of the raft did not experience the same temperature change.
The corresponding axial force (F p ) and bending moment (M p ) in Pile 54 P were plotted for the period of turbine installation (see Figure 9(a) and (b)) and represent the actual forces and bending moments in the pile at that time. Using the same equations for determining the axial forces and bending moments in the wind turbine tower from the measured strains (see Equations (4) and (5)), the axial force and bending moment in Pile 54 P presented in the preceding article could also be determined using the measured Young’s modulus and sectional properties of the pile. Similar to the strains, an increase in the compressive force in Pile 54 P was observed during turbine installation (see Figure 9(a)). Although designed as end-bearing piles, the change in force in the pile towards the top (at 0.5 m) proved the highest, followed by the change in force at 2.5 and 4.5 m. This indicates the influence of shaft friction between the outside surface of the pile and the surrounding soil. Before turbine installation, a built-in bending moment was present within the pile, as can be seen in Figure 9(b), potentially caused by the shrinkage of the raft after casting. 47 The largest bending moment was measured at 2.5 m, followed by the bending moment at 0.5 m, having a slightly smaller magnitude but opposite sign (change in the direction of the bending moment). Bending moments with depth differed in sign, indicating the influence of soil confinement. Turbine installation also seemed to have little effect on the bending moment in Pile 54 P. Thus, the assumption regarding the change in strain in the piles being nearly entirely axial during turbine installation due to the rigidity of the raft seems valid. It should, however, be mentioned that, although strain readings in the piles indicated that bending moments developed before the installation of the turbine, the magnitude of these values would be affected by the unintended rotational position of the gauges.
Pile 54 P response: (a) axial force and (b) bending moment.
Commercial operation after commissioning
The data recorded during commercial operation presented in this article only considers the first year since the commissioning of the wind turbine, which will be referred to as the initial operating phase. Although it does not seem like a long time, given the significant number of wind-induced load cycles turbines are exposed to over their lifespan, valuable trends could be observed from the large number of load cycles already imposed on the turbine and supporting foundation during the first year.
Wind data
Figure 10 indicates the wind speed information obtained from the weather station located on top of the nacelle for the instrumented foundation tower as supplied by the wind turbine manufacturer, with measurements taken every ten minutes. The data span just over a year, from when the wind turbine became operational in June 2021. The average wind speed was calculated to be about 30.3 km/h with a standard deviation of 14.3 km/h. The 95th percentile was calculated as 55.8 km/h, with the highest wind speed measured as 97.2 km/h. Wind speeds seem fairly consistent over the year, with seasonal variations between summer and winter months being insignificant.
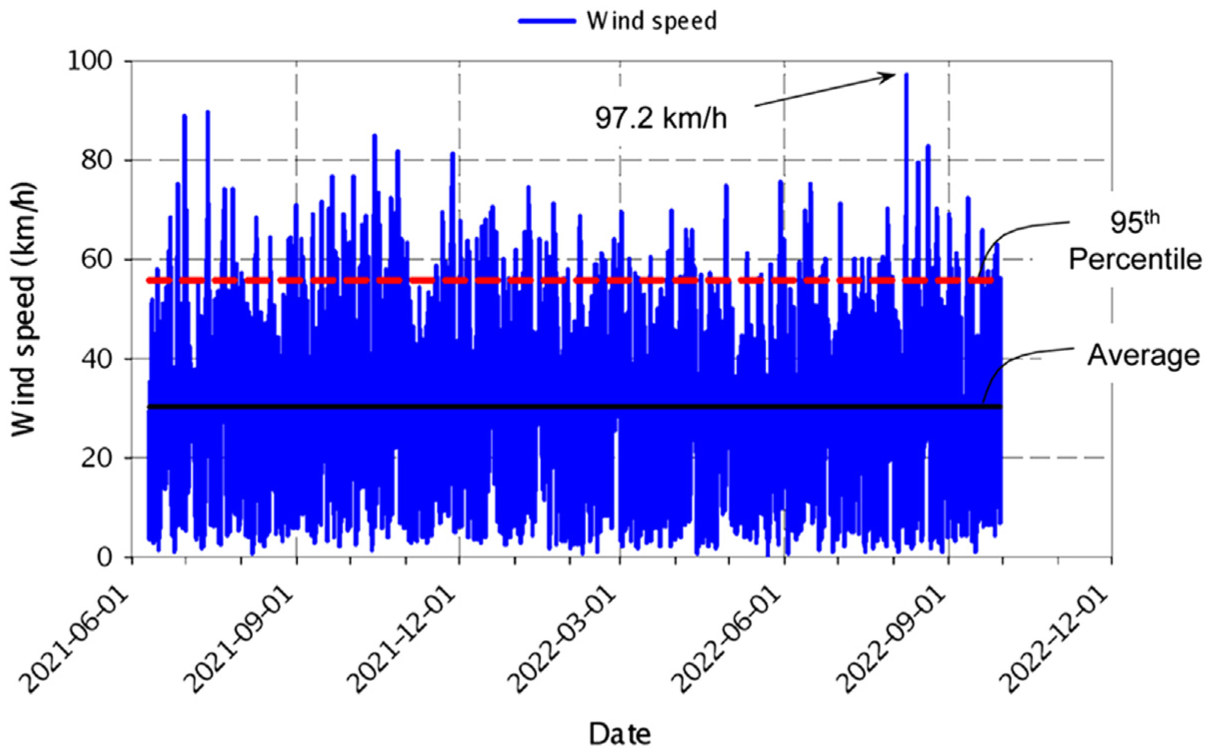
Wind speed information.
To analyse the response of the wind turbine foundation due to different wind speeds, the direction of the wind is important. Figure 11(a) and (b) indicates rose charts of the wind speed data plotted in Figure 10, sorted into the different wind directions. Figure 11(a) presents the frequency of the different wind speeds according to different directions, with Figure 11(b) indicating the corresponding average wind speeds in each of these directions. Contrary to the initial design assumption that the wind is dominantly blowing from the south-westerly direction, the data indicate the wind mainly blew from the westerly and easterly directions. Similar to the average wind speed calculated from all the provided data, the wind speed in most directions averaged about 30 km/h.
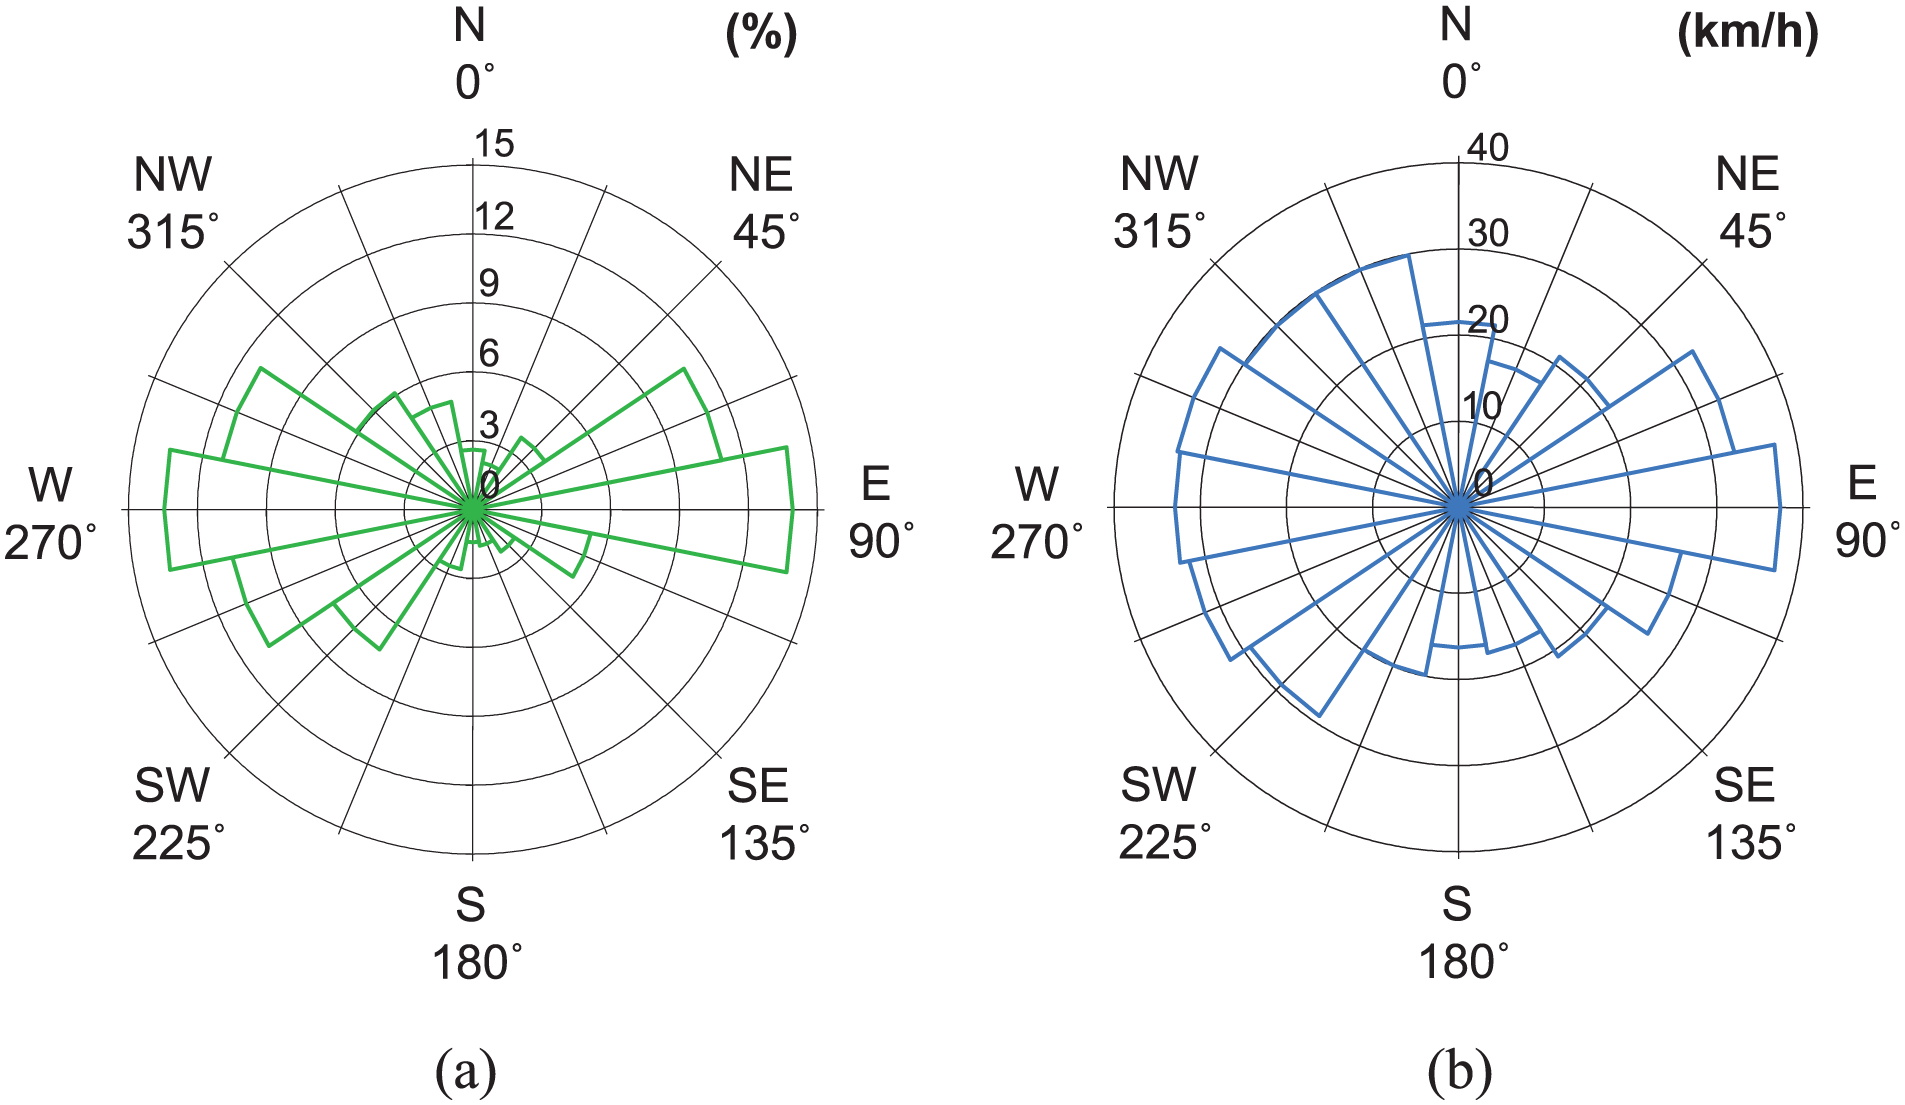
Wind data per direction: (a) frequency and (b) average wind speed.
Commercial operation
Figure 12 indicates the measured bending moment (M t ) at the base of the turbine tower since the start of operations at the beginning of June 2021 for the WBSG pair in the assumed prevailing wind direction (54–234 W). The expected theoretical SLS bending moment envelope is also indicated in Figure 12, based on the average values calculated from the data presented by Cools, 61 with the measured operational data falling within this range. The envelope of ±66.4 MNm is based on information obtained for a typical tower with a hub height of 117 m and a rotor diameter of 126 m. The measured data agree well with what was expected under service loads. The smaller bending moments measured at the tower’s base from end-September 2021 to mid-October 2021 were due to the tower undergoing maintenance (not operational), with the wind acting on the tower and stationary blades.
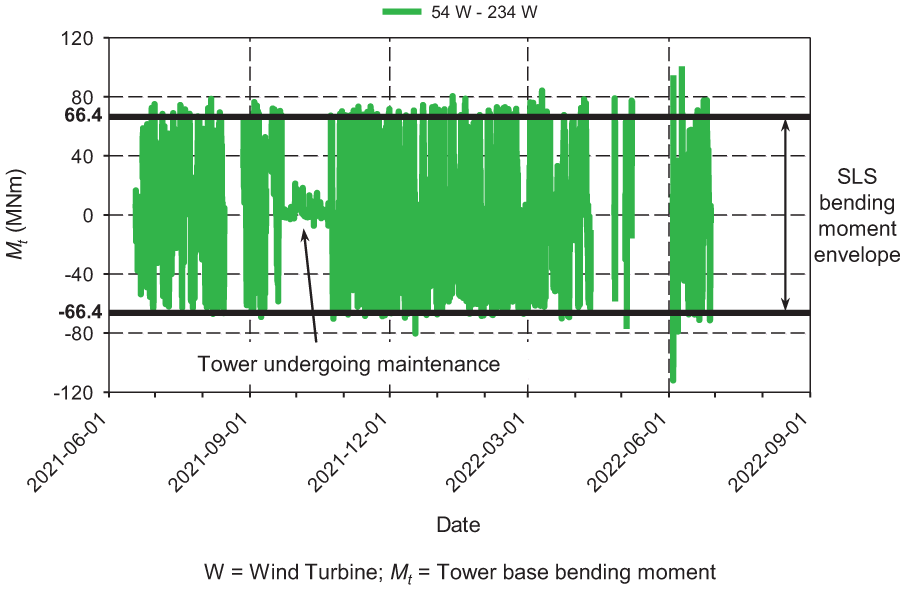
Bending moment response at the bottom of the turbine tower.
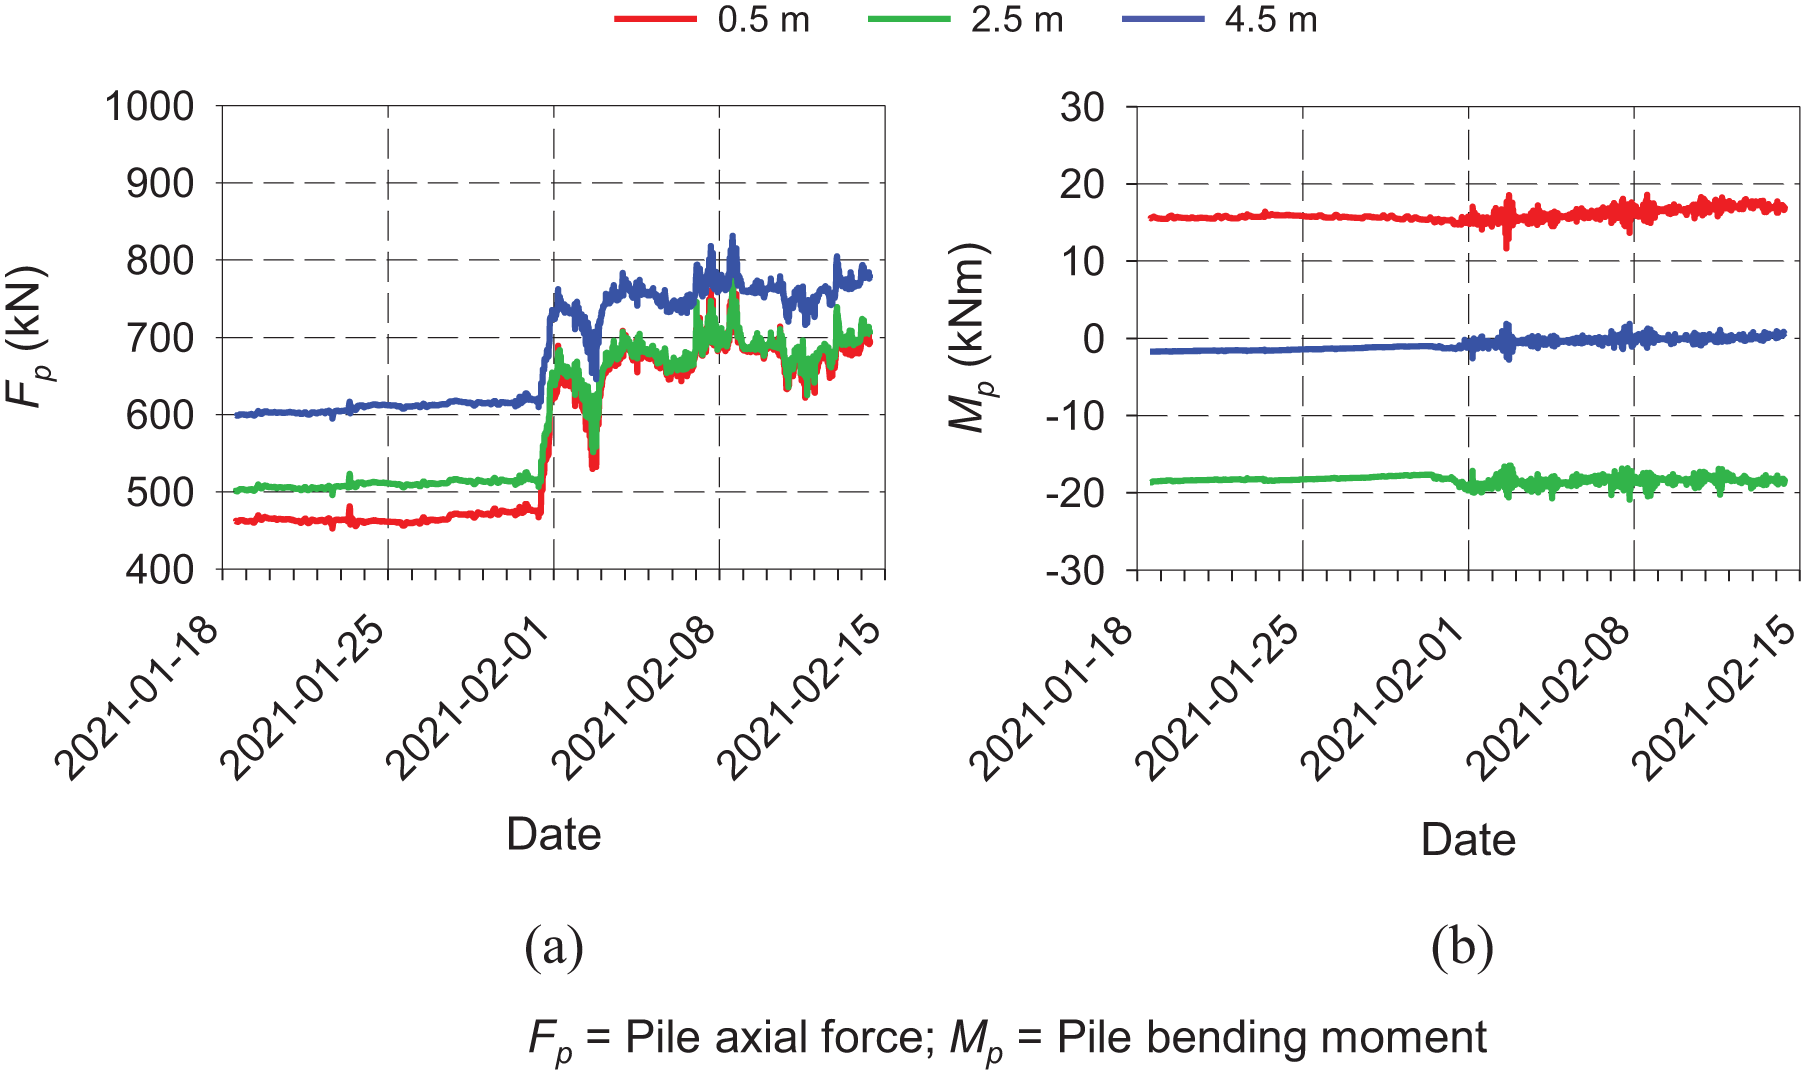
Figure 13 indicates the relationship between wind-induced bending moments in the turbine tower and the response of the underlying foundation for 11 days in June 2022. In Figure 13, (a) represents the wind speed and wind direction plotted on separate axes, (b) the bending moment at the tower’s base (M t ), (c) the radial mechanical strain measured at the bottom of the raft and (d) the radial mechanical strain in the top of the raft. In addition, (e) and (f) present the mechanical strain at three depths for two piles (54 P and 198 P).
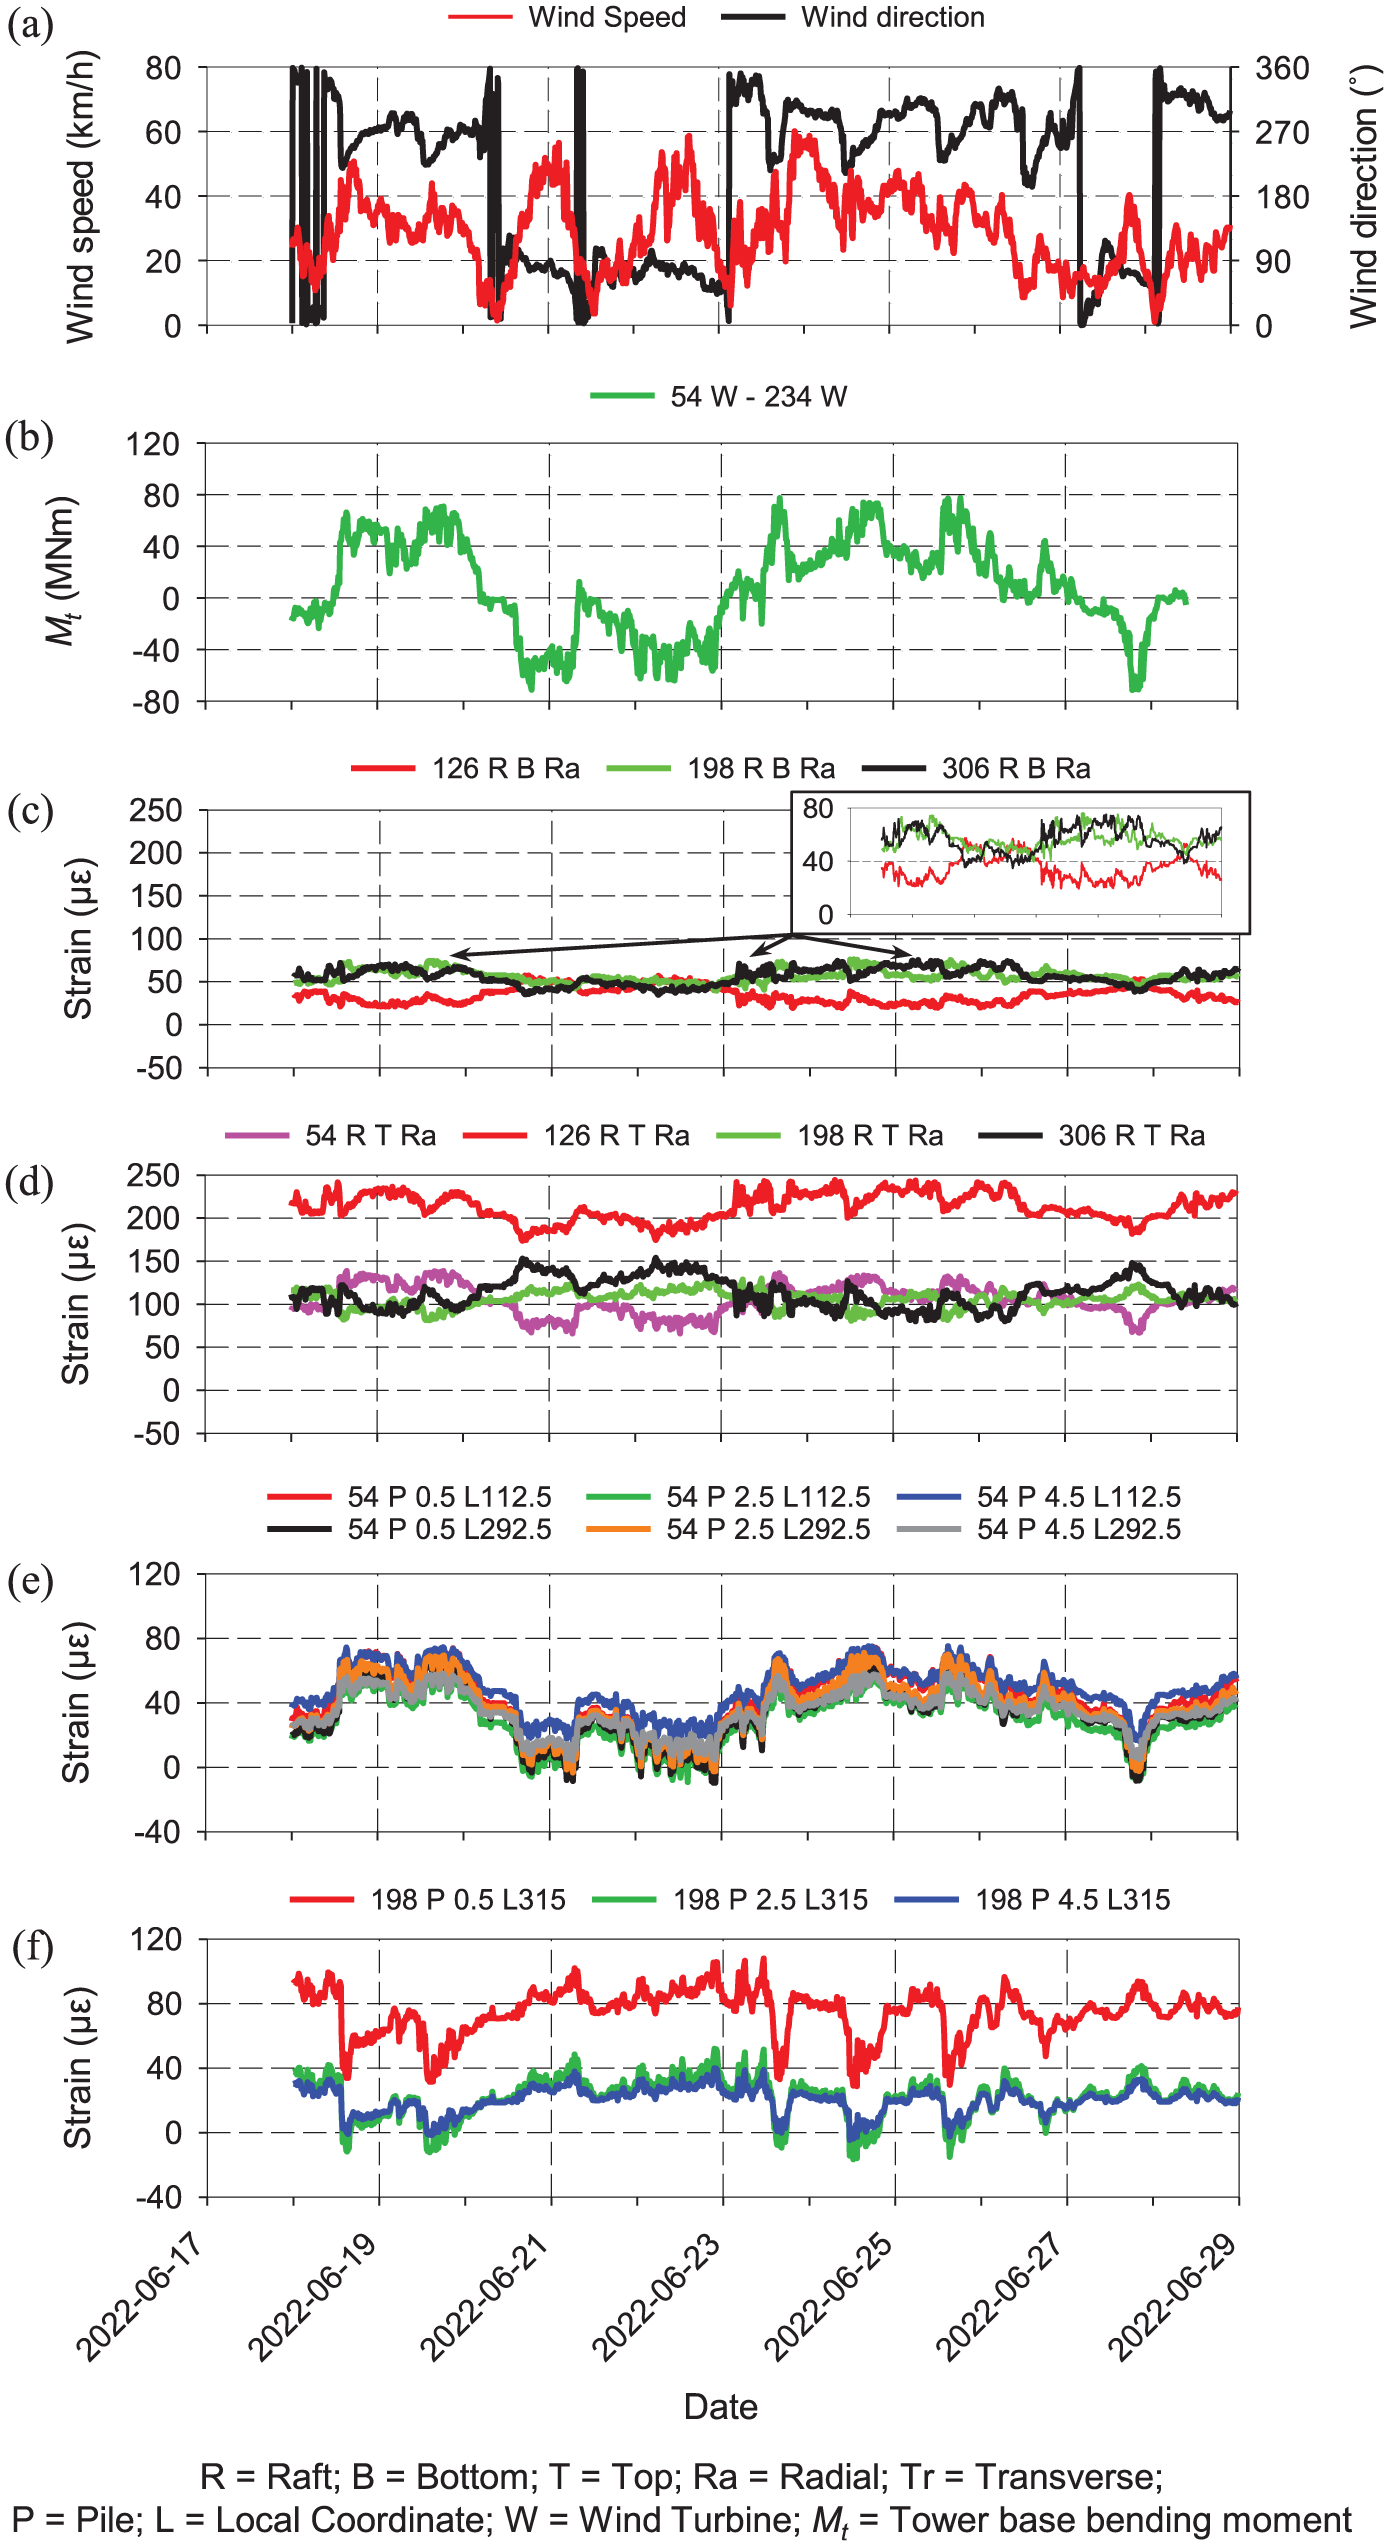
Operational response: (a) wind speed and wind direction, (b) tower base bending moment, (c) bottom raft radial strain, (d) top raft radial strain, (e) Pile 54 P stain and(f) Pile 198 P strain – June 2022.
The influence of the wind was also noticed from the radial strains at the bottom and top of the raft in Figure 13(c) and (d). Depending on the direction of the wind, an increase or a decrease in compressive strain was observed between gauges. VWSGs on opposite sides of the raft tend to respond inversely. For example, when the wind was blowing from the 234° direction or nearby, top strains on the opposite end of the raft (54°) increased, becoming more compressive, whereas top strains on the same end (234°) decreased, becoming less compressive. These trends followed what Yilmaz et al. 10 observed from the pressure sensors below the raft foundation they instrumented. Additionally, bottom strains showed a similar trend. Changes in the strain at the top and bottom of the raft being opposite in direction indicate an increase in bending moment within the raft section as the wind blows, with larger strain changes occurring when the applied bending moment and wind speed are larger. Bending moments at ends opposite from the wind direction (leeward) tend to start ‘sagging’ more, and bending moments on the wind direction end (windward) will tend to start ‘hogging’ more.
Piles located on the leeward end of the raft (see Figure 13(e)) experienced an increase in compressive strain, given that the wind originated from the 234° direction. On the contrary, the piles on the windward end of the raft experienced a decrease in compressive strain (see Figure 13(f)). This shows the expected push-pull effect of the piles under bending when a rigid raft connects the piles (see Figure 3(c)), as hypothesised by Fleming et al. 62 Larger changes in the compressive strain in the piles were also linked to larger bending moments at the tower’s base. Opposite responses in the raft and piles were observed when the direction of the wind changed, blowing, for example, from the 54° direction or nearby.
Figure 14(a) and (b) presents the actual axial force and bending moments in Pile 54 P for June 2021 and June 2022, including all activities since foundation construction. The push-pull effect is reasonably noticeable when considering the axial forces in the piles under loading, with more significant changes in the axial force occurring when the applied bending moment at the tower’s base was higher (when the wind blew in the 54° or 234° directions).
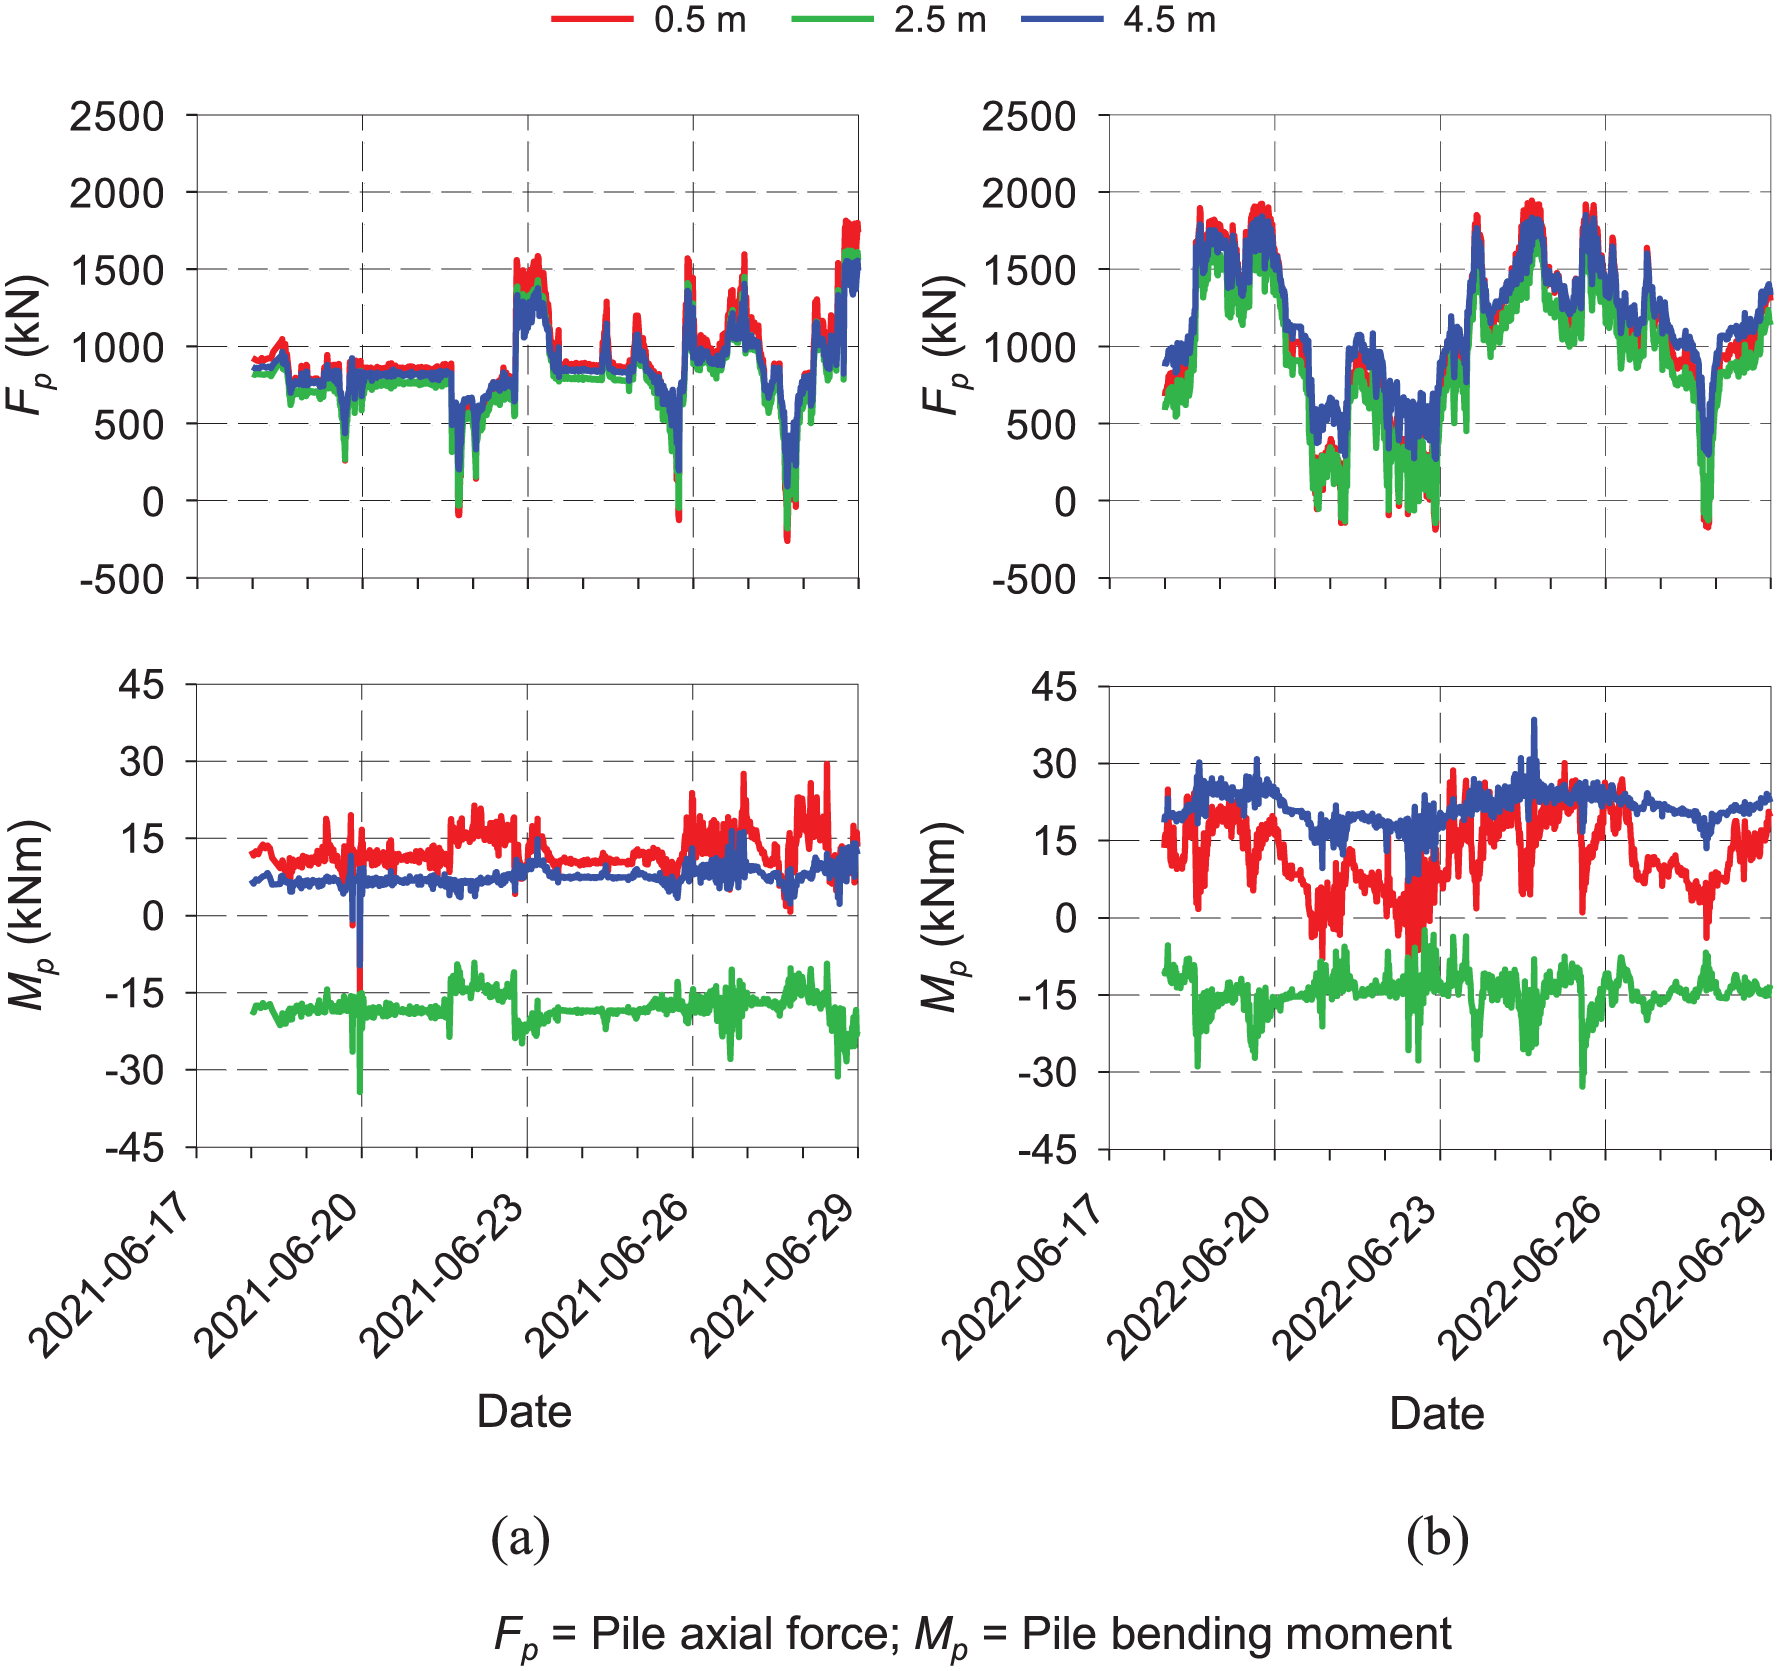
Pile 54 P F p and M p response: (a) June 2021 and (b) June 2022.
Similar to the responses observed during turbine installation, the effect of shaft friction between the piles’ outer surface and the surrounding soil could be observed. The VWSGs towards the top of the pile at 0.5 m experienced the highest increase or decrease in axial force under loading, followed by the sensors at 2.5 and 4.5 m. Although changes in bending moments at different depths in the pile were observed during loading, axial changes seem to be more significant and can be considered the governing response, especially given the rigidity of the raft. The most significant changes in the bending moments were experienced towards the top of the pile (at 0.5 m). The change in bending moment increased when the corresponding axial force was higher due to the larger externally applied bending moment, with bending moments at a depth of 2.5 m, again, acting in the opposite direction.
To investigate whether a relationship exists between the externally applied bending moment at the tower’s base and the change in axial force in Pile 54 P, Figure 15 was plotted. Figure 15(a) and (b) indicate the change in mechanical strain (Δμε) and change in axial force (ΔF p ) in Pile 54 P against the bending moment (M t ) at the tower’s base for June 2021 and June 2022, respectively. A good correlation between the applied tower bending moment and the change in strain and axial forces was observed during both months. Larger positive tower bending moments resulted in larger changes in the compressive strain and axial force in Pile 54 P, with the opposite being true when the direction of the bending moment changed. Considering the slopes of the linear regression lines fitted to the strain and axial force graphs, the largest change occurred towards the top of the pile, gradually decreasing downwards, indicating the influence of shaft friction between the pile surface and the surrounding soil. When the wind was blowing from the opposite direction, an inverse response of the pile was observed.
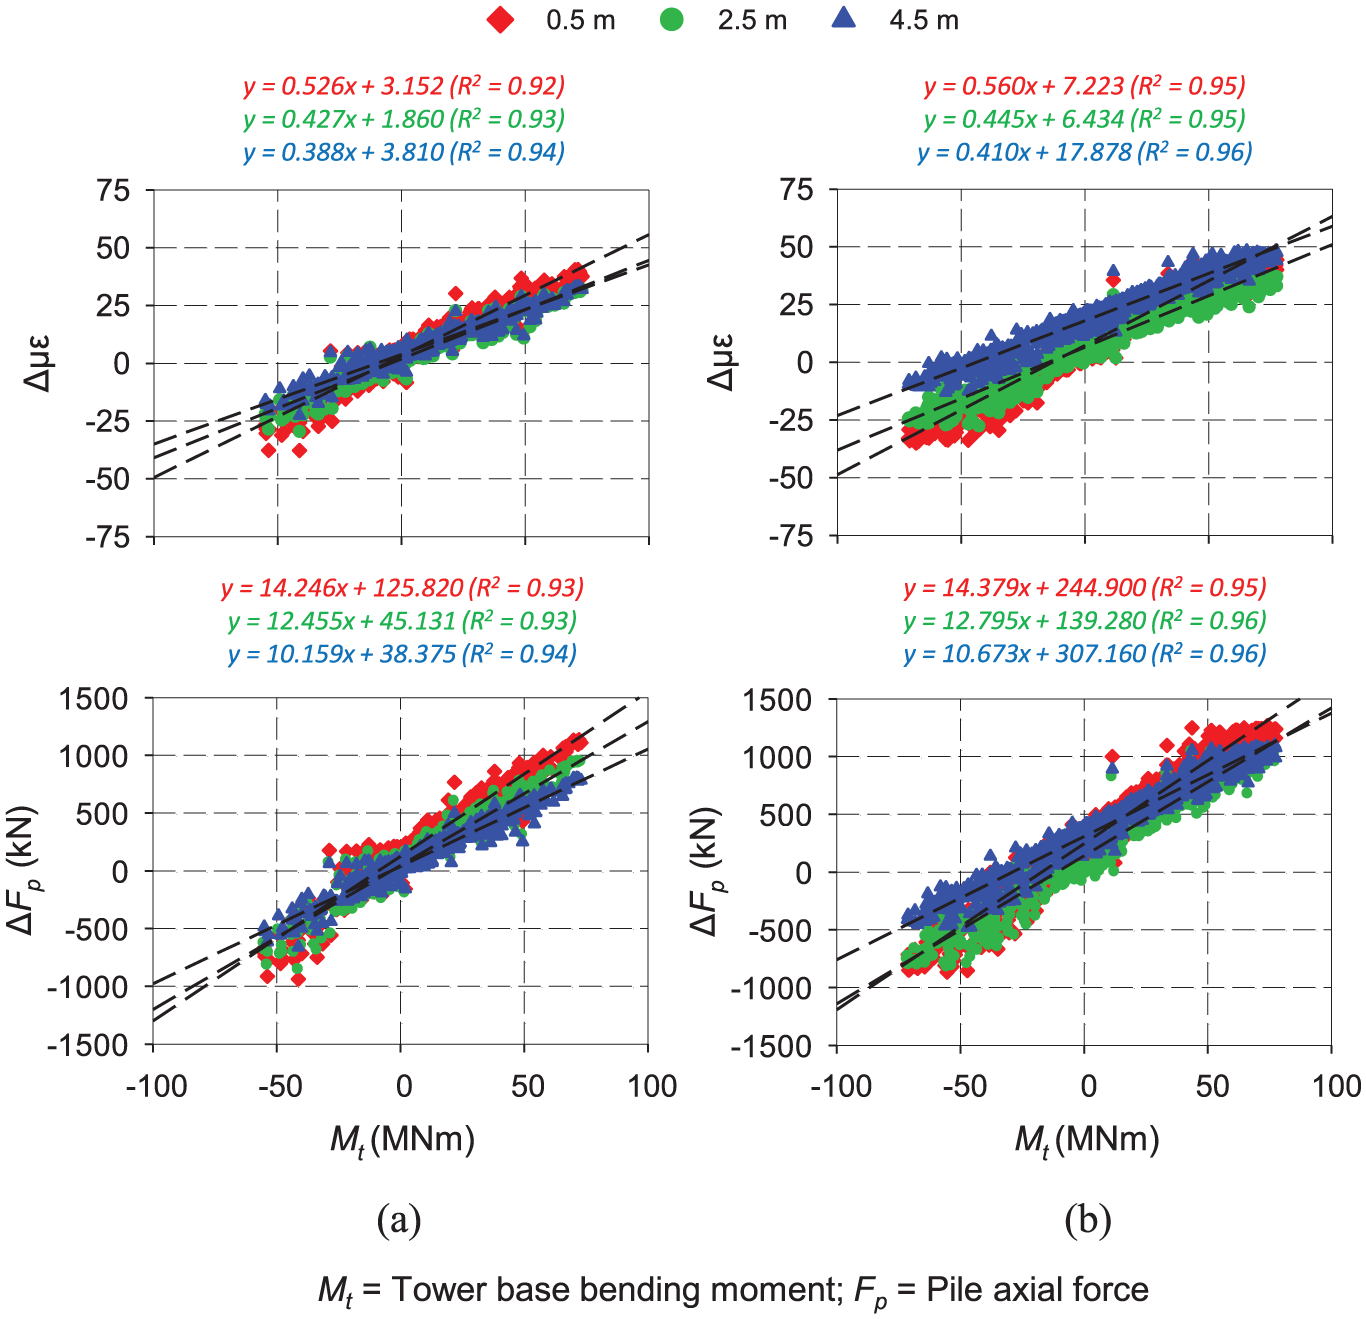
M t versus Δμε, ΔF p : (a) June 2021 and (b) June 2022.
Wind load effects on foundation response
Although the wind turbine operational results considered in this article only summarise the first year after commissioning, some wind load effects were observed from the measured data. As the cut-in wind speed of the wind turbine is 10 km/h, electricity will only start to be generated by the turbine above this wind speed, when the blades start to rotate. At speeds less than 10 km/h, limited bending moments are expected at the tower’s base. Thus, to investigate whether the cyclically induced wind loads acting on the foundation over time affected the percentage of the total vertical turbine load carried by the piles (F p /F t ), strain measurements in the piles were extracted on the days when the measured wind speeds were less than 5 km/h. In this calculation, it was assumed that the concrete creep effect would be negligible as the long-term stresses in the piles were calculated to be only about 2% of the compressive strength of the piles.63,64
As indicated in Figure 16 and mentioned in ‘Wind turbine installation before commercial operation’ section, the piles carried approximately 35% of the total vertical turbine self-weight after installation. However, upon initial cyclic loading in June 2021 (0.4 years since installation), the percentage seemed to have increased to about 50%. After an additional year, the percentage carried by the piles increases even further, suggesting a convergence to about 60%. This convergence justifies the argument raised in the literature based on the works of Johnson 14 and Werkmeister et al. 15 that the induced cyclic nature of the load causes permanent deformation in the soil. The soil below the raft becomes resilient after a post-compaction period, with the piles carrying higher loads as the raft is effectively ‘bridging’ this gap. Future geotechnical testing should be conducted to confirm this interpretation of the soil-structure interaction over time.
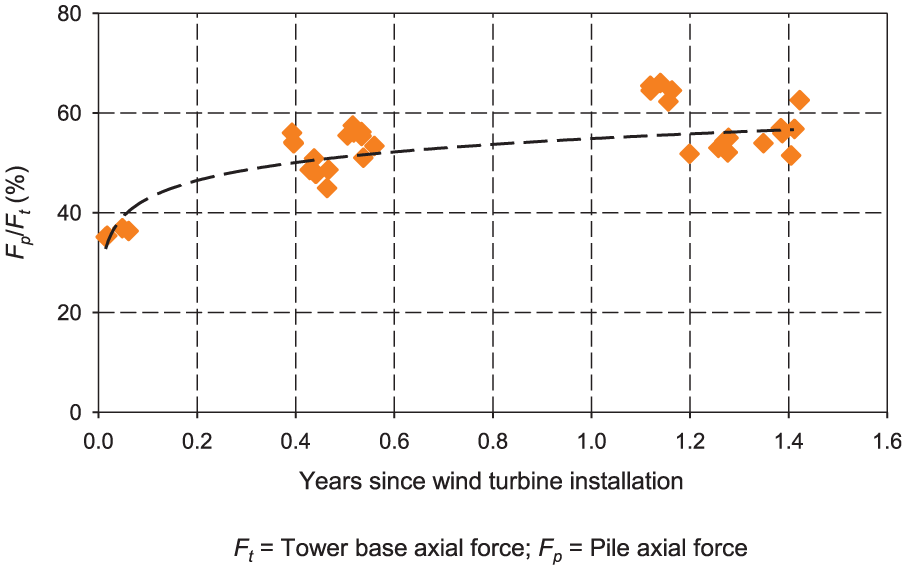
Percentage of total vertical wind turbine self-weight carried by the piles with time.
As seen in Figure 14(a) and (b), an increase in the overall average bending moment in Pile 54 P at a depth of 4.5 m was observed over the 1-year investigative period from 2021 to 2022. Compared to the average bending moment measured in the pile before and after turbine installation (see Figure 9(b)), the measured data indicate the possible influence of cyclic wind loading on the built-in permanent bending moments in piles. These bending moments are typically left in a pile after load removal, as Kirkwood and Haigh 29 indicated, and can be attributed to the repetitive loading of piles, resulting in soil particle re-orientation around the pile, causing locked-in soil stresses as the number of load cycles increases. Similar to calculating the bending moments in the piles previously, the permanent bending moments in Pile 54 P were plotted from the strains for the days when wind speeds were low (<5 km/h) and the external bending moments at the tower’s base were small. Figure 17 indicates the measured permanent bending moment (Mp,per) since the turbine was installed. As mentioned in ‘Wind turbine installation before commercial operation’ section illustrated in Figure 9(b), raft shrinkage seemed to have caused a built-in permanent bending moment in Pile 54 P before turbine installation. A positive permanent bending moment was measured at a depth of 0.5 m before installation, and a negative permanent bending moment at 2.5 m, both similar in magnitude. As the number of wind cycles increased over the initial operating phase, the largest increase in bending moment seemed to occur at a depth of 4.5 m, with the absolute bending moments at a depth of 0.5 and 2.5 m slightly reducing. This shift in increased permanent bending moment at deeper depths justifies the response originally observed by Kirkwood and Haigh 29 and later by Truong et al., 30 and complements the argument that piles tend to start working harder as the number of load cycles increases, with the raft gradually doing less. Additionally, strain measurements in the bottom and top of the raft when the wind speeds were low (<10 km/h) seemed unaffected by time, with no noticeable increase or decrease observed since wind turbine installation. A more extended measurement period would be required to conclude whether the strains in the raft are affected by time and the number of wind-induced load cycles.
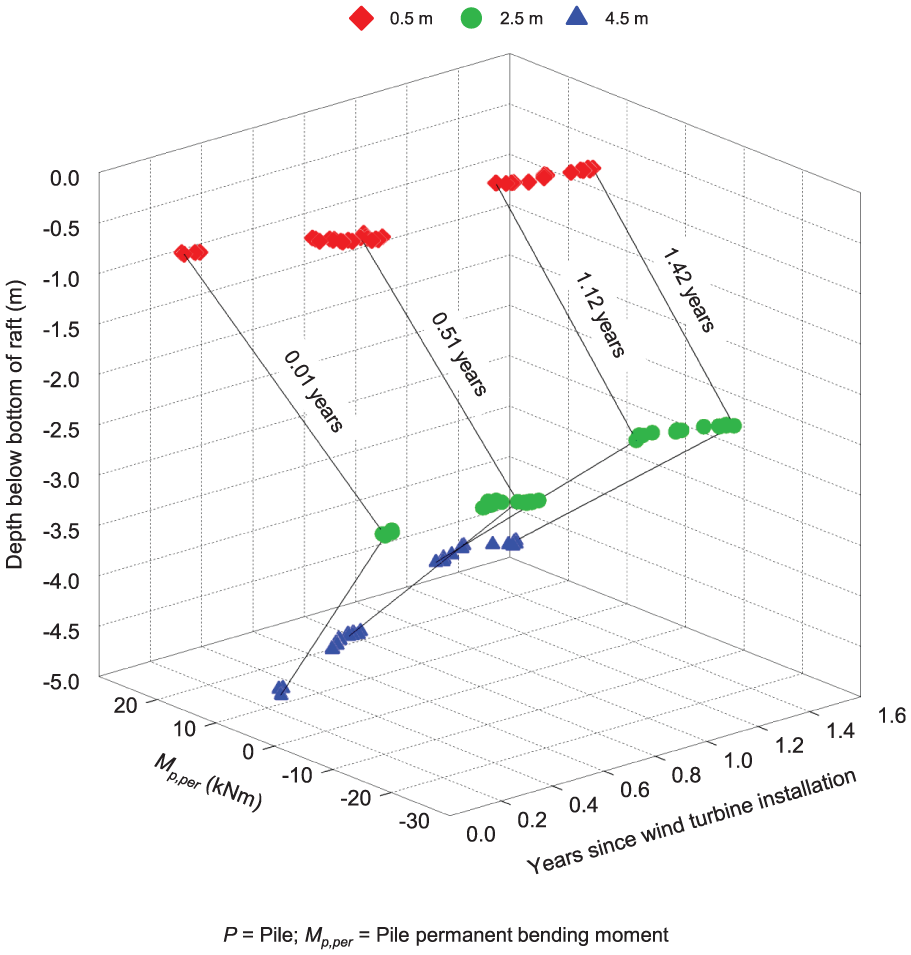
Permanent bending moment in Pile 54 P with time.
Even though thermal strains in the foundation were not initially thought to be significant given that the foundation is buried below the soil surface, seasonal variations were observed from the strain measured in the raft (see Figure 6(a)). No significant effect was observed from the strains measured in the piles deeper below the soil surface (see Figure 6(b)). To determine what influence these seasonal changes had on the raft, temperature and thermal strain data were extracted and plotted. Figure 18(a) and (b) indicates the temperature and corresponding thermal strain at the bottom of the raft, respectively, whereas Figure 18(c) and (d) indicates the temperature and thermal strain at the top of the raft. The presented values are only for the radial VWSGs, with data extending from the end of January 2021, before the turbine was installed, to June 2022, when the turbine was already operational for about a year. During the seasonal changes from winter to summer, the bottom of the raft experienced a temperature increase of about 5°C. This resulted in a thermally induced strain change at the bottom of the raft of about 40 με. Additionally, at the top of the raft, closer to the soil surface, temperature changes (ΔT) of about 8°C were recorded, resulting in a thermally induced strain change of roughly 60 με. These changes at both the top and bottom of the raft are significant and exceed the strains mechanically induced on the raft during operations caused by the wind. Furthermore, with the thermal strain at the bottom and top of the raft not being equal, a temperature (thermal) gradient exists within the raft section, resulting in thermally induced mechanical strains.
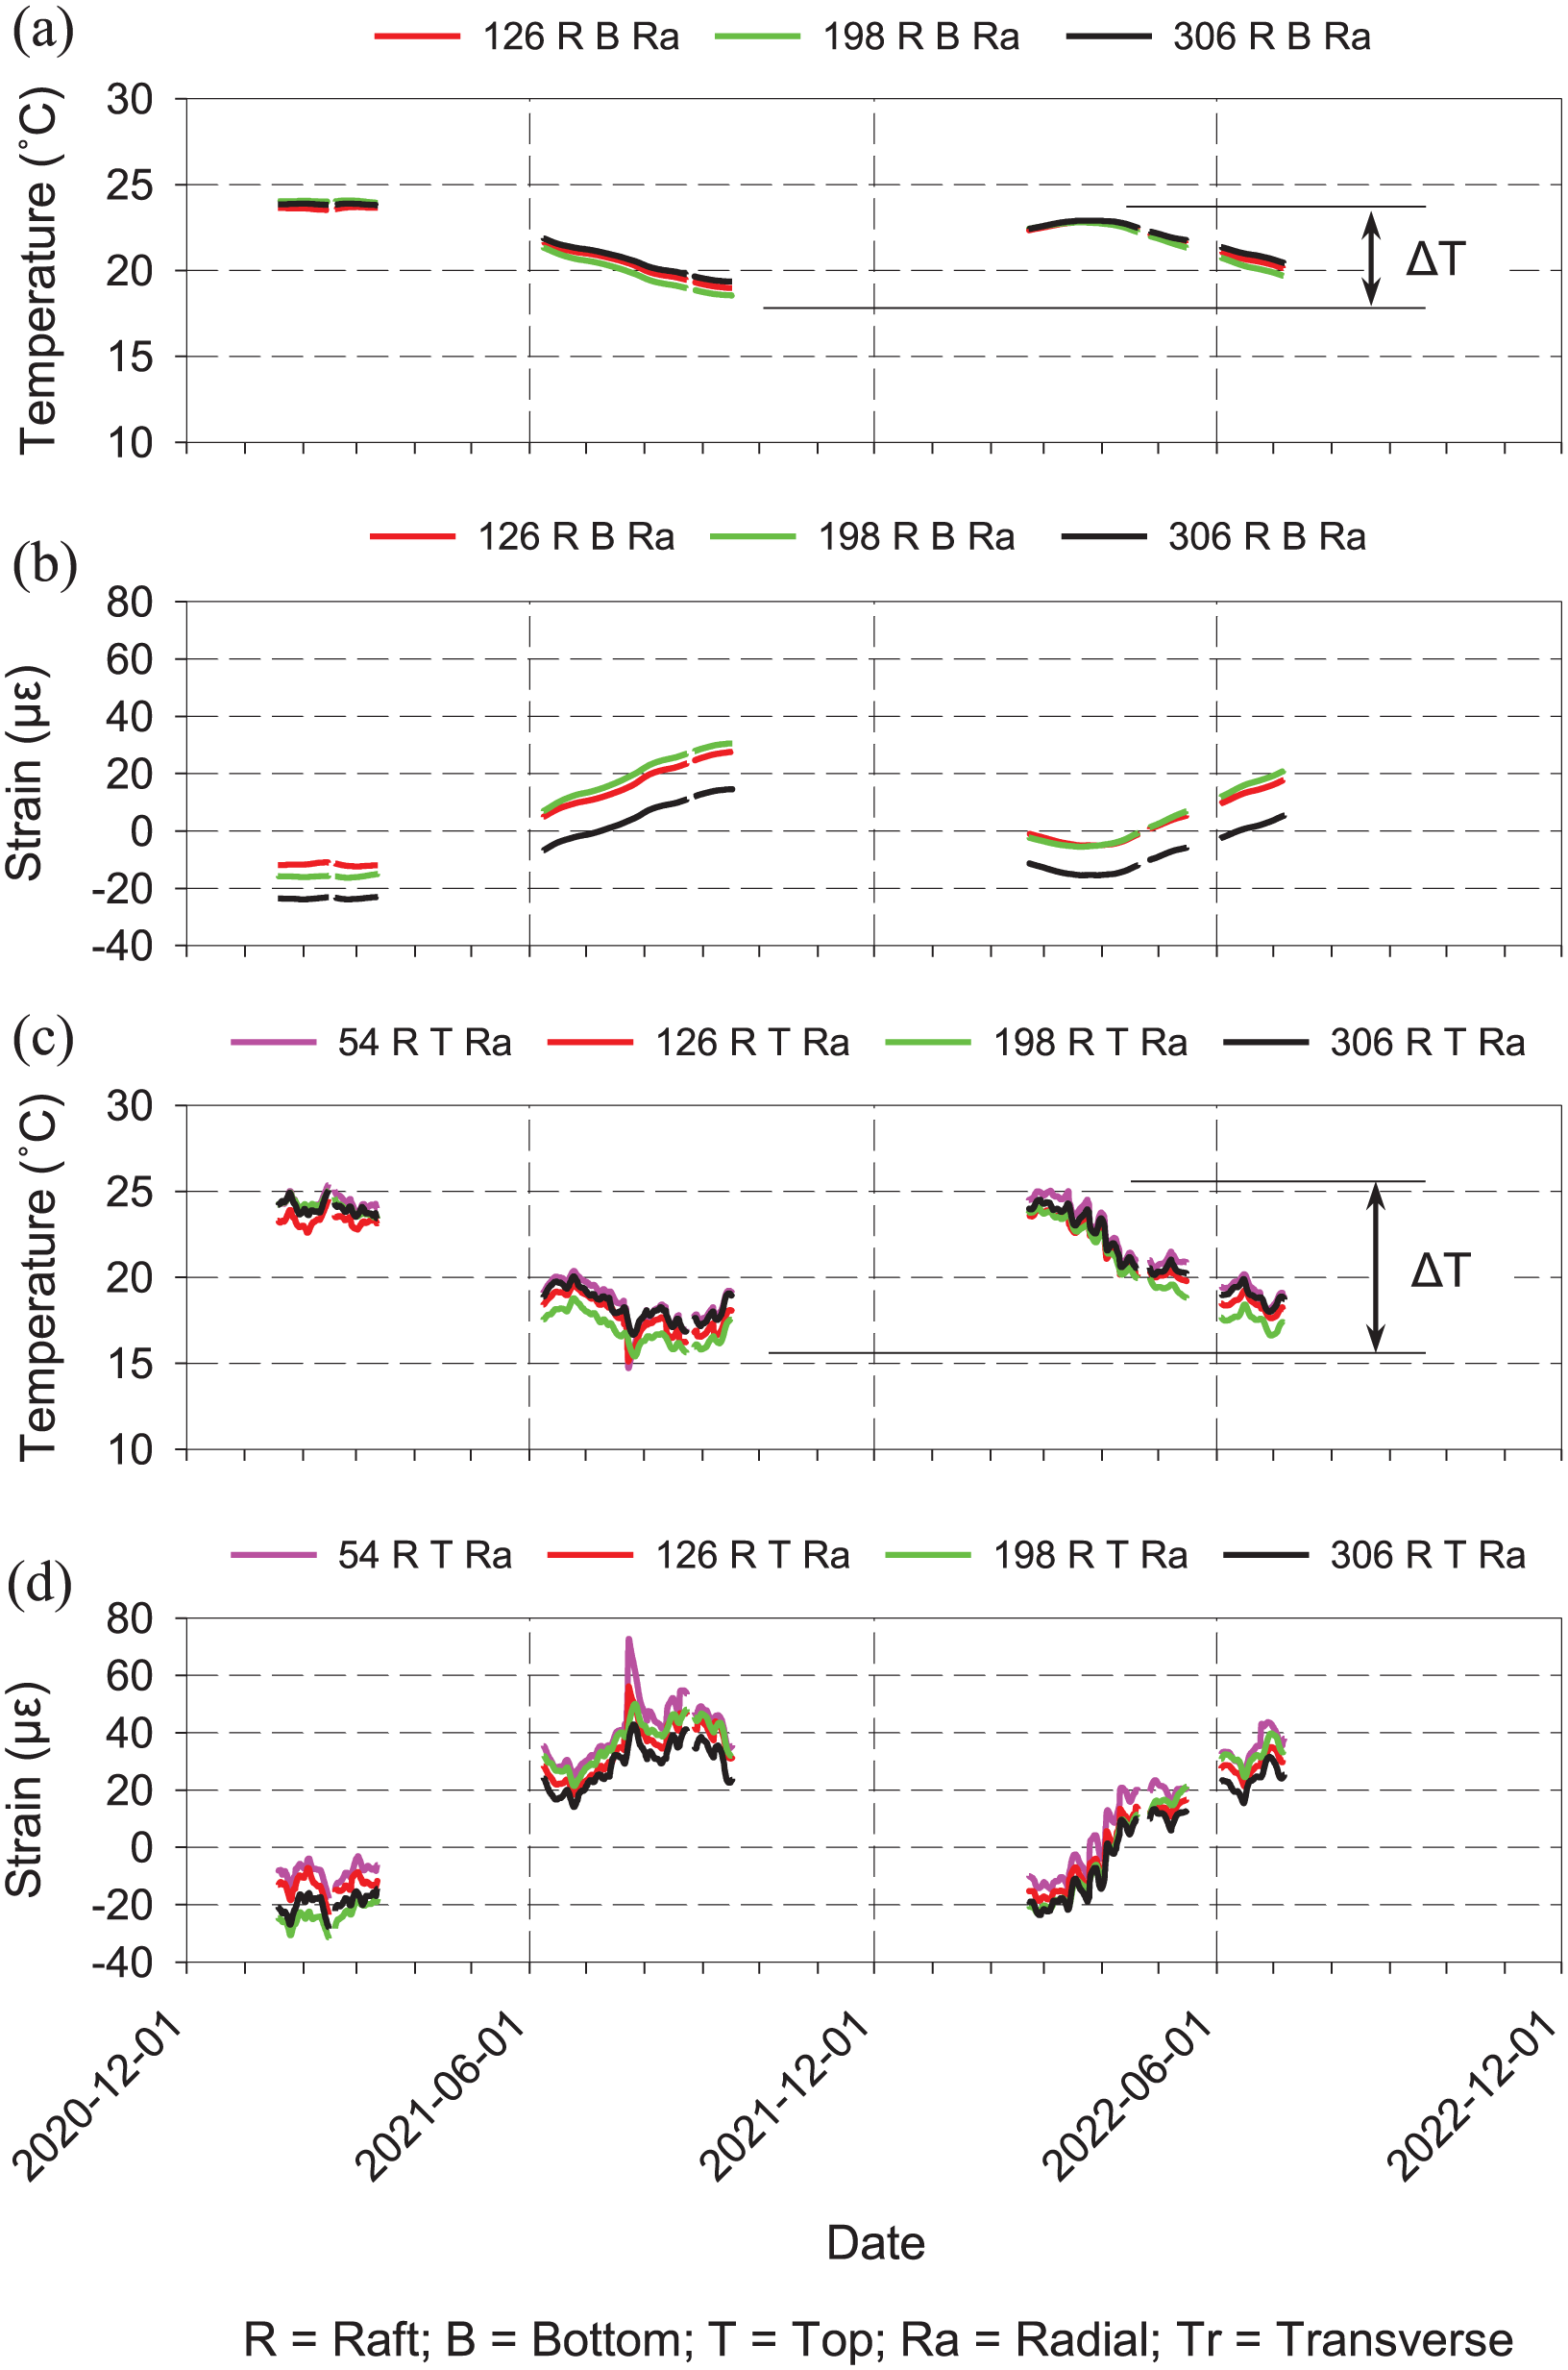
Seasonal effects of raft response: (a) bottom raft temperature, (b) bottom raft thermal strain, (c) top raft temperature and (d) top raft thermal strain.
Based on the Young’s modulus and the splitting tensile strength values of the raft presented in Table 2, the cracking strain of the raft concrete can be estimated using Hooke’s Law (ε = σ/E), yielding a value of roughly 114 µε. Accordingly, the observed thermal gradient of 20 µε corresponds to about 18% of the cracking strain, assuming the raft remains unrestrained. Thus, when considered together with the increasing mechanically induced strain changes from cyclic wind loading, this suggests an elevated risk of long-term cracking and associated durability concerns. However, a longer monitoring period would be required to verify observations and assess the long-term foundation response.
Conclusions
Wind turbine foundations are characterised by being exposed to large horizontal loads and overturning moments caused by the wind compared to the vertical load caused by the self-weight of the turbine. An intricate load scenario, which combined with the soil–structure interaction between the foundation and the supporting soil, required further investigation. In this article, SHM data are presented for a piled-raft foundation supporting a full-scale operational onshore wind turbine in South Africa. The actual response of the in-service foundation, with piles socketed into bedrock, was monitored for different phases in the life of the turbine, including that of turbine installation and initial turbine operations after commissioning.
Although the article did not focus on the construction of the foundation phases, the strain results presented clearly indicated that the early-age strains in the raft caused by the heat generated during concrete hydration are of the same magnitude as the maximum strains the raft experiences during operation.
The data recorded before commissioning and commercial operations, as well as before, during and after the installation of the wind turbine structure indicated that
Before turbine installation, permanent bending moments were already present in the piles, potentially caused by shrinkage of the raft during concrete curing.
Strain changes in the turbine tower and foundation piles can be used to calibrate the SHM system, and can also be used to determine the fraction of the tower’s own weight that is carried by the raft versus the fraction carried by the piles.
During turbine installation, the piles carried about 35% of the applied vertical load for the foundation size and pile layout considered, with turbine installation having little effect on the strains measured in the raft.
The data recorded during commercial operation after commissioning indicated that:
The foundation response was dominated by the dynamic horizontal load and overturning moment caused by the wind, compared to the vertical self-weight of the turbine.
Due to the rigidity of the raft, the response of the piles was characterised by a push-pull axial effect in the leeward and windward piles under the applied dynamic overturning moment.
The magnitude of the push-pull axial effects in the piles depended on the direction and speed of the wind.
The relationship between the turbine tower moment and the axial forces in the piles showed a good correlation and remained unaffected by the number of load cycles.
Wind-induced cyclic loading seemed to have no noticeable influence on the strain measured in the raft for the period of measurement.
As load cycles increased, the permanent bending moments present towards the top of the piles before turbine installation increased in magnitude, with the largest increase observed at a depth of 4.5 m. A lack of further instrumentation along the depth of the pile makes it impossible to estimate the trends at greater depths.
The position of the maximum bending moment in the piles increased in depth over time.
After 1 year of turbine operation, the piles carried about 60% of the applied vertical load, indicating that the soil below the raft settled relative to the piles, with the raft having to bridge the ‘gap’, spanning between the piles.
Often neglected, seasonal temperature variations and thermally induced strains affected the buried foundation response even more than the turbine operation.
While the data collected provide valuable insights, a greater number of sensors, placed at more critical locations and a longer monitoring period would have been beneficial to fully capture the three-dimensional load transfer mechanisms within the foundation. A denser sensor network would have allowed for a more detailed understanding of localised stress distributions and potential non-linear soil-structure response. In addition, extending the monitoring duration would have captured the long-term foundation response under varying seasonal and operational conditions, and provided a clearer picture of time-dependent effects such as potential soil creep, cyclic degradation and settlement.
Although the study was constrained by investigating only one foundation type and configuration, comparative data across different soil conditions, pile arrangements and pile embedment depths would strengthen the generalisation of the findings. Furthermore, the absence of direct comparison with alternative foundation systems, such as piled rafts not socketed into bedrock, also restricts the ability to draw broader conclusions about the relative efficiency and resilience of different designs. However, given the limited monitoring data available for these foundations in literature, and wind turbine heights and sizes set to increase in future, the results offer a foundational understanding for similar engineering projects, where foundation response is governed by horizontal loads and overturning moments.
Footnotes
Acknowledgements
The authors would like to thank Riverbank Wind Power (RF) (Pty) Ltd, EDF Renewables (Pty) Ltd (South Africa) and Vestas Southern Africa (Pty) Ltd for allowing the instrumentation of one of their wind turbine foundations for this research.
Declaration of conflicting interests
The authors declared no potential conflicts of interest with respect to the research, authorship, and/or publication of this article.
Funding
The authors disclosed receipt of the following financial support for the research, authorship, and/or publication of this article: This study was supported by the Concrete Institute and the University of Pretoria.