
Abstract
Monitoring crack growth is crucial for ensuring safety, assessing structural health, optimising maintenance strategies and advancing scientific knowledge in the field of structural engineering. It enables cost-effective asset management, proactive maintenance and the growth of innovative solutions for a safer and more sustainable built environment. In this paper, we explore various techniques to experimentally monitor the growth of surface-breaking cracks on a single edge notch Beam (SENB) specimen in four-point bending fatigue tests according to American Society for Testing and Materials (ASTM) standard E647-15. The notch was generated using electrical discharge machining (EDM). In the measurements, a 5 MHz low-cost ultrasonic array with 18 elements was permanently attached to the top surface of a structural steel (SS355) specimen. A clip gauge was installed around the EDM notch mouth to measure the crack mouth opening displacement (CMOD). Additionally, a digital camera was focused on the tip of the EDM notch to measure surface displacements using digital image correlation (DIC). During the four-point bending fatigue tests, experimental data sets were recorded from the ultrasonic array, the clip gauge and the digital camera at each loading cycle. We focused on the development of post-processing techniques for measuring crack length and CMOD using the acquired ultrasonic array datasets and the measured surface displacement and strain distributions from the DIC technique, as well as low-cost ultrasonic array design, fabrication and installation. The proposed post-processing techniques were validated by comparing the results obtained with calculations using the standard procedure in ASTM E1820 based on CMOD values acquired from clip gauge measurements. We demonstrated that both the low-cost ultrasonic array and DIC exhibit reasonable and reliable performance in detecting and monitoring crack growth. The developed post-processing techniques proved effective in accurately measuring key parameters of crack growth, such as crack length and CMOD. These findings validate the feasibility and applicability of using low-cost ultrasonic arrays and the associated post-processing techniques for crack monitoring and characterisation and for supporting structural integrity assessments.
Introduction
In modern engineering practices, ensuring the safety, performance and longevity of critical components and infrastructure necessitates the reliable assessment of structural integrity and the early detection of potential defects. Structural health monitoring (SHM) is an interdisciplinary field that integrates various techniques and methods to assess the condition and performance of structures, such as buildings, bridges and infrastructure systems.1–4 The primary goal of SHM is to detect, locate and quantify potential damage or deterioration in structures, enabling timely maintenance and repair actions.5–8 SHM heavily relies on the deployment of various non-destructive testing (NDT) technologies to collect data from structures. Common sensors used include strain gauges, fibre optic sensors and ultrasound sensors.9–11
Surface-breaking cracks, particularly fatigue cracks and stress corrosion cracks, emerge as significant challenges. These defects commonly result from cyclic loading and harsh operating conditions in safety-critical infrastructure, such as rail tracks, gears, vessels and pipelines, and their capacity to propagate can severely compromise structural integrity over time. 12 The ability to monitor the initiation and growth of these cracks is crucial for preventing catastrophic failures and minimising maintenance costs.
Assessing the size and type of defects is fundamental to structural integrity analysis as reaching a critical size could lead to structural failure. 13 Non-destructive evaluation methods, including the use of surface waves14–17 and guided waves,18,19 play a key role in detecting these defects. These methods can identify defects along the wave propagation path, where the amplitude of reflected or transmitted signals may indicate defect size. Moreover, the application of ultrasonic bulk wave measurements often involves single-sided access, where a transducer or array placed on the structure’s front wall detects defects on the back wall.20–24 Utilising ultrasonic arrays for this purpose is advantageous, as a single-array transducer can illuminate a defect from various angles and capture the full matrix capture (FMC) dataset, 25 which is then processed with an imaging algorithm such as the total focusing method (TFM) 25 and its variants, 26 providing effective defect detection, localisation and classification.27–29 It is also worth mentioning that the traditional approach to ultrasonic testing, which involves handheld probes to deliver and analyse ultrasonic waves, falls short in continuous monitoring scenarios, such as fatigue tests, due to inefficiencies, cost implications and limitations in real-time data acquisition. 29 Existing cost-effective SHM solutions can provide an effective means of continuously monitoring corrosion by tracking wall thickness loss using piezoelectric sensors.30–32 However, these sensors are not capable of detecting the subtle initiation and propagation of cracks. It is also worth noting that the traditional approach to ultrasonic testing – using handheld probes to deliver and analyse ultrasonic waves – is inadequate for continuous monitoring scenarios due to inefficiencies, cost implications and limitations in real-time data acquisition.
This paper explores the utilisation of permanently installed low-cost ultrasonic arrays 33 for continuous monitoring of crack mouth opening and growth. The technique’s validation involves a comparison with the established crack length measurement methods, including digital image correlation (DIC) and calculations based on crack mouth opening displacement (CMOD), to assess its accuracy, reliability and potential advantages. This study aims to evaluate the performance of low-cost ultrasonic arrays in continuous monitoring applications, covering theoretical foundations, experimental setups, data acquisition, processing methodology and validation results, thereby offering insights into enhancing SHM approaches and integrity assessments using the measurements from permanently installed low-cost ultrasonic arrays. The experimental measurement system is described in the second section; the third section introduces the methodology used to measure the CMOD and crack length, which comprises (1) the compliance method using a clip gauge, (2) the crack length measurements from the measured stress field by the DIC technique and (3) the TFM imaging algorithm based on the FMC array data sets; the fourth section shows and compares the results; and the discussions and conclusion are finally drawn in the fifth section.
Experimental setup
Figure 1(a) shows the schematic diagram of the four-point bending test and the geometry of a single edge notch beam (SENB) specimen. The test specimen was fabricated from SS355 structural steel according to ASTM E647-15 standard with an initial electrical discharge machining (EDM) notch with a length of
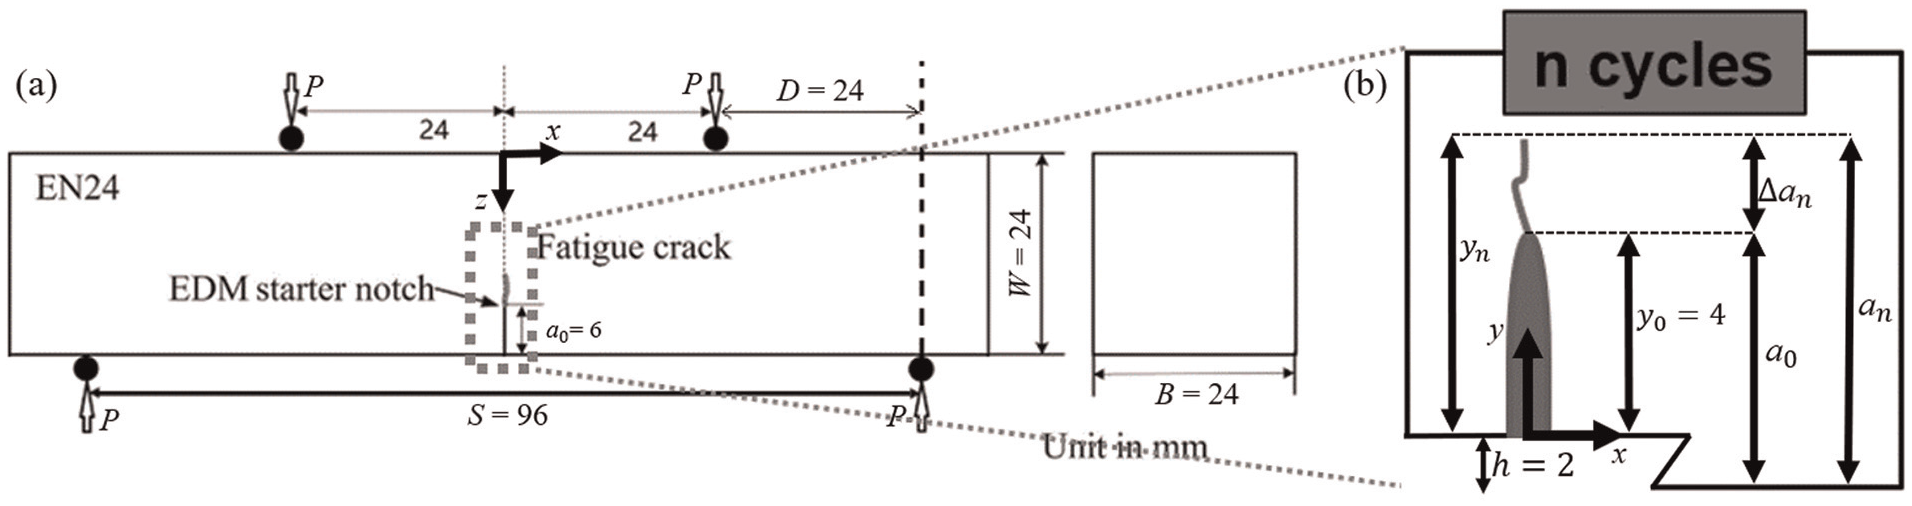
(a) The schematic diagram of a four-point bending test and the geometry of an SENB specimen and (b) crack length definitions where
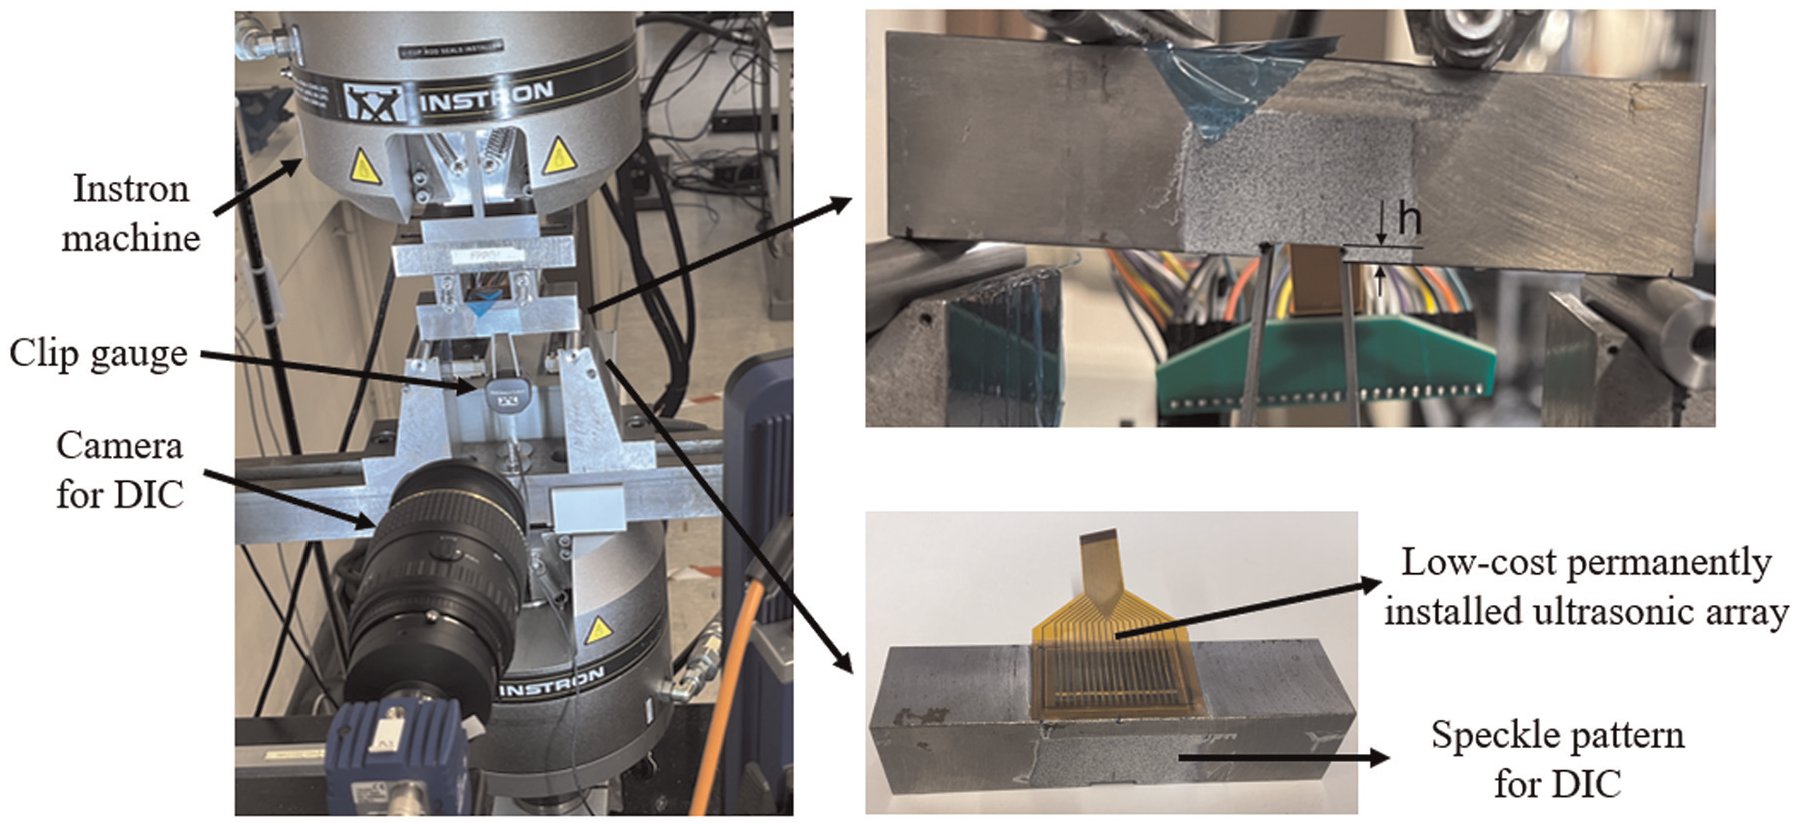
Photos of the experimental setup used to monitor crack growth on an SENB specimen under a four-point bending test.
As shown in Figure 2, the experimental setup was adapted to fit the Instron hydraulic machine (1342 100 kN, Instron Co., Buckinghamshire, UK). The SENB specimen, fabricated from SS355, is subjected to a four-point bending fatigue test, with loading applied using an Instron hydraulic machine. The low-cost ultrasonic array was permanently attached to the top surface of the specimen and was connected with a commercial array controller (Micropulse MP5PA, Peak NDT, Ltd., Derby, UK) for acquiring FMC array datasets. The captured datasets were exported and processed using MATLAB (The MathWorks, Inc., Natick, MA, USA) to measure crack length. A clip gauge was installed around the EDM cut mouth to measure the CMOD. Additionally, a digital camera is focused on the tip of the EDM cut to measure surface displacement and strain through the DIC technique. During the four-point bending fatigue tests, the SS355 SENB specimen is supported by two lower points and loaded by two upper points, creating a bending moment within the specimen. The loading was applied cyclically. This loading configuration induces cyclic stresses at the EDM-cut notch tip, which initiate and propagate the crack over time. The objective of the test is to simulate real-world conditions where cyclic loading can lead to the initiation and growth of surface-breaking cracks. The experimental datasets were recorded from the ultrasonic array, the clip gauge and the digital camera at each loading cycle.
As shown in Figure 2, there is a clip gauge holder slot in the test specimen, with a height of
The experimental setup was adapted to fit the Instron hydraulic machine (1342 100 kN, Instron Co.). The SENB specimen was subjected to a four-point bending fatigue test under load control, where minimum and maximum applied loads were
Methodology used to measure CMOD and crack length
In this section, the different methods used for monitoring crack growth are introduced and described in detail.
CMOD-based crack length estimation
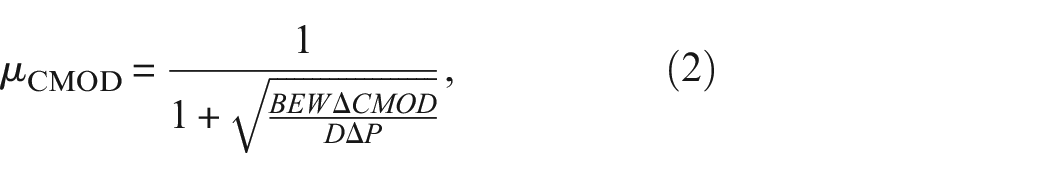
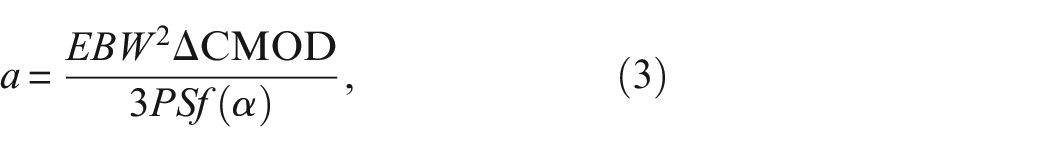
The reading on the clip gauge directly indicates the distance between the left and right ends of the clip gauge holder, which corresponds to the CMOD. From the clip gauge measurements, ASTM E1820 provides an equation to estimate the crack length,

where
where
As a way of cross-validation, the linear asymptotic superposition assumption (LASA) was also used to calculate the crack length, by 37 :
where
It is worth noting that in the compliance method, the missing material in the test specimen due to the machining of the clip gauge holder is assumed to be effectively part of the crack length, whereas the LASA method accounts for the effect of the clip gauge holder slot.
DIC-based crack length estimation
DIC allows for the characterisation of in-plane deformation and displacement fields at the surface of specimens or components. 34 It begins with the application of a unique speckle pattern on the surface, as shown in Figure 2, which is then photographed in both loaded and unloaded configurations. The unloaded configuration serves as a reference against which the subsequent images are compared. Specialised software such as StrainMaster, analyses these images, tracking the movement of the speckle pattern across the surface. This analysis enables precise calculation of displacements and strains on the surface. 34 Since the displacement field on the surface of a specimen can be directly obtained from DIC, the CMOD can theoretically inferred from the displacement field at the specimen’s bottom edge. However, accurate displacement measurements along the edges of the specimen are challenging for the DIC technique due to discontinuities in the displacement field and the difficulty of establishing an even speckle pattern in that area.
In this paper, a procedure for measuring the CMOD is proposed by using the displacements along the crack surfaces, fitting them as two straight lines and finding their intersection points with the specimen’s bottom surface. The location of the intersection point of these two straight lines indicates the position of the crack tip. The location where displacements change sign at a specific crack depth can be determined by taking the derivatives of displacement with respect to their x-coordinates (see Figure 1 for coordinate definitions). This method is termed as the crack surface measurement (CSM). The detailed procedure for this process is introduced along with experimental data in “DIC-based crack length estimations” section.
It should be noted that the surface strains on both the
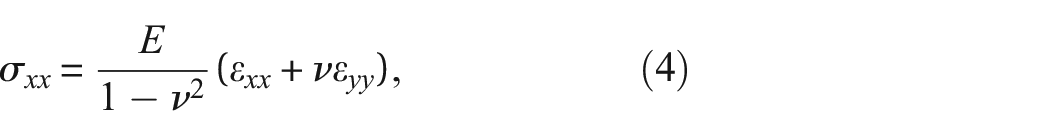
where
where
UT-based crack length estimation
A main benefit of having a permanently installed ultrasonic arrays in the experimental tests is the ability to continuously acquire FMC array datasets under consistent conditions, both in terms of position and coupling. This enables the use of subtraction techniques to identify subtle changes in the ultrasonic array datasets, which can then be utilised to detect crack growth through an imaging algorithm such as the TFM. A subtracted signal can be written as:
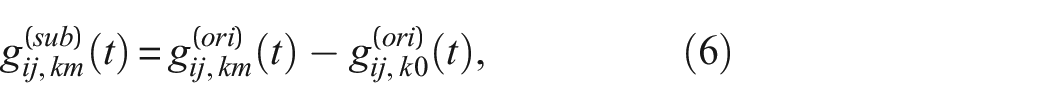
where the superscripts ‘sub’ and ‘ori’ denote the time-domain signal from subtraction and originally acquired, respectively, the subscripts
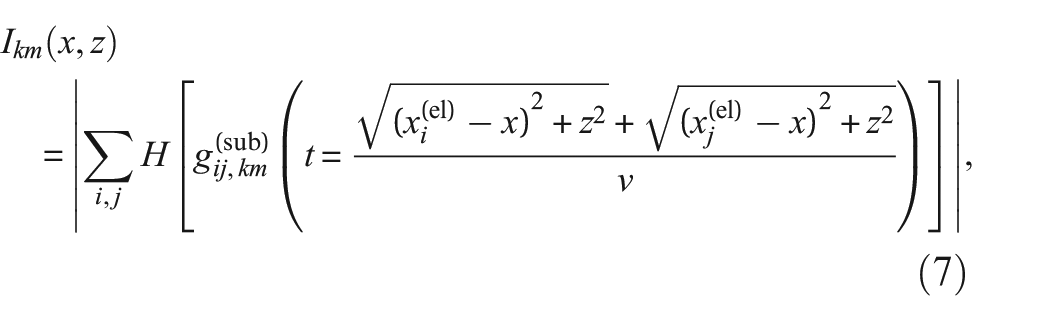
where
The crack length is estimated from subtracted TFM images by first defining the region of interest where the crack is expected, and then locating the point of maximum image intensity within that region – this is identified as the crack tip. This method is related to the ultrasound scattering behaviour from the overall crack front and differs from the DIC measurement, which provides crack information on the surfaces.
Results
From the measurements using a clip gauge
Figure 3(a) illustrates the ΔCMOD measured by the clip gauge at each load cycle. These ΔCMOD values were then used to calculate crack length using both the compliance method (Equation (1)) and the LASA method (Equation (3)), shown in Figure 3(b). As expected, both ΔCMOD and the measured crack length increase monotonically with the number of load cycles. The root mean square difference between two methods is less than 0.007 mm, indicating excellent agreement between the two approaches.
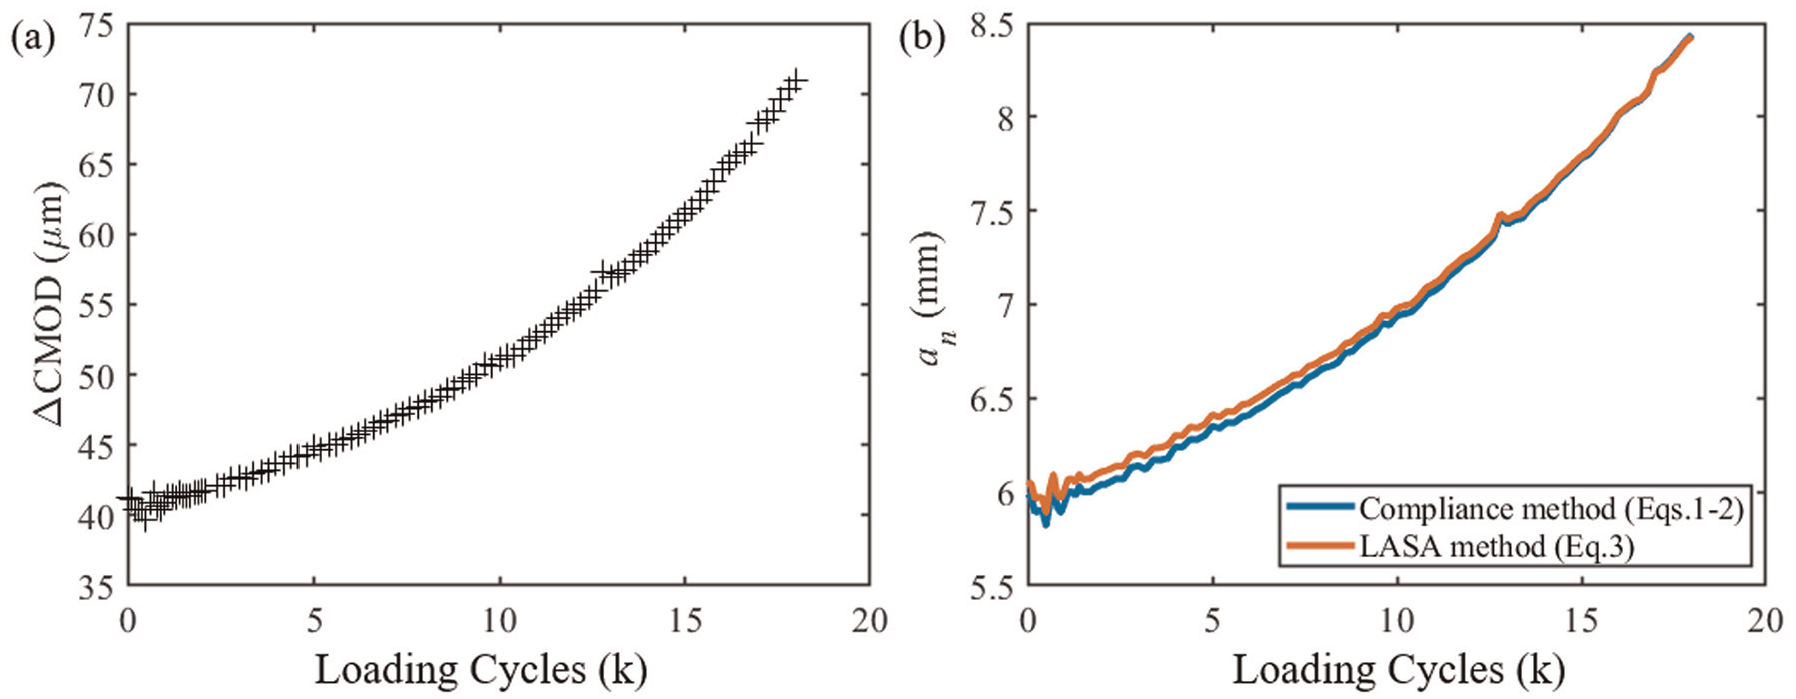
(a and b) Experimentally measured ΔCMOD and crack length at each loading cycle. In (a), the ΔCMOD was calculated from subtracting the clip gauge readings between maximum loaded (
DIC-based crack length estimations
Figures 4 and 5 compare the displacements and strains at 0 and 18,000 loading cycles for a minimum and a maximum load level of 0.5 and 40 kN, respectively. From Figures 4 and 5, the crack surface can be identified as the locations with discontinuous displacement fields or ‘jumps’, that is, white region between the blue and red zones.
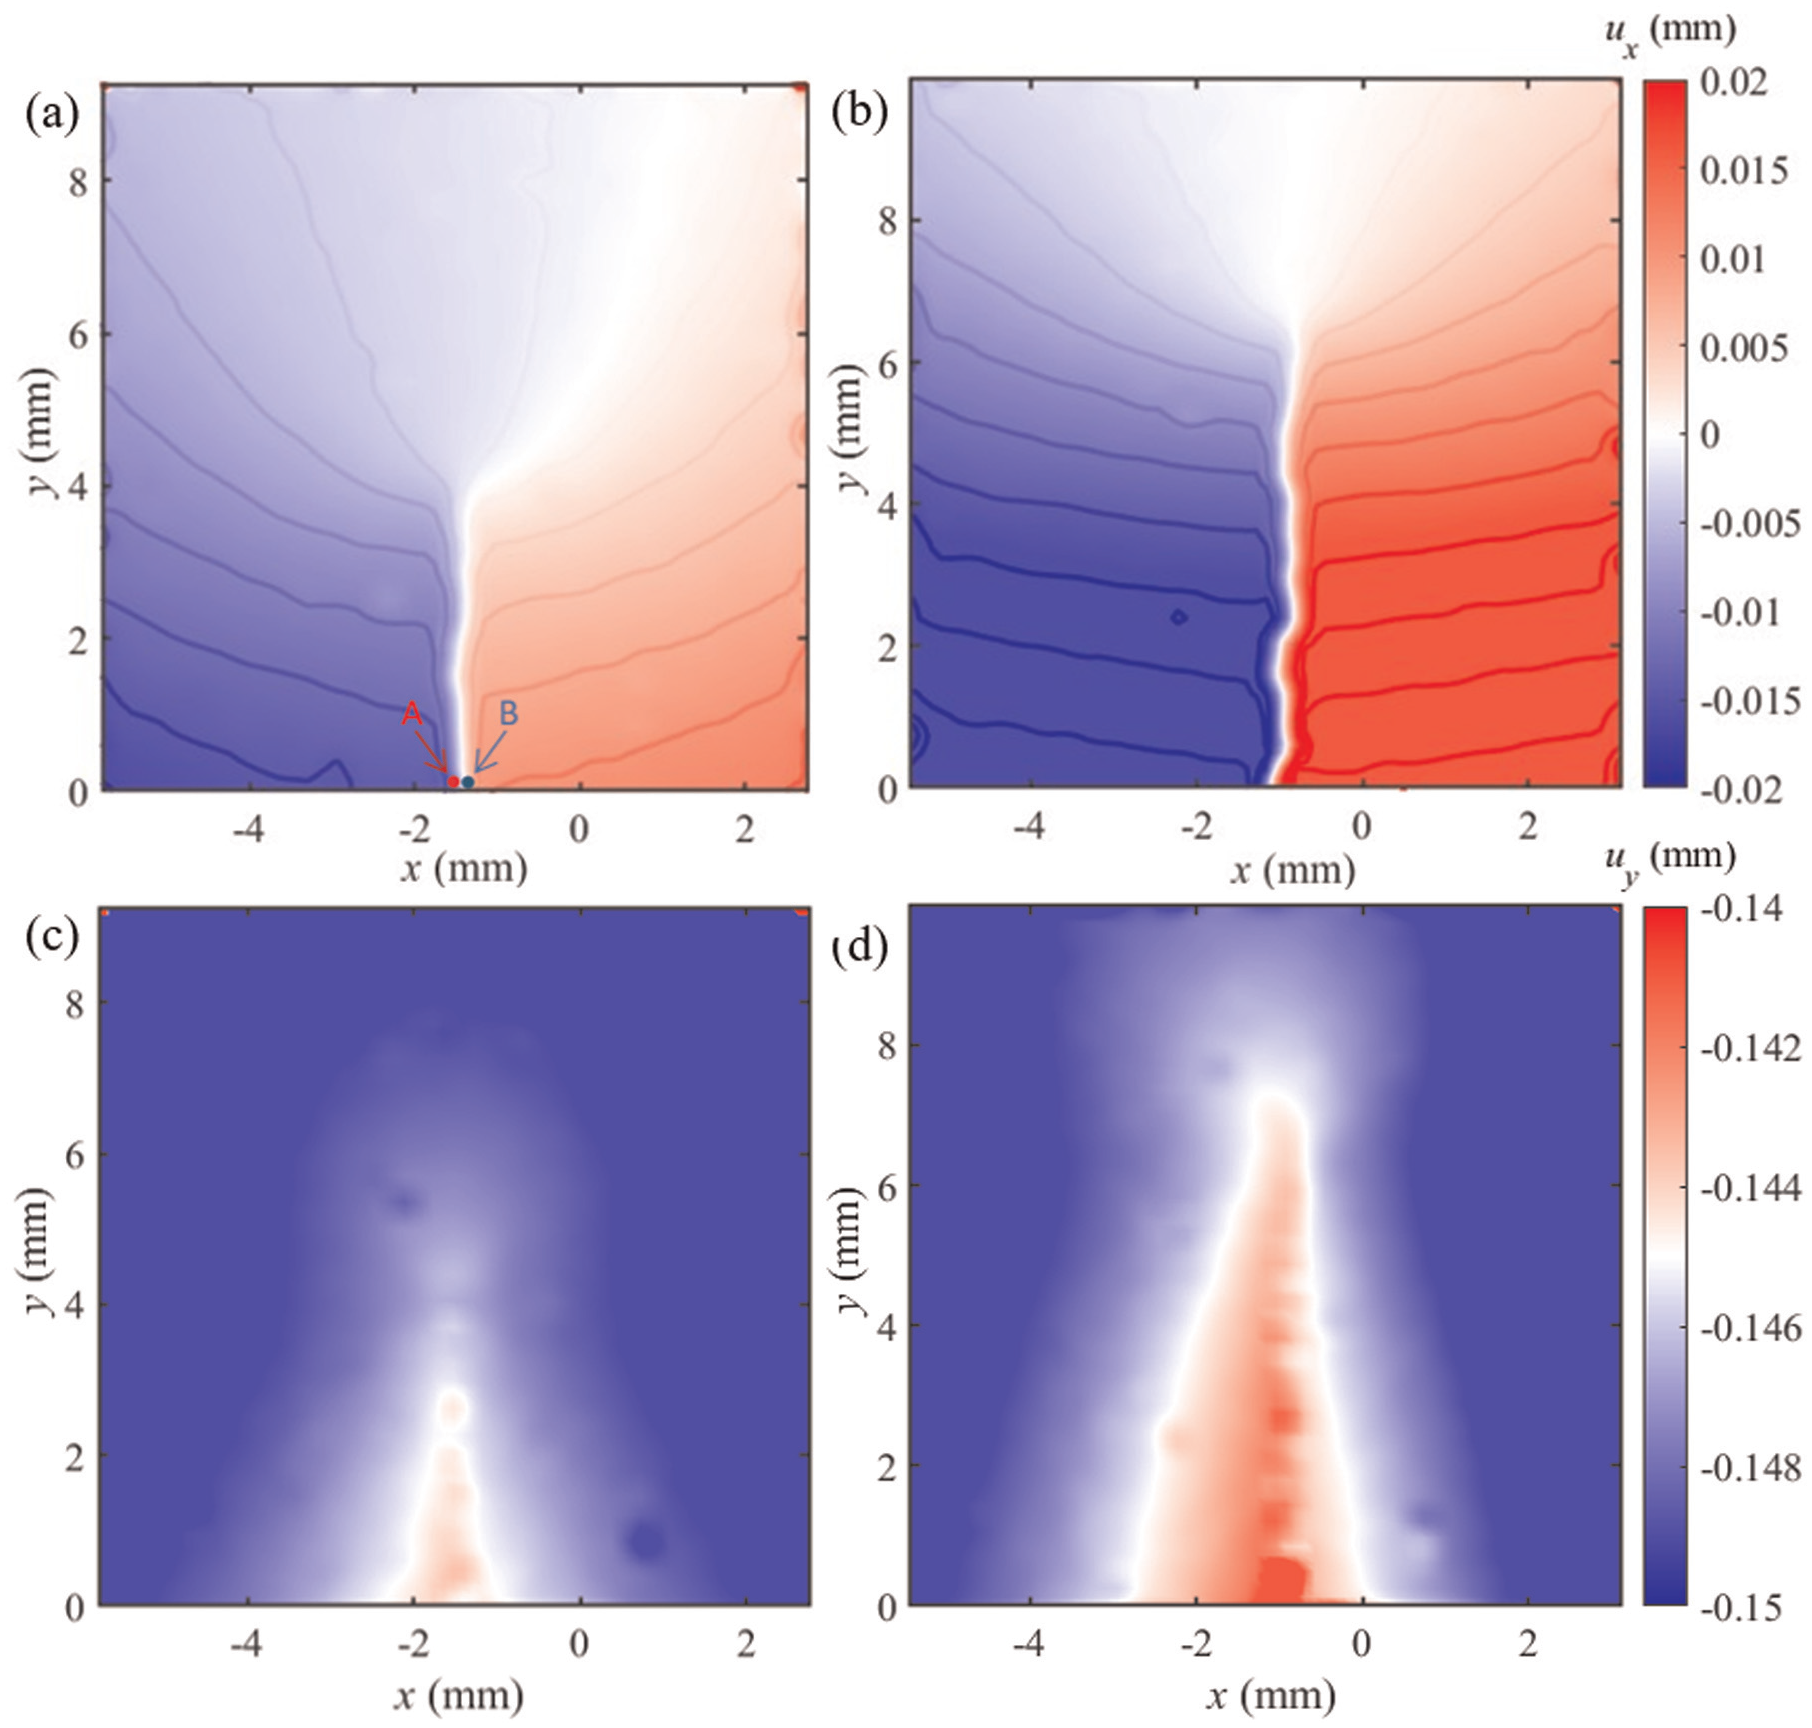
Experimentally measured surface displacement from DIC technique,
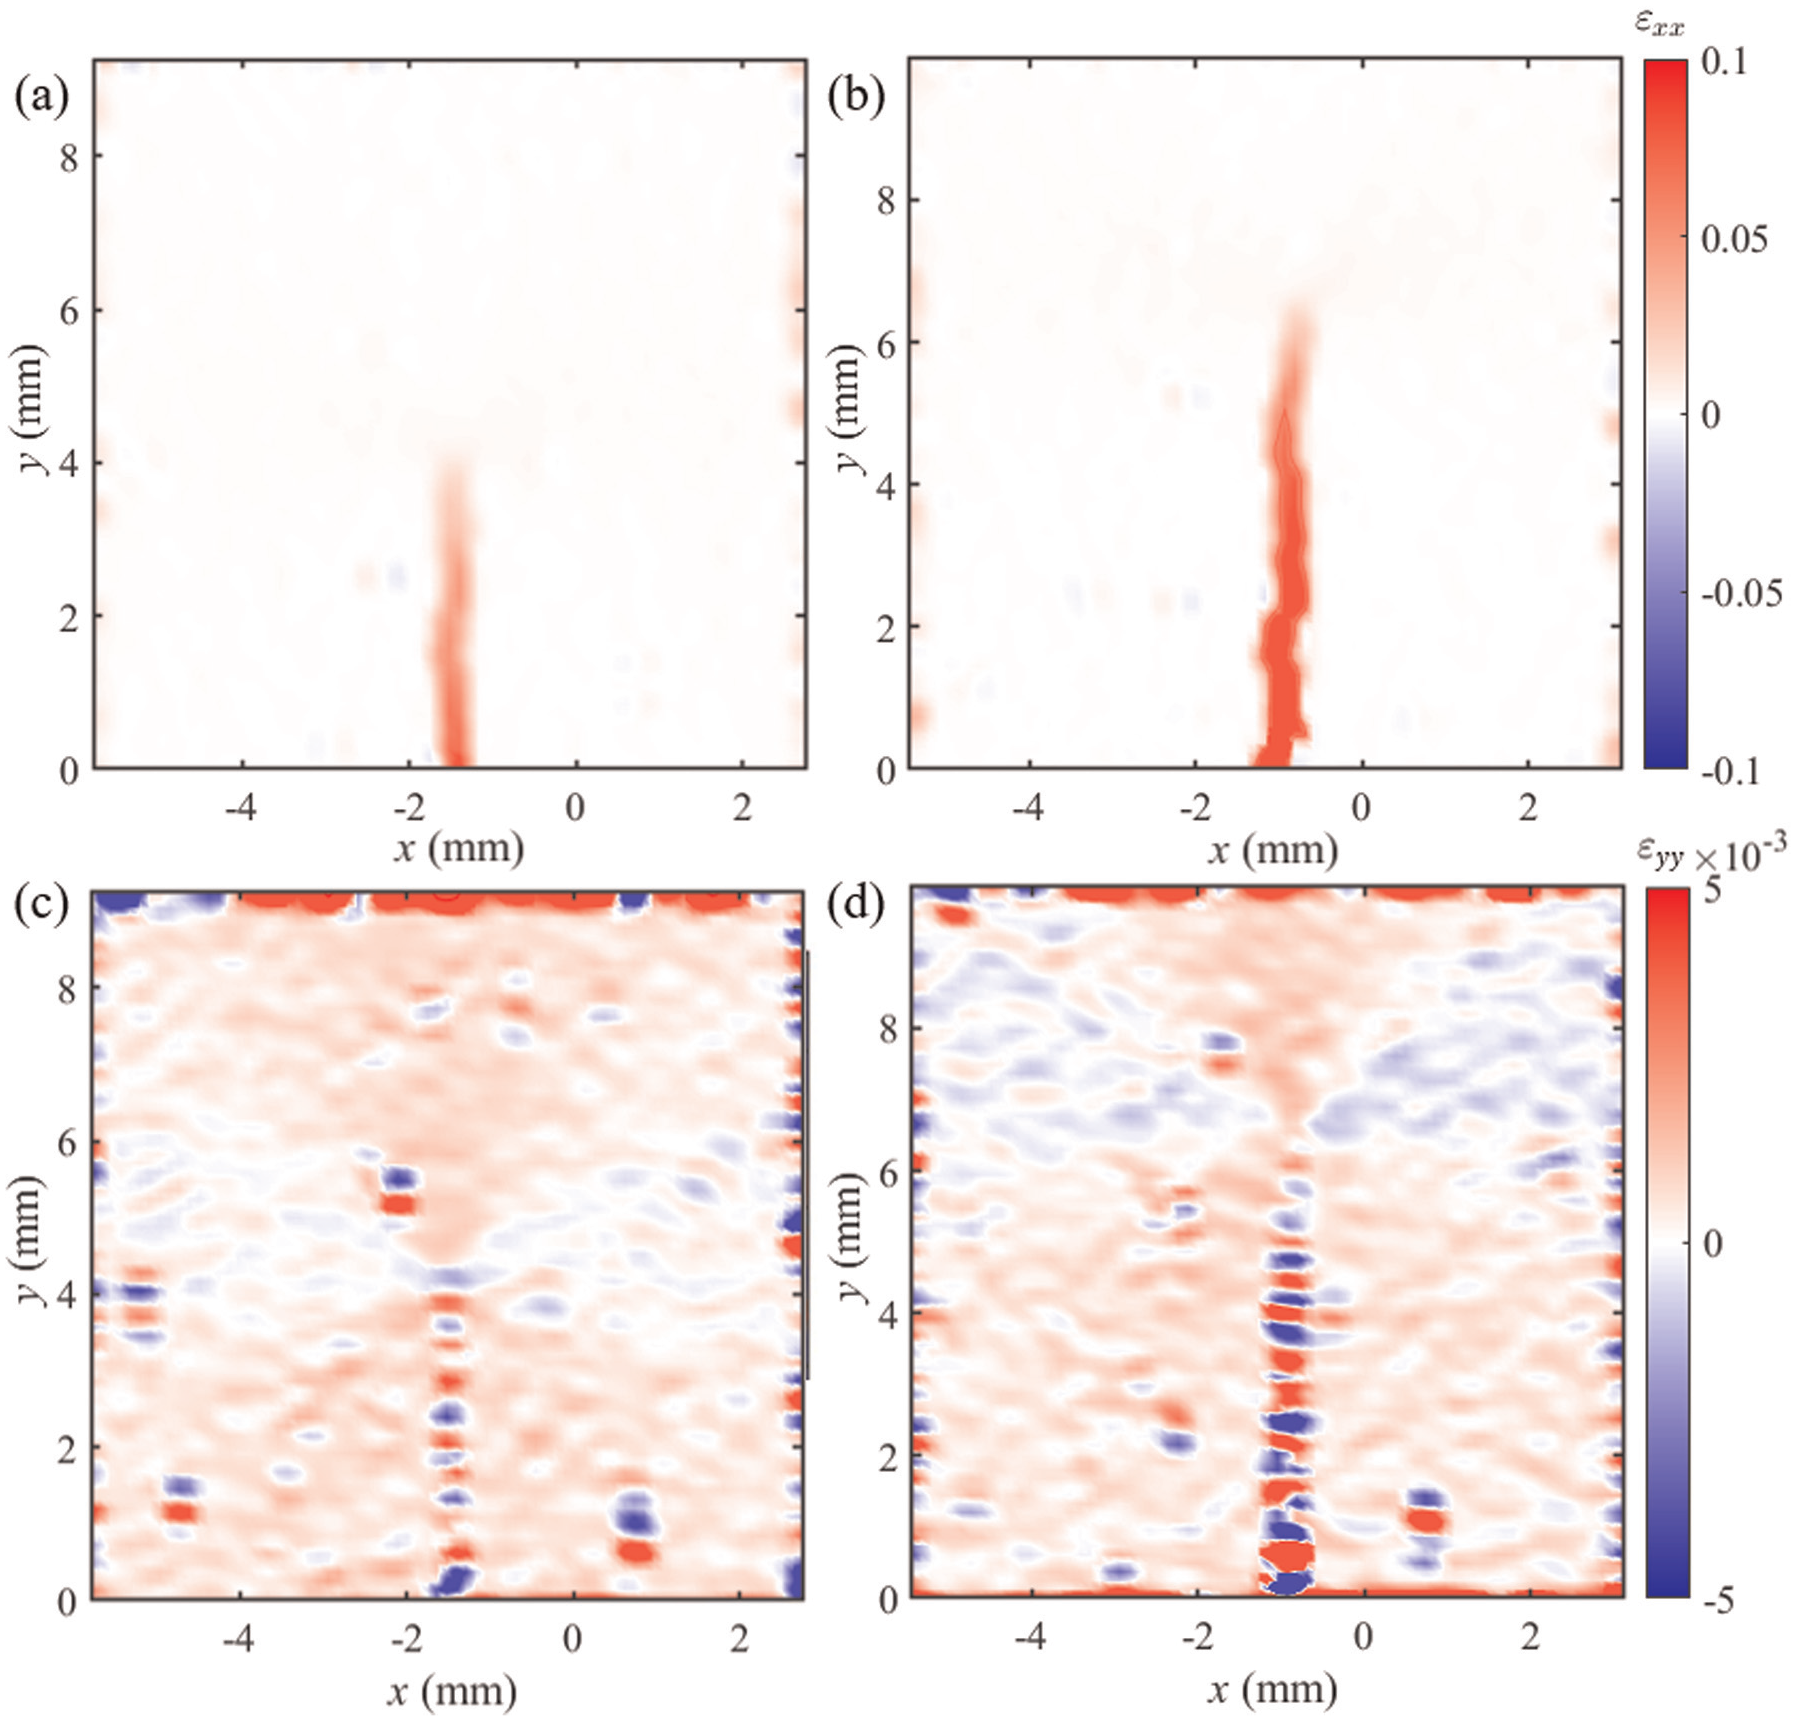
Experimentally measured surface strain using the DIC technique under loads of 0 and 40 kN on the: (a and b)
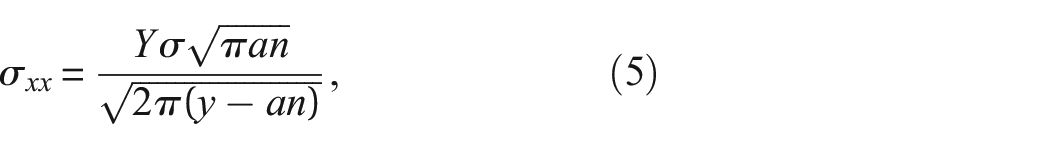
The
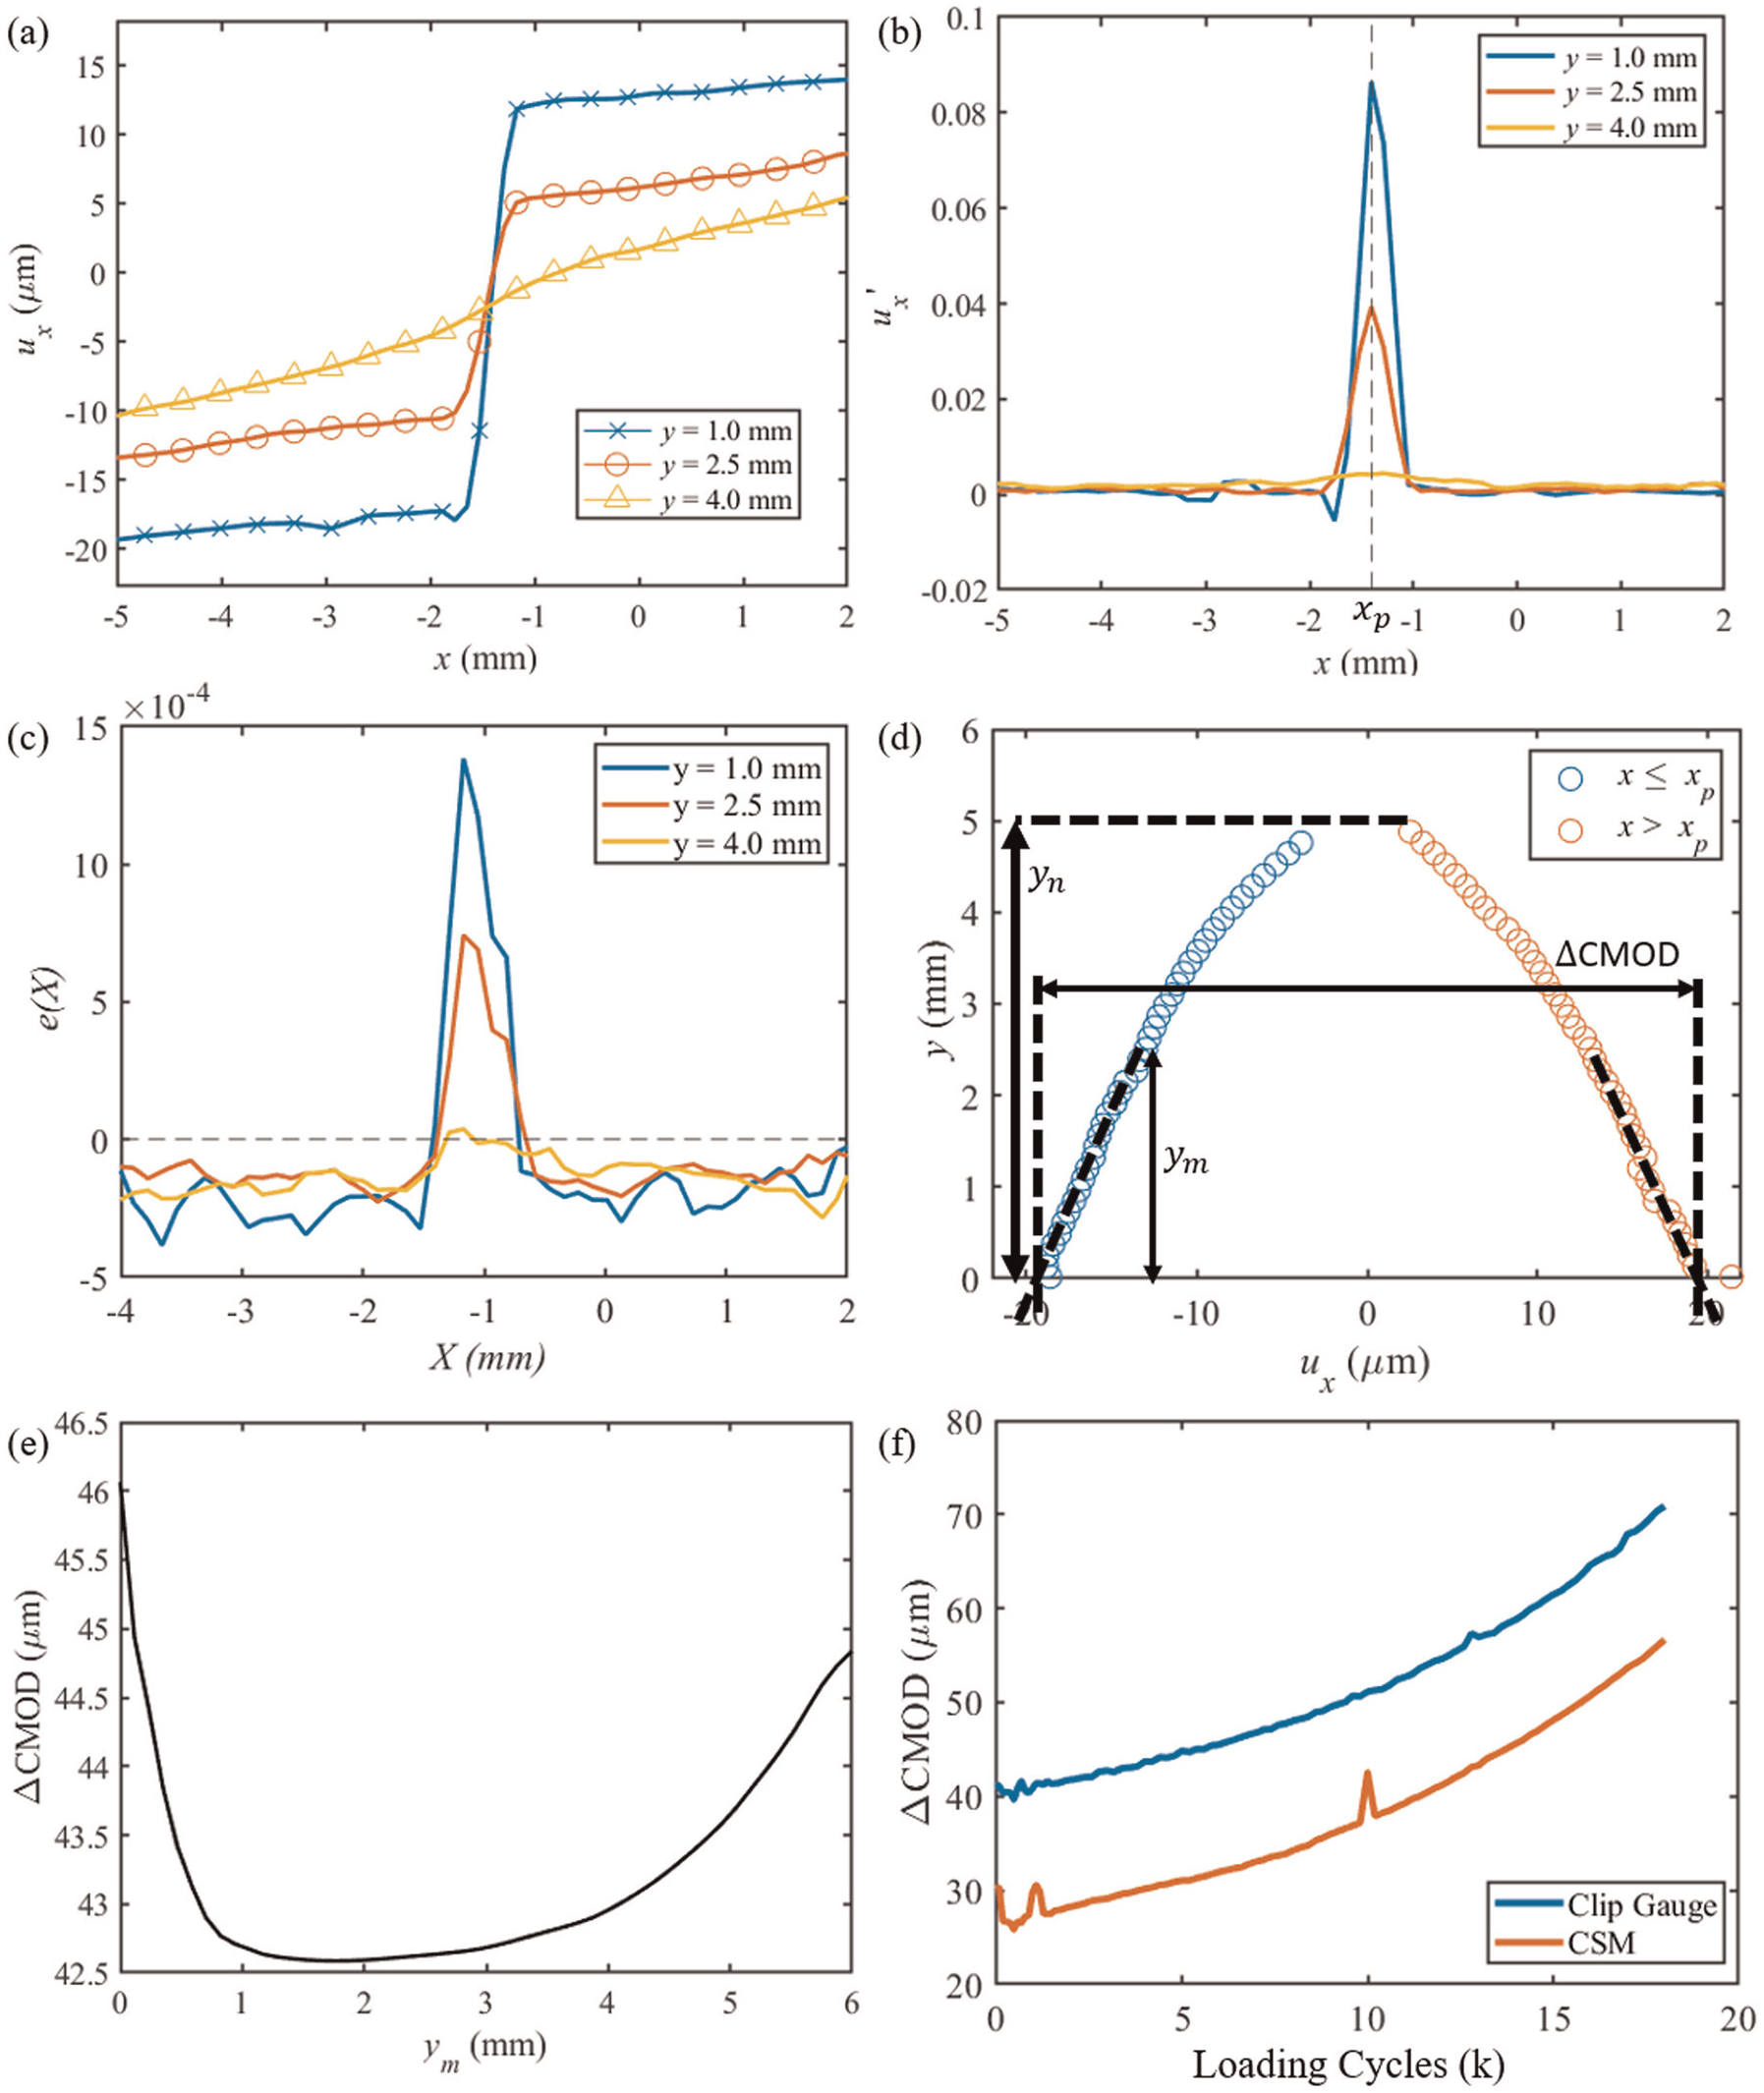
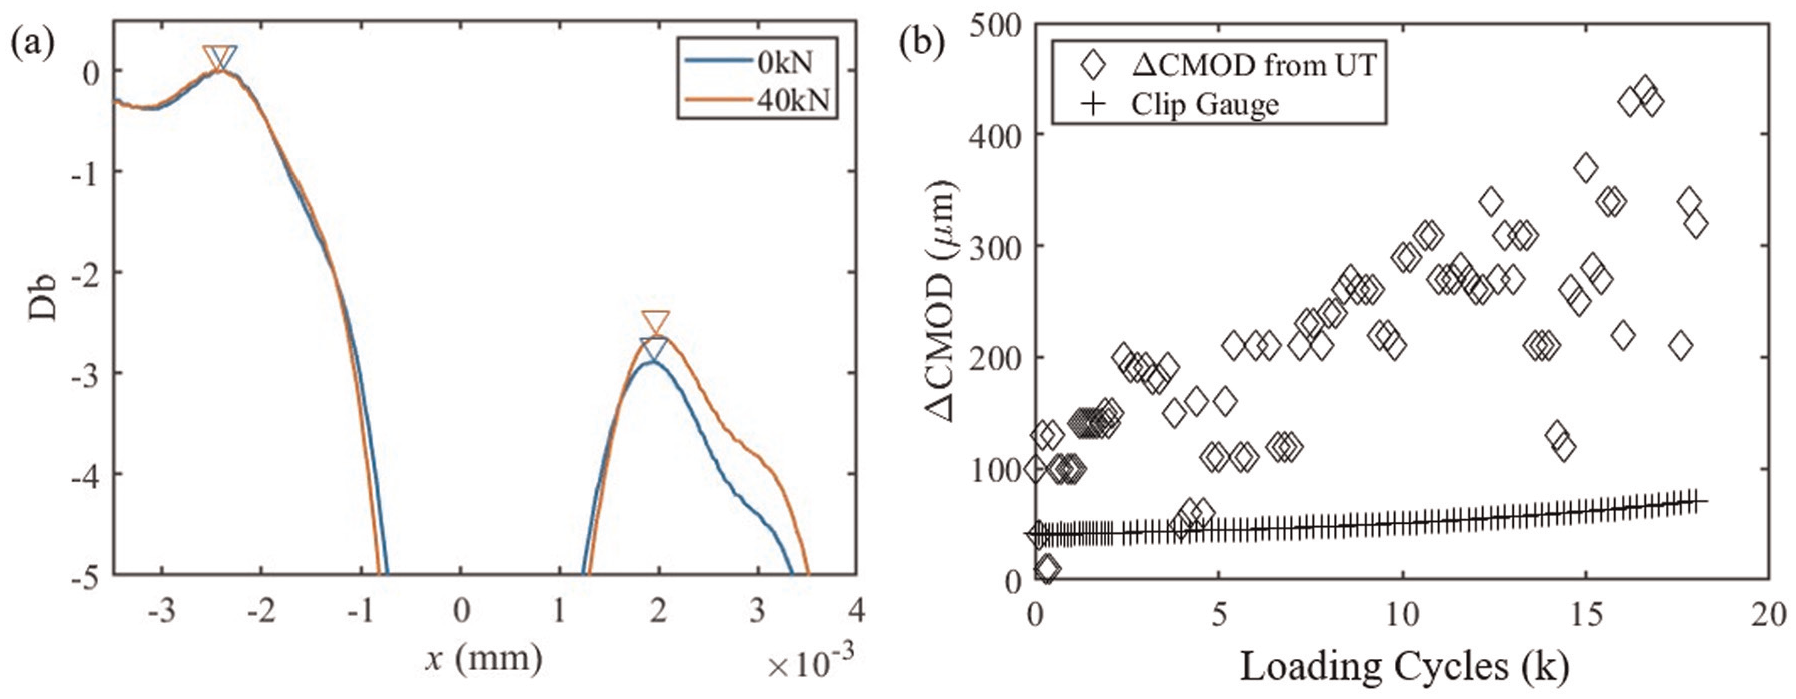
(a)
To find the location of the crack surfaces from each curve in Figure 6(b), a parameter at each
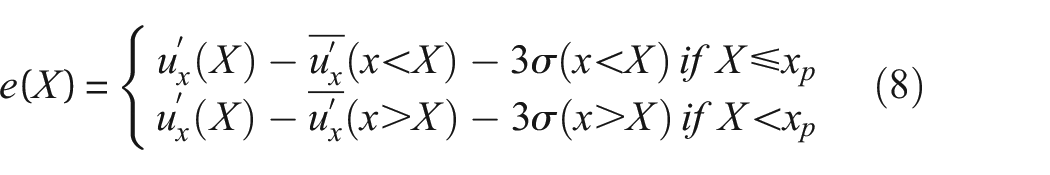
where
Using the values in Figure 5(a) to (d) and Equation (4), the surface stresses on
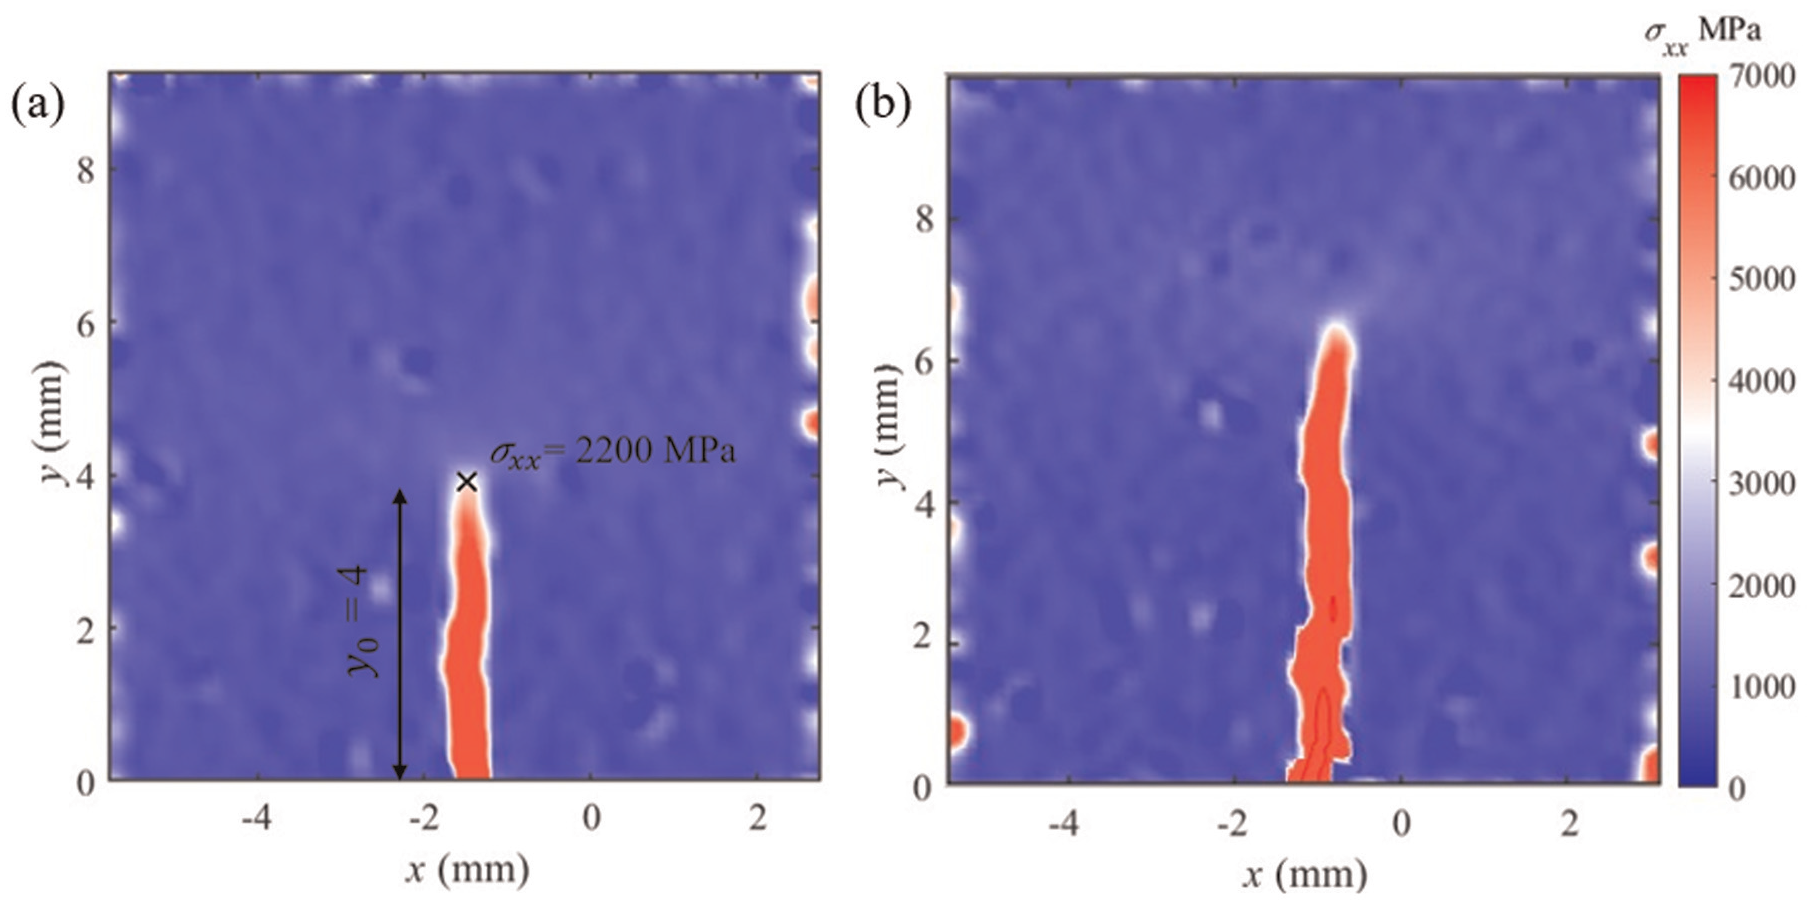
The calculated surface stress under a load of 40 kN and at a loading cycle of (a) 0 and (b) 18k.
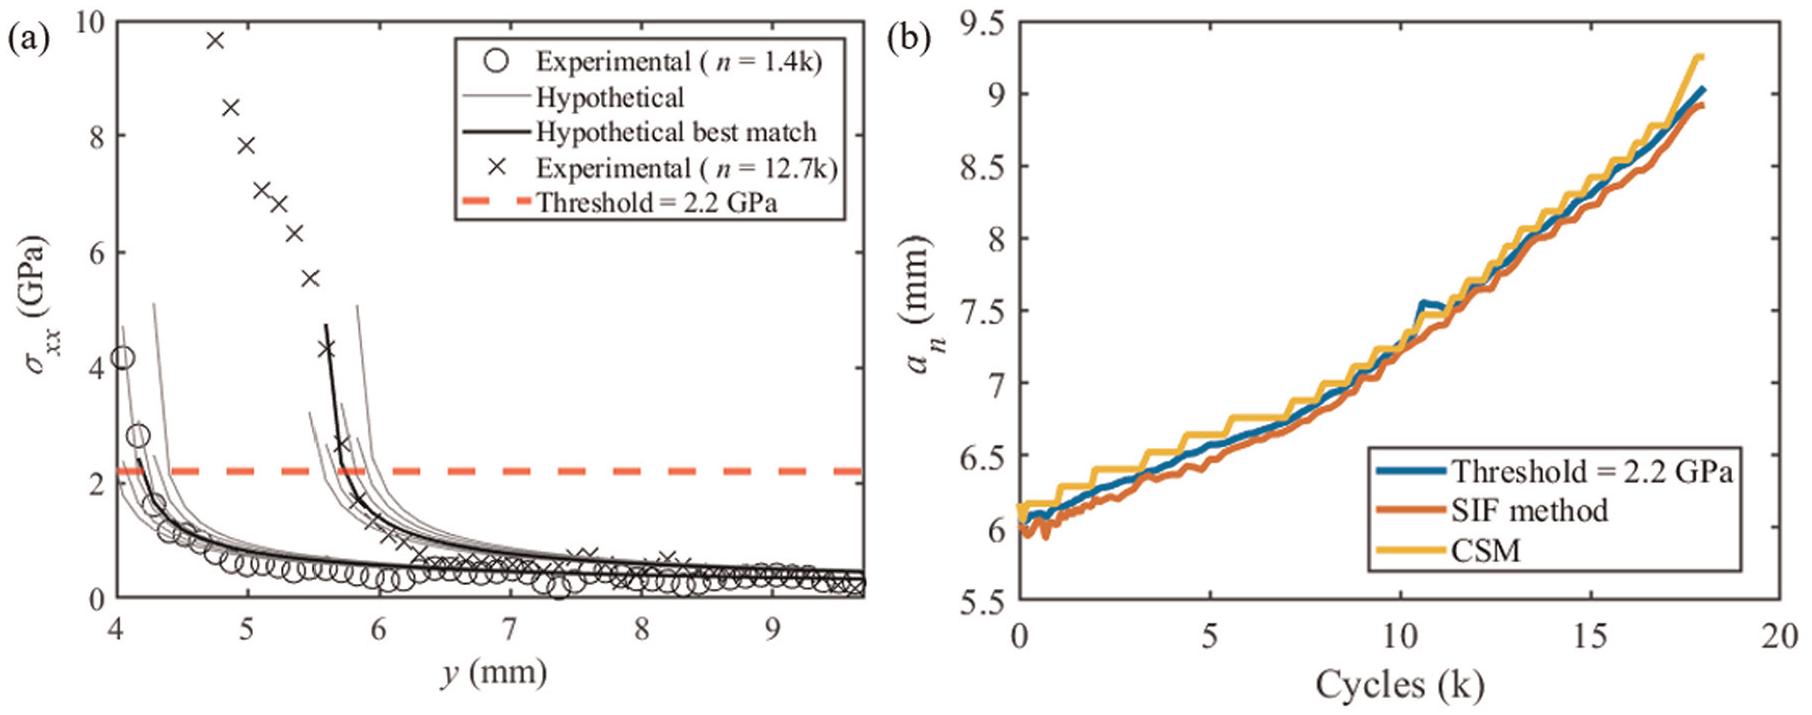
(a) Measured stress distribution along the crack central line is compared with those predicted using Equation (5) with a few proposed crack lengths and (b) measured crack length from (a) using the SIF method, the fixed threshold (2.2 GPa) method and the measured crack surfaces (shown in Figure 6(d)). SIF: stress intensity factor.
Ultrasound-based crack length estimation
It should be noted that a digital filter with a central frequency of 5 MHz and a bandwidth of 10 MHz was applied to suppress noise before the subtraction of the FMC array datasets. Figure 9(a) to (d) compares the TFM images at different loads and loading cycles. As seen in Figure 9(a) to (d), the direct TFM images can clearly indicate the location of the back wall, the clip gauge holder and the notch, but the crack tip responses are vague. It is possible to detect the crack tips using the −6 dB drop and threshold techniques, 27 but this would involve additional parameters and require case-by-case calibrations. It is noticed that the geometry of the SENB specimen is supposed to be symmetrical, while the TFM images are asymmetrical. This is due to the imperfect adhesion between the array and the material surface, which caused de-bonding between the elements to the right of the images. The triangle-shaped feature in the top-right corner is an image artefact of the clip gauge holder, again; due to de-bonding, it is not present on the left side.
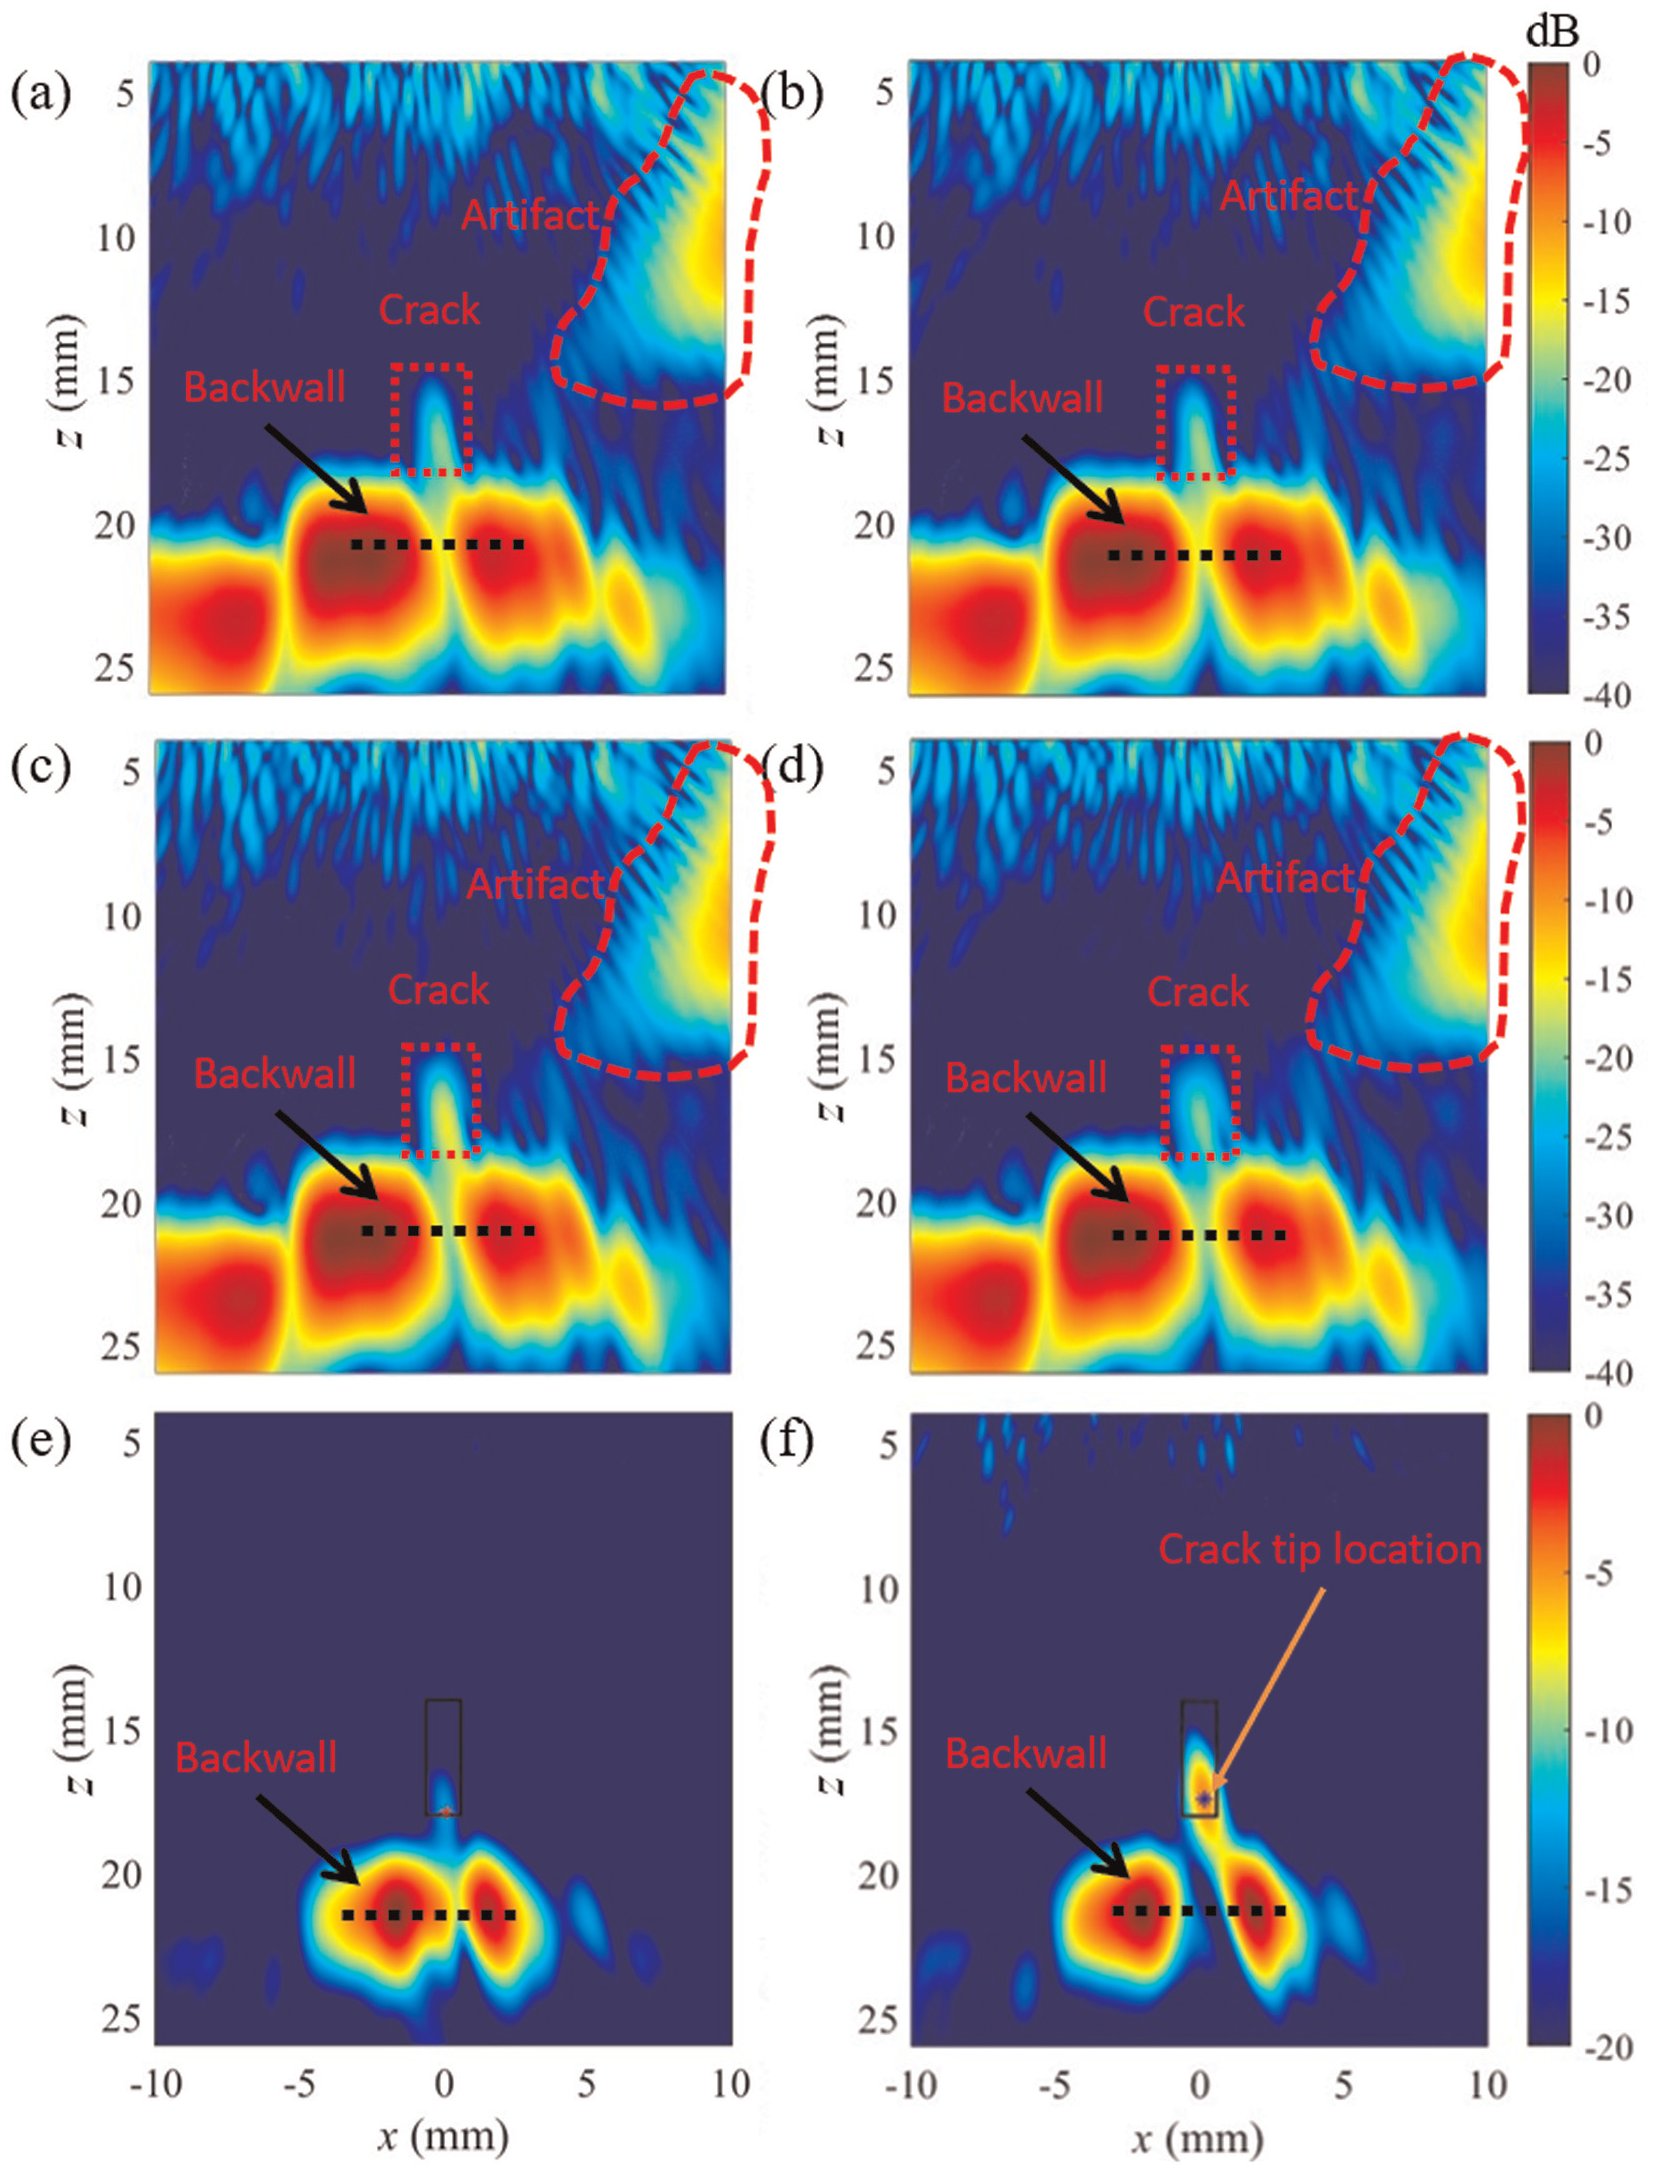
The TFM images generated using the FMC array dataset acquired at a loading cycle of (a, c and e)
Figure 9(e) and (f) shows that the subtracted TFM images are capable of detecting crack tip responses, as there are local peaks within the region of interest. The use of the tip response enables the detection algorithm can be generally applied to other cases with similar geometries (i.e. surface-breaking crack from the other side of the material) without the need for calibration.
We also tried to measure the
(a) Back wall image intensity along the dashed line shown in Figure 9(a) and (c) and (b) the measured
Results comparison
After the experiment was completed, the specimen was submerged in liquid nitrogen and broken open using three-point bending to reveal the crack growth pattern during the fatigue cycles. At liquid nitrogen temperature, SS355 is significantly more brittle and ensuring that brittle fracture process does not affect the shape of the fatigue crack. As a result, the shape and boundaries of the relatively smooth fatigue crack are clearly visible in Figure 11(a), which shows a slightly shorter crack length on the surface (
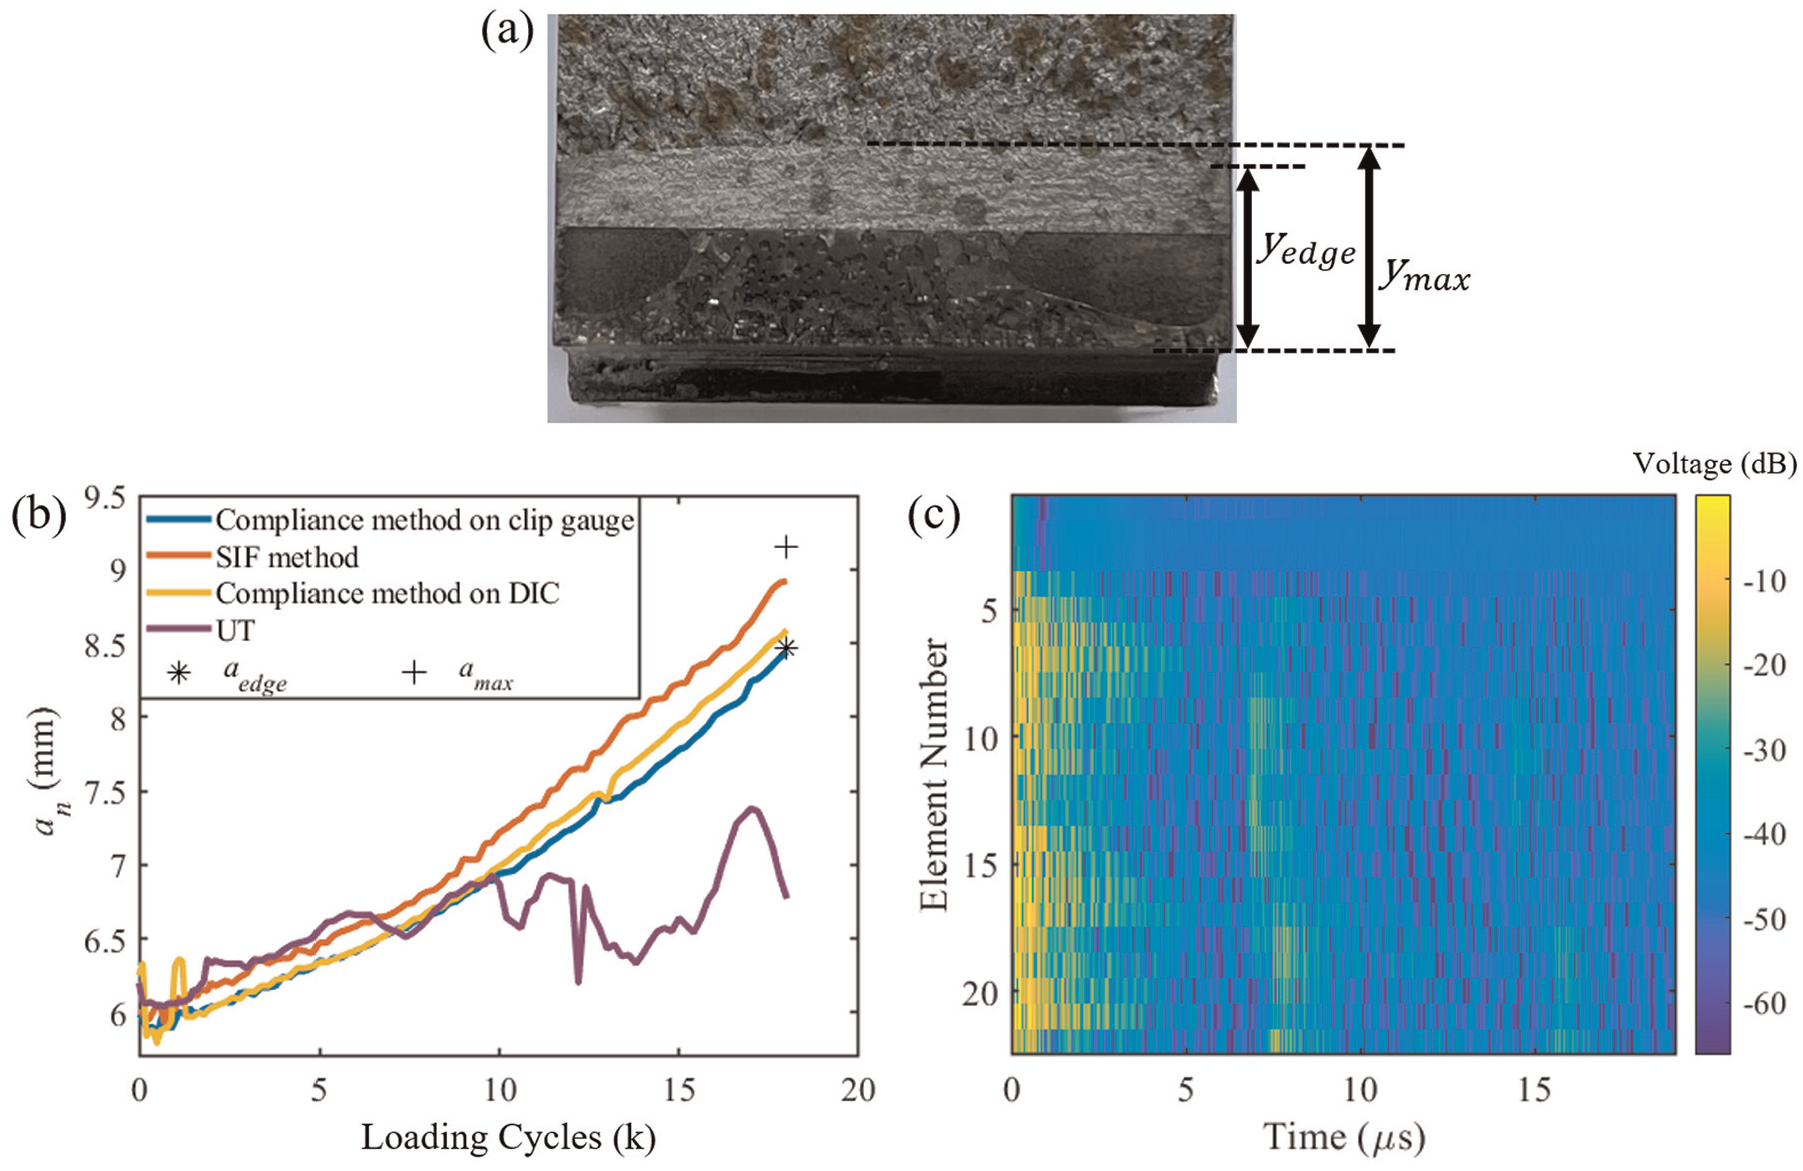
(a) Photo of crack shape after specimen was broken open, (b) comparison of the measured crack lengths from various methods and (c) the pulse-echo ultrasonic signals acquired at a load of 40 kN in a loading cycle of 13k.
Figure 11(b) compares the measured crack lengths using various methods. It should be noted that, combined with the compliance method, the measured
Table 1 compares and summarises the considered methods. Regarding the overestimation of the measured crack lengths by the DIC methods, it could be caused by geometric changes in the deformed specimen and slight shifts in its position on the supporting bars. These factors may cause the crack initiation point to appear higher in pixel coordinates. However, the crack length measurement was still taken relative to the initial initiation point. It should be noted that identifying the exact crack initiation point in DIC images is challenging. Regarding the divergence of UT results after 10k cycles, it could be attributed to inconsistent de-bonding, which introduces significant errors and noise into the subtracted FMC array datasets used to form the ultrasound images.
Comparison of the used methods for crack length measurements.
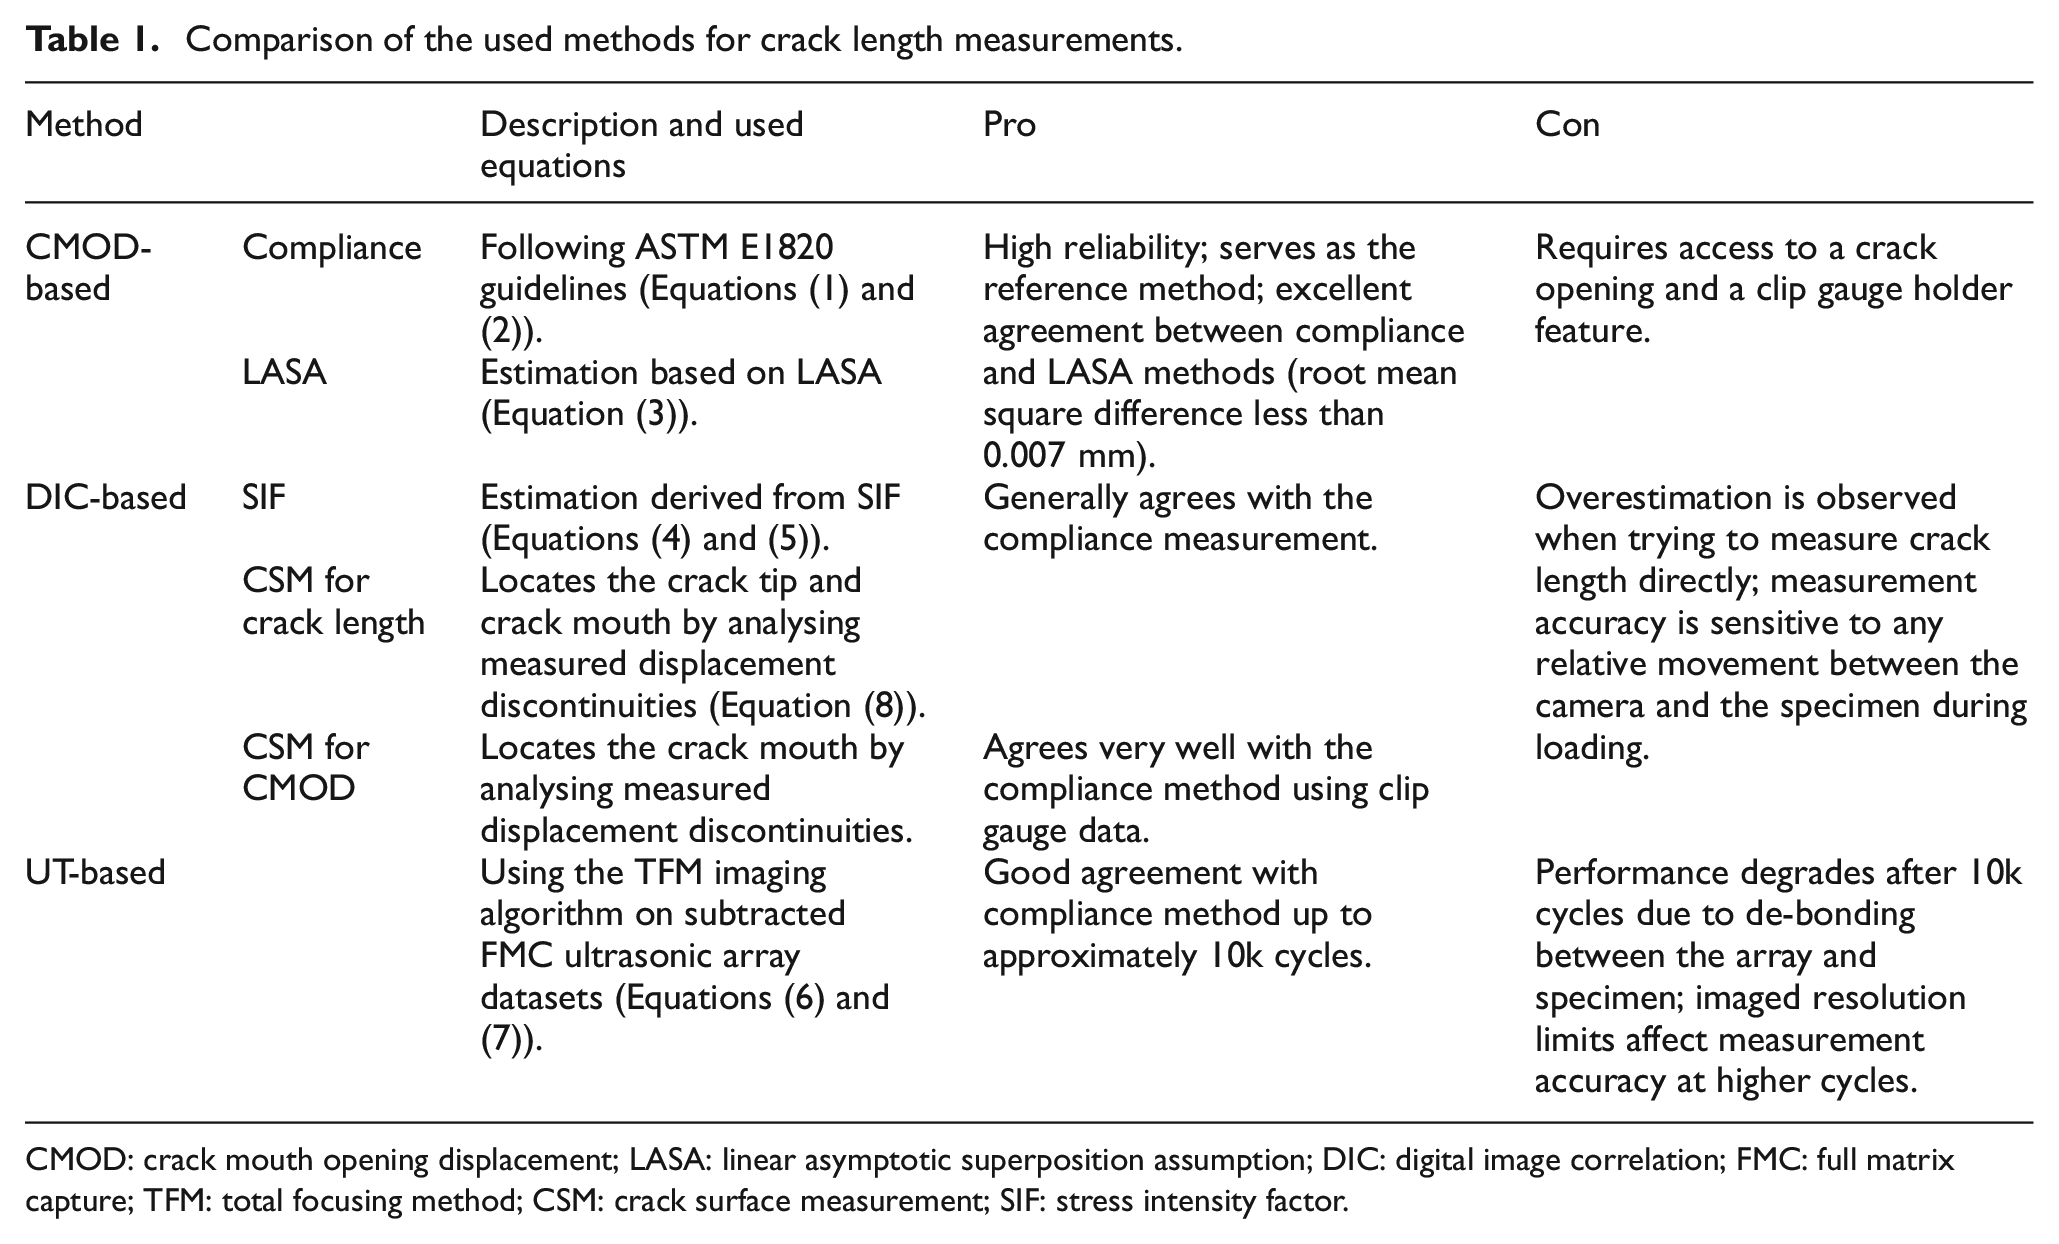
CMOD: crack mouth opening displacement; LASA: linear asymptotic superposition assumption; DIC: digital image correlation; FMC: full matrix capture; TFM: total focusing method; CSM: crack surface measurement; SIF: stress intensity factor.
Conclusion
Correlative post-processing techniques were used for measuring CMODs and crack length during fatigue testing. Results obtained from the DIC-based (SIF and CSM approaches) and the UT-based approaches were compared. The proposed techniques were validated by comparing the results with those obtained using the compliance method in ASTM E1820, which uses the ΔCMOD measured by the clip gauge measurements. We demonstrated that both the low-cost ultrasonic arrays and DIC exhibit reasonable and reliable performance in detecting and monitoring crack growth in four-point bending fatigue tests. The developed post-processing techniques proved effective in accurately measuring important parameters of crack growth, such as crack length and CMOD. These findings validate the feasibility and applicability of using low-cost ultrasonic arrays and the associated post-processing techniques for crack monitoring and characterisation. Our results provide confidence in the practical use of these methods for assessing crack growth and structural integrity in various applications. Future work should consider improving the bonding quality between the ultrasonic array and the specimen. Potential solutions include selecting a more robust epoxy resin and incorporating additional mechanical fixtures, such as clamping. More practical trials are also needed to advance the developed techniques towards final industrial applications.
Footnotes
Declaration of conflicting interests
The author(s) declared no potential conflicts of interest with respect to the research, authorship and/or publication of this article.
Funding
The author(s) disclosed receipt of the following financial support for the research, authorship, and/or publication of this article: This work is supported by the EPSRC Centre for Doctoral Training in Future Innovation in Non-Destructive Evaluation (FIND) (grant number EP/S023275/1) and the UK EPSRC under grant number EP/X527257/1 through the Henry Royce Institute MCAP Award. Nicolas O Larrosa acknowledges funding from the UK EPSRC under grant number EP/S012362/1 and RCNDE for the project ‘Quantitative Sizing of Short Fatigue Cracks and Assessment of Crack Driving Force Using Ultrasonic Arrays: A Feasibility Study’. Jie Zhang also acknowledges funding from the UK EPSRC under grant number EP/Y016661/1.