
Abstract
This paper proposes a data-centric method for identifying geometric defects in railway tracks using acceleration data collected from high-speed trains. Unlike many existing drive-by monitoring approaches that rely on classical supervised learning models requiring extensive labeled data from every line, a novel framework based on unsupervised domain adaptation (UDA) is proposed. This framework transfers the geometric defects diagnosis model learned from one line (source domain) to a new line (target domain) without necessitating labeled data from the latter. Given the variability in operational conditions, a detection model trained on one known scenario cannot be directly applied to another. Thus, the framework learns features sensitive to geometric defects and invariant to different tracks using the progressive distribution alignment based on label correction (PDALC) algorithm. Input data comprises labeled time-domain features extracted from acceleration data of the source line and unlabeled data from the target line. Output predictions are health status (target domain labels) for each track zone of the target line. The framework is evaluated using a comprehensive dataset of field measurements from a high-speed train traversing four different lines of France’s high-speed rail network, representing four distinct domains. Comparative results across 12 cross-domain recognition tasks reveal that the UDA framework based on PDALC outperforms four other UDA algorithms: transfer component analysis, maximum mean and covariance discrepancy, learning via low-rank and sparse representation, and geodesic flow kernel algorithm. Compared to the basic method (a classical supervised learning model without UDA), the proposed framework achieves a 12% increase in defect detection accuracy. Furthermore, the paper investigates the impact of different sensor layouts, tuning parameters of PDALC, classification algorithms, and the number of features on the accuracy of the approach.
Keywords
Introduction
Railway systems serve as critical infrastructure assets, necessitating ongoing monitoring of track networks to ensure the safety of passengers and to minimize maintenance expenses through early fault detection. 1 Tracks, integral components of railway systems, are engineered with specific geometric parameters that can vary along routes due to topographical constraints. Operational tracks can deteriorate over time due to multiple factors, resulting in deviations from their intended geometry that need to be rectified to maintain passenger comfort and safety. Regular inspections are carried out to assess the condition of the tracks, identify degradation, and detect faults, utilizing both manual inspection methods and specialized equipment like track geometry cars (TGCs) or track recording vehicles (TRVs). Generally, specific fault thresholds and statistical indicators of track quality are defined, prompting maintenance actions when these thresholds are surpassed. 2 While TRVs offer precise data, their fleet sizes are often limited. Inspections may occur infrequently depending on the track category; for instance, in the United Kingdom, track geometry recordings may have a maximum interval of up to 52 weeks, 1 with more vulnerable lines undergoing more frequent assessments. TRVs may necessitate line closures if operating below line speed. Failure to detect faults between inspections can compromise ride quality and result in higher maintenance expenses than if identified earlier. 3
To address these challenges, sensors have been installed on operational trains to monitor track geometry. 4 Known as “onboard” or “drive-by” monitoring techniques, these methods offer continuous data collection, although with fewer parameters measured and reduced accuracy compared to TRVs. Nevertheless, the increased frequency of data collection holds potential for enhancing preventative maintenance practices. 5
Accelerometers mounted on the train measure vibrations transmitted from the interaction between the wheel and rail in onboard techniques.6,7 These methods offer scalability in sensing, requiring minimal cost and maintenance, as each equipped in-service train can effectively monitor multiple lines. 8 However, drive-by data contain higher levels of noise due to the indirect nature of the measurement and the influence of various environmental and operational variations (EOVs). 9 Thus, data analysis techniques play an important role in reducing these measurement uncertainties. The results of the implementation of different data-driven approaches based on recorded dataset set of high speed train in France show that drive-by scheme can be used to monitor track irregularities.1,10 In addition, recorded acceleration responses from field test dataset 7 or train–track–bridge interaction model 11 can be used to monitor frequencies of railway bridges 12 and also detection of scour in bridge piers. 13
On the other hand, in recent years, machine learning-based techniques have gained attention for track condition monitoring. Pires et al. 14 proposed a data-driven approach to estimating geometric track irregularities using instrumented railway vehicle data, employing eight different regression machine learning models. De Rosa et al. 15 utilized vehicle acceleration response data and track irregularities to establish severity thresholds. Similarly, Paglia et al. 16 proposed a condition monitoring approach for railway tracks that involves estimating vertical track alignment. This is achieved by analyzing the vertical acceleration of the bogie and linking synthetic indicators, which represent vehicle dynamic behavior, to track geometry measurements obtained from a diagnostic train. Tsunashima 17 applied vertical and lateral accelerations, along with the carbody roll rate, to identify degraded track segments and faults using support vector machines and clustering methods. Yuan et al. 18 introduced a method using axle box data for squat detection, employing convolutional variational autoencoders to extract damage-sensitive features, followed by anomaly detection algorithms in the latent space. These studies highlight the potential of machine learning approaches for track defect detection.
However, a key limitation in these approaches is the assumption that training and testing data are independent and identically distributed (IID). In practice, training data often come from specific conditions, while testing data can encompass diverse operational and environmental scenarios, violating the IID assumption and leading to domain shift between datasets. 19 Directly applying models trained on existing labeled data to new datasets (e.g., different track lines) may result in poor performance. While new labeled data could improve model accuracy, collecting such data, particularly damage-state data, is often impractical. 20
To address these challenges, transfer learning (TL) has emerged as a powerful strategy for handling domain shift. TL enables models to leverage knowledge from previous tasks and apply it to new, similar tasks, improving performance. 21 A specific type of TL, known as domain adaptation (DA), aligns data distributions from the source and target domains, allowing the model to generalize well to unseen data by either adjusting sample weights or mapping data into a shared feature space. 22 Specifically, for multi-line monitoring, DA transfers a damage diagnostic model learned from one line to other lines, eliminating the need for labeled training data from every line in the railway network. In recent studies, DA has been applied to structural damage detection across different domains.20,22 For instance, Giglioni et al. 23 developed a DA approach for bridge monitoring, transferring damage knowledge between monitored bridges. They used DA techniques like joint DA (JDA) to align feature spaces between source and target domains while minimizing distribution discrepancies, thereby enabling damage detection across different bridge structures even when exposed to varying operational and environmental conditions. The study validated this approach on two benchmark bridges (Z24 and S101) and their finite element models, demonstrating that DA can significantly improve damage classification in structural networks. Similarly, Yano et al. 21 applied DA for TL across bridges, showing that even with distributional shifts, domain-invariant features could be extracted, enabling successful knowledge transfer across different bridge conditions.
In railway engineering, DA has been applied to railway vehicles damage detection. For instance, Yu et al. 24 used conditional adversarial DA to predict faults in gearboxes and shafts at varying running speeds. Qin et al. 25 proposed a Stepwise Adaptive Convolutional Network for fault diagnosis of high-speed train bogies under varying speeds. The model leverages DA to handle changing operational conditions, achieving a fault classification accuracy of 96.1% for key components like air springs, anti-yaw dampers, and lateral dampers. Chen et al. 26 introduced a semi-supervised adversarial DA model for assessing high-speed train wheel conditions under varying operational environments. By leveraging both labeled and unlabeled data, the model reduces discrepancies between different operational conditions, ensuring reliable performance in wheel condition monitoring. Their model outperformed baseline approaches in cross-domain assessments using real-world onboard monitoring data from the Lanxin high-speed rail line. Jiang et al. 19 also proposed a DA approach to diagnose the health conditions of maglev rail joints under complex operational conditions using an unsupervised discrepancy-based DA network. This approach was validated on a dataset of time–frequency spectrograms derived from experimental acceleration data of maglev rail joints. It successfully identified two conditions: bolt-looseness-caused rail step and misalignment-caused lateral dislocation.
In this study, we propose a novel framework based on a DA architecture for detecting geometrical defects across multiple railway lines. The framework uses the track line with labeled data as the “Source Domain” and applies the model to a new, unlabeled track line, referred to as the “Target Domain.” To achieve this, unsupervised DA (UDA) is employed, which transfers the model trained on the source domain’s labeled data (e.g., train vibration data with damage labels) to predict defects in the target domain without the need for labeled data. 9 By addressing the domain shift, the proposed UDA method enables effective defect detection across railway networks, eliminating the need for extensive new labeling efforts.
The proposed framework has three modules. In the first module, data for UDA prepared by conducting data cleansing and extracting the time domain features from raw acceleration response of various sensors on body and bogies of a train. In the second module, a UDA algorithm is trained to obtain domain-invariant and class discriminative feature representations from the input data. This is carried by using a novel UDA method named progressive distribution alignment based on label correction (PDALC). 27 PDALC leverages class discriminative information to conduct subspace learning, facilitating the acquisition of a domain-invariant subspace. 27 Additionally, it incorporates a mechanism for pseudo label correction to assess the reliability of pseudo labels and rectify any inaccuracies. 27 In the final module, domain-invariant features extracted from data using PDALC are used as inputted to the damage classifier, to predict damage states of the target line.
The proposed framework is validated using extensive field measurements obtained from a specialized high-speed measuring train operated by the Société Nationale des Chemins de Fer Français (SNCF).28,29 The dataset includes track geometry measurements recorded by the track geometry measuring system (TGMS) and acceleration responses collected by multiple accelerometer sensors installed on the IRIS320, a high-speed instrumented train used on the French high-speed line (HSL).29,30
The IRIS320 train functions as a mobile probe, capturing real-time vibration and sensor data during regular operation to detect and analyze track conditions. In previous work, it was demonstrated that a data-driven algorithm using the instrumentation from the IRIS320 was effective in detecting geometric defects in track zones along a specific line in France.4,31 For this paper, the recorded dataset of four various lines is used as the main case study, and the result of 12 different cross-domain recognition tasks in the UDA framework is assessed.
In addition, to compare the performance of the PDALC with other UDA methods, the results are compared with the ones obtained from another four well-known algorithms of Learning via low-rank and sparse representation (LRSR), 32 geodesic flow kernel (GFK), 33 transfer component analysis (TCA), 34 and maximum mean and covariance discrepancy (McDA). 35
The outline of this paper is as follows: the second section formulates the domain shift problem and discusses the concept of condition monitoring in UDA system and the formulation of PDALC, as proposed by Lie et al. 27 The third section presents detail of the onboard monitoring system on the IRIS320 high-speed train. The proposed UDA framework is presented in the fourth section. In the fifth section, a series of comparison conducted on real-world datasets across 12 different tasks to verify the effectiveness and efficiency of the proposed method. Finally, the sixth and seventh sections present the discussion and conclusion of the work.
Theoretical background
Problem statement based on the DA concept
In machine learning, a domain (
DA assumes that while the tasks in the source and target domains are identical (
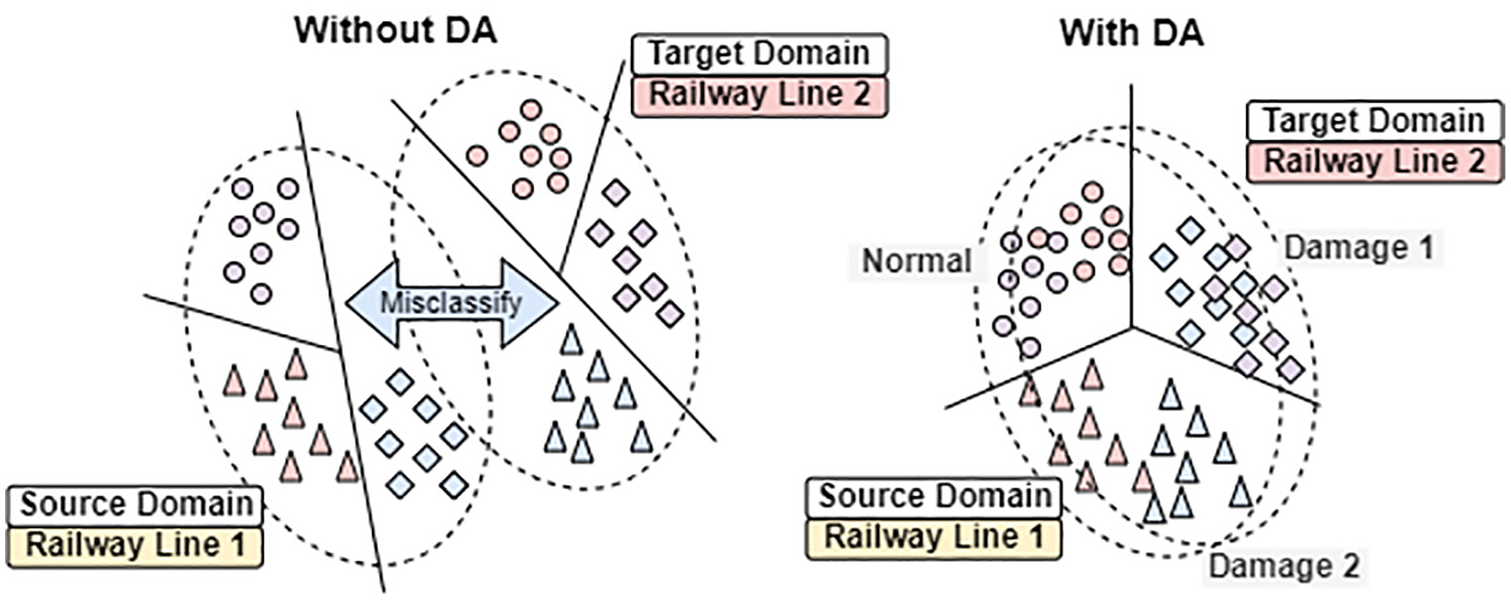
Illustration of how DA addresses domain shift in fault detection. DA: domain adaptation.
One of the key challenges in railway track monitoring and structural health monitoring (SHM) applications is the variability in the operating conditions across different environments, structures, or time periods. For example, the vibration characteristics of a track section can vary significantly depending on external factors like weather, load conditions, or geographic location. 1 In the case of UDA, where labeled data are not available for the target domain, this variability poses a significant challenge. The ability to transfer knowledge from a source domain (such as a specific railway line or a numerically simulated environment) to a target domain (such as another railway line or operational environment) without labeled data becomes crucial for effective and scalable monitoring systems. UDA methods are particularly useful in these contexts, as they allow models to account for these variations without requiring extensive manual labeling efforts in each new domain.
In SHM, the source domain
Progressive distribution alignment based on label correction
The existing methodologies for UDA can be categorized into two main types: instance-based UDA and feature matching-based UDA techniques. 37 Instance-based UDA assumes that data from both source and target domains are available for training and focuses on aligning individual instances from the source to the target domain. 38 In contrast, feature alignment-based UDA seeks to reduce the disparity between marginal or conditional distributions of the source and target domains by analyzing their geometric structure in a shared subspace. 39 Generally, in UDA, pseudo labels need to be generated for the target domain,40,41 which effectively transforming the UDA problem into a supervised learning task through the utilization of these pseudo labels. However, the reliability of these pseudo labels is often questionable, potentially leading to misalignment of conditional distributions and incorrect pseudo label generation during UDA model iterations. Despite this, many existing UDA approaches overlook the issue of pseudo label reliability. To address this challenge, this study adopts a novel UDA method called progressive DA with label correction (PDALC), 27 which combines progressive learning, label correction, and subspace structure learning to reduce the distribution gap between domains. PDALC employs a label correction mechanism to assess and rectify pseudo-label inaccuracies as the learning process unfolds. The framework of PDALC is illustrated in Figure 2, and it consists of two primary phases: (1) learning geometric structure of data and (2) label correction. More details of the PDALC are provided by the study by Li et al. 27
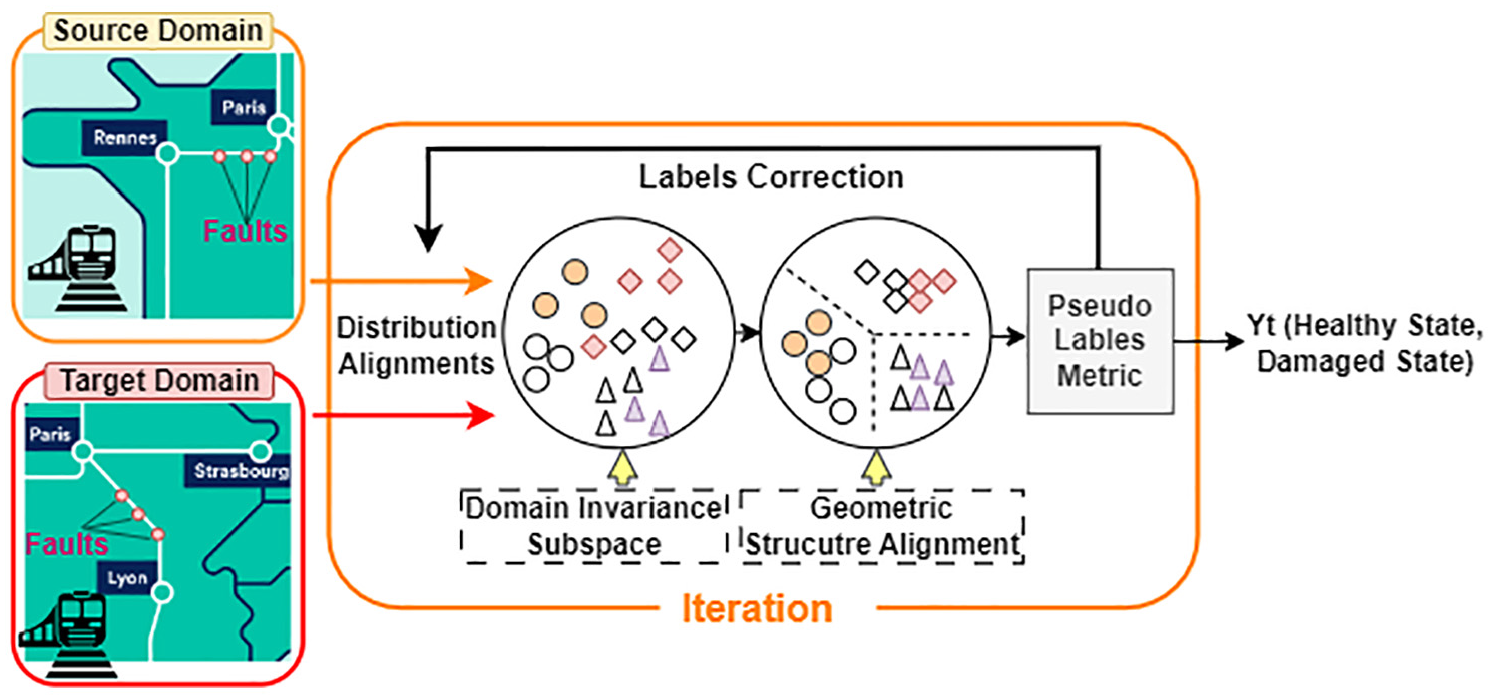
The illustration of PDALC. PDLAC: progressive distribution alignment based on label correction.
Learning the geometric structure
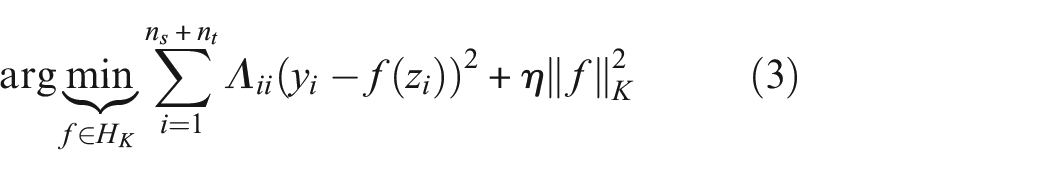
Pseudo-labels assigned to the target domain are used to learn the structural relationships between data points in both the source and target domains. Assuming the availability of pseudo labels, the objective is to ensure that data belonging to the same class (e.g., healthy class) are clustered closely together, while data points from different classes (e.g., healthy class vs damaged class) are kept apart. This is achieved using the following equation:
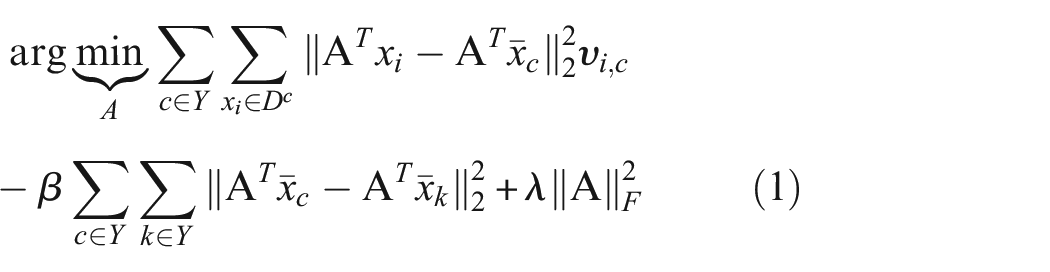
Here,
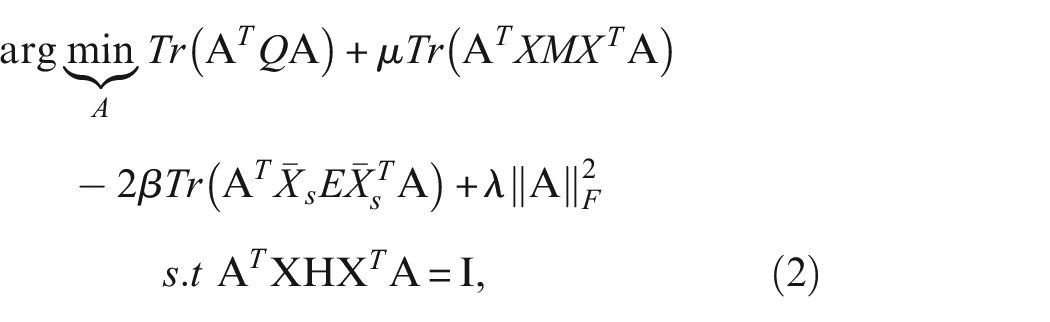
Solving this eigenvalue problem provides the final projection matrix, allowing for the transformation of source and target data into a shared subspace.
Labels correction
To tackle the challenge of misclassification and linear inseparability in the new shared subspace, the samples are first mapped to a kernel space to improve separability. A classifier based on structural risk minimization (SRM) is then used to generate pseudo-labels for the target domain data. 42 This process can be expressed as:
where
However, pseudo-labels generated during this process are not always reliable. To mitigate the impact of inaccurate pseudo-labels, a confidence coefficient matrix
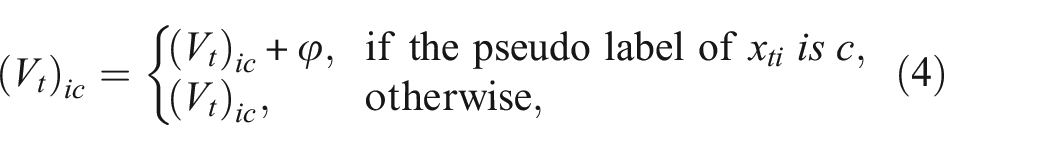
where
where
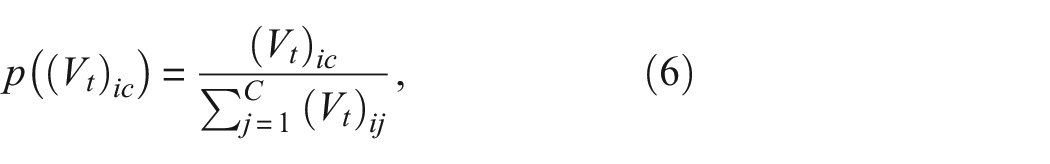
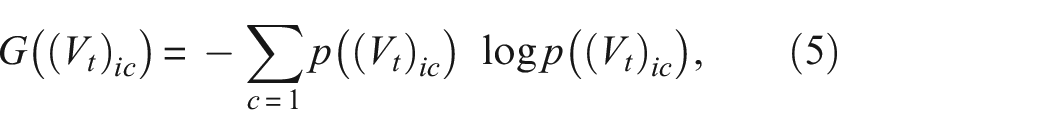
If the entropy
Experimental dataset
The experimental dataset utilized in this study is collected as part of the International Union of Railways (UIC) Harmotrack project run by SNCF Réseau. 29 The HSL train IRIS320 is equipped with multiple advanced sensors, cameras, and lasers, including accelerometers, inertial measurement units, high-speed imaging systems, line-scan cameras, effort sensors, surface pressure sensors, and an electric arc detection system. This specialized inspection train conducts assessments at high speeds, reaching up to 320 km/h, and can operate during the daytime between commercial high-speed train services. The data were gathered over 3 years, encompassing a range of geographic, environmental (weather), and seasonal conditions. The instrumentation recorded train acceleration responses and track geometry data every 15 days for each line. 29
Accelerometers positioned at the front, middle, and rear sections of the train (as illustrated in Figure 3) are used to measure indicators of vehicle-track interaction, including vertical and lateral vibrations transmitted to the train from the forces generated at the contact surface between the wheels and rails. These accelerometers are installed on both the train’s body (on the floor) and the bogies, as shown in Figure 4(a).
29
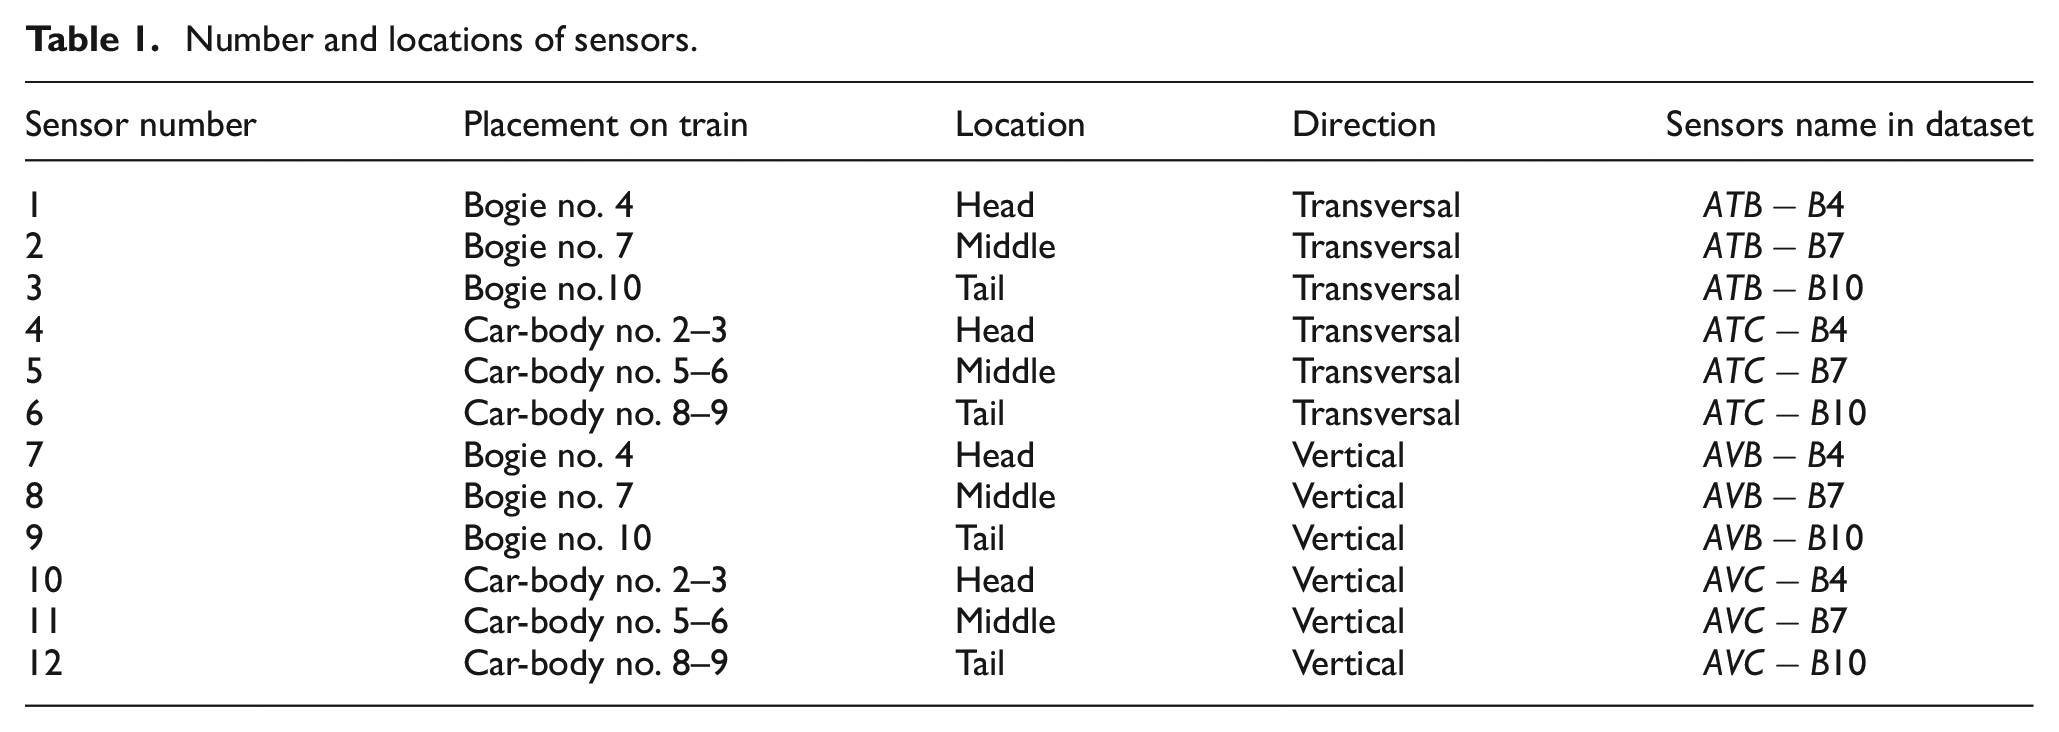
For each section, two accelerometers were installed to measure the Acceleration in Transversal (lateral) direction of Bogie (
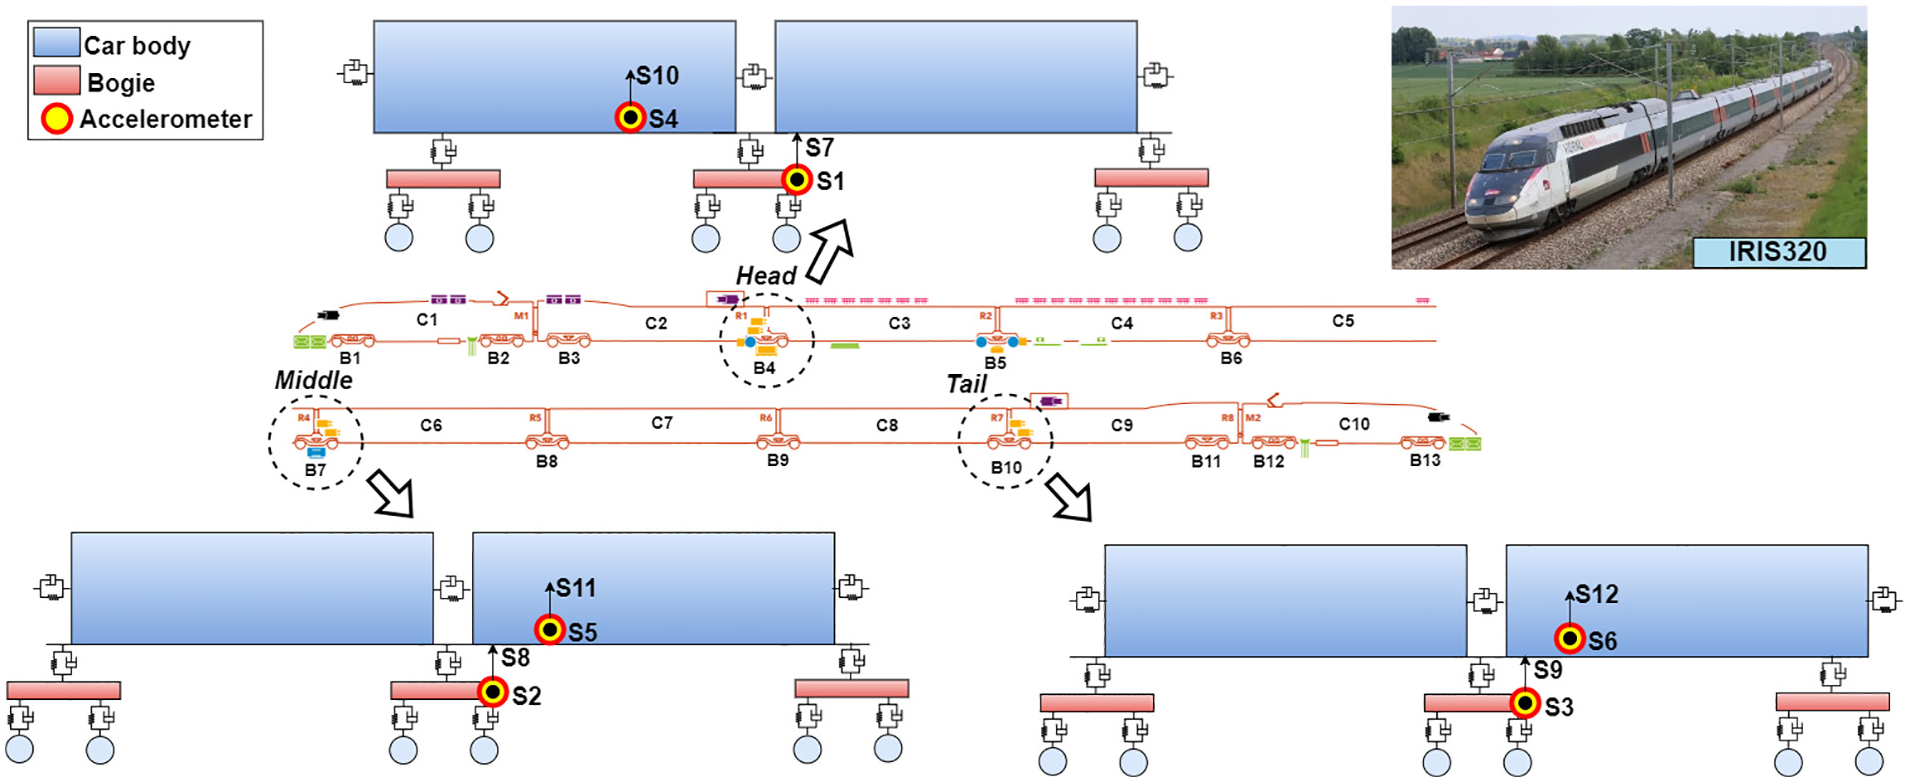
Layout of sensors on the IRIS320 train.
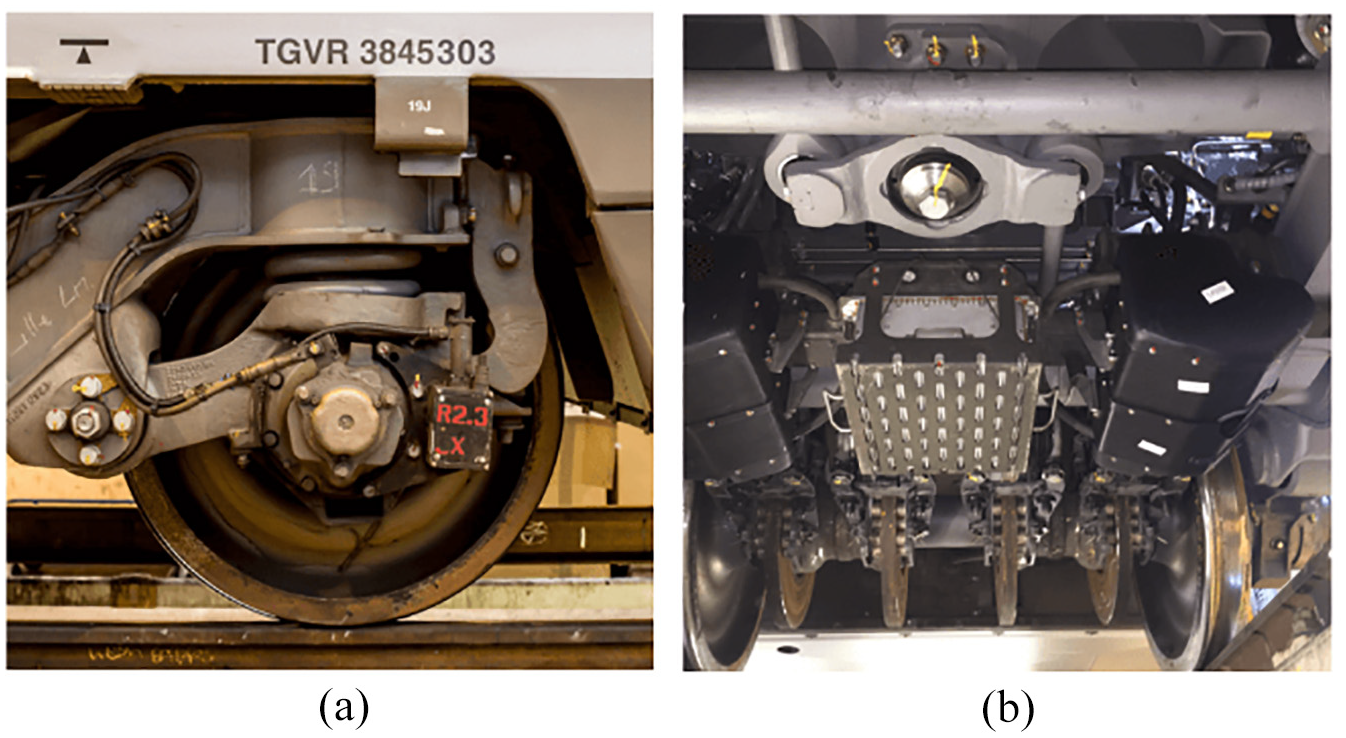
Monitoring systems: (a) accelerometer on bogie and (b) track geometry measuring system. 47
Number and locations of sensors.
In addition to the accelerometer sensors, the GEOV2 beam is utilized as a TGMS to accurately measure track geometry (both vertical and lateral) under realistic loading conditions transmitted by rolling stock, as depicted in Figure 4(b). Various parameters, including track level and alignment, twist, gauge, and cant, are processed according to SNCF standards (short and long wave bases). This system provides real-time or batch-processed measurement data that comply with the Mauzin and European standard (EN13848-2) for ranges D1, D2, and D3. 43 The IRIS320 system quantifies track irregularities by measuring the distance between a train’s bogie and four designated points on the rails. 44 This assessment is performed using two cameras positioned beneath the bogie, with lasers used to illuminate the rails. The system maintains a distance of 0.25 m between consecutive measurements along the track, which allows for precise estimation of track irregularities, considering that the smallest detected wavelength of these irregularities is 3 m. 45 However, movements of the bogie introduce bias into the track geometry measurements. To mitigate this bias, the data undergo post-processing, which includes eliminating the translational and rotational effects caused by bogie movements, using accelerometer and gyroscope data to make the necessary corrections. 46 It is important to highlight that TGMS measurements recorded while the train is traveling below 80 km/h are not correctly processed and have been excluded from the dataset. Additionally, instances where the cameras fail to capture accurate measurements, resulting in constant rail position values over several meters, have also been removed from the track geometry dataset. 45
In the framework of the Harmotrack project, the track geometry data set is divided into 60-m-long zones, in order to associate acceleration data with track geometry in each zone. 29 The condition of each track zone is determined by analyzing the geometry data recorded within that zone and comparing it against standard values outlined in the SNCF Réseau maintenance standard. 48 Any deviation from these standard thresholds is regarded as a track geometry defect. The recorded data set shows several defect types, which are given in Table 2 with their term in the SNCF Reseau maintenance standard and track geometry safety limits for high-speed track. 49 As the main purpose of this paper is to develop a defect detection algorithm, all the defect types are grouped as one class with the label of damaged state.
The track geometry defect.
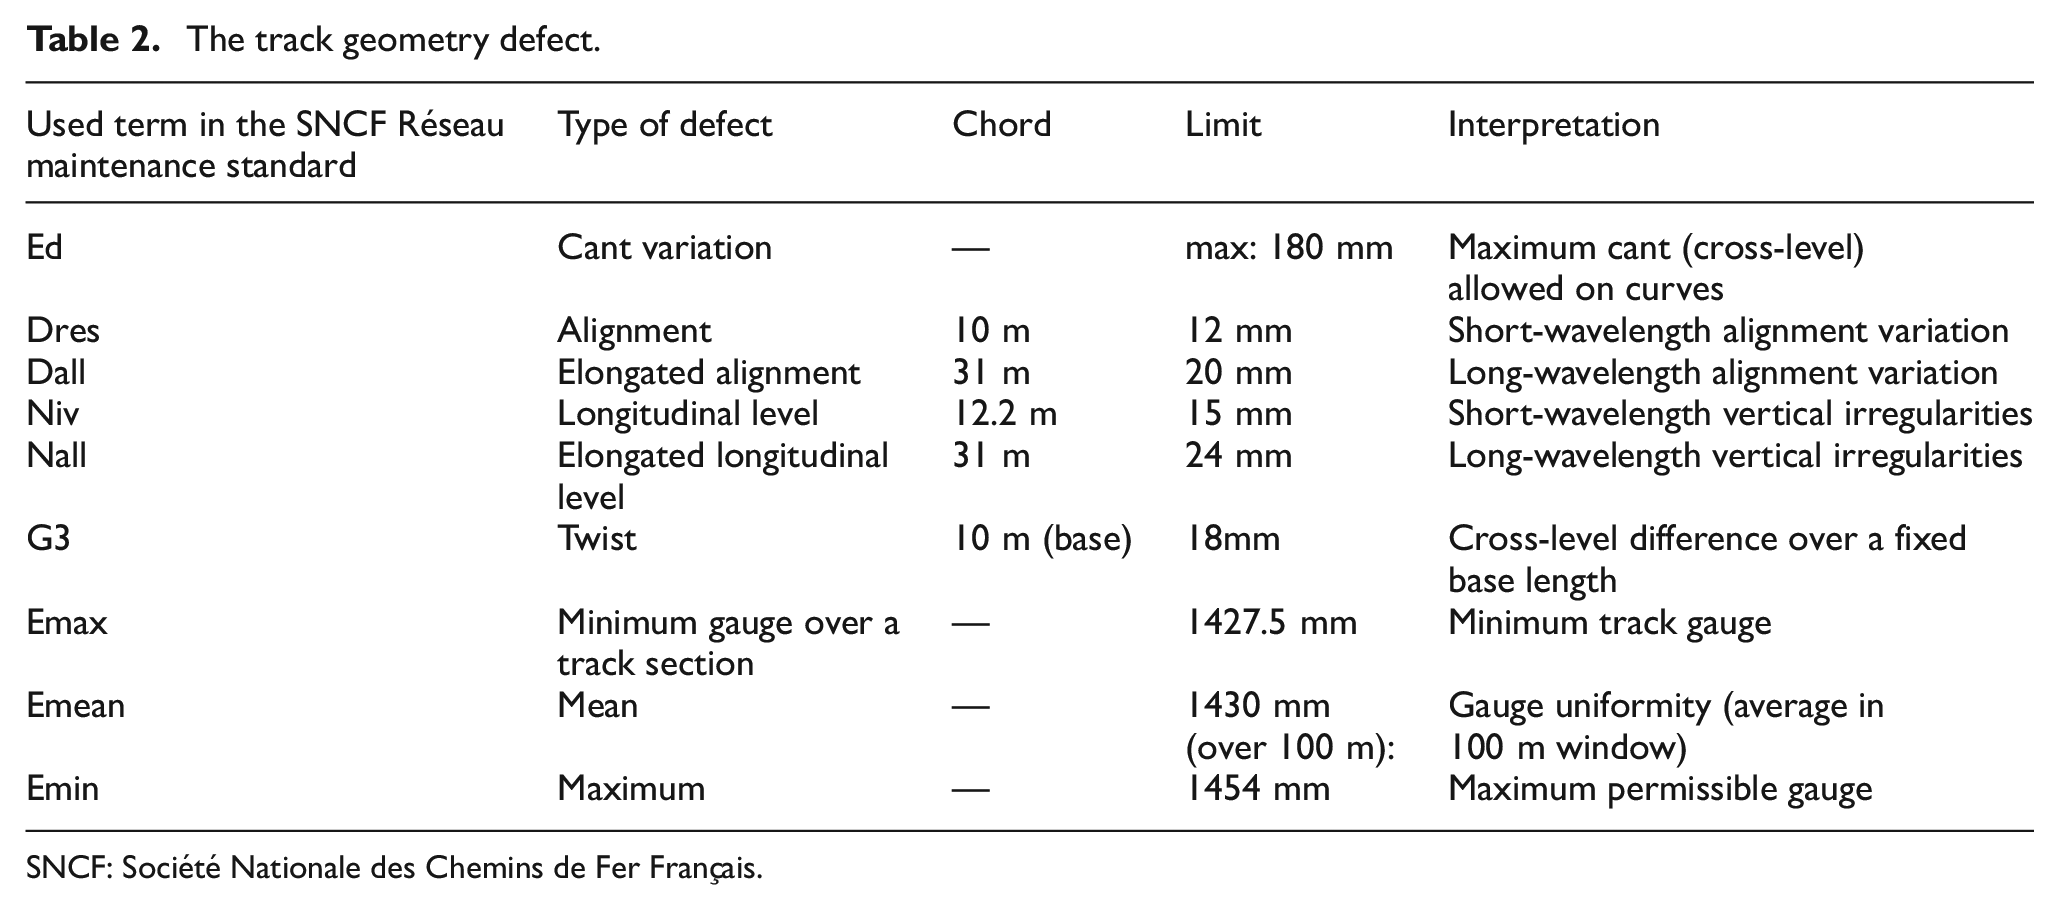
SNCF: Société Nationale des Chemins de Fer Français.
It’s important to note that the “normal state” refers to a condition of track geometry that complies with SNCF Réseau standards and does not require maintenance intervention. In this study, if one or more types of defects are observed within a zone, it is labeled as a defected zone (DZ), 29 indicating that the track within that zone is considered damaged. Conversely, zones without observed defects, where maintenance threshold exceedance is absent, are labeled as healthy zones (HZs).
The proposed framework
The overview flowchart of the proposed UDA-based framework for geometrical defect detection is shown in Figure 5, illustrating the system’s data flow. The framework comprises three main modules:
Data pre-processing module: This module extracts time-domain features from the recorded acceleration responses across different railway lines. These features are essential for subsequent analysis.
UDA module: The UDA module minimizes the domain discrepancy between the source and target lines. This ensures that the data distribution of the source line (source domain) becomes similar to that of the target line (target domain), overcoming the challenges posed by differences between the lines.
Damage diagnosis module: Once sufficient alignment of the data distributions is achieved, this module enables the model to detect geometrical defects in the track zones of the target line. It utilizes the aligned data to predict the condition of track zones in the target domain.
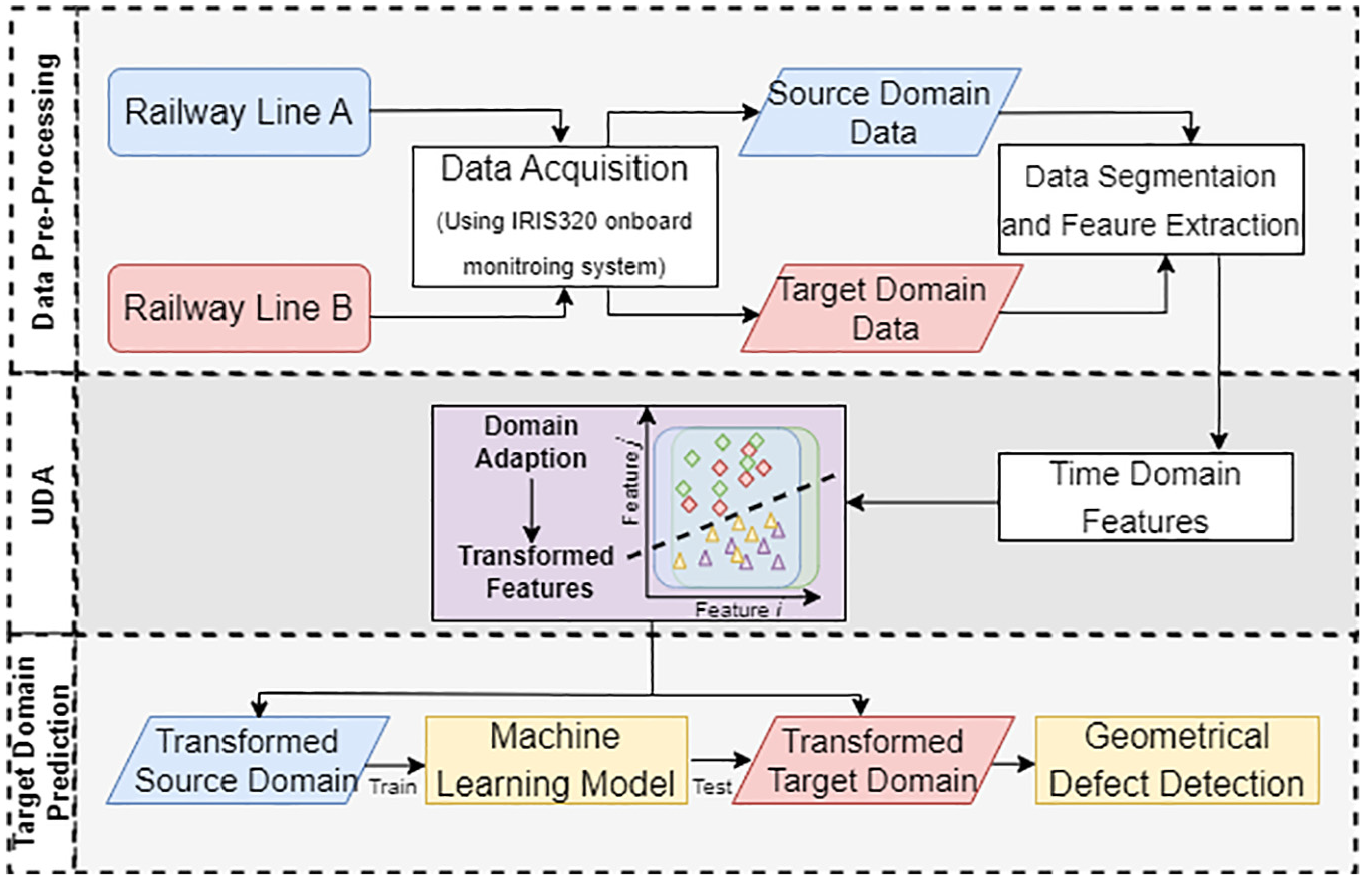
The schematic of the proposed UDA framework for drive-by railway track monitoring. UDA: unsupervised domain adaptation.
The framework uses labeled data from the source domain and unlabeled data from the target domain as input, ultimately producing predicted labels for the target domain. In the following subsections, each module is explained in detail.
Data pre-processing module
In this module, the input data for UDA are prepared by conducting data cleansing and computing the submodules of the “Data segmentation” and “Feature transform.” This module has its own three steps to pre-process the dataset. Figure 6 presents a flowchart that illustrates the dataset pre-processing steps. Initially, train acceleration responses and track geometry data are collected. The recorded track geometry dataset is then processed as outlined in the fourth section to identify the HZs/DZs.
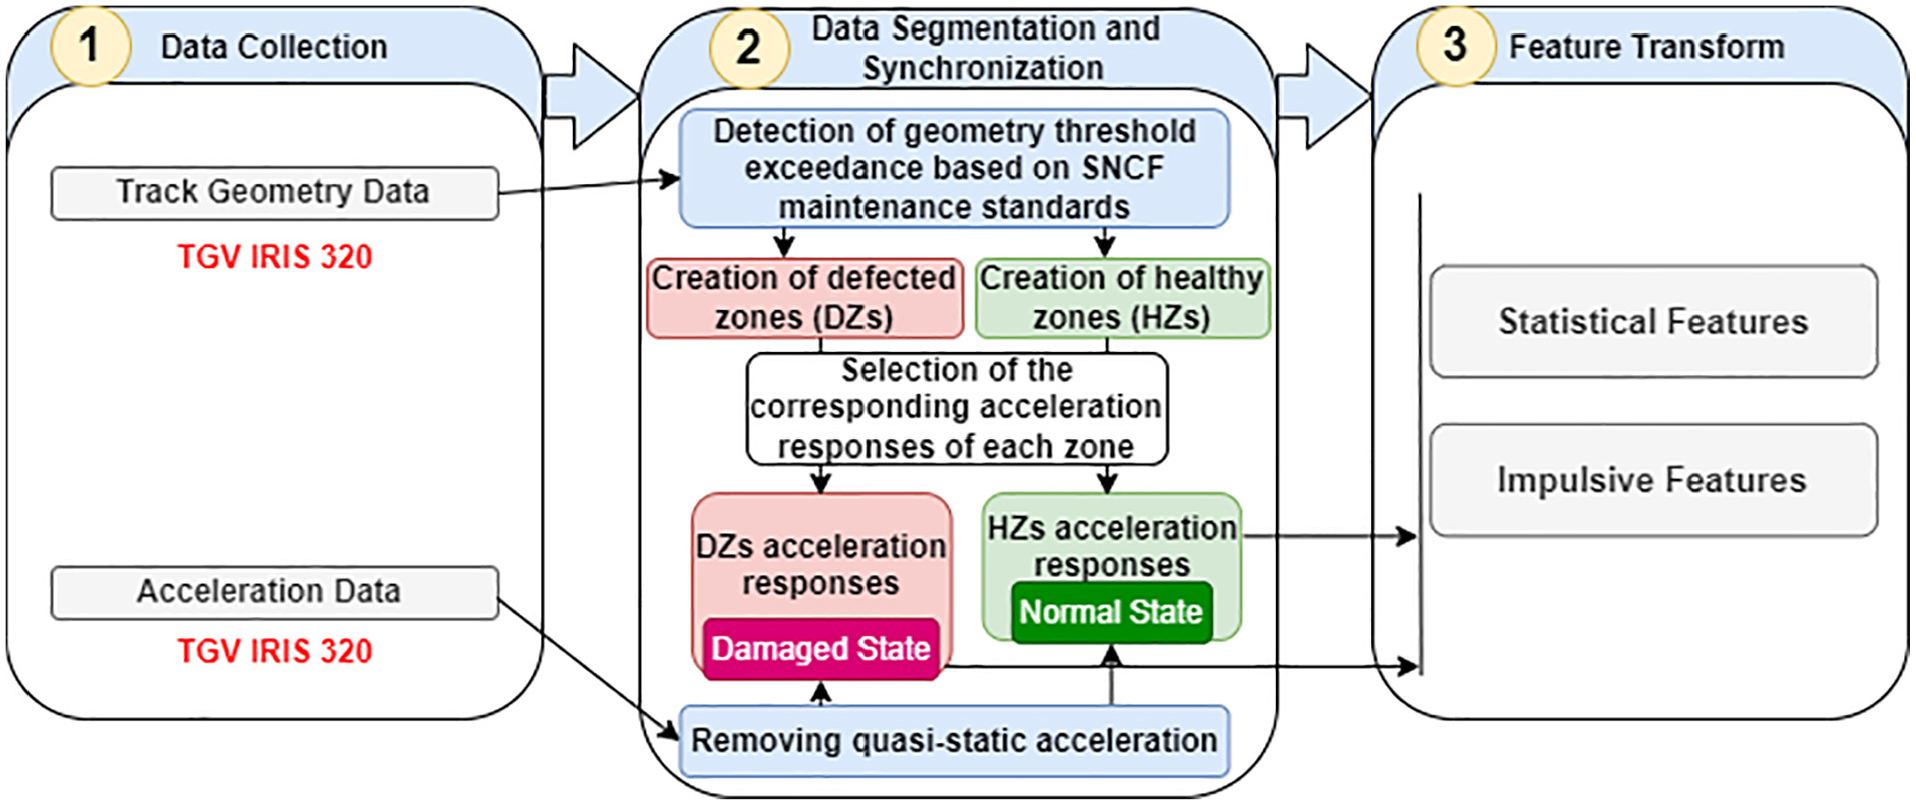
Flowchart of the pre-processing module for creating HZs and DZs based on geometry dataset and normal/damaged state of the corresponding acceleration responses and features extraction. DZ: defected zone; HZ: healthy zone.
It is worth noting that the track layout can induce quasi-static lateral acceleration due to centrifugal forces. To eliminate this effect from the measured acceleration signals and ensure consistency across the dataset, frequencies below 0.4 Hz were filtered out to remove quasi-static rigid body movements (caused by the spatial evolution of the track design). 45 A band-pass filter with a gradient of −24 dB per octave was applied to the acceleration signals. This filtering process improves the correlation between track geometry and measured acceleration by ensuring that the retained acceleration components primarily reflect perturbations due to actual track geometry conditions, rather than effects introduced by the track layout. 28 Each zone is categorized based on its state: if a zone is in good condition, its corresponding acceleration response is classified as “Normal.” In contrast, if a zone exhibits defects, its acceleration response is marked as “Damaged.” By the end of step 2, an efficient coherent dataset is created that correlates geometrical data and acceleration measurements, in a way that the acceleration response set of each HZs and DZs is specified.
The feature transforms are then applied to the acceleration responses part of this coherent dataset to create the feature space. To do so, the statistical metrics of each acceleration record is calculated. Statistical metrics, whether in the time domain, frequency domain, or time-frequency domain (wavelets), are frequently employed for extracting features from raw signal data. 50 Significant track irregularities can lead to alterations in the amplitude and distribution of the time-domain signal, compared to signals induced by minor irregularities. Similarly, changes may occur in the frequency spectrum and its distribution, potentially resulting in the emergence of new frequency components linked to track severity. 51 In this study, only time-domain metrics are utilized due to their ease of implementation. These metrics are: mean, standard deviation (Std), root mean square (RMS), skewness, peak value, crest Factor, clearance Factor, and impulse factor. These indexes are selected based on recommendations from previous works in this field.52,53
The size of the feature matrix is
Hence, the final dataset is obtained that linking various accelerometric metrics to corresponding track geometry defects.
UDA module
In this module, the UDA algorithm is trained to obtain a domain-invariant and class discriminative feature representation that extracted from the input data using PDALC algorithms. It is worth noting that the proposed framework is general so each of the previously mentioned UDA algorithms can be used for this module. However, PDALC is mentioned here as the main algorithm because of its unique mechanisms of geometric structure alignment and pseudo-label correction. As detailed in the second section, PDALC leverages class discriminative information for subspace learning to acquire the domain invariance subspace. Additionally, a mechanism for pseudo label correction is employed to assess the reliability of pseudo labels and rectify any inaccuracies present. Through the integration of subspace learning and label correction, PDALC demonstrates a continuous enhancement in performance, thereby mitigating the occurrence of inaccurate pseudo labels.
The problem addressed in this study represents a typical homogeneous DA scenario. Specifically:
the source and target tasks are identical, both aiming to identify the conditions of railway track zones;
the feature spaces in both the source and target domains are the same, as both domains contain the same set of statistical features extracted from the acceleration responses of a moving train across different track zones; and
the data (or samples) are distributed unevenly between the source and target domains, as the feature matrices are collected from distinct railway lines, leading to distributional difference.
More precisely, the goal of each task is to develop a model capable of determining whether a 60-m-long track segment is in a healthy (normal) or defective condition, in accordance with the SNCF maintenance standard. The model is trained using acceleration-based features extracted from one railway line (source domain) and then tested on corresponding features from another line (target domain), thus evaluating the model’s ability to generalize across different track environments.
Target domain prediction module
The UDA algorithms employed in this study aim to discover the latent space where the source and target datasets are aligned. Using these UDA methods, any classifier can be trained on datasets that are transformed to the latent space. Therefore, the classifier can transfer knowledge from a labeled source dataset to an unlabeled target dataset on that space. In this paper, to ensure a fair comparison, the SRM classifier is employed for all UDA algorithms. Also, to assess the effect of changing the classification algorithm on the overall efficiency of the proposed framework, the results of SRM (kernel = linear) have been compared with support vector machine (SVM) (kernel = polynomial),
Moreover, the performance metric utilized in this study is the classification accuracy on the target domain. This metric, commonly employed in previous research, is defined as:
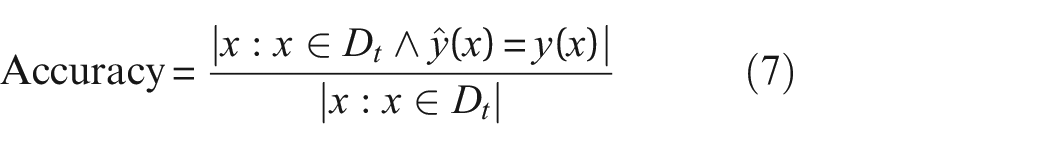
where
The results
In this section, the experimental dataset detailed in the third section is used to evaluate the efficacy of the proposed framework for DA in railway track monitoring, as elaborated in the fourth section. The collected datasets of IRIS320 for four different railway lines in the French railways TGV high-speed trains network are used as case study for this paper. Table 3 provides detailed information about each dataset, including the scale of the feature matrix used as input for the UDA algorithm and the train speed statistical indices (mean, Std, min/max) for each line. These four lines were selected from the available dataset to represent a diverse range of geographic locations, defect types, and dataset sizes. This selection ensures that the chosen datasets are appropriately representative of the broader collection gathered during the Harmotrack project.
The details of different lines in Harmotrack dataset.
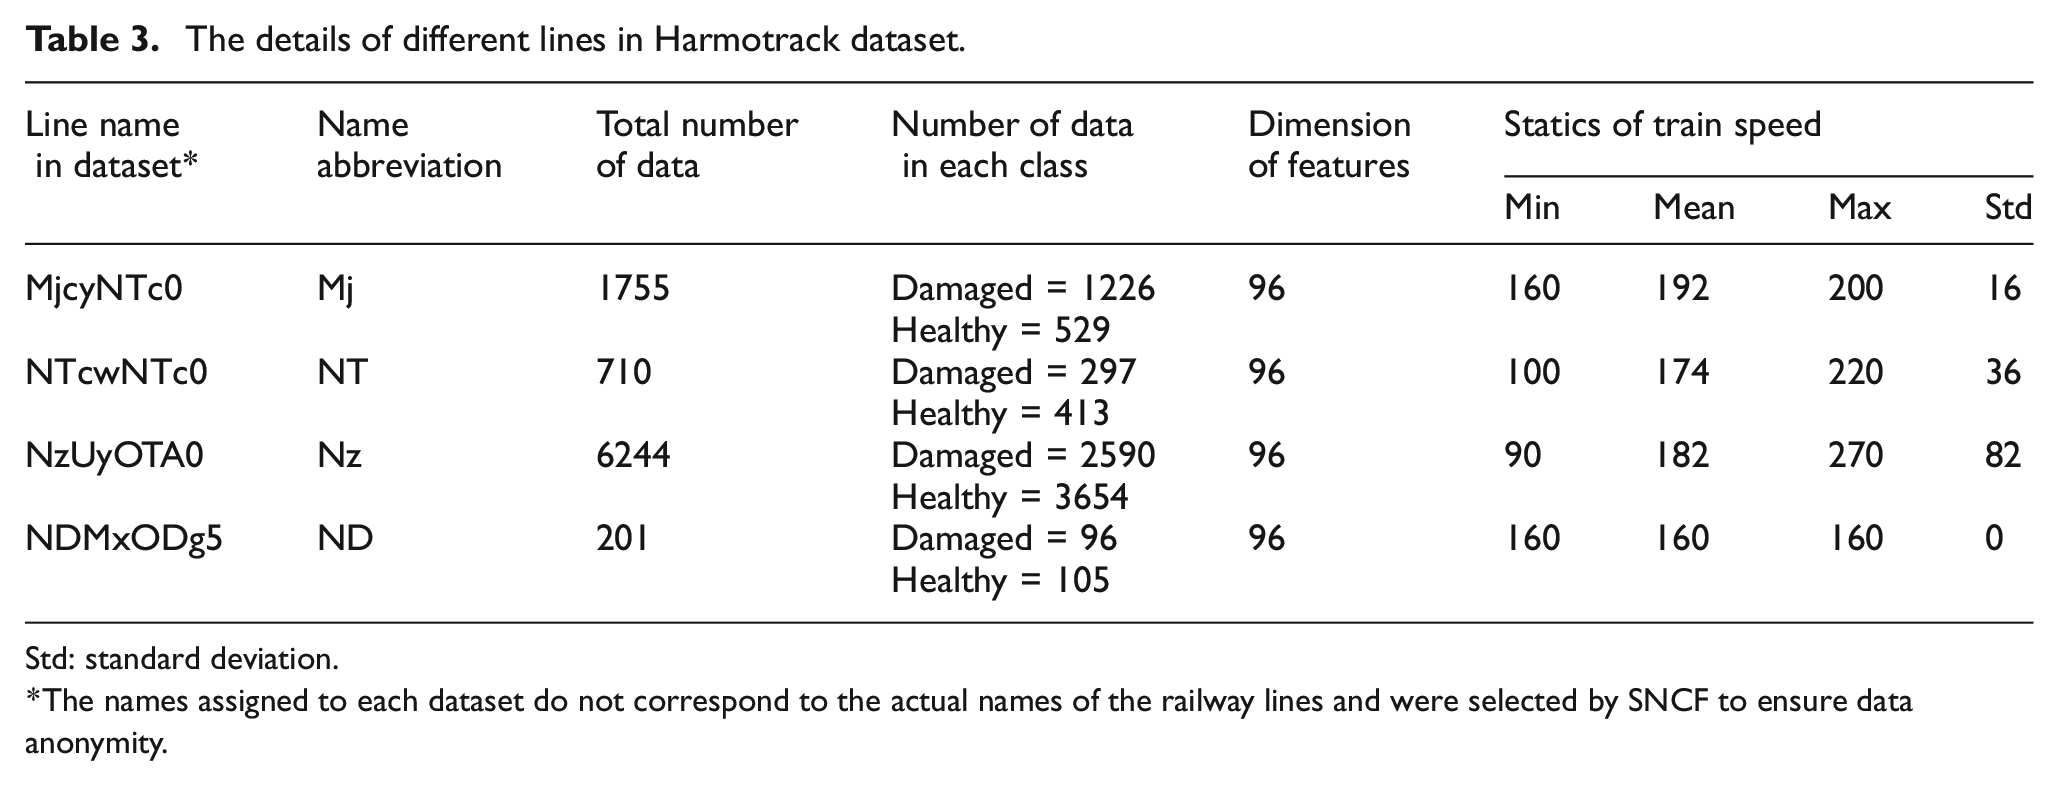
Std: standard deviation.
The names assigned to each dataset do not correspond to the actual names of the railway lines and were selected by SNCF to ensure data anonymity.
With 12 sensor directions and 8 features corresponding to the measured signals in each direction, a total of 96 feature values are computed for each HZs/DZs.
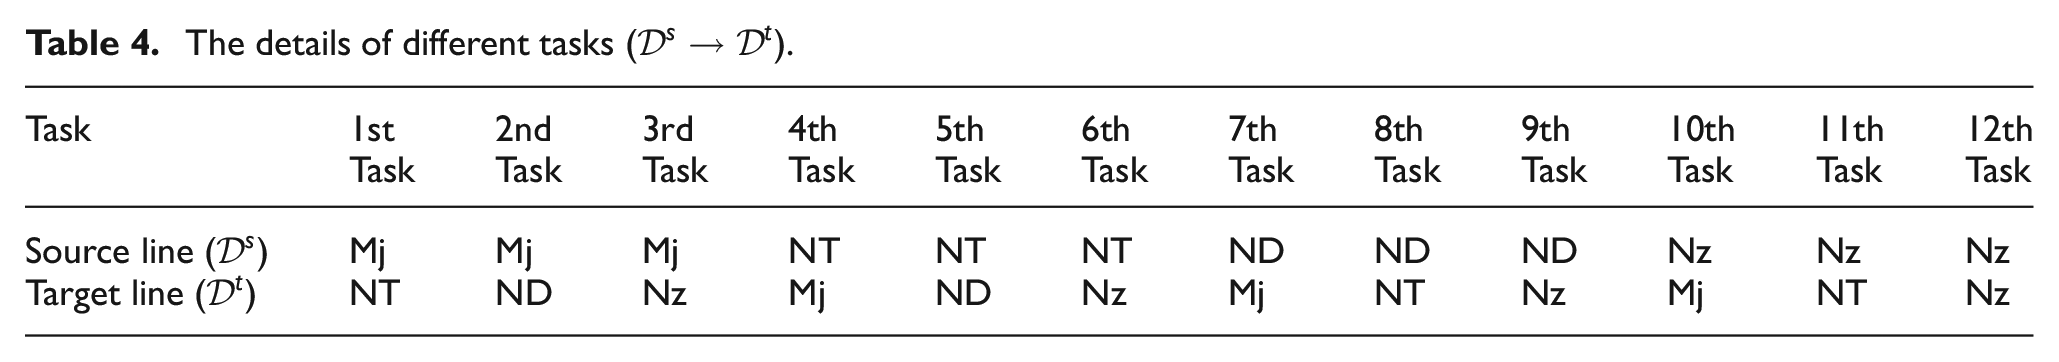
Since the information extracted from four different lines is considered as different domains, in total 12 different permutations of source and target data selection can be considered. Table 4 presents the list of tasks that are designed for this study. In each task, feature matrix of one of line is selected as source domain data and feature matrix of another line is selected as target domain data. The designed tasks cover potential scenarios typically encountered in real applications.
The details of different tasks (
In order to evaluate the performance of the proposed framework based on PDALC, several state-of-the-art UDA methods are employed for comparison: LRSR,
32
GFK,
33
TCA,
34
and McDA.
35
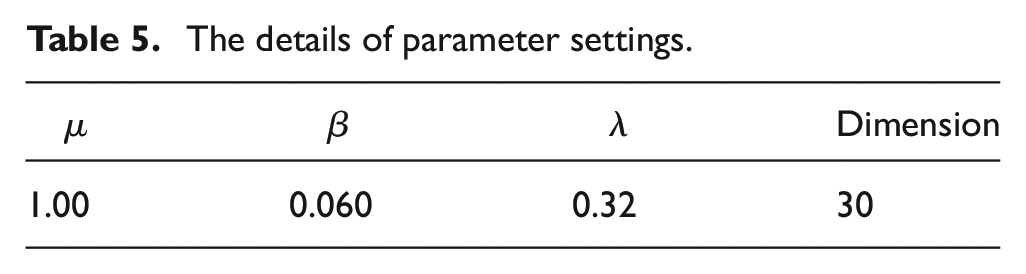
Moreover, considering the time-consuming nature of the two loops within PDALC, the number of iteration
The details of parameter settings.
On the other hand, to assess the effectiveness of the UDA method, the disparity between domains in the latent space is quantified. Ben-David et al. 55 introduced the ProxyA-Distance (PAD) metric to quantify the similarity between the feature representations of samples from the source and target domains in DA scenarios. The PAD is computed using samples from the latent space, which are typically used to align discrepancies between domains. It is defined as:

Here,
Data distribution shift for train-track systems
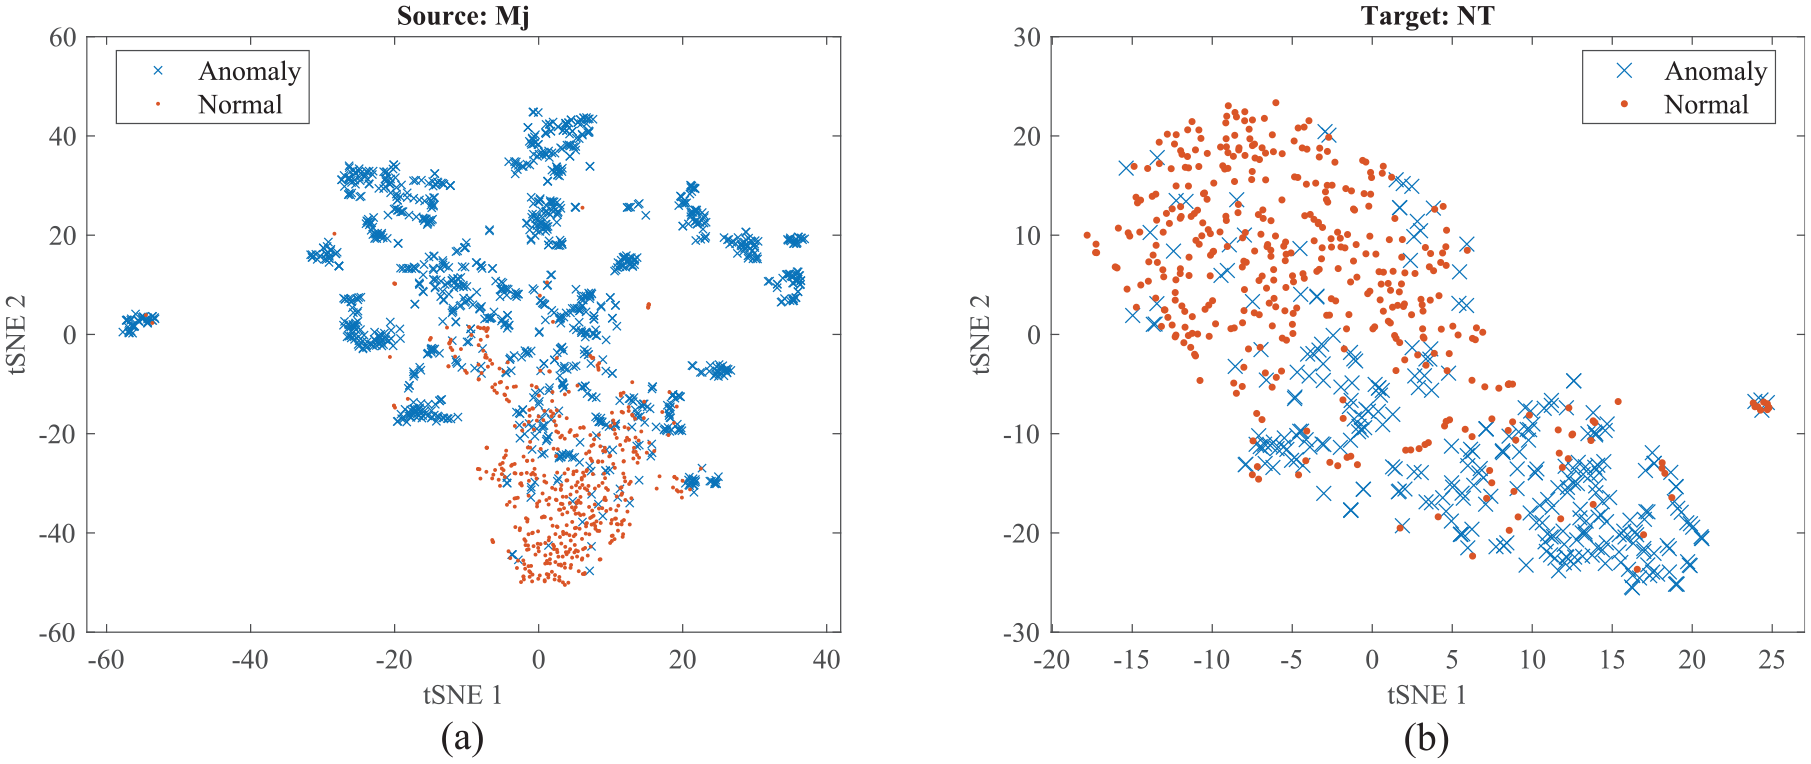
The joint distributions of the train vibrations and damage labels are shifted as the train passes by different lines. To intuitively observe the data distribution, two datasets, Line Mj and Line NT, are examined. With a total of 96 features extracted from all the sensors, the feature set is too high-dimensional to be observed directly. High-dimensional features can be visualized in a low-dimensional space using t-distributed stochastic neighbor embedding (t-SNE), a nonlinear dimensionality reduction technique. 56 Figure 7 shows the t-SNE-based feature visualization results of the recorded samples, where the features are mapped onto a two-dimensional (2D) scatter plot. In this plot, each point represents a sample, with its category indicated by color: red for normal conditions and blue for defected conditions. As seen in Figure 7, the data distributions from the two domains do not exhibit clear separations between categories, indicating that the feature spaces of the two domains are similar but not identical. This suggests that addressing both the marginal and joint distributions is crucial for effective DA. Moreover, the features appear scattered and unclustered, both in the source domain (Mj) (Figure 7(a)) and the target domain (NT) (Figure 7(b)). This disordered distribution implies that a classifier trained on the source domain may not generalize well when applied to the target domain.
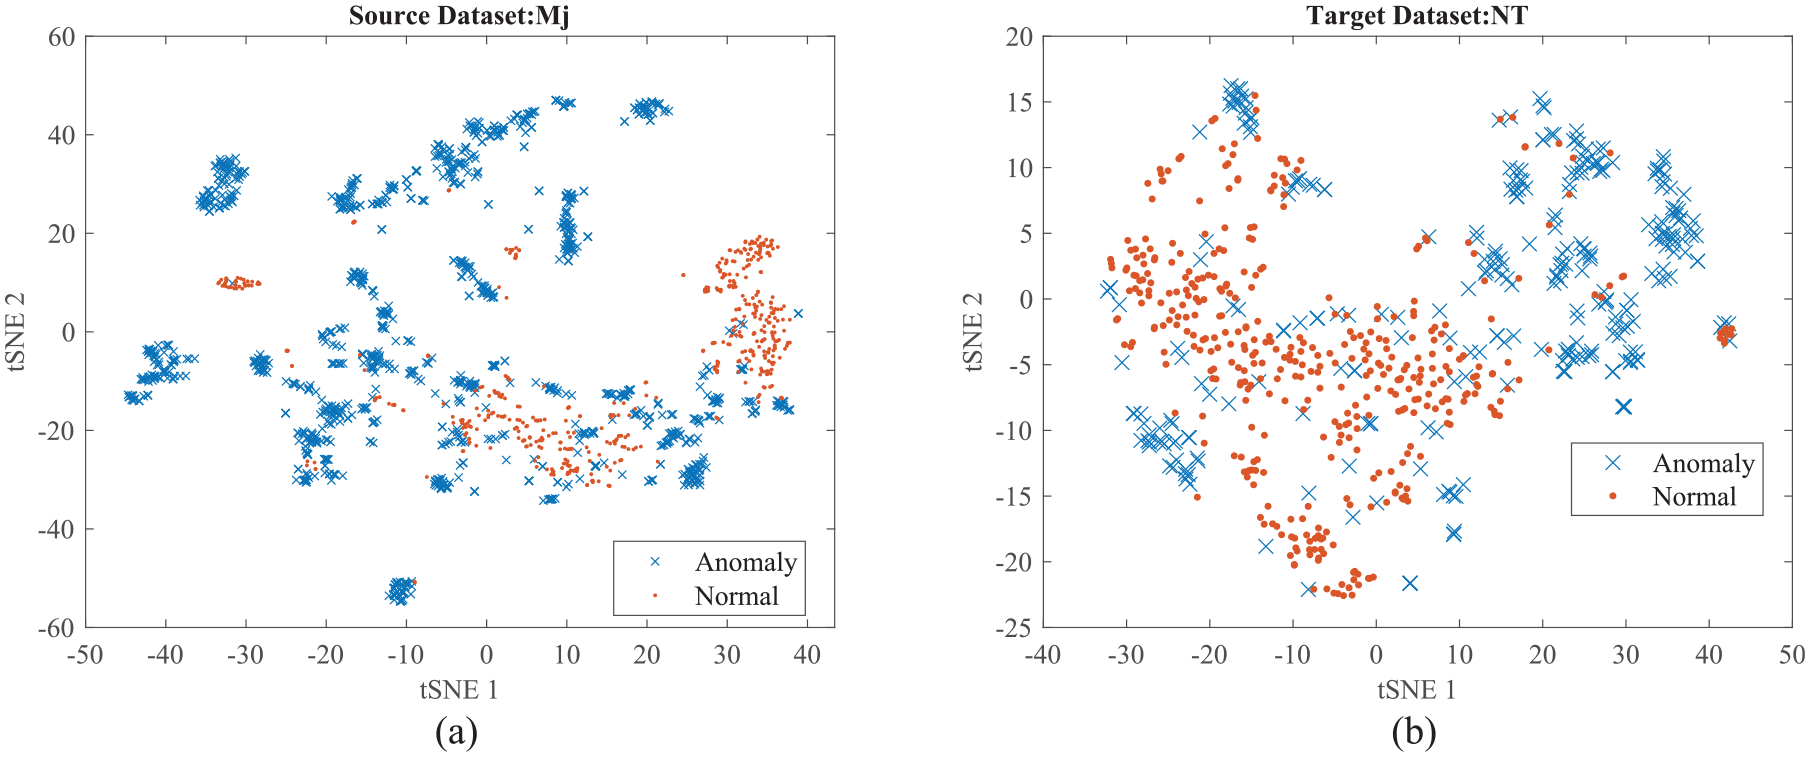
The 2D t-SNE visualization of feature data distributions: (a) source line and (b) target line (before UDA). 2D: two dimensional; t-SNE: t-distributed stochastic neighbor embedding; UDA: unsupervised domain adaptation.
One of the main reasons for the distribution shift observed between datasets from different railway lines is the variation introduced by changes in EOVs during data collection. These EOV-induced shifts significantly affect the statistical properties of the recorded signals, contributing to discrepancies between source and target domains. This distributional mismatch underscores the necessity of applying DA methodologies to develop a generalized railway track geometrical defect detection system. The primary goal of such methods is to discover a shared latent feature space where the source and target datasets can be better aligned, thereby enabling more robust and transferable defect detection across different railway environments.
In order to investigate the impact of PDALC implementation on data distribution, the distribution of the first two features specifically analyzed. Figure 8 illustrates the distribution of maximum of acceleration response that extracted from sensors
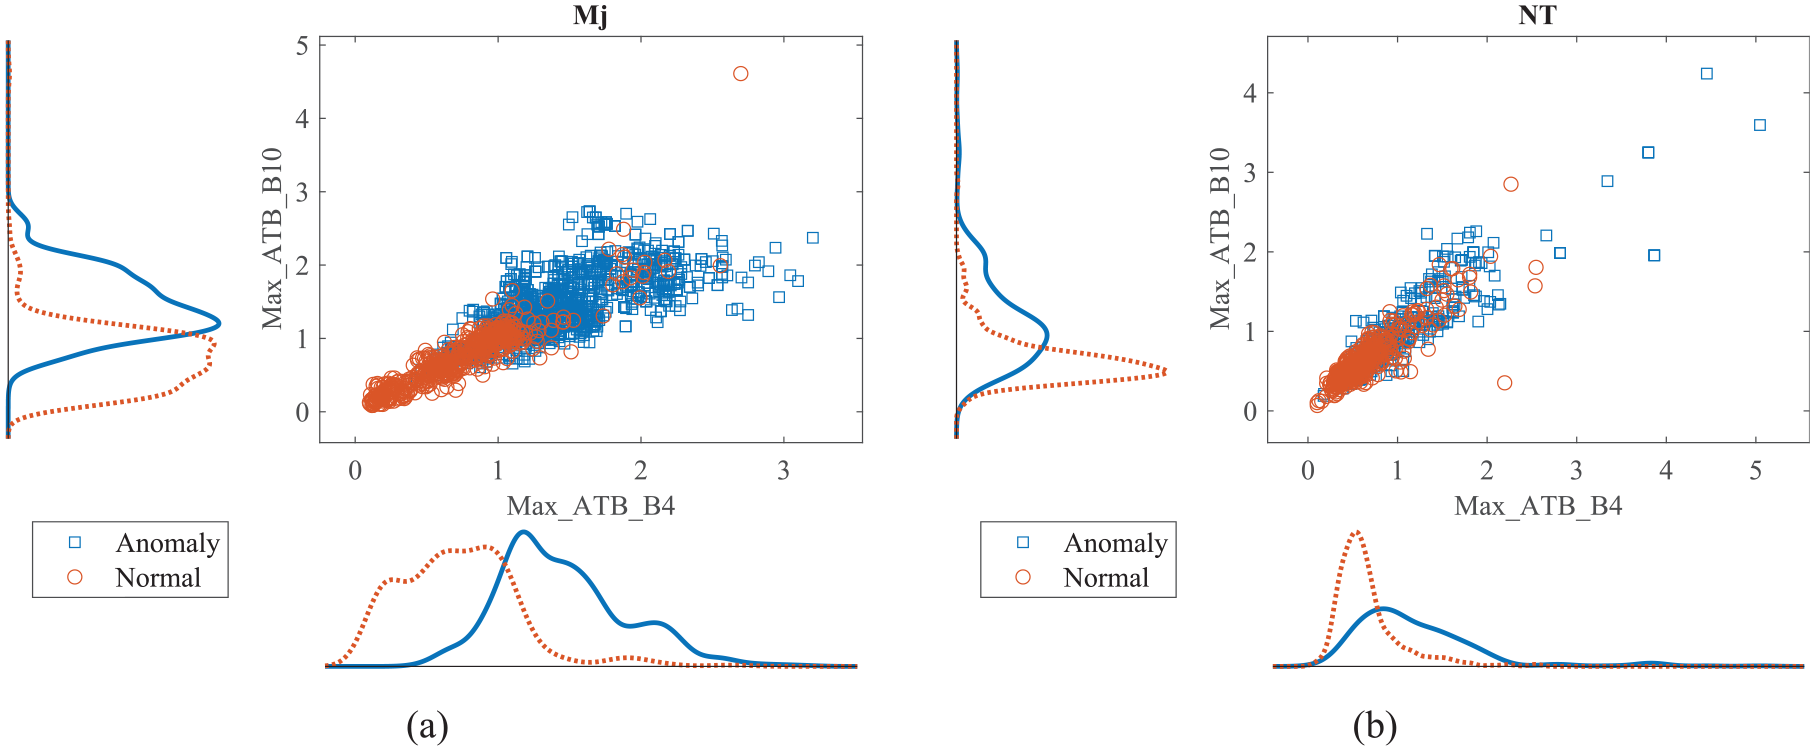
Scatter plot with marginal histograms of feature data distributions: (a) source line and (b) target line (before UDA). UDA: unsupervised domain adaptation.
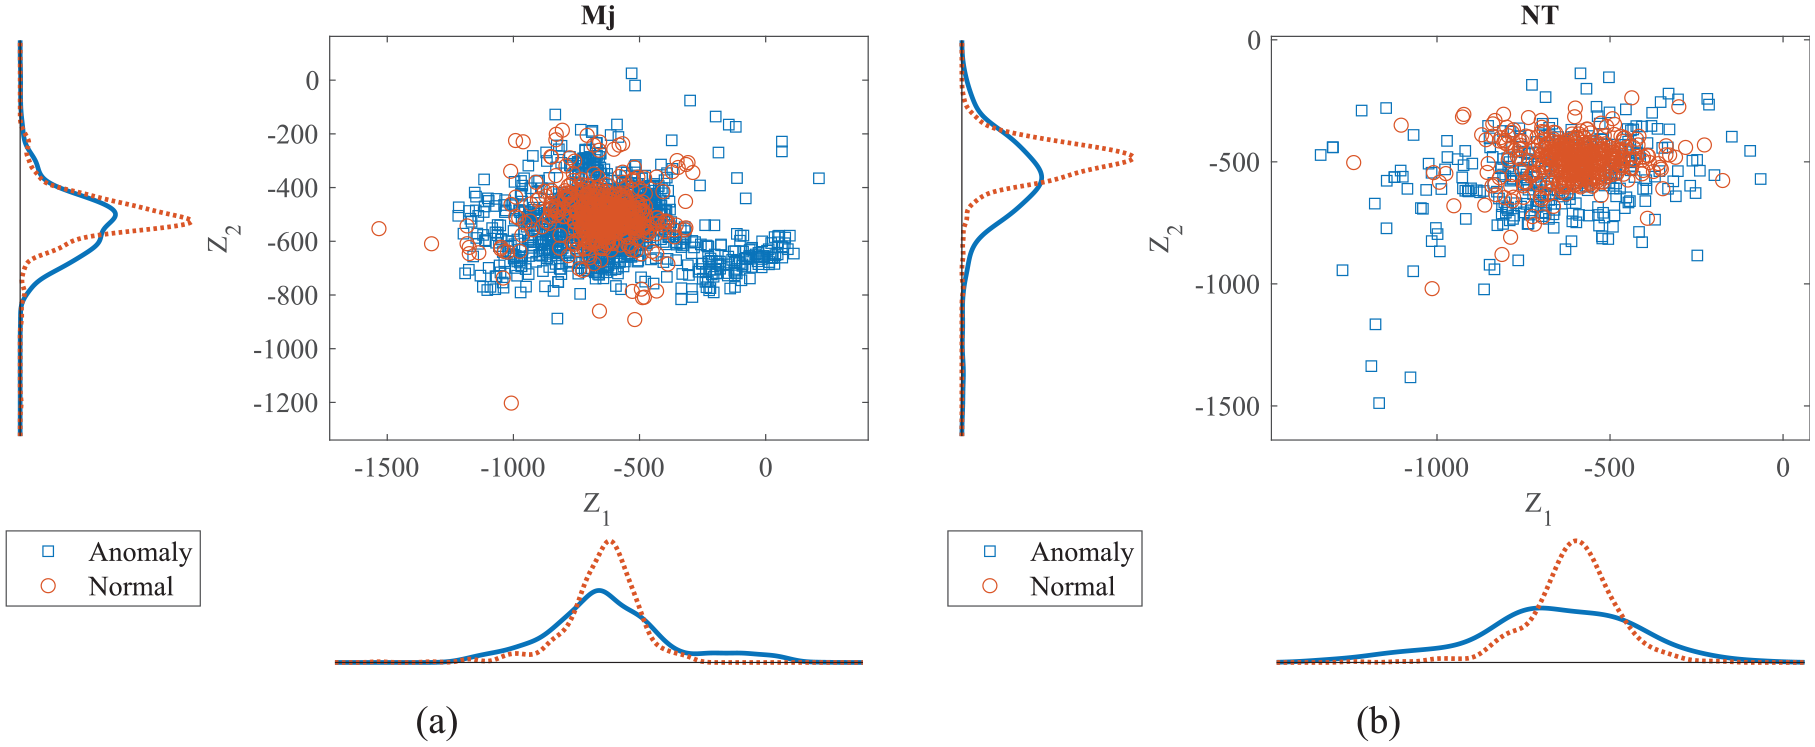
Scatter plot with marginal histograms of feature data distributions: (a) source line and (b) target line (after UDA). UDA: unsupervised domain adaptation.
To demonstrate this process for all extracted features, 2D visualization of feature data distribution following the application of the PDALC algorithm is presented in Figure 10. A comparison with Figure 7 reveals a closer alignment between the data distribution of the source and target domains. Furthermore, the classification of data into normal and defective states of the rail showed improvement post-PDALC algorithm application. A clearer boundary between these two classes emerged, aiding in enhancing the performance of the classification algorithm.
The 2D t-SNE visualization of feature data distributions: (a) source line and (b) target line (after UDA). 2D: two dimensional; t-SNE: t-distributed stochastic neighbor embedding; UDA: unsupervised domain adaptation.
Performance comparison with baseline method
To quantitatively evaluate the impact of the proposed UDA framework, SRM models are trained as straightforward benchmark machine learning approaches using the labeled source data and subsequently tested on the unlabeled target data. The UDA algorithms employed include TCA, GFK, McDA, LRSR, and PDALC. Additionally, line “Mj” is designated as the source domain, while line “NT” is designated as the target domain. The results are shown in Figure 11. The classification accuracies that displayed in header of each plot are calculated using SRM as the damage classifier. Results indicate that PDALC outperforms other UDA algorithms, achieving an 83% accuracy rate in detecting geometric defects on the railway track of the target line. Compared to the baseline model, PDALC exhibits a notable increase of over 12% in classification accuracy. Among the other algorithms, the performance order is as follows: GFK > LRSR > TCA > McDA > Baseline model. This suggests that utilizing any UDA algorithm enhances classifier performance by at least 4%.
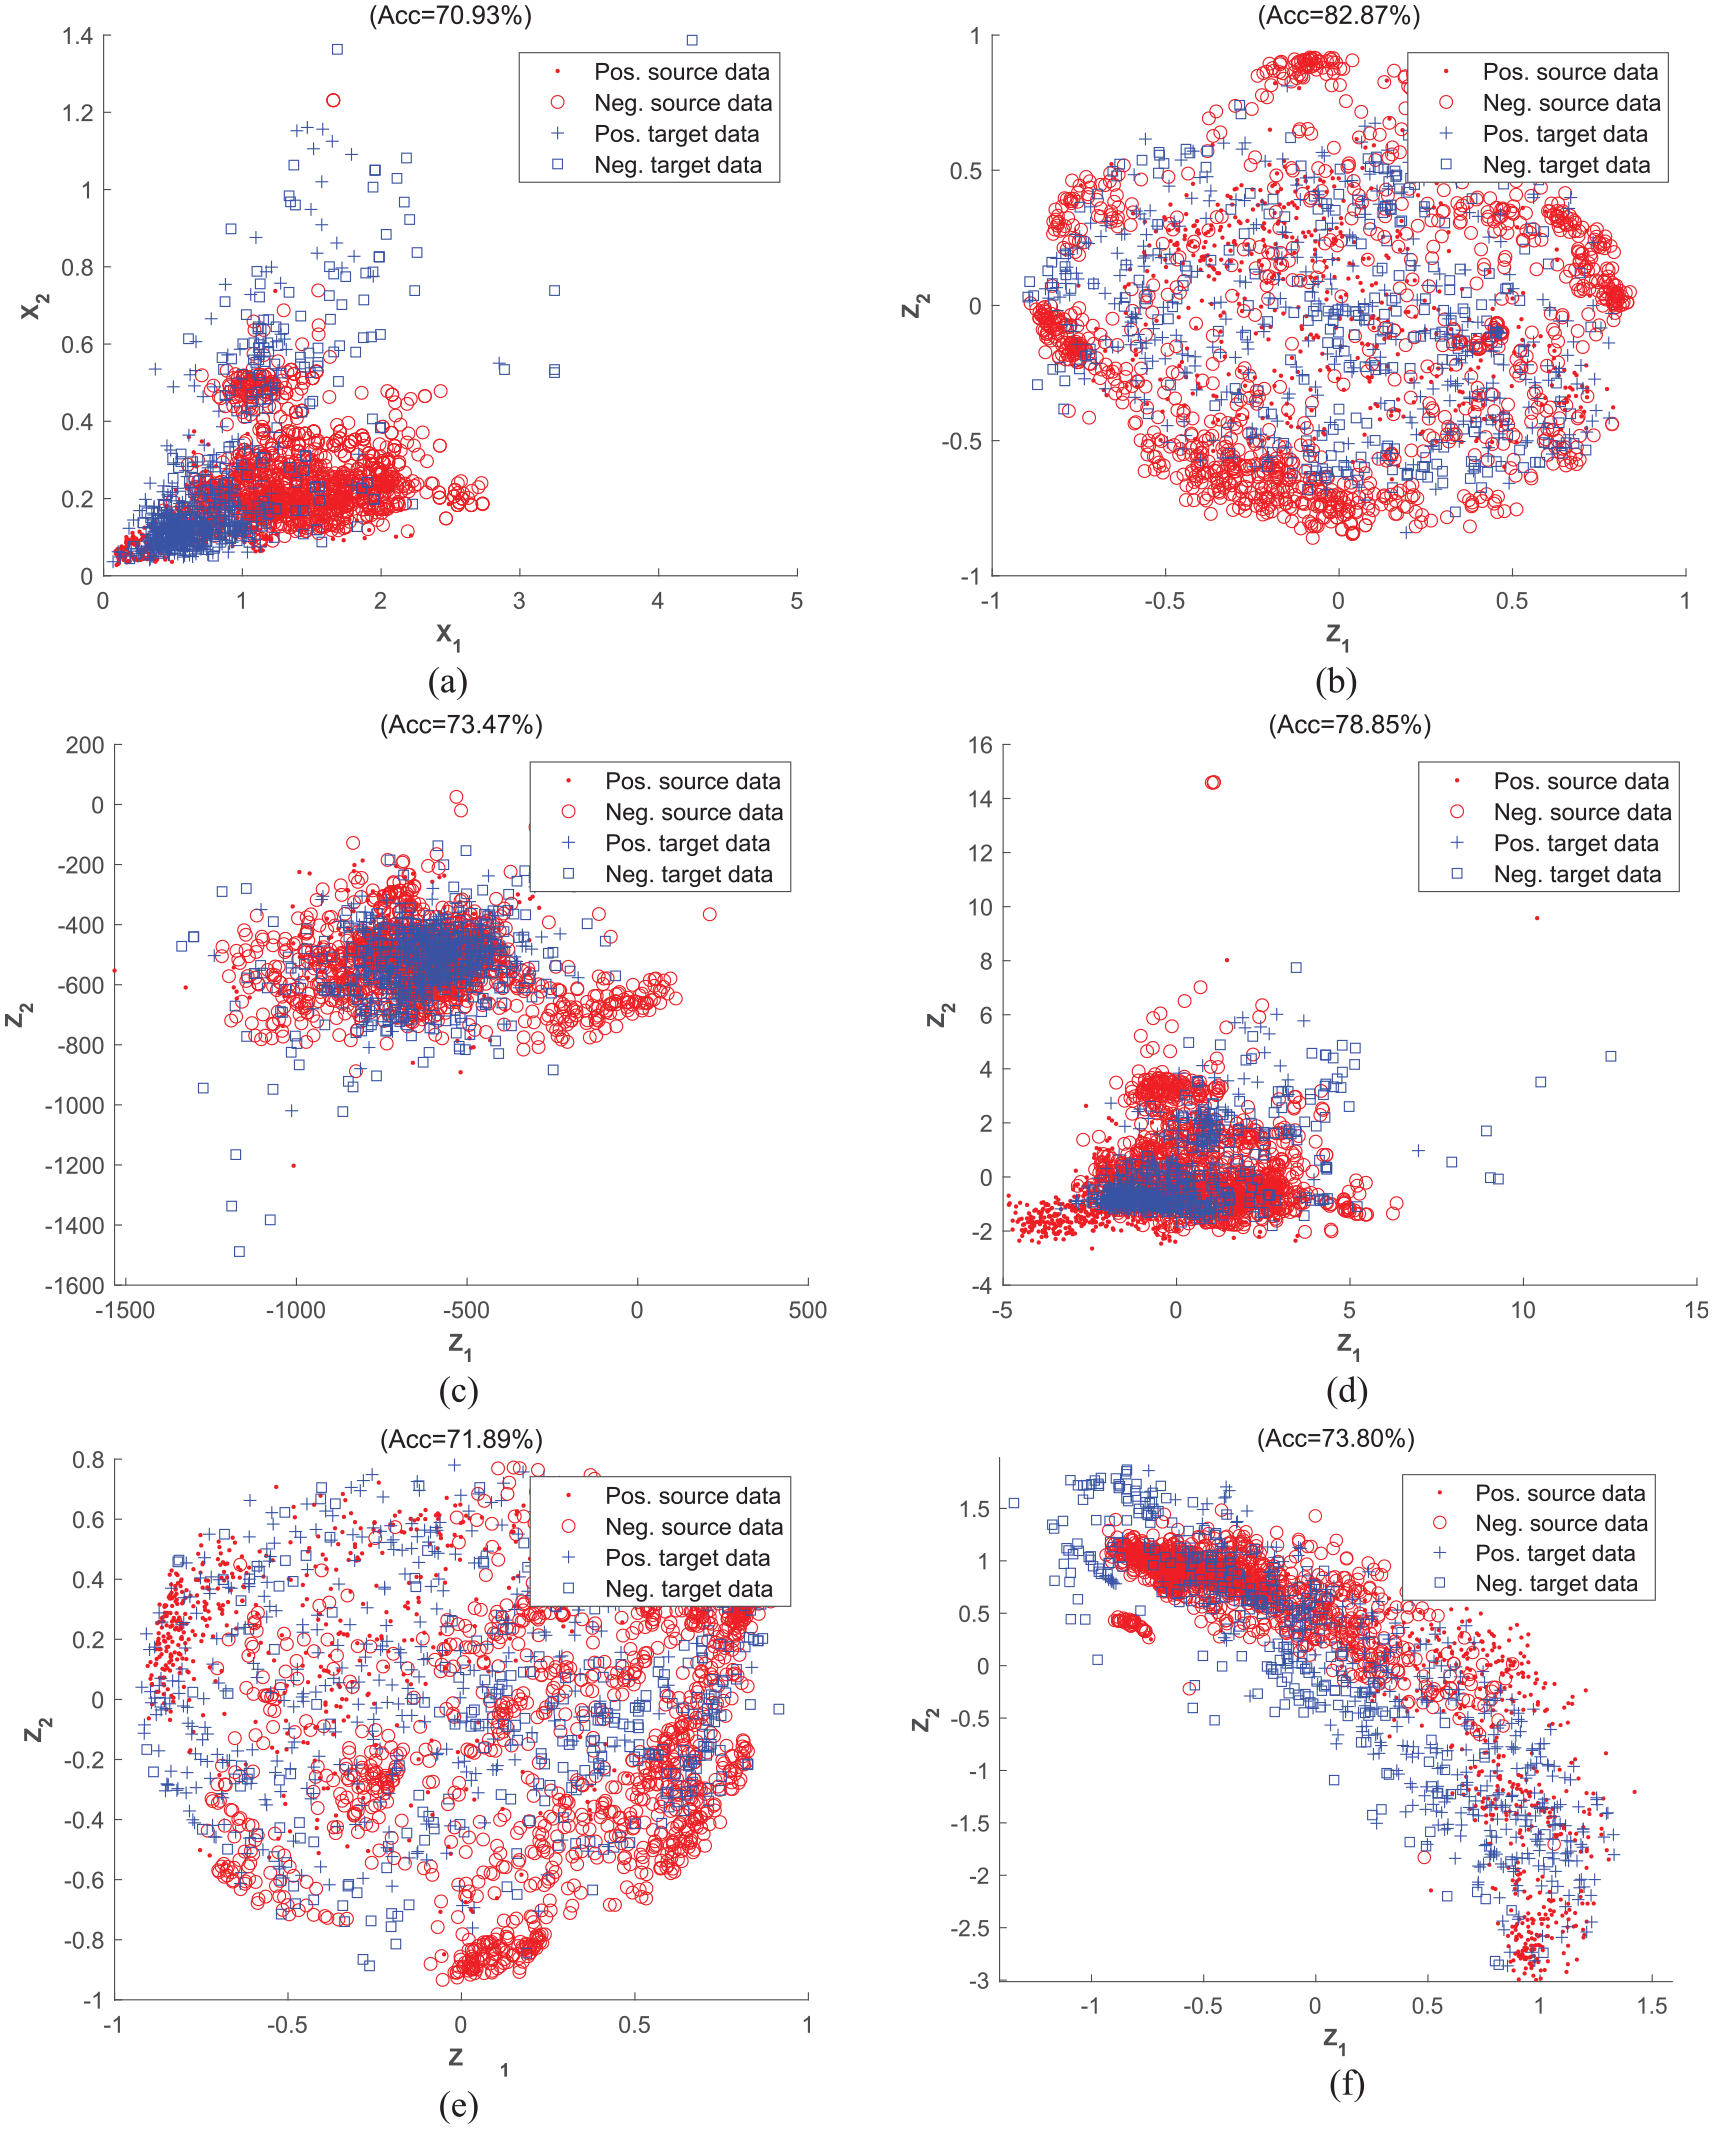
Comparison of detection accuracy of TCA, GFK, McDA, LRSR, and PDALC on first task, plotting the data in different spaces: (a) the original space, (b) projected spaces of PDALC, (c) projected spaces of TCA, (d) projected spaces of GFK, (e) projected spaces of McDA, and (f) in projected spaces of LRSR. TCA: transfer component analysis; McDA: maximum mean and covariance discrepancy; LRSR: learning via low-rank and sparse representation; GFK: geodesic flow kernel; PDLAC: progressive distribution alignment based on label correction.
In order to verify the validity of the proposed method on a larger data set and also to investigate the effect of changing the source and target data on the accuracy of the PDALC algorithm, a comparison is made between 12 different tasks that is mentioned in Table 4. The experiment results are summarized in Table 6, with the best results highlighted in bold. As anticipated, the SRM classifier trained on unadapted features exhibits poor generalization when applied to another line, which can be considered as employing a classifier trained via a traditional SHM approach. As shown in Table 6, the proposed method based on PDALC has yielded promising experimental outcomes on the Harmotrack dataset. The UDA framework leveraging PDALC has achieved the best results in 9 out of the 12 subtasks, with its average accuracy nearly 11% higher than the baseline model. Moreover, the average accuracy of the PDALC method exceeds that of GFK (the second-best algorithm) by 3%, and its Std is lower than that of GFK. This suggests that while domain shift may impact classification accuracies, such influence can be mitigated using an appropriate DA algorithm. One possible reason for the superior performance of the PDALC method is its integration of a label correction mechanism with manifold subspace learning, which helps preserve the geometric structure of the original data. In each inner loop of the PDALC algorithm, the confidence coefficient matrix (Equation (4)) is updated to enhance the reliability of pseudo-labels for each sample. On the Harmotrack dataset, this label correction procedure improves classification accuracy by approximately 5–7% across different tasks. For example, in task 1, the initial accuracy of the PDALC algorithm is 76%, which increases to 82.9% after applying the label correction mechanism. This improvement corresponds to correcting the labels of approximately 42 samples (calculated as (Final Accuracy − Initial Accuracy) × Number of Target Samples) that were misclassified in the initial step. As a result, the model’s performance improves iteratively, progressively reducing the number of incorrect pseudo labels over time. This iterative refinement enhances the overall accuracy and effectiveness of the model.
Classification accuracy (%) of various UDA algorithm on Harmotrack data set.
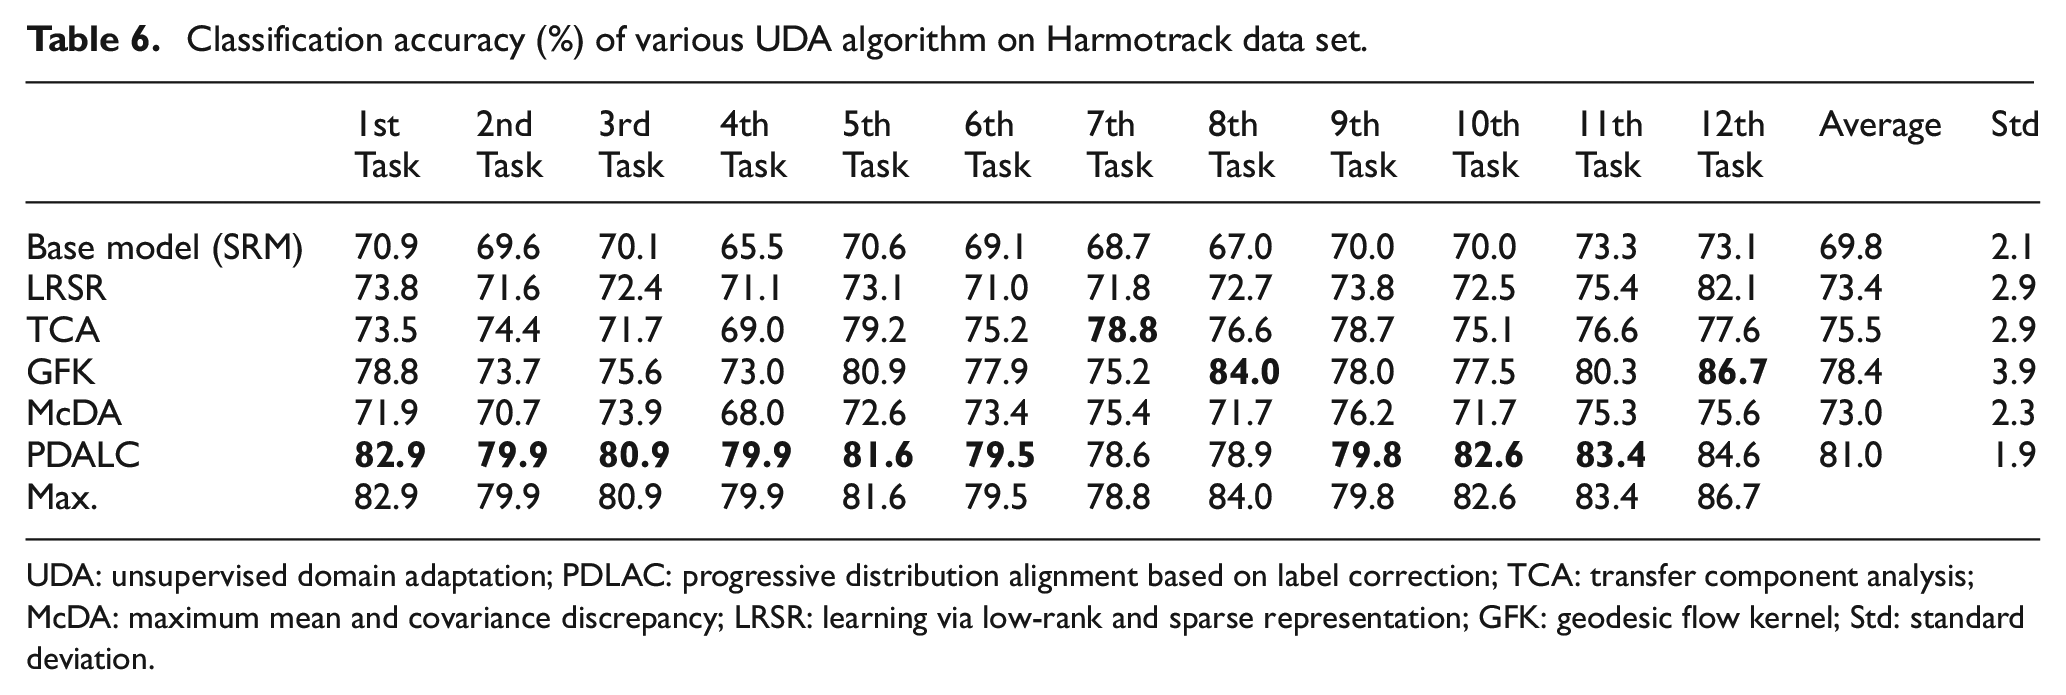
UDA: unsupervised domain adaptation; PDLAC: progressive distribution alignment based on label correction; TCA: transfer component analysis; McDA: maximum mean and covariance discrepancy; LRSR: learning via low-rank and sparse representation; GFK: geodesic flow kernel; Std: standard deviation.
On other hand, the mean classification accuracy of PDALC for tasks 7, 8, and 9 is 79.08% which is lower compared to other tasks. This suggests that when the size of the source dataset (ND = 201) is considerably lower than the target datasets (Mj = 1755, NT = 710, and Nz = 6244), the effectiveness of the DA framework is limited. Conversely, in tasks where line Nz serves as the source dataset (tasks 10, 11, and 12), the mean classification accuracy is 83.52%. This indicates that when the number of samples in the source data exceeds that of the target data, UDA algorithms can more effectively learn the underlying distribution of each class of dataset.
A comparison of the computing time required for DA across different algorithms is also done, and the results are illustrated in Figure 12. It is notable that, for most tasks, the PDALC algorithm demands more computing time, and this difference escalates in tasks with larger datasets, such as tasks 3, 6 and 10. In these cases, the computing time of the PDALC method exceeds that of the other algorithms by more than fourfold.
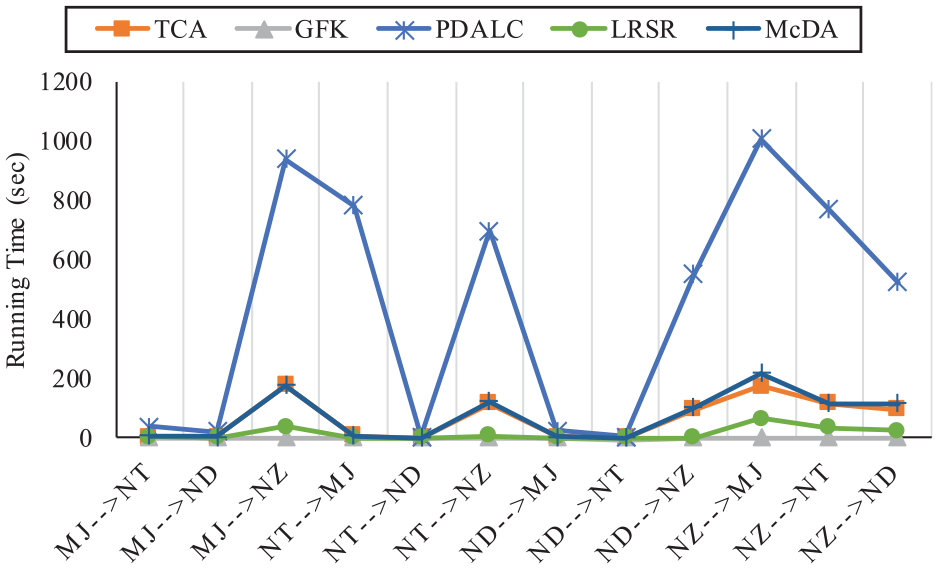
Comparison on training time of four UDA algorithm on different task. UDA: unsupervised domain adaptation.
To illustrate the changes in data distribution before and after applying DA, as well as the variance in performance of different UDA algorithms in aligning data, Figure 13 depicts the histogram of data before and after DA for second task. It can be seen that the PDALC algorithm has exhibited better performance and both marginal and conditional distributions of source and target dataset aligned after DA.
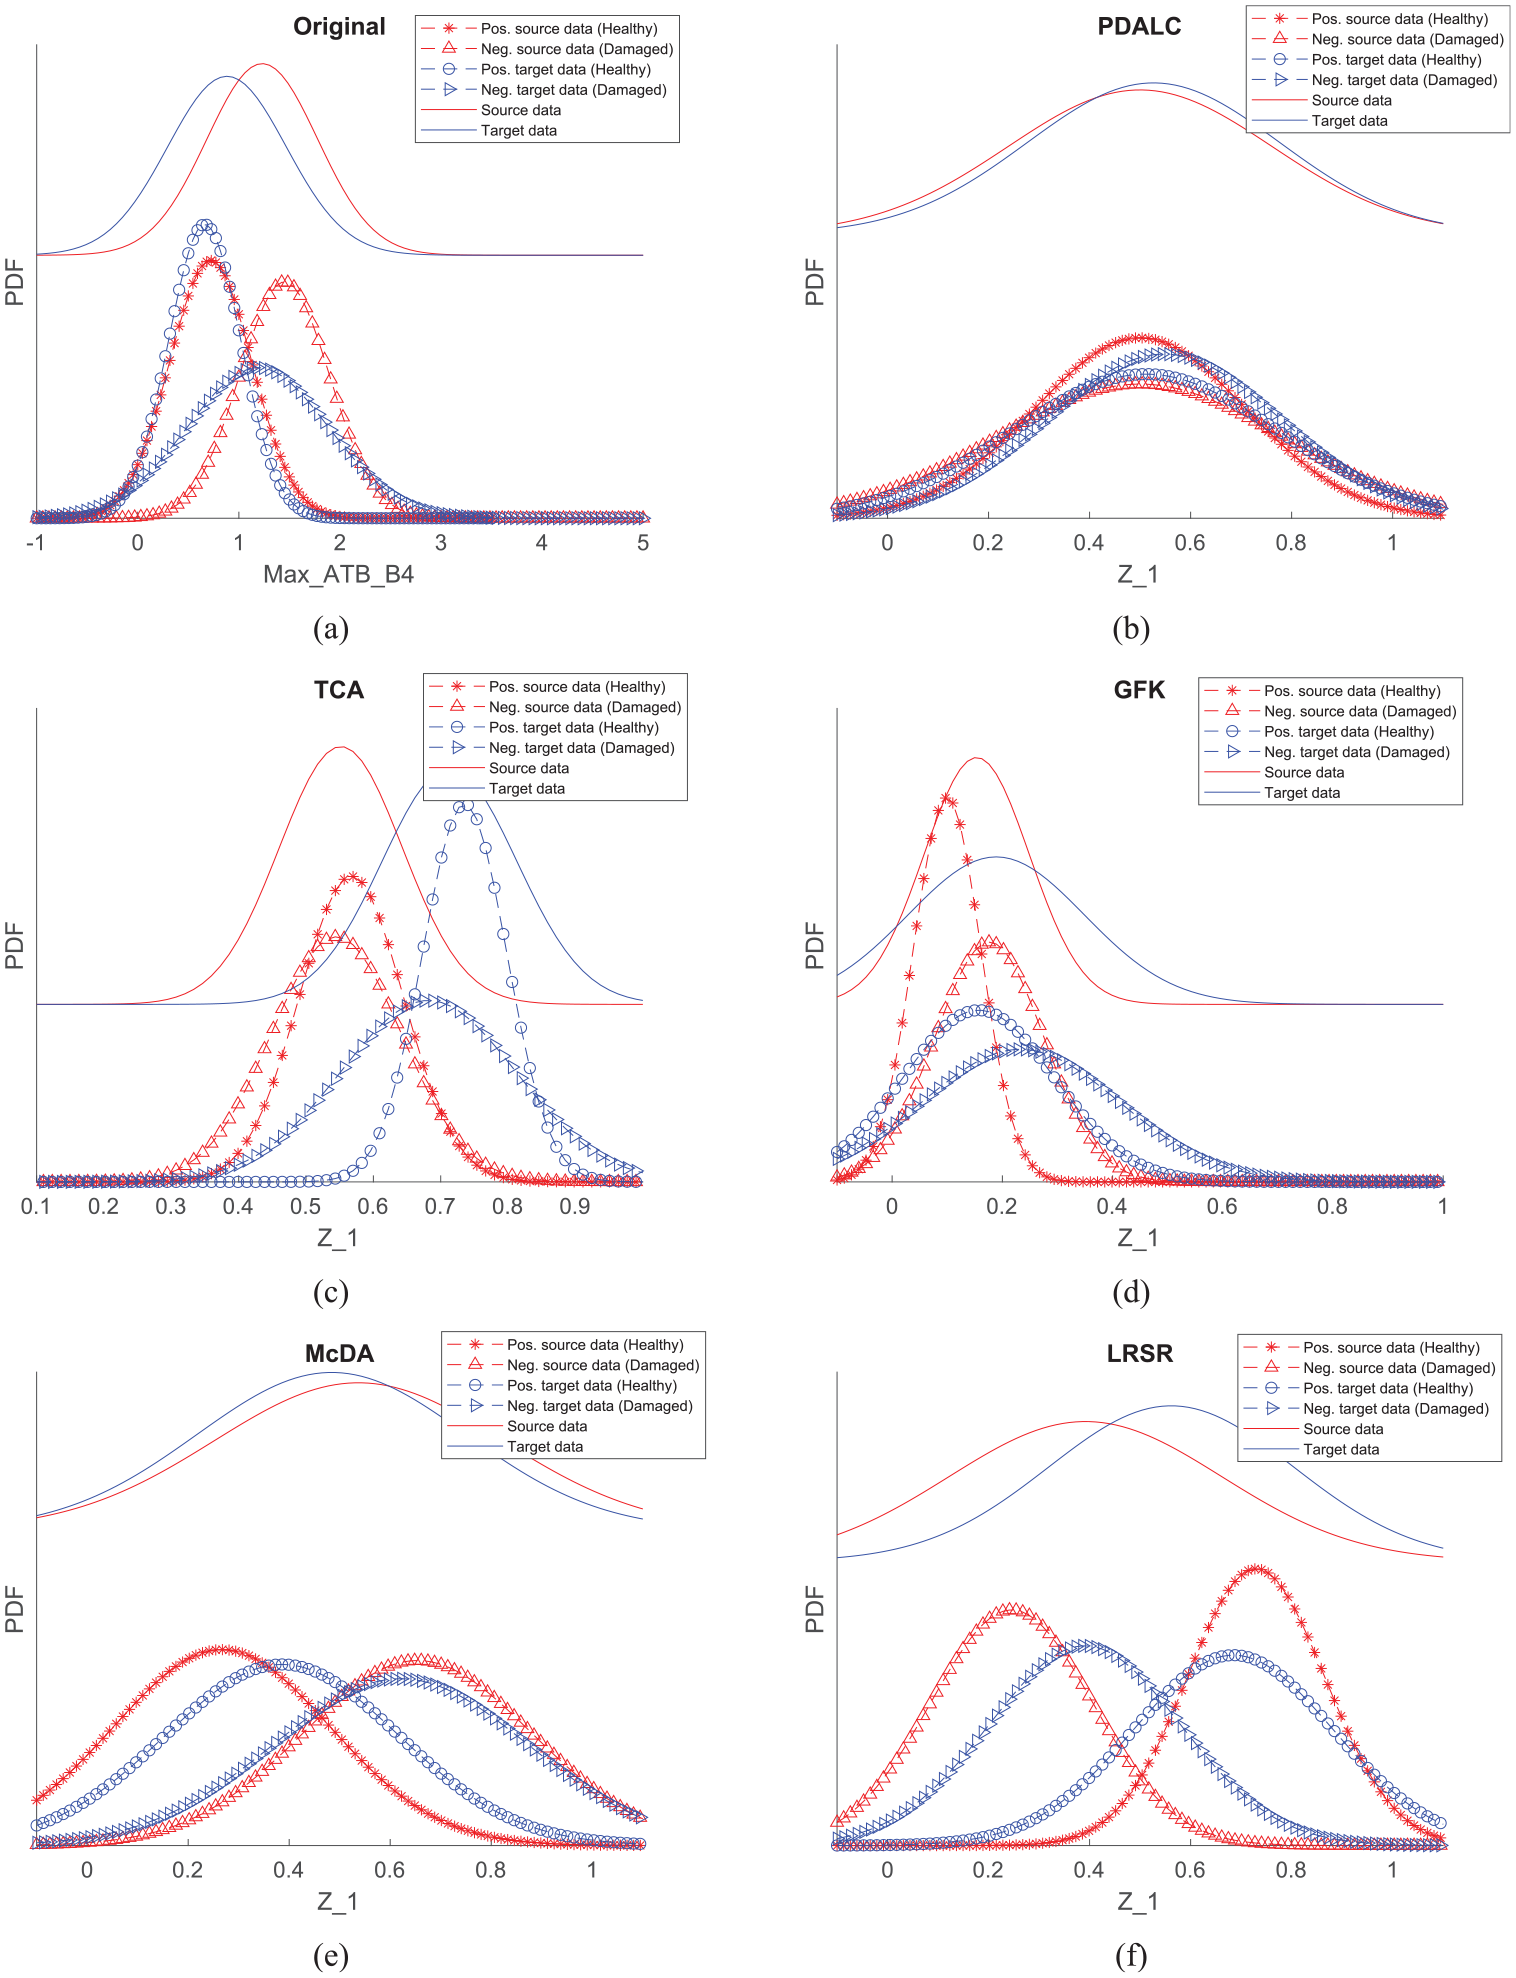
Data distribution of different UDA algorithms: (a) original space, (b) PDALC, (c) TCA, (d) GFK, (e) McDA, and (f) LRSR. UDA: unsupervised domain adaptation; PDLAC: progressive distribution alignment based on label correction; TCA: transfer component analysis; McDA: maximum mean and covariance discrepancy; LRSR: learning via low-rank and sparse representation; GFK: geodesic flow kernel.
To quantitatively assess this discrepancy alignment, Equation (16) is employed to calculate the values of PADs for all UDA algorithms for second task. The resulting PAD values are as follows: GFK: 1.74, TCA: 1.75, PDALC: 1.06, LRSR: 1.22, and McDA: 1.68.
Among these, the PAD value associated with the proposed PDALC method is the lowest, indicating better alignment of the feature distributions between the source and target domains. This reduced domain discrepancy highlights the effectiveness of PDALC in facilitating DA.
A lower PAD value reflects a smaller divergence between source and target feature distributions, suggesting more successful domain alignment. In the context of railway track monitoring, PAD values typically range between 1 and 2. Values approaching 1 indicate effective adaptation between datasets from different railway lines, which is essential for ensuring robust and reliable defect detection across varying operational and geographic condition.
Sensitivity analysis of the PDALC to machine learning approaches and number of features
To evaluate the effect of the considered classifier approaches on the accuracy of UDA framework based on PDALC, three algorithms of SVM, FNN, and kNN have been selected and their results are compared with classification accuracy of SRM for all tasks. Figure 14 shows the classification accuracy of these algorithms and it be seen that SRM and SVM outperforms other methods. On the other hand, Figure 15 illustrates a comparison between the average classification accuracy of different classification algorithms across 12 tasks before and after applying the PDALC algorithm. Regardless of the classification algorithm used, it is evident that the application of PDALC results in a minimum increase in average accuracy of 5% (for FNN) and a maximum increase of 10% (for SRM).
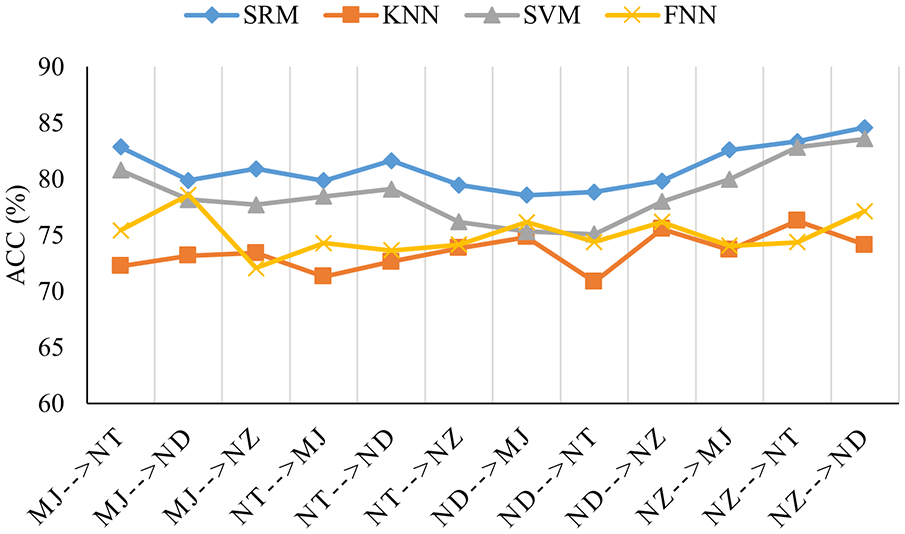
Performance comparison on the Harmotrack dataset with respect to different machine learning approaches.
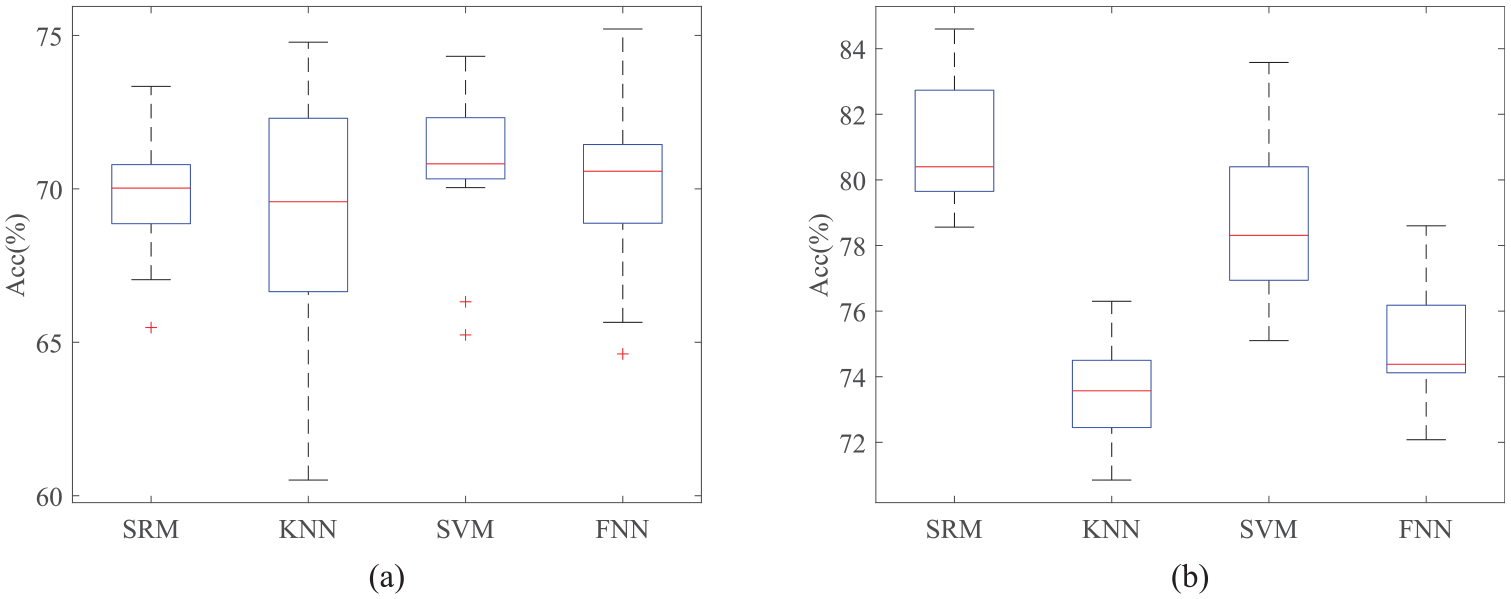
Comparison of mean of classification accuracy of different classifier: (a) before applying UDA and (b) after applying UDA. UDA: unsupervised domain adaptation.
In most of data-driven approaches within the field of SHM, the careful selection of damage-sensitive features significantly influences the system’s overall performance. 57 Therefore, this section explores the impact of feature selection on proposed system’s performance, utilizing the minimum redundancy maximum relevance (MRMR) algorithm as a filter-based feature selection method. 58 The MRMR algorithm identifies an optimal feature set that is mutually dissimilar yet effectively represents the response variable. By minimizing redundancy and maximizing relevance within the feature set, the algorithm ensures efficient representation. Further details on this algorithm can be found in the study by Peng et al. 58
To assess the effects of employing MRMR as a feature selection step, a process similar to the framework shown in Figure 5 is implemented, with a key variation being the sorting of features based on their sensitivity to defects using MRMR’s feature importance index. 58 Subsequently, a subset of these features is inputted into the PDALC algorithm. Notably, as the target data label is presumed to be unavailable during the UDA training phase, the same subset of features used in the source data matrix is also applied for testing the PDALC algorithm on the target dataset. The impact of utilizing 5, 10, 20, 40, and 80 selected features on the framework’s performance is depicted in Table 7. Additionally, the system’s classification accuracy when employing all features is provided for comparison.
Performance comparison with respect to different number of features.
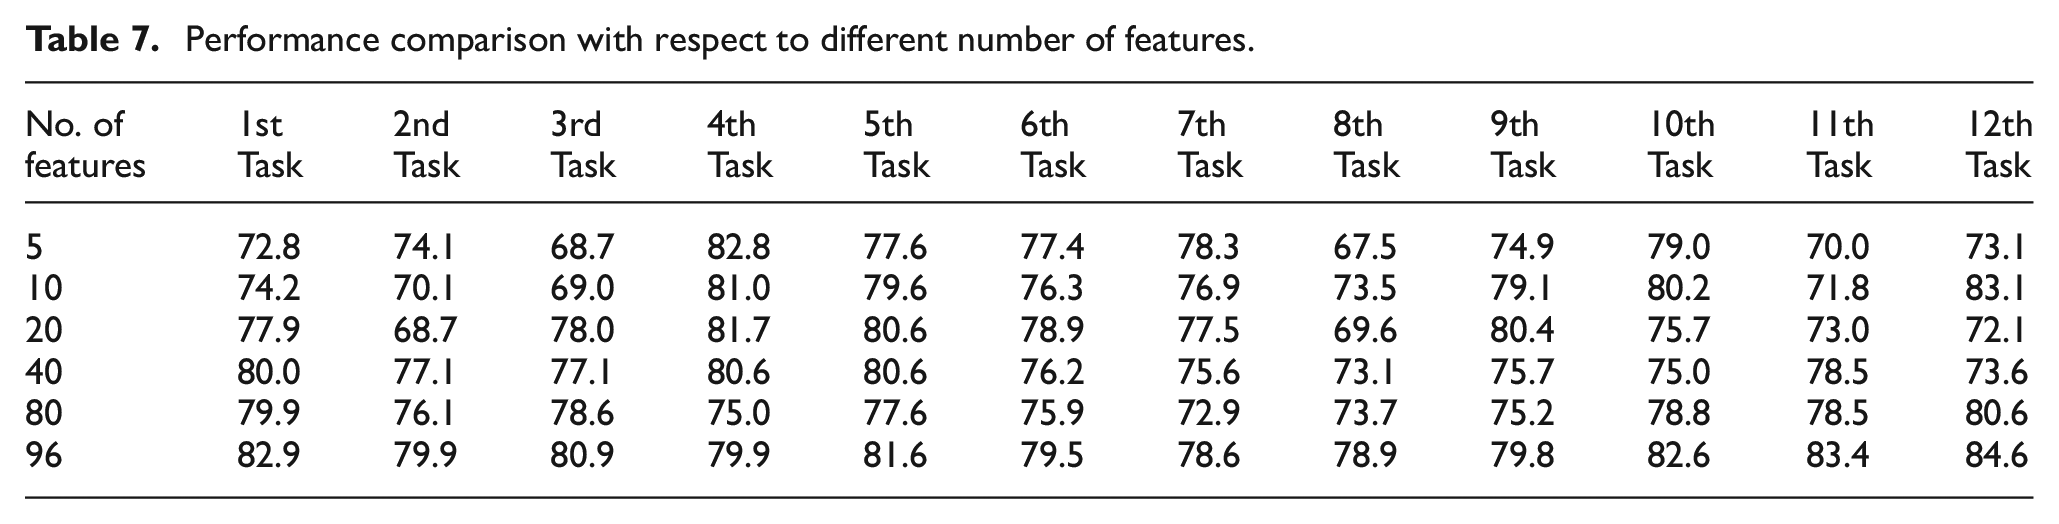
It can be seen that in most tasks, feature selection based on source dataset not only fails to improve system performance but also reduced it. This indicates that while conventional classification methods in the SHM domain typically demonstrate performance improvements with feature selection within a single domain, 59 the presence of multiple domains introduces domain shifts. Consequently, the features selected based on the source dataset may not necessarily be optimal for the target dataset. Moreover, given that discrepancy-based UDA algorithms map data to a latent space where domain differences are minimized, reducing input data dimensions in the primary space negatively impacts overall system performance.
It should be noted that, as demonstrated in our previous work, 4 applying a filter-based feature selection algorithm on data from one of the railway lines identified the Std and RMS of sensor direction 2, along with Std of sensor direction 3, as highly informative features for assessing track condition. Notably, about 95% of the selected features originated from sensors mounted on the train’s bogie, highlighting their greater sensitivity to track geometry defects. Furthermore, 95% of the most relevant features were concentrated among three statistical indices: RMS, Std, and peak value, underscoring their significance despite some correlation between them. The MRMR algorithm inherently addresses such correlations by selecting features with high relevance and minimal redundancy. However, as shown in Table 7, applying MRMR in the current study did not yield a significant improvement in performance. This is likely due to the domain shift present, where features selected from the source domain do not necessarily generalize well to the target domain.
Sensitivity analysis of the PDALC parameters
As mentioned in the second section, PDALC has three adjustment parameters
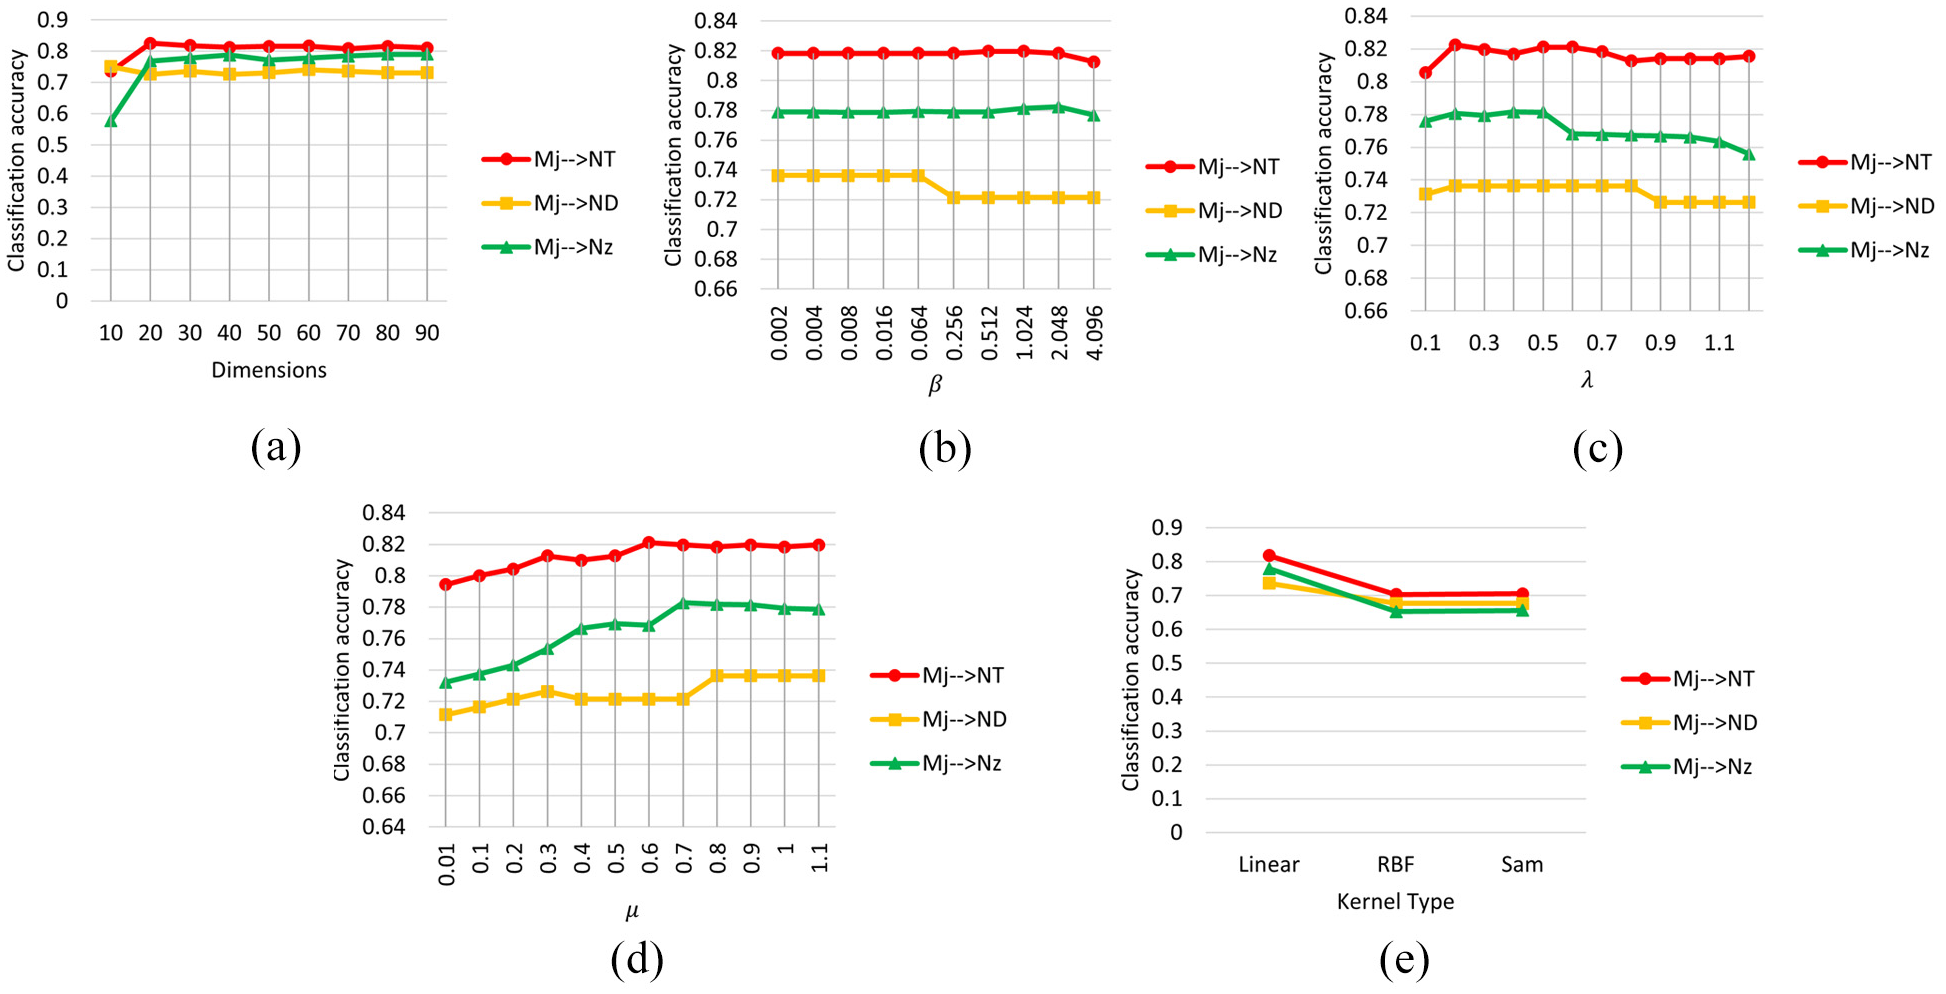
Classification accuracy of PDALC with different parameters: (a) dimension, (b) beta
Sensitivity analysis of PDALC to sensors layout
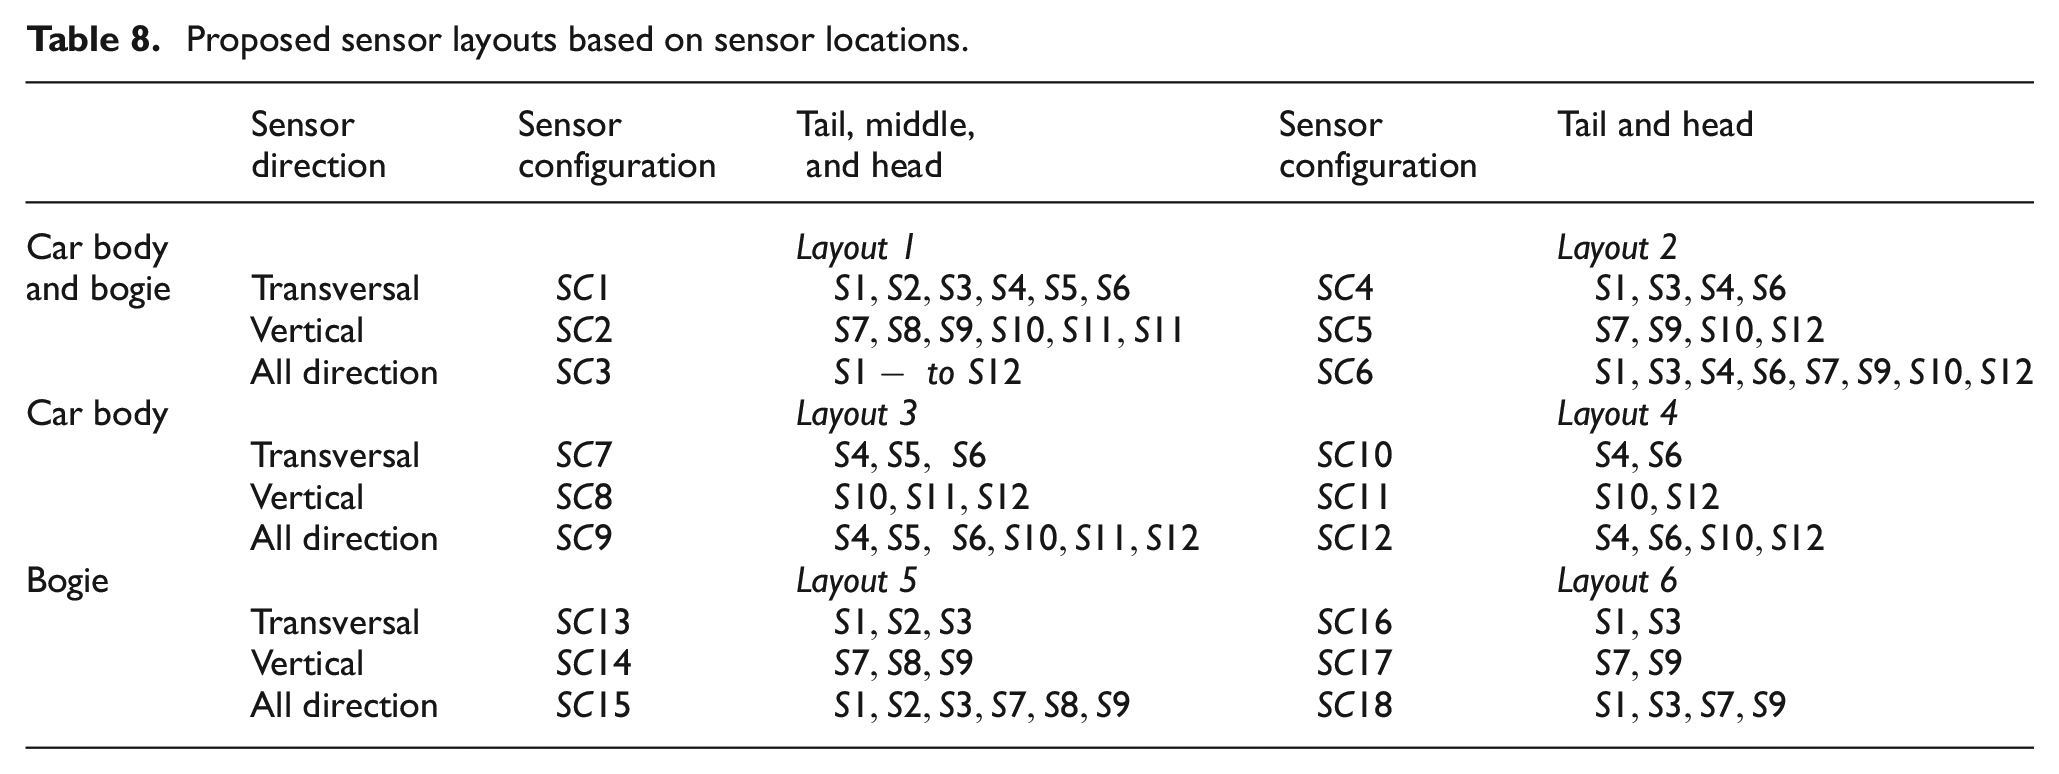
This section examines the influence of accelerometer locations and orientations on the detection accuracy of the PDALC algorithm by defining six distinct combination layouts. The layouts are organized based on the sensors’ positions along the train (front, middle, and rear) and at two vertical levels (car body and bogie). Additionally, since acceleration data are captured in both horizontal and vertical directions, the influence of sensor orientation on the detection performance of the proposed framework is examined for each layout. This ensures a comprehensive analysis of how sensor placement and direction affect the system’s detection capabilities. Therefore, three sensor configurations are defined for each sensor layout: (1) only transversal direction, (2) vertical direction, and (3) all available directions. Table 8 gives the detail of the layouts.
Proposed sensor layouts based on sensor locations.
Same as section 5.4, first task (Mj → NT) is chosen for comparative study. The classification accuracy for different layouts before and after implementing UDA scheme on source and target dataset is plotted in Figure 17. In this figure, the black circles indicate the positions of the accelerometers in each layout, while the blue bodies and red bogies represent those equipped with installed accelerometers.
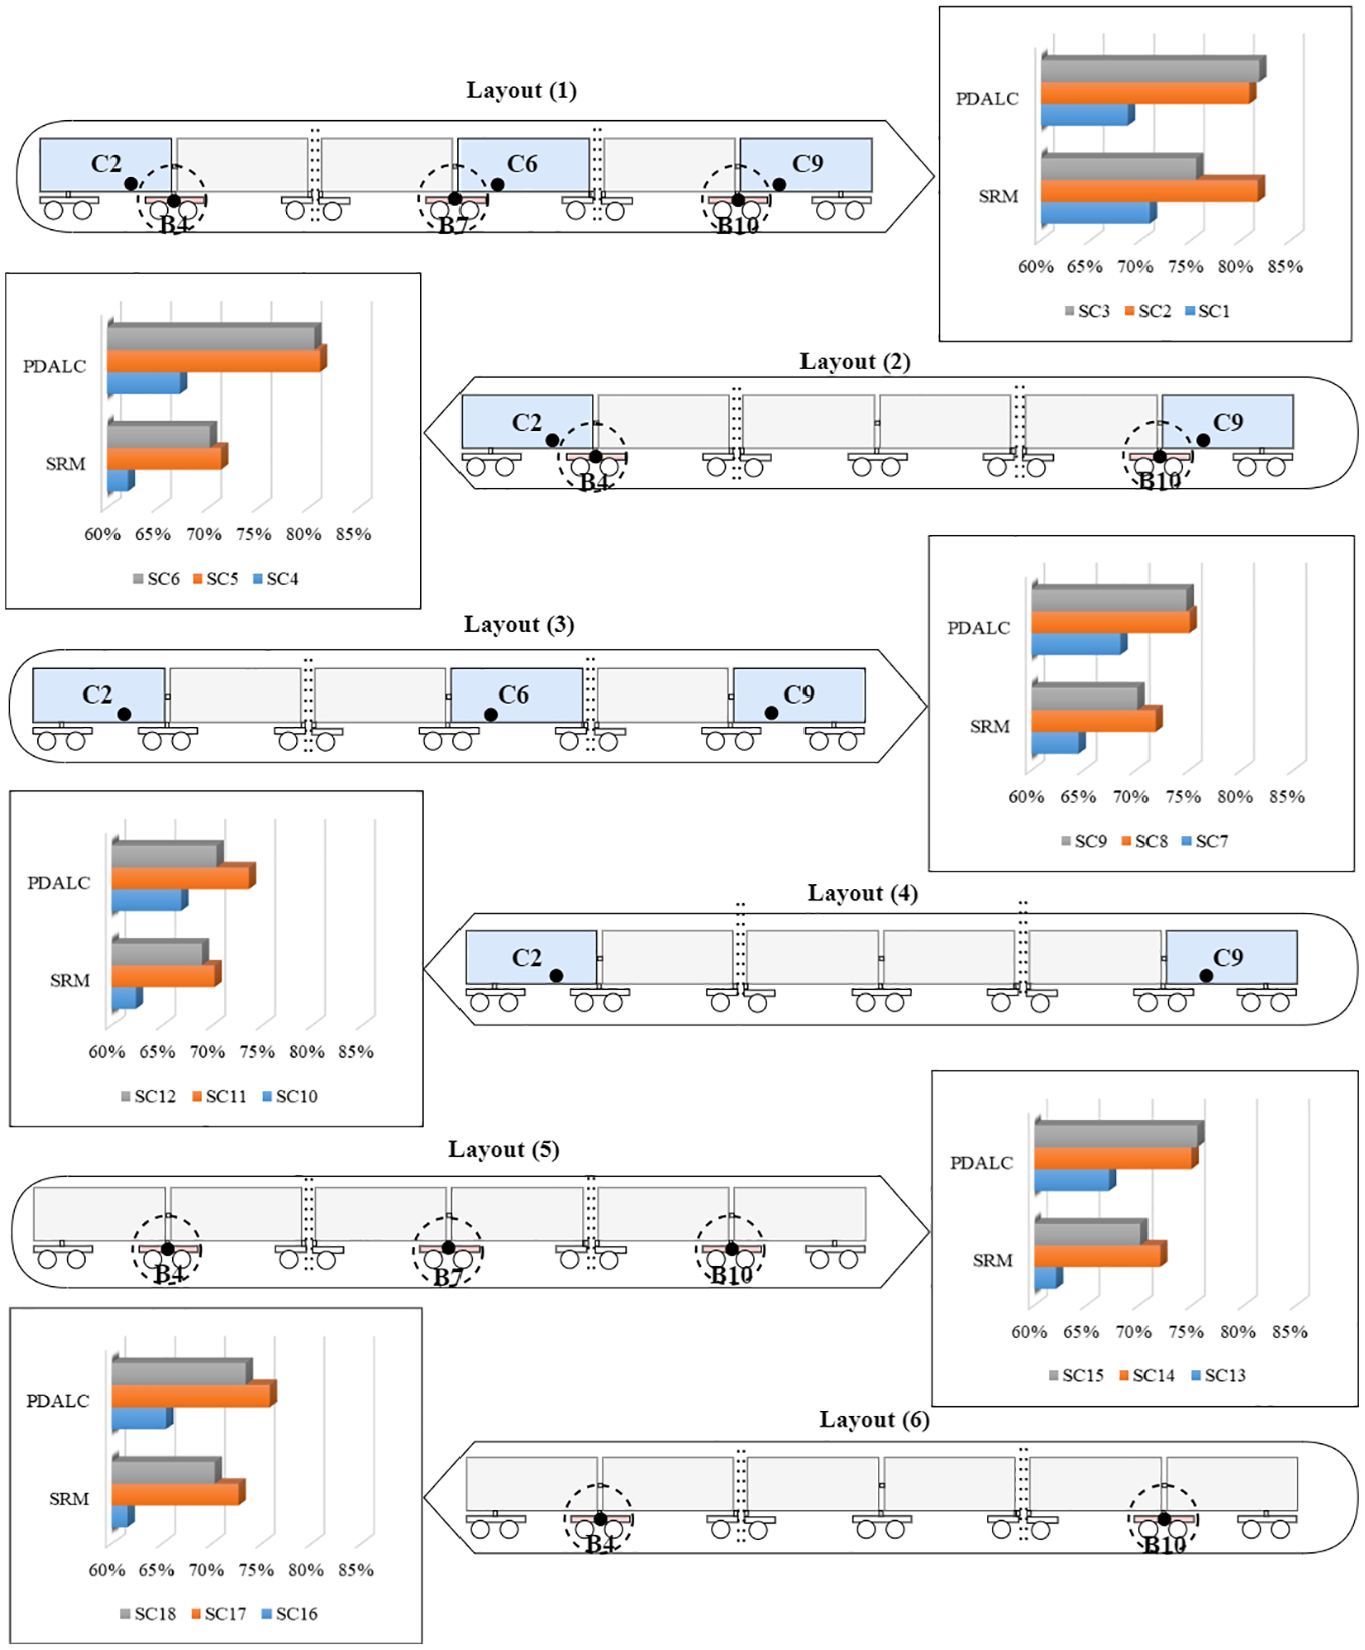
Comparative results of various sensors layout in using UDA framework based on PDALC. UDA: unsupervised domain adaptation; PDLAC: progressive distribution alignment based on label correction.
According to the figure, layouts generally exhibit greater efficiency when employing both body and bogie accelerometers (layouts 1 and 2). Additionally, the accuracy of layouts utilizing sensors installed on the bogie (layouts 5 and 6) tends to be slightly higher than those using sensors on the car body (layouts 3 and 4) in most cases. This finding is logical as the secondary suspension mitigates some of the track defects’ impact on the car body acceleration. This also indicates that utilizing sensors placed on the axle is necessary to achieve better detection results. In other word, while the implementation of the UDA framework enhances classification accuracy by mapping data to the latent space, the quality of the input data significantly influences the system’s final performance. Thus, selecting more sensitive sensors may increase the likelihood of accuracy improvement.
Another representation of the results is shown in Figure 18. As can be seen, the UDA approaches based on PDALC reduced classification error in all sensor configurations, with the maximum of reduction 12% in SC3 and SC6. However, it’s important to note that since the measurements of the vehicle’s response are obtained real-time and under normal operating conditions, and the datasets are not drawn from a pure multivariate Gaussian distribution, a relatively high number of false alarms are expected for the PDALC. This is evidenced in the latent feature space, where the classification error (17.13%) of the best configuration (SC3) exceeds the level of significance of 5%. Nevertheless, the higher frequency of trips, compared to the less frequent inspections by TGCs, allows for more frequent passes over critical areas of interest. This results in greater statistical confidence regarding the condition of the track, enabling more reliable monitoring and maintenance decisions.
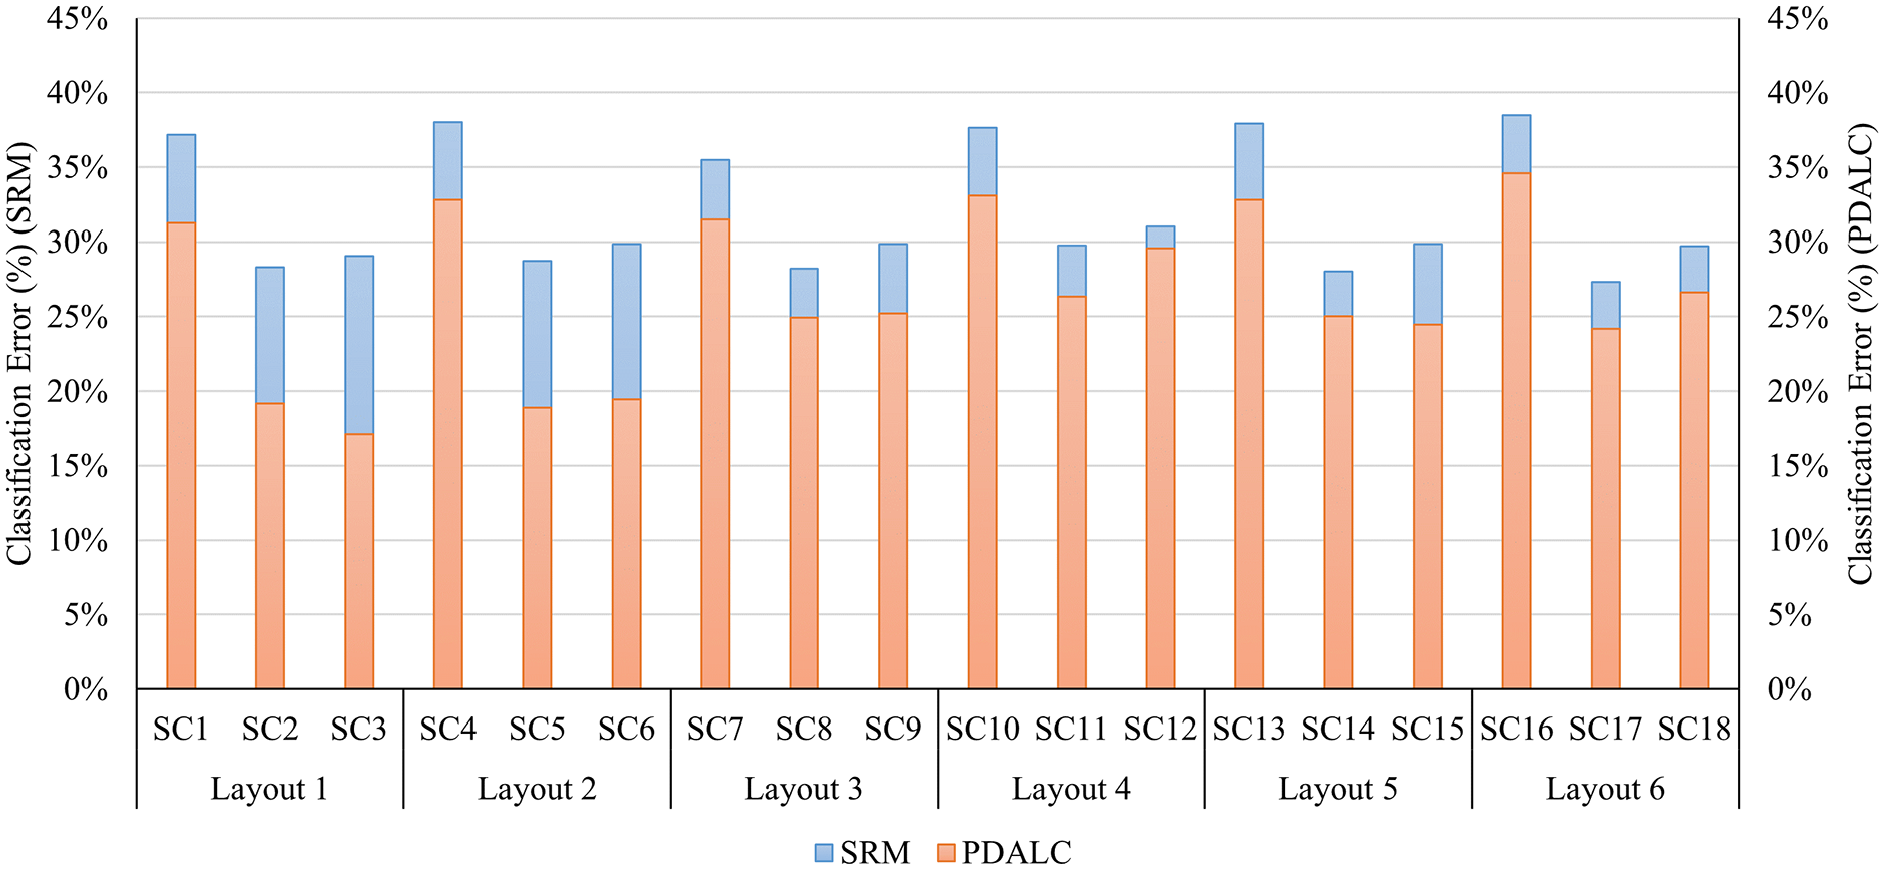
Comparison of classification error of baseline model versus PDALC. PDLAC: progressive distribution alignment based on label correction.
Finally, to assess the impact of noise on the robustness of the proposed system, a sensitivity analysis was conducted by introducing artificial noise into one of the tasks. Specifically, 5% Gaussian noise was added to the acceleration response data used in task 1 (line Mj → line NT), and the same procedure outlined in Figure 5 was followed. The results show a decrease in classification accuracy from 82 to 78%. Although the accuracy was reduced, the system demonstrated acceptable robustness to 5% noise, which aligns with commonly accepted noise levels in the SHM domain. 60
Discussion
The results indicate that the proposed PDALC algorithm effectively mitigates the distribution discrepancy between source and target data from different lines in the task of developing a generalizable model for railway track geometrical defect detection. By integrating progressive learning, label correction, and geometric structure learning, PDALC demonstrates a synergistic effect that enhances the model’s ability to preserve data integrity across domains. This results in consistently better performance compared to other UDA algorithms evaluated in this study.
However, as illustrated in Figure 12, the computational demand of the PDALC algorithm across the 12 tasks examined is approximately two to four times higher than that of other algorithms. The highest runtime occurs when the Nz dataset—the largest one, comprising 6244 samples, each representing 60 m of track—is used as the source or target domain. In these cases, PDALC achieves classification accuracy that is at least 10% higher than the baseline model and 5% higher than the next-best UDA algorithm, but with a runtime of approximately 17 min. This underscores a key trade-off between computational efficiency and model performance. In real-time monitoring scenarios, this trade-off must be carefully considered when deploying the method in practice.
Furthermore, noise remains a critical challenge in real-world applications of data-driven methods, particularly those that rely on statistical features derived from acceleration signals. The dataset used in this work was collected from various high-speed railway lines in France, each operating under different EOVs, which naturally introduce a level of noise into the data. This variability is a significant factor contributing to the observed classification accuracy remaining below 90%, even when using different machine learning/UDA models.
Addressing the influence of noise is an essential direction for future research—particularly through the development of preprocessing techniques 61 or robust denoising methods—to further improve the system’s reliability and performance under real-world conditions.
Conclusions
This paper introduces a discrepancy-based UDA framework designed to tackle the domain shift issue in assessing the condition of railway tracks across various lines. A data-driven method utilizing recorded acceleration responses from high-speed trains has been developed to identify track geometric defects. By leveraging data from labeled source lines and unlabeled target lines, the PDALC algorithm facilitates the transfer of both datasets into a common subspace, allowing for effective integration of samples from different domains and reduction of domain discrepancies.
The framework’s effectiveness is demonstrated using a dataset collected from field measurements obtained from the IRIS320 train monitoring system as it traverses four distinct lines. The results highlight the potential of utilizing a discrepancy-based UDA approach for detecting geometric defects. Notably, PDALC surpasses traditional classification methods by achieving higher average classification accuracies, minimizing domain distances, enhancing sample clustering, and ensuring more uniform feature data distributions across domains. This enhanced performance demonstrates the effectiveness of PDALC in handling cross-DA challenges. Among the four UDA methods evaluated, PDALC demonstrates the best performance for distribution alignment.
Furthermore, the framework’s performance is assessed across 12 tasks, highlighting its robustness in cross-domain condition assessment under varied operational conditions. Comparative results reveal that the proposed framework can enhance classification accuracy by up to 12% compared to traditional methods. Additionally, a study evaluates the influence of 18 sensor configurations within six sensor selection layouts on the framework’s accuracy, demonstrating reasonable accuracy levels using an acceleration dataset from sensors mounted on the bogie. However, incorporating a feature selection step on the source dataset results in reduced classification performance due to domain discrepancy shifts.
In addition to the insights gained through the proposed UDA framework and PDALC algorithm, further work can be directed towards investigating the integration of environmental and operational variables such as weather conditions, seasonal effects, and train loading conditions. These variables may introduce further domain shifts in railway track monitoring, potentially affecting defect detection accuracy. Moreover, expanding the dataset to cover a broader range of railway networks, including those with more diverse track geometries and defect types, could provide a more comprehensive validation of the framework’s scalability and robustness. Lastly, incorporating a semi-supervised DA strategy could further improve performance by utilizing a small amount of labeled data from the target domain, potentially offering a balance between fully supervised and unsupervised approaches.
Footnotes
Acknowledgements
The authors are thankful to SNCF Réseau Track and Surroundings Department colleagues and IP3M experts who provided treated HS train IRIS320 data and shared their knowledge and technical results through the international project UIC Harmotrack. The UIC Harmotrack project is an international program that gathers more than 200 railway experts working from 65 railway companies and research institutions in 40 countries.
Declaration of conflicting interests
The author(s) declared no potential conflicts of interest with respect to the research, authorship, and/or publication of this article.
Funding
The author(s) disclosed receipt of the following financial support for the research, authorship, and/or publication of this article: This publication has emanated from research conducted with the financial support of Research Ireland under grant number 20/FFP-P/8706.