
Abstract
Monitoring gear wear is important for gear diagnosis, although it remains a challenging endeavor. Unlike localized tooth faults, there are still physical patterns in the vibration signature associated with distributed wear faults that should be unfolded. This study contributes a novel framework for gear wear diagnosis, supported by physical principles and validated against traditional methods through extensive experimentation. First, we characterize gear wear in the vibration signature, utilizing data from dozens of seeded, realistic degrading wear cases across various rotational speeds collected through unique controlled-degradation tests. We examine conventional features that have proven useful for diagnosing localized tooth faults and demonstrate their inadequate performance in diagnosing gear wear. We propose a sensitive spectral analysis of the gear mesh and sideband spectral energy in the spectrum to recognize wear manifestation and monitor its degradation. Drawing on the insights gained in this study, we introduce a novel health indicator for anomaly detection of incipient gear wear, grounded in physical understanding and employing sophisticated yet simple feature engineering techniques. We analyze the performance of the proposed health indicator, demonstrating its superiority over state-of-the-art methods, and underscore the importance of considering assembly and dismantling operations to avoid the issue of test-training leakage. Additionally, we highlight the potential of the proposed physical-based framework combined with a deep-learning approach to detect wear in its early stages. To the best of our knowledge, this is the first study to conduct extensive controlled-degradation tests, rather than endurance tests, to investigate gear wear and offer a hybrid physical data-driven framework that combines advanced signal processing, feature extraction, and feature engineering techniques for early anomaly detection.
Introduction
Wear is a prevalent fault in gears, often leading to performance degradation and even catastrophic failure. Different forms of distributed wear faults in gears include abrasive, adhesive, and corrosive wear.1,2 Among these, abrasive wear is the most common, characterized by gradual deterioration of the involute profile and erosion of the teeth surface due to sliding motion and oil contamination over time. 3 The dynamic response of gears to wear faults has been studied, primarily through endurance tests.3,4 This study investigates anomaly detection of gear wear through vibration analysis. Other suggested approaches include oil debris monitoring, 5 dynamic modeling,6,7 tribological models, 8 and analysis of the transmission error.9,10
Various studies have investigated how gear wear manifests in the vibration signal. Randall links wear manifestation to amplitude variation at low-order harmonics of the gear mesh frequency. 11 Zhang et al. 12 track wear propagation by analyzing the modulation sidebands surrounding the gear mesh harmonics. Dempsey integrates oil debris monitoring through experiments and explores the correlation between accumulated mass loss due to wear and a range of common condition indicators for gears. 5 Li et al. 13 employ a deep learning-based autoencoder model for wear diagnosis, using the raw vibration signal. Feng et al. 3 recently provided a comprehensive literature review of vibration-based methods for monitoring gear wear, acknowledging the limited work on vibration-based wear detection.
The literature review presents three gaps:
Experimental studies on gear wear often rely solely on endurance tests, lacking controlled-degradation tests. While endurance tests monitor natural degradation, controlled-degradation tests with artificially seeded faults provide better supervision of fault severity and geometry. Additionally, endurance tests are not ideal for benchmarking anomaly detection algorithms, either because lacking healthy data when starting with a seeded incipient fault, or because the transition point from healthy to faulty statuses is unknown.
The physical patterns within the vibration signature related to gear wear have not been extensively studied. There is a significant opportunity to improve the understanding of gear wear by conducting a thorough investigation of the vibration signature. This investigation should facilitate the customization of signal processing and feature extraction techniques tailored for wear monitoring purposes.
Currently, there is no concise algorithm for early detection of gear wear through vibration analysis. Gear condition monitoring typically involves data acquisition, 14 signal processing, 15 and feature extraction, 16 followed by the construction of health indicators using physical, 17 statistical, 18 machine learning,19,20 or hybrid physical AI-based approaches, 21 ending in a diagnostic prediction. 20 Traditional methods for fault detection in gears are well-suited for detecting local faults such as pitting. 22 They typically begin by isolating patterns in the vibrations associated with the target gear, often employing synchronous averaging.23–25 Additional processing, such as computing the difference signal 26 or analyzing specific frequency bands in the spectrum, 21 can further enhance fault detection. Various features are then extracted,20,27,28 and a health indicator is derived.17,29,30 However, addressing distributed wear faults proves to be a more challenging endeavor. 31
The primary objective of this study is to characterize gear wear faults and their behavior in the vibration signature and to introduce novel algorithms for the anomaly detection of gear wear based on this characterization. First, we conduct an extensive controlled experiment, as detailed in section “Experimental setup” to allow an in-depth investigation of gear wear utilizing data collected by multiple vibration sensors comprising dozens of seeded degrading wear cases across dozens of rotational speeds. Section “Gear wear characterization” presents a wide-scale characterization of gear wear, grounded in the in-depth investigation of the experiment results. In section “Anomaly detection of gear wear” we introduce a novel health indicator, supported by insights drawn from the experimental characterization. This section also discusses the importance of the variance in the vibration signature generated by the assembly and dismantling operations, considering the test-training leakage problem. 32 We showcase the superiority of the proposed novel health indicator over conventional anomaly detection algorithms. Furthermore, we demonstrate the strength of the proposed novel hybrid physical data-driven framework on a deep learning algorithm for anomaly detection of incipient wear faults.
Experimental setup
The fundamental wear characterization in this study is achieved through wide-scale controlled-degradation tests. The experimental database comprises vibration signals collected via two three-axial vibration sensors from 35 health cases, encompassing various assembly and dismantling operations, examined across 41 rotational speed levels. The following subsections describe the designated test rig and the experimental program.
Test-rig
The designated test rig for a spur gear transmission is depicted in Figure 1. The gears were manufactured with a surface quality following the DIN8 standard, a module of 3 mm, and a reduction ratio of 35:18. Artificial wear-like faults were seeded to the output gear wheel while the driving pinion remained healthy throughout the experiment. Data were collected under a constant load of 10 Nm applied by a hydraulic pump brake connected to the output shaft, at various rotational speed levels. Vibrations were measured in the horizontal (hrz), axial (axl), and gravitational (grv) directions using two three-axis Dytran 3053B2 piezoelectric accelerometers mounted at distant locations on the support brackets—referred to as “motor” and “brake”—resulting in six vibration channels. Additionally, two Honeywell 3010AN tachometers, one for each shaft, were installed to measure rotational speed signals. The dataset includes vibration signals of both healthy status and 34 distinctive wear severities, sampled at a rate of 50 kHz for 60 s each. This sampling rate is more than sufficient to capture high-order gear mesh harmonics for the tested gearbox; for example, over 28 harmonics are captured at the maximum input speed of 50 rps. Microscopic photographs of the seeded wear faults at the same reference tooth are presented in Figure 2.
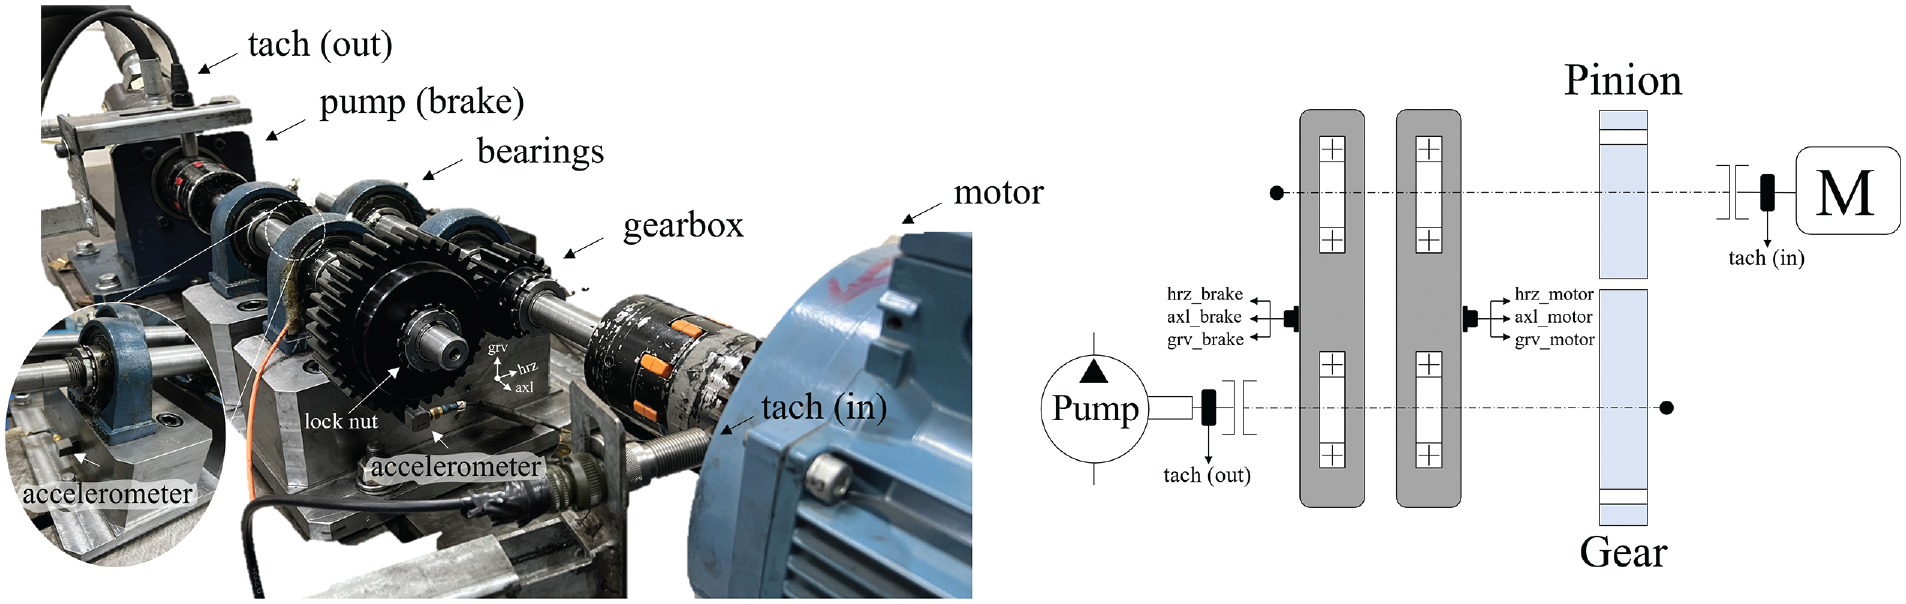
Experimental test rig.
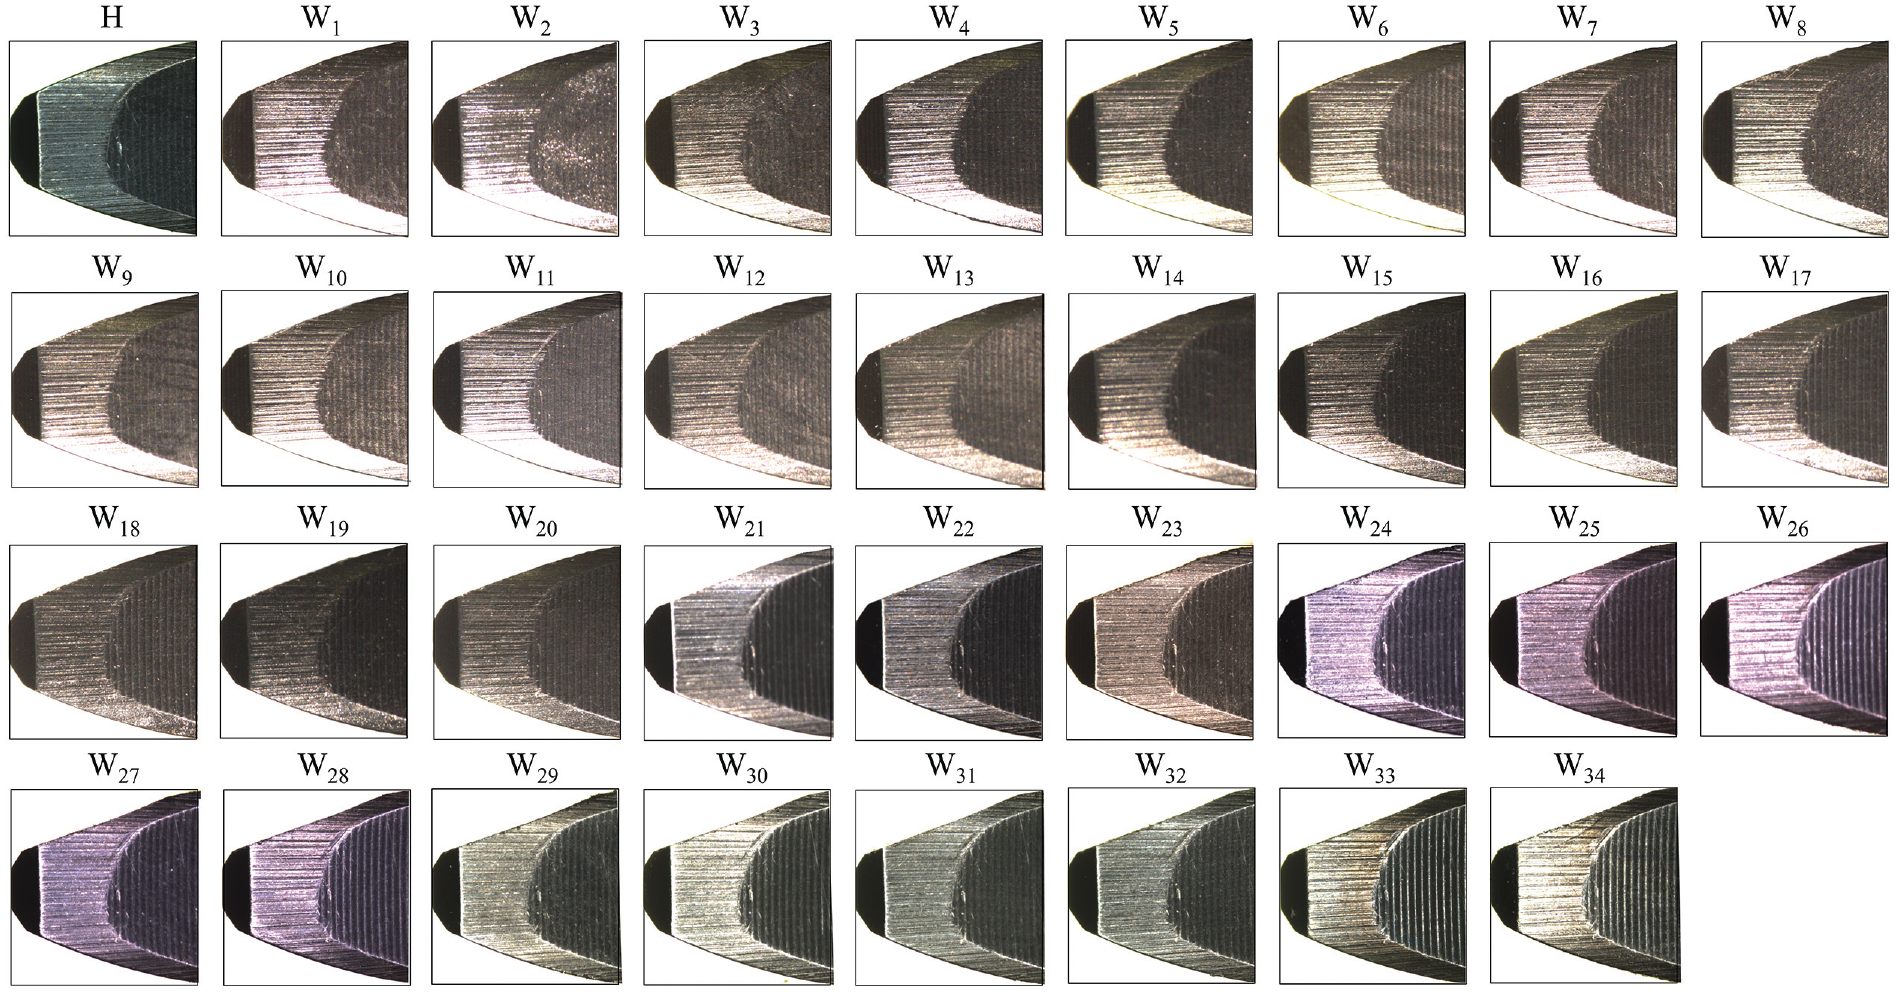
Photographs of the seeded wear cases throughout the experiment.
Experimental program
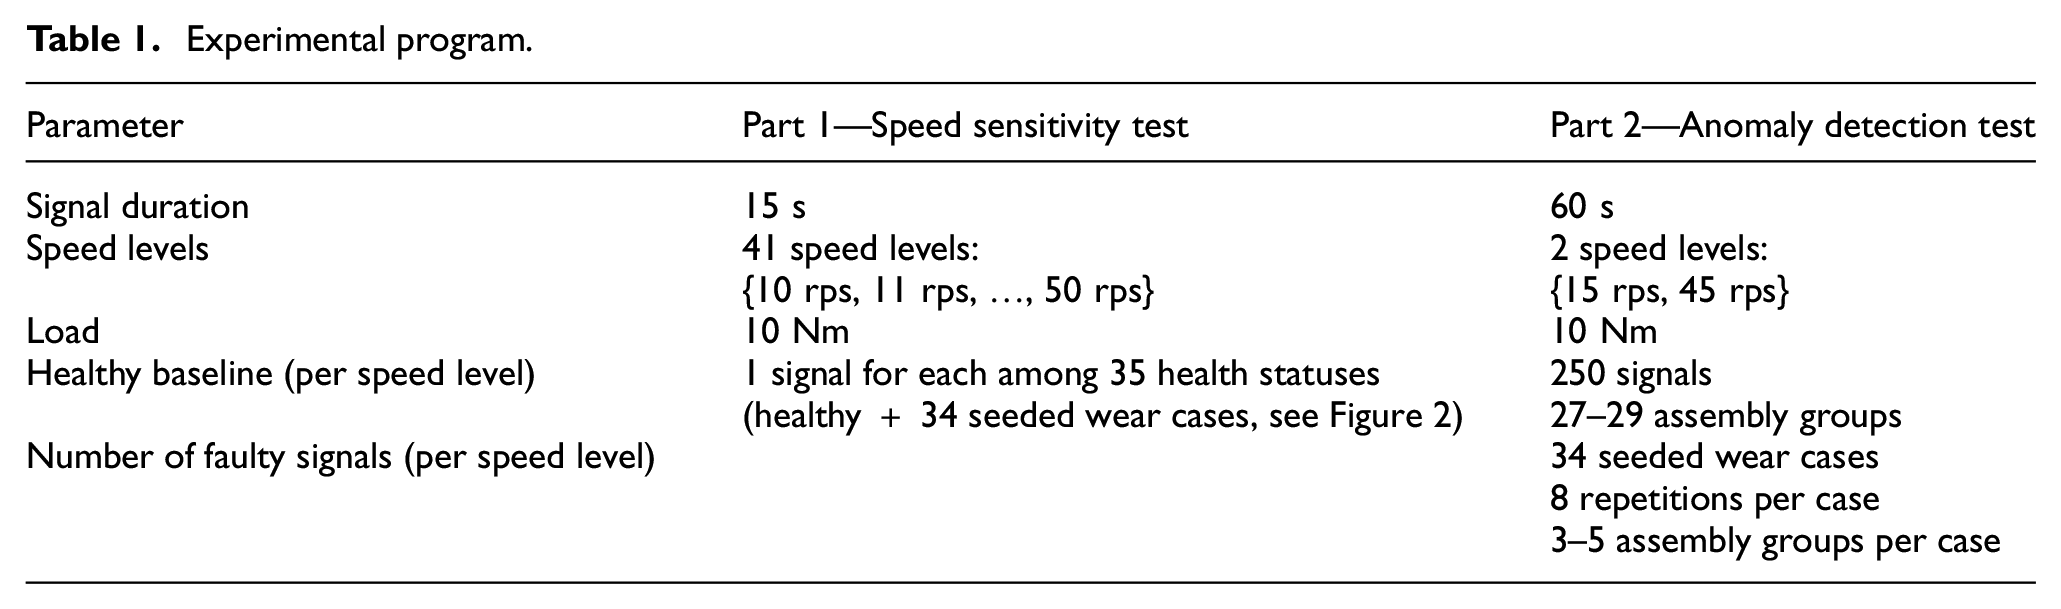
The experimental data observations were collected in two parts, as depicted in Table 1: one dataset aimed at investigating the sensitivity of the vibration signature to wear appearance across rotational speed and fault severity, and another database utilized for anomaly detection. In the first part, vibration data were collected at rotational speeds ranging from 10 rps to 50 rps, with intervals of 1 rps (41 levels overall) for each fault severity. In the second part, a vibration database was collected at two speed levels, 15 and 45 rps. An extensive baseline of 250 samples was collected for each speed to ensure a substantial amount of healthy data, while eight samples were collected for each wear case. Assembly and dismantling operations, referred to in this article as “assembly operations” and/or “assembly groups,” were performed in between samples to introduce variance in the data, as detailed in section “Anomaly detection of gear wear.” The protocol for each operation involved unscrewing the gear’s lock nut (see Figure 1), dismantling the gear from its shaft, rotating the input shaft to alter the pinion’s position, then reassembling the gear and fastening the lock nut.
Experimental program.
Gear wear characterization
This section offers a fundamental characterization of gear wear faults in vibration signals. Initially, we examine the performance of common feature extraction techniques from the synchronous average and difference signals for detecting distributed wear faults in comparison to local tooth faults. Subsequently, we demonstrate the effectiveness of spectral analysis for wear diagnosis by conducting an in-depth investigation of the energies associated with gear mesh and modulation sidebands in the synchronous average spectrum. Insights drawn from this section are integrated into the anomaly detection algorithms proposed in section “Anomaly detection of gear wear.”
Analysis of common features for gear diagnosis
Many conventional feature extraction techniques for gears perform well in identifying local faults, such as pitting and breakage.20,27 Among various features meticulously summarized by Sharma and Parey, 33 we focus on a subset derived from statistical moments of the difference signal, for example, rms, skewness, and kurtosis, which have proven highly effective.21,22,34 It would be interesting to examine their effectiveness in diagnosing distributed wear faults in comparison to local tooth faults.
In this study, we assess effectiveness of features based on three criteria:
The feature’s value exhibits significant variation in the early stages, facilitating fault detection.
The significance of this variation either increases or remains relatively stable as health degrades.
The feature is capable of detecting faults consistently across rotational speeds and fault severity.
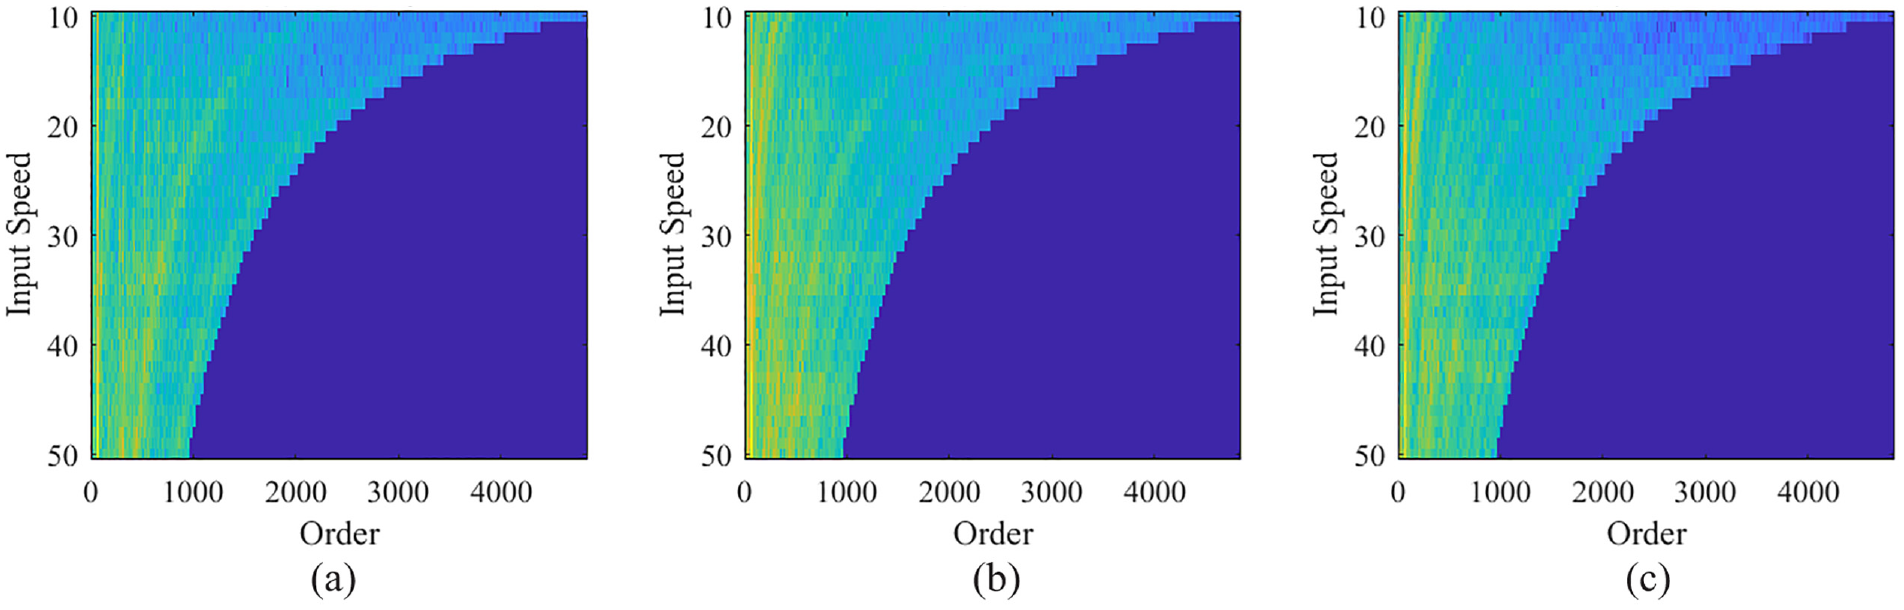
Figure 3(a) to (d) presents heatmaps for the rms and kurtosis extracted from the difference signal, the rms and skewness extracted from the envelope of the difference signal, demonstrating their variation across rotational speed and fault severity. The rms varies with fault severity at speeds higher than 30 rps and only at advanced stages of the fault. The skewness values hover around zero, indicating relatively low values and inconsistency with both fault severity and speed. The kurtosis values are generally very low, approaching the nominal range of 3 to 5. At low speeds, kurtosis may increase in certain faults but retain nominal values with health degradation. Based on the criteria defined above and the analysis of these features, it is evident that common features effective for local faults do not necessarily allow fault detection of distributed wear faults.
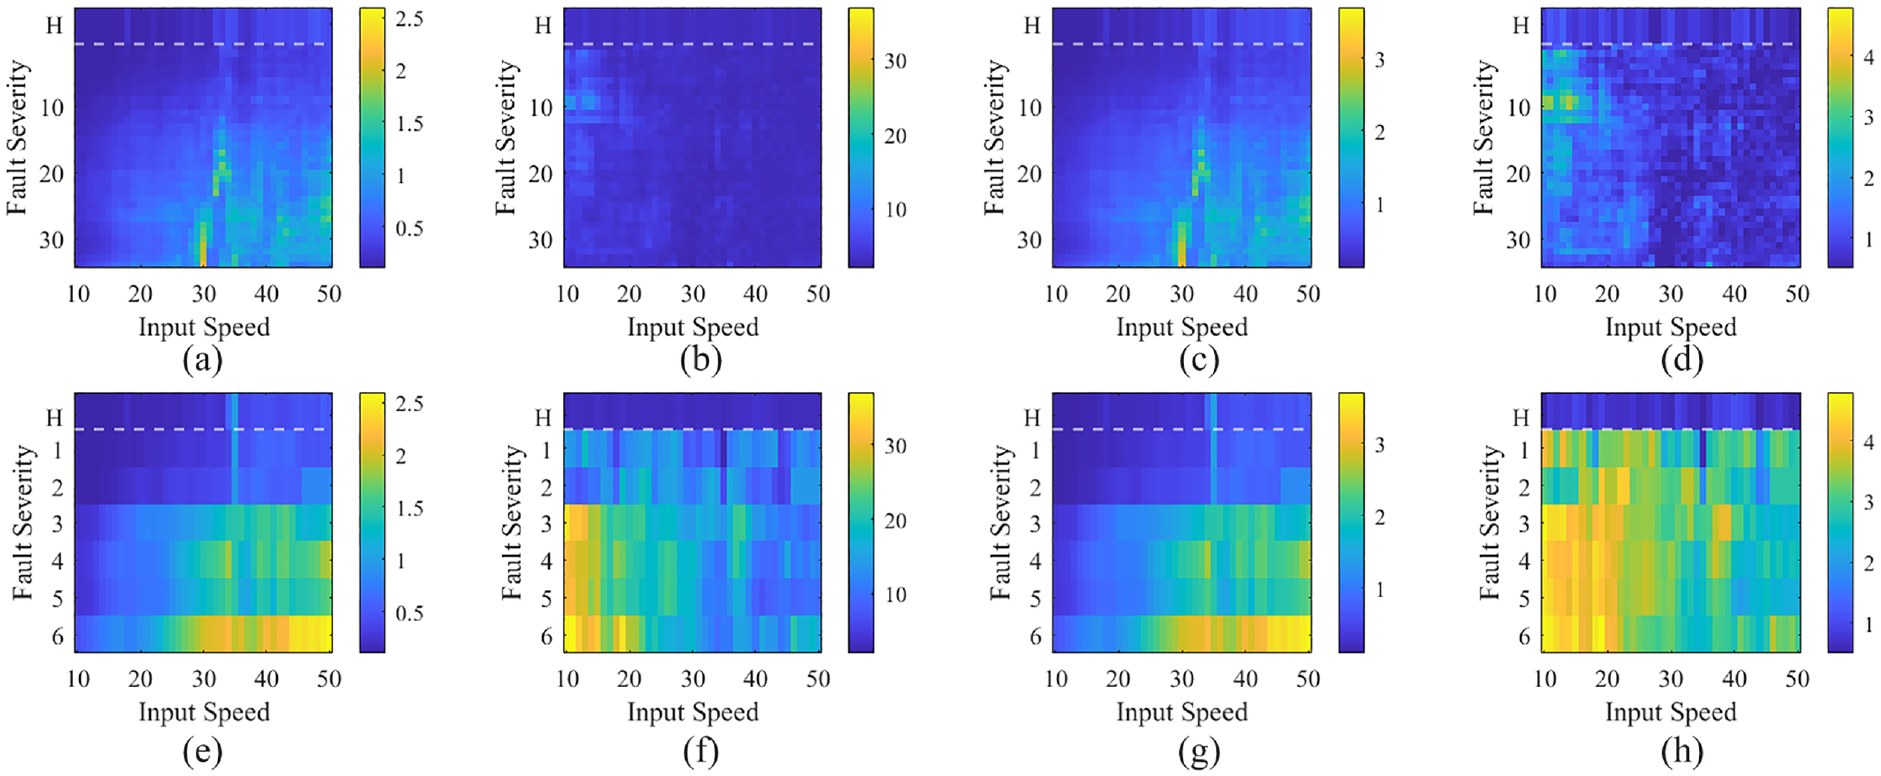
Heatmaps depict the variation of common features relative to speed and fault severity in both the distributed wear experiment (top row) and the localized fault experiment (bottom row): (a) rms(diff), (b) kurt(diff), (c) rms(env(diff)), (d) skew(env(diff)), (e) rms(diff), (f) kurt(diff), (g) rms(env(diff)), and (h) skew(env(diff)).
To better illustrate the limited effectiveness of traditional features in detecting distributed faults, we conducted another experiment with a setup similar to that of wear faults. However, in this case, a different fault with a similar pattern was deliberately introduced only to a single tooth, resulting in a localized fault rather than distributed wear. As depicted in the heatmaps in Figure 3(e) to (h), all three criteria outlined earlier are evident in the case of the localized fault. Specifically, the features exhibit variation in the early stages of the fault, displaying clear trends that increase with severity across all speeds. These observations underscore the challenges associated with diagnosing distributed wear faults using conventional features.
Spectral analysis
Spectrum dependency in speed
The synchronous average is calculated after the signal undergoes angular resampling, which transforms the signal from the time domain to the cycle domain.
26
The spectrum is then calculated in the order domain, where each order is the frequency normalized by the synchronized speed (

A fundamental principle of order tracking in gear vibrations is that the representation of gear mesh harmonics and their modulation sidebands in the order domain remains invariant with respect to speed. 35 However, structural frequencies remain constant in the frequency domain, implying that their representation in the order domain is artificially speed dependent. 36 Generally, the spectrum is dominated by resonating frequencies. Therefore, according to Equation (1), we anticipate that different harmonics of the gear mesh will emerge at each speed due to the variation in the representation of structural frequencies in the order domain. Figure 4 depicts synchronous average spectra across representative health cases, illustrating the speed-dependent variation of frequencies suspected to be structural frequencies. Consequently, we recognize that spectral analysis should not rely solely on specific gear characteristic orders but should encompass a broader examination of different bands in the spectrum.
Variation of the synchronous average spectrum across speed at representative stages of the experiment: (a) Healthy, (b) W17, and (c) W34.
Spectral energy
In general, analyzing the signal in the cycle domain relies on the premise that fault-associated patterns cause significant variations in the shape of the dynamic response. For instance, we expect that a sharp and impulsive response will result in higher kurtosis. Figure 5 illustrates the challenge of detecting distributed wear faults in gears compared to localized tooth faults in the cycle domain. Two severe faults of similar dimensions were tested against a healthy status: one affecting only a single tooth (localized fault) and the other affecting all teeth (distributed wear). The figure presents three frames, each representing one experiment, depicted in distinct colors. Within each frame, three signals are displayed: the synchronous average signal, and its decomposition into gear mesh harmonics and different signals. For localized faults, the sharp, impulsive response is prominently visible in the synchronous average signal, particularly in the modulation sidebands comprising the difference signal. However, distributed wear faults do not produce impulsive responses, and the fault-associated patterns in the signal are less obvious and considerably challenging to identify when compared with the healthy case. Therefore, we turn to spectral analysis, where the shape of the dynamic response does not necessarily play a crucial role. As will be demonstrated later, wear expression is clearer in spectral analysis.
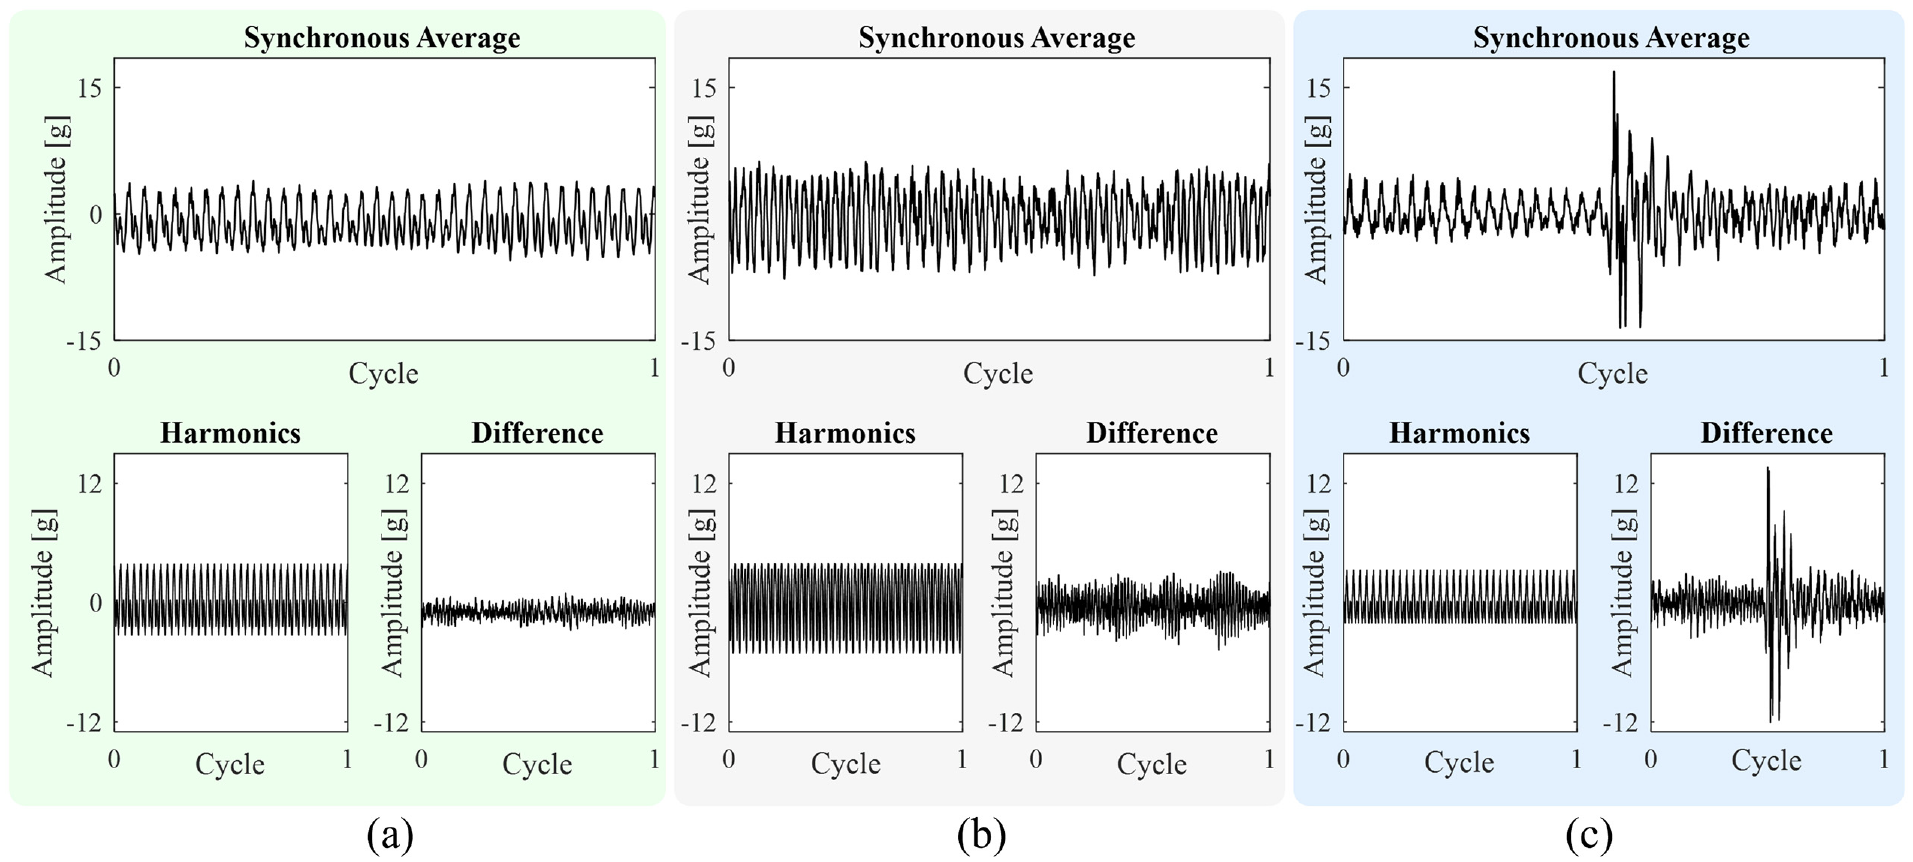
Synchronous average comparison: (a) healthy, (b) distributed wear fault, and (c) local tooth fault.
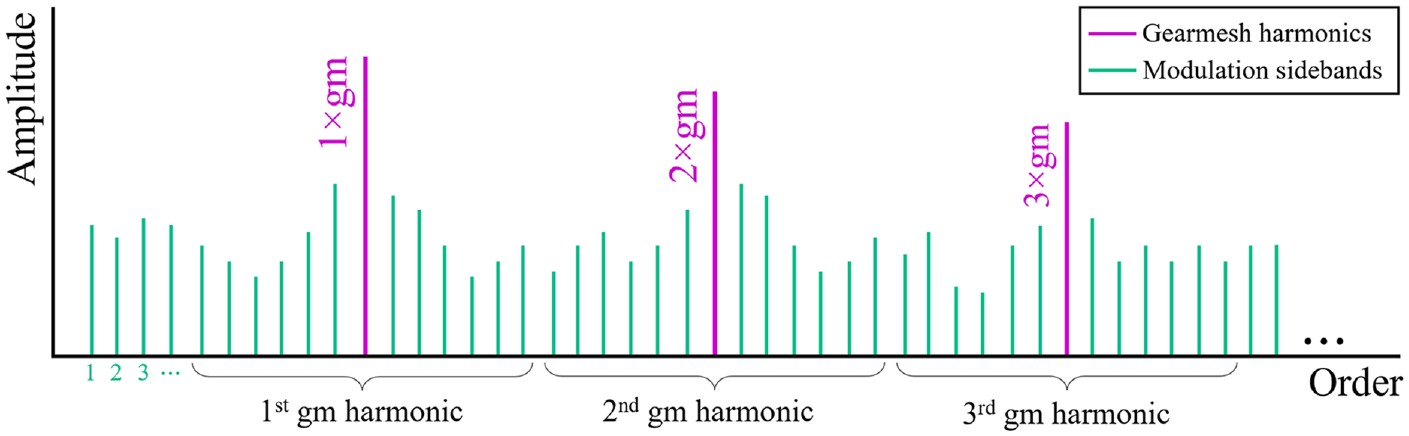
The dynamic behavior of gears is dominated by the gear mesh frequencies, both in healthy and faulty conditions. The dominance of the gear mesh frequencies, coupled with their sensitivity to operational conditions, has withheld their use in fault diagnosis, assuming that even if the fault manifested somehow at the gear mesh harmonics, it would be obscured by other unrelated factors. As depicted in Figure 5(c), local faults clearly manifest in the different signal, making the contribution of gear mesh energy negligible. Conversely, as shown in Figure 5(b), distributed wear fault manifestation is not self-evident compared to the healthy condition depicted in Figure 5(a), indicating the importance of analyzing both gear mesh energy and sideband energy. Hence, in this study, we investigate the manifestation of wear faults in the gear mesh energy (gme) and sideband energy (sbe). We separate the synchronous average spectrum (

An illustration of the synchronous average separation.
The heatmaps in Figure 7 illustrate the gme and sbe in relation to gear mesh harmonic across fault severity, for representative speed levels. For each speed and energy (i.e., gme and sbe), the figure presents two heatmaps: one showing the spectral energy with a broad color gradient, and the other displaying the same spectral energy, standardized according to the healthy condition. In the standardized energy heatmaps, energy scores are depicted with one of three colors based on the confidence interval: values greater than 10 are represented in yellow to indicate significant separation, values lower than 3 appear in dark blue to denote regularity, and values within the range of 3 to 10 are depicted in teal. The healthy condition, denoted by “H” on the Fault Severity axis, is visually highlighted with a thicker bin and separated from the faulty cases by a white line for clarity and convenience. This analysis, inspired by observations in Figure 4 regarding sensitivity to speed, aims to showcase that for each rotational speed, there are specific gear mesh harmonics where the spectral energy significantly changes in the presence of a fault and maintains distinct values as the fault degrades, with high confidence. Additionally, the separation between gme and sbe serves to specifically evaluate the role of gear mesh analysis in wear diagnosis.
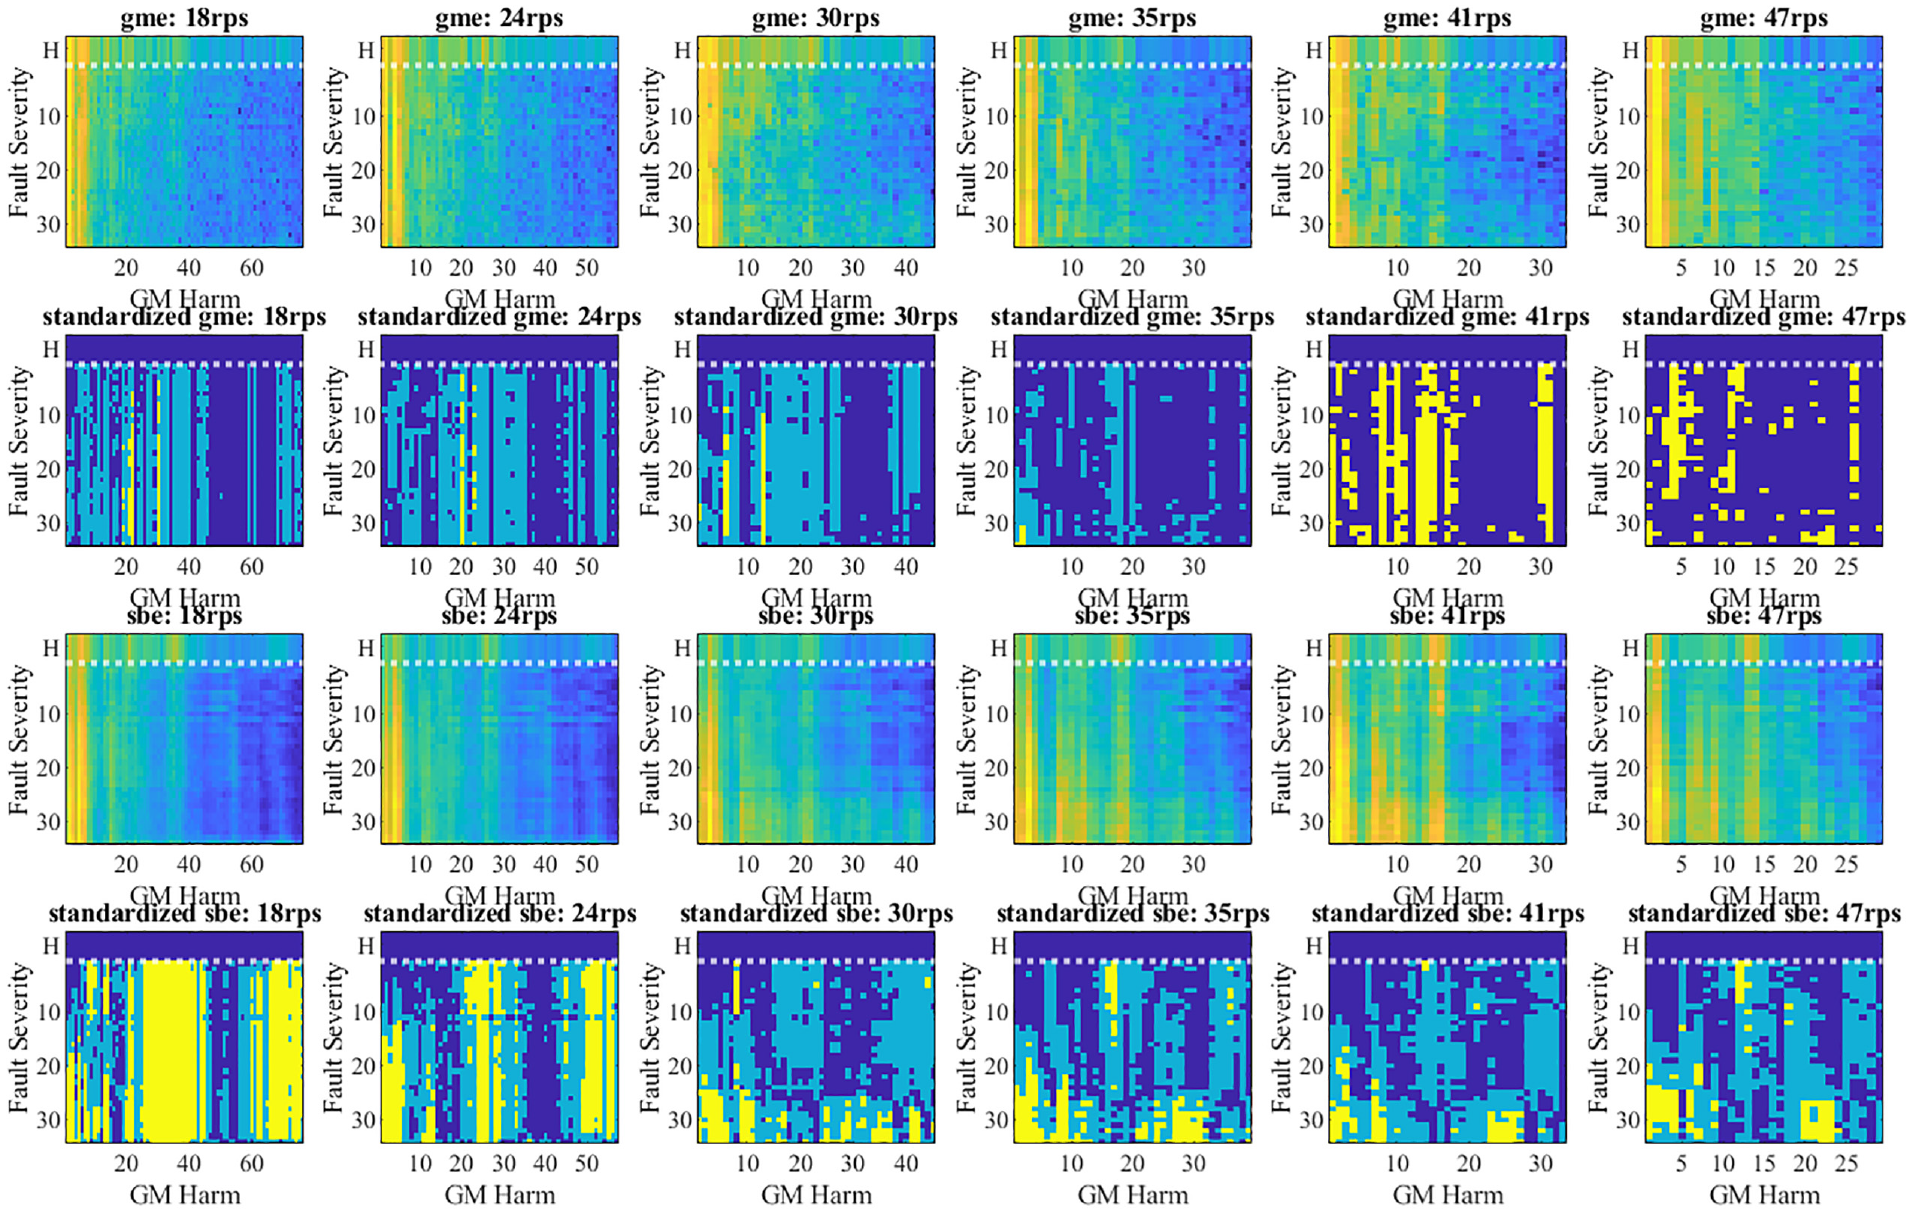
Spectral analysis of the sbe and gme before and after standardization.
It is evident that spectral energy is strongly influenced by speed, as expected. The spectral energy may either increase or decrease with fault severity, depending on the speed. Moreover, the trends vary unpredictably with speed, making it difficult to assert whether lower or higher speeds are preferable for better wear diagnosis. However, concerning the primary objective of this analysis, it is observed that for each speed, there is at least one gear mesh harmonic (or often more) where wear can be detected with high confidence. While the behavior may display some inconsistent trends, it remains statistically distinguishable from the healthy condition in most cases. Regarding the significance of gear mesh analysis, it is evident that incorporating gear mesh energy alongside sideband energy in the spectral analysis holds considerable value for wear diagnosis.
In summary, traditional methods for gear diagnosis have struggled to detect distributed wear faults. However, as showcased in this section, the spectrum of the synchronous average has emerged as a promising domain for meaningful feature extraction, based on spectral energy, encompassing both gear mesh harmonics and modulation sidebands. Since the precise region in the spectrum where faults are amplified remains uncertain, a strategic fusion of spectral energies could be pivotal for robust wear diagnosis for two main reasons: first, the amplified areas in the spectrum may correlate with structural frequencies that vary across different machines, and second, addressing the speed dependency of these areas may be achievable by examining different bands separately.
Anomaly detection of gear wear
In this section, we delve into anomaly detection of gear wear, building on insights derived from the investigation outlined in previous sections. Initially, we emphasize the significance of accounting for assembly operations in a healthy condition to prevent the test-training leakage issue. Subsequently, we undertake a thorough comparison between two Health indicators (HIs): one relying on conventional features and the other introduced as a novel approach in this study. We assess the performance of the new algorithm against traditional ones. Finally, we showcase the impact of physical preprocessing on deep-learning-based anomaly detection of gear wear.
Assembly and dismantling and test-training leakage
In controlled-degradation experiments, inducing faults requires repetitive assembly operations of the inspected gear. Consequently, the vibration signature in each faulty case is affected both by health status and assembly operations. Assembly operations introduce variance unrelated to the health status, posing a challenge for the examination of anomaly detection algorithms. For example, when the algorithm detects a small fault as an anomaly supposedly related to the health status, it may actually be attributed to detecting assembly operations rather than the fault itself. Hence, we conduct repetitive idle assembly operations within each case, that is, assembling and dismantling the gear without inducing health degradation. This is done to introduce consistent variance in the data, akin to the controlled-degradation process.
Figure 8 illustrates the variation in the rms of the synchronous average signal at 45 rps throughout the experiment, with “H” representing the healthy status. Each health status is delineated by dashed lines, and within each bin, different assembly groups are presented alongside each other. Two noteworthy observations emerge from the results: firstly, the rms varies among assembly groups within the healthy condition, highlighting the significant impact of assembly operations; secondly, when comparing results between healthy and faulty conditions in the early stages, the variation stemming from assembly operations is as prominent as that resulting from the fault. However, for larger faults, the increasing trend in the rms becomes more evident, indicating the effects of the fault on the vibrations.
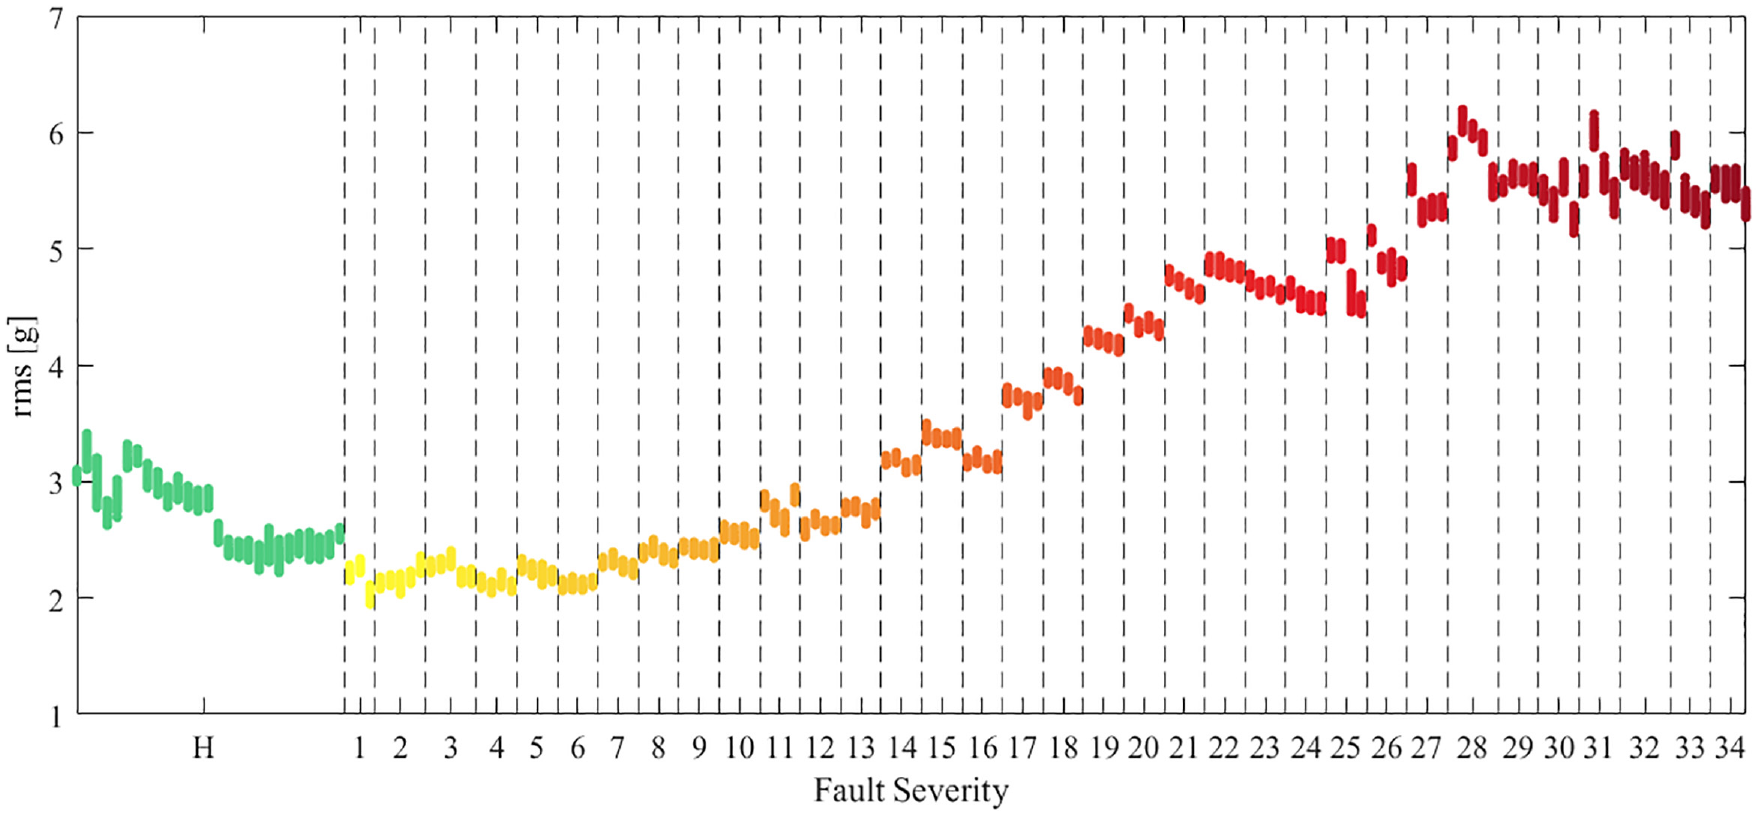
Variation of the rms of the synchronous average throughout the experiment at 45 rps speed.
The rms trend in Figure 8 underscores that overlooking the impact of assembly operations when evaluating anomaly detection algorithms can result in an overly optimistic assessment of the tested algorithm’s performance. A naïve approach might involve using healthy data from a single group, without introducing any assembly operations, and dividing this data between the training and test sets. The absence of multiple assembly operations could create a misleadingly optimistic impression of the ability to detect faults. For instance, as depicted in the figure, relying solely on healthy instances from the first (leftmost) healthy group would suggest that rms identifies incipient faults with a significant safety margin. In practice, considering all healthy states reveals that rms can only detect anomalies in advanced severities. Therefore, it is crucial to conduct multiple assembly operations in a healthy status, partitioning the healthy data between the test and training sets based on assembly groups rather than randomly. This approach helps prevent information leakage from the test set to the training set, a phenomenon referred to as test-training leakage. 32
Traditional HI
Most of the traditional HIs suggested for gears over the years are based on fusion of features extracted from the vibration signal.17,18 However, it is worth mentioning that most of these HIs aim to detect localized faults such as breakage and pitting. We previously showcased the limitations of traditional features in diagnosing distributed wear faults. In this study, we introduce a novel physical HI and a deep learning-based HI and demonstrate their potential for diagnosing wear. The effectiveness of the proposed HIs is assessed by comparing it to a traditional HI using common features. These features include the rms and kurtosis of the difference signal, as well as the rms and skewness of the envelope of the difference signal.21,22,34,36 The HI referred to as “traditional” in this study is calculated as the standardized root mean square of these four features, as outlined in the block diagram in Figure 9. This involves standardizing the features according to the healthy samples in the training set and then aggregating them into a single HI. Subsequently, the aggregated HI is standardized again to analyze the HI values in terms of statistical significance.
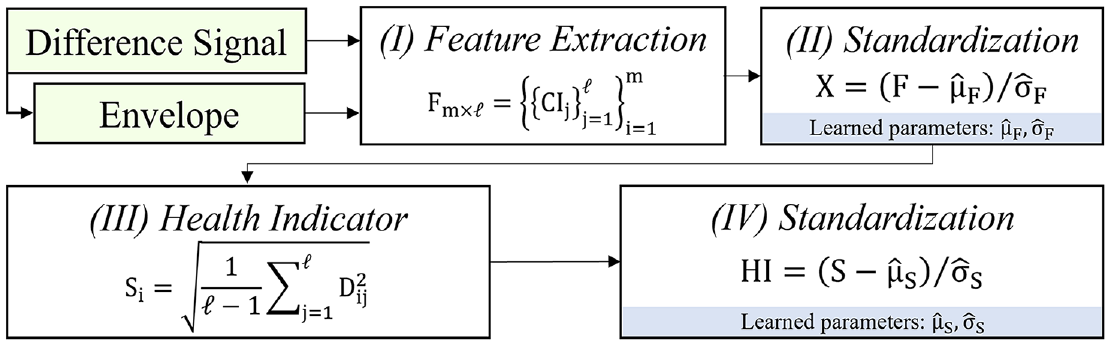
A schematic block diagram of the traditional HI.
Novel physical HI
We introduce a novel physical HI for anomaly detection of gear wear based on the following insights developed throughout this study:
Common features extracted from the difference signal may be inadequate for detecting distributed wear faults.
Spectral analysis of the energy at the gear mesh harmonics is crucial for wear monitoring, despite being traditionally considered less effective for monitoring localized faults.
Spectral analysis of the modulation sidebands remains essential for monitoring gear faults, whether they are localized or distributed.
The proposed novel HI is calculated through the fusion of features extracted from the synchronous average spectrum, involving a series of standardization and orthogonalization operations, as outlined in Figure 10 and described below:
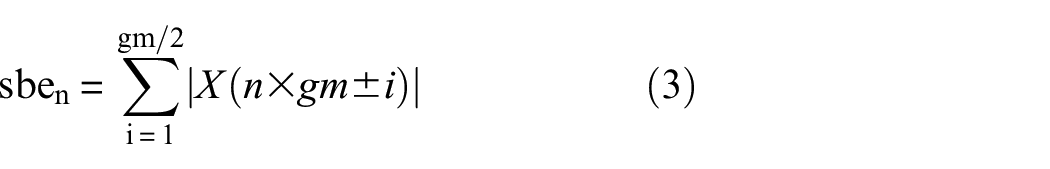
Step I—Feature extraction—calculating the gear mesh (gme) and sideband (sbe) energies of each gear mesh harmonic according to Equations (2) and (3). The result is a list of 2n features representing each sample in the dataset, where n is the number of gear mesh harmonics available within the bandwidth.
Step II—Standardization—the algorithm learns the mean and standard deviation of the healthy training data and standardizes the features according to them so that high and low energy values receive the same weight in the orthogonalization process.
Step III—Centering—the algorithm learns the mean of the standardized features from the healthy training data and subtracts them, centering the data around zero before orthogonalization.
Step IV—Orthogonalization – the standardized centralized features are orthogonalized by a linear transformation. The algorithm learns the transformation matrix during training by calculating the eigenvector matrix of the covariance matrix. Note: Steps III and IV resemble principal component analysis, which is mainly for dimensionality reduction, while our focus is solely on feature decorrelation.
Step V—Standardization—the algorithm learns the mean and standard deviation of the orthogonalized training data and standardizes the data according to them so that high and low values receive the same weight in the HI.
Step VI—HI—the raw HI is calculated as the root mean square of the standardized orthogonalized features.
Step VII—Standardization—the raw HI is standardized to enable interpretation in terms of confidence intervals.
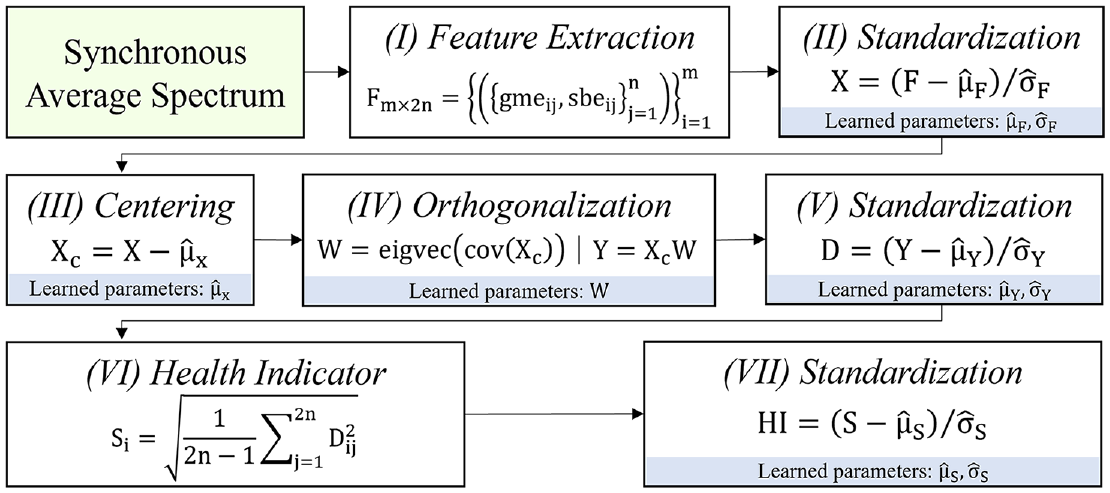
A schematic block diagram of the novel physical HI.
Deep learning-based HI
Deep learning algorithms are crafted to tackle tasks involving the recognition of complex patterns in large datasets. One common application is anomaly detection. In this study, we proposed a physical HI grounded in comprehensive insights derived from experimentation and advanced signal processing. The proposed physical preprocessing methodology involves extracting and engineering energy-based features from the synchronous average based on smart separation in the spectrum. This methodology serves as a general framework for the physical preprocessing of monitoring gear wear using vibration data. We apply this framework to train and test a deep autoencoder network for anomaly detection. In doing so, we not only showcase the effectiveness of the physical preprocessing framework for intelligent fault diagnosis but also assess the performance of the proposed physical HI in comparison to a conventional deep learning-based HI.
Various types of autoencoders can be used for anomaly detection.
37
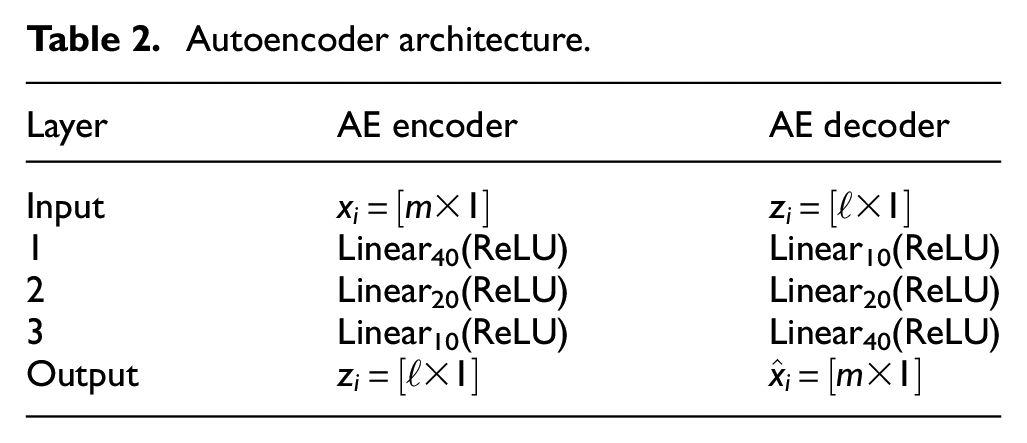
We focus on Undercomplete autoencoder, where the dimension of the latent variable space is smaller than that of the input.
37
Autoencoders are trained on regular data to reconstruct it well, aiming for low mean squared error between input and output. This compression of data into the latent space involves making assumptions about the regular data distribution. When new data deviates from these assumptions, the reconstruction error is high, indicating an anomaly. For example, in Figure 11, in a scenario where regular data is distributed along a unit circle circumference, successful training enables the encoder to reduce examples from
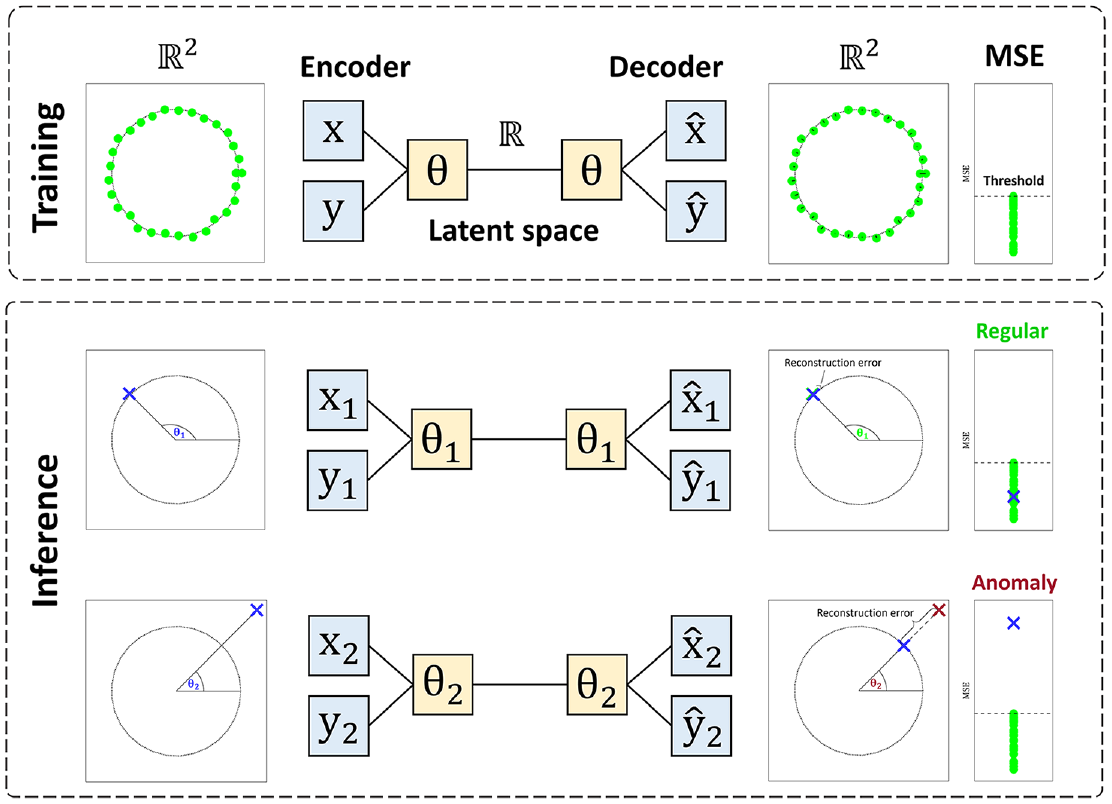
An illustration of anomaly detection by deep-learning based autoencoder.
In this study, we construct a deep learning-based HI (
Autoencoder architecture.
Results
Representative results of the HI analysis are presented in Figure 12, using the data measured in the tangential direction at the sensor mounted near the driving motor under a rotational speed of 45 rps. The results compare the traditional HI with the novel physical HI and the deep learning-based HI. The HIs of the healthy status in the test set appear in green with different assembly groups presented alongside each other. The results of each assembly group refer to the case when that group was in the test set. HIs for different wear severities appear with gradient color, shifting from yellow toward red with increasing health degradation, considering the case where all healthy data were used for training.
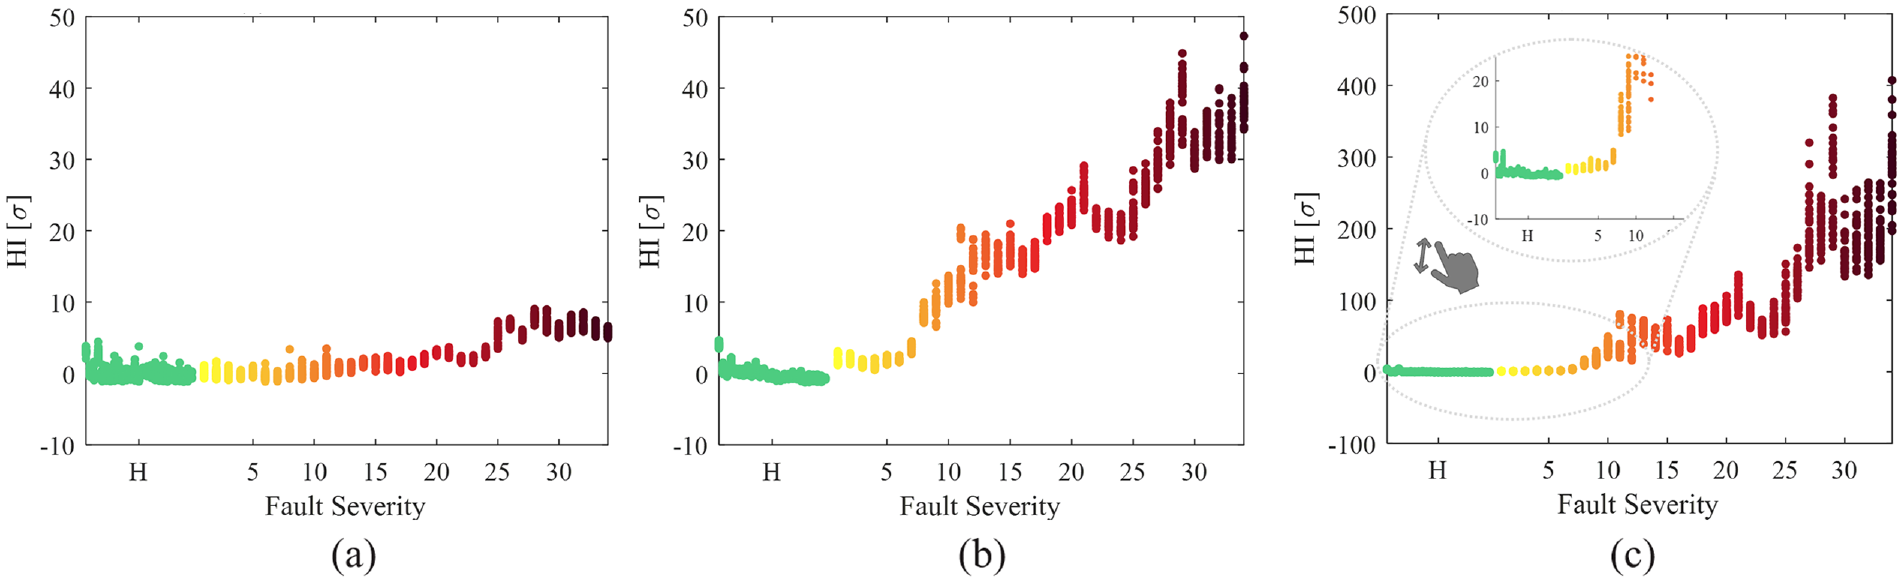
HI Comparison at 45 rps: (a) traditional HI, (b) novel physical HI, and (c) deep learning-based HI.
When analyzing the trend of the novel physical HI, all the criteria defining a good feature established in this study are met. Faulty results can be distinguished from healthy results in the early stages to some extent, while the HI trend either increases or remains at a high value with health degradation. In addition, the deep learning-based HI also shows clear trends indicating its ability to detect faults and monitor health degradation. In contrast, it is evident that the traditional HI falls way behind both the novel physical HI and the deep learning-based HI. The primary indicator of weak performance in the traditional HI is its trend, which remains almost unchanged with fault degradation, maintaining low values that barely exceed the healthy results.
In summary, the HI results showcase that the traditional HI fails to detect distributed wear faults, as expected. The proposed physical preprocessing framework, motivated by the spectral analysis of the gear mesh and sideband energy, extracts complex patterns manifested in the spectrum, thus allowing for the novel physical HI and the deep learning-based HI to achieve superior results.
The proposed framework for the novel physical HI is benchmarked against existing approaches, including traditional and deep learning-based HIs. Figure 13 summarizes the performance analysis of the HIs across two speed levels (15 rps, 45 rps), and all six vibration channels (see Figure 1), totaling 12 cases. The Receiver Operating Characteristic - Area Under the Curve (ROC–AUC) score, a common metric for evaluating anomaly detection tasks, 38 is used. AUC scores are compared among the novel physical HI, the deep learning-based HI, and the traditional HI, using bar plots with error bars indicating the errors in estimating the mean value across all repetitions. The AUC score is calculated for a balanced leave-one-out dataset, comprising a single assembly group of healthy data and, as a strict criterion, only the incipient wear fault. It is evident that the novel HI achieves superior AUC scores in most channels and for both speed levels. The performance of the deep learning-based HI does not fall behind the novel physical HI and shows very similar results, and in some cases either inferior or superior compared to the novel physical HI. In contrast, in the traditional HI, AUC scores are mostly close to 0.5 for most channels, indicating that its performance is no better than random guessing. While the HI results at 45 rps may demonstrate superior performance compared to the results at the lower speed of 15 rps, these differences may be attributed to the sensitivity of the vibration signature to rotational speed, particularly in wear monitoring, as discussed previously. The performance of the AUC scores highlights a significant improvement in detecting wear faults in their early stages in a wide range of cases and across different speeds and sensors when using the proposed novel physical HI, and also deep learning-based HI, where the input data undergone through physical preprocessing that is grounded in comprehensive investigation of distributed wear faults.
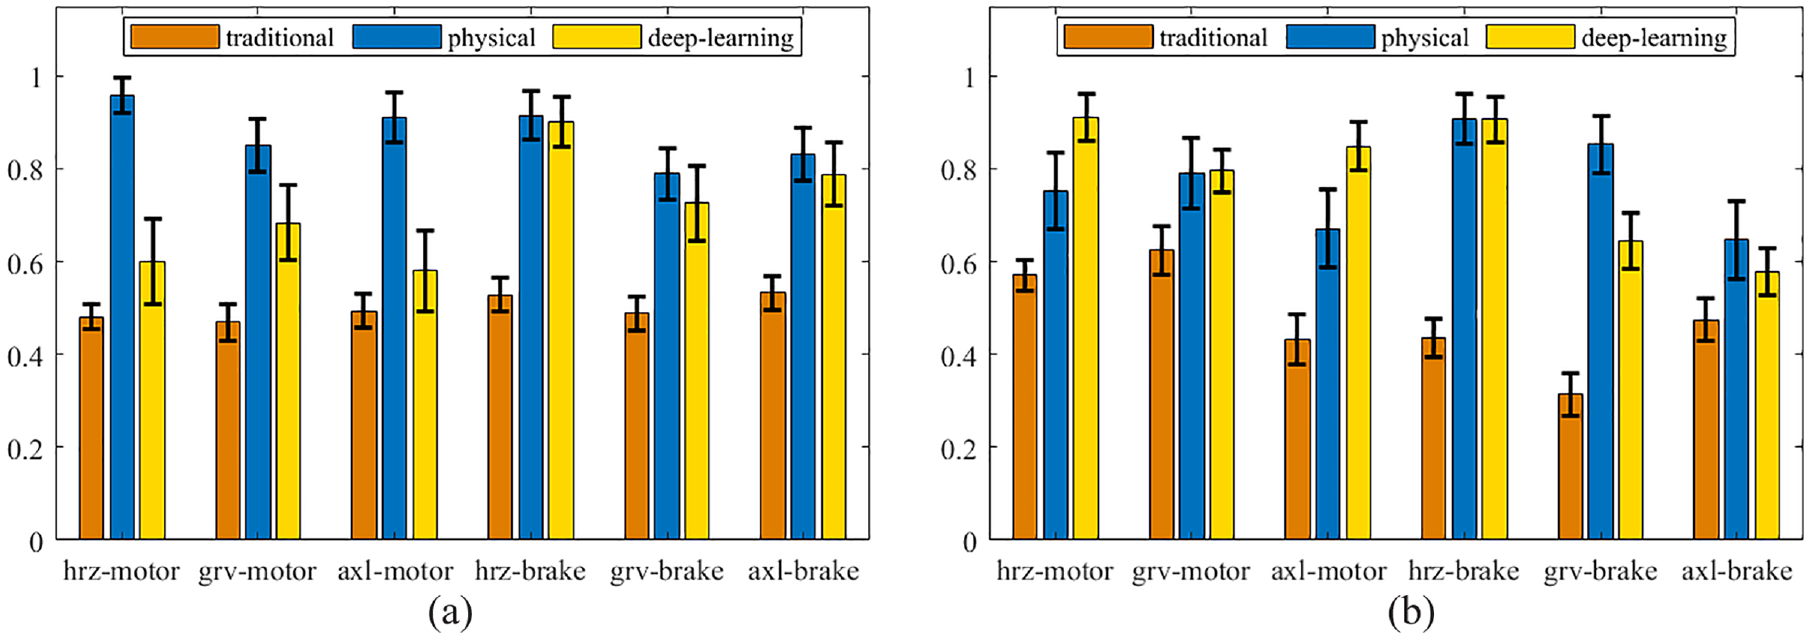
ROC–AUC scores compared across vibration channels and HIs at 45 rps (a) and 15 rps (b).
Conclusion
This study aims to characterize distributed gear wear faults and introduce new anomaly detection algorithms. While gear diagnosis has mainly advanced in monitoring localized faults, distributed wear faults remain one of the most complex challenges in this field. Specifically, we addressed three gaps identified in the literature: the absence of controlled-degradation experiments in gear wear analysis, inadequate understanding of how gear wear manifests in vibration signatures, and the lack of concise algorithms for early anomaly detection of wear. We conducted wide-scale controlled-degradation experiments to address these existing gaps, which were conducted in two parts as follows:
In the first part, we characterize gear wear in the vibration signal. We collected an extensive database comprising vibration signals from dozens of wear cases across various rotational speeds. We extracted common features for gear diagnosis and examined their suitability for diagnosing gear wear. We define the quality of a feature by its ability to detect faults in the early stages, maintain significance as health degrades, and consistently work across speeds. We showed that traditional features may be useful for monitoring localized faults but fail to detect distributed wear faults. Instead, we suggest spectral analysis to capture complex patterns associated with the fault. We emphasize the importance of analyzing both gear mesh energy and sideband energy for wear monitoring, highlighting years of overlooking the contribution of gear mesh energy to diagnosis. Additionally, we demonstrated the sensitivity of spectral analysis in the order domain to rotational speed, acknowledging the speed-dependent representation of structural frequencies in the order domain. Based on this investigation, we proposed a spectrum separation method based on gear mesh harmonics, showcasing that at least one harmonic of the gear mesh will express the manifestation of wear.
In the second part of the study, we introduce novel HIs for anomaly detection of gear wear. We collected a large volume of vibration data from dozens of wear cases across two speed levels and six vibration channels, introducing variance to the healthy data through repetitive assembly operations. First, we emphasize the importance of considering assembly operations when training anomaly detection algorithms to avoid the problem of test-training leakage. Then, we compare the performance of three HIs: a traditional HI based on common features, a novel physical HI derived from insights gained through fundamental investigations of gear wear, combined with a unique flow of advanced feature engineering techniques. Lastly, we highlight the effectiveness of the suggested framework for physical preprocessing and introduce a deep learning-based HI based on the reconstruction error obtained from a trained autoencoder network for anomaly detection. The traditional HI performed poorly and could not even detect wear in advanced severities, as expected. Both the novel physical HI and the deep learning-based HI showed superior performance, with the novel physical HI achieving higher scores in most cases.
In conclusion, this study sheds new light on the manifestation of distributed gear wear faults in the vibration signature, offering a physical framework for diagnosing these faults. We introduce a novel physical HI that has undergone rigorous examination across numerous fault severities, rotational speeds, and vibration sensors, demonstrating its superiority over traditional methods and deep learning-based algorithms. The proposed novel anomaly detection methods pave the way for addressing fault severity estimation techniques for gear wear, employing a hybrid approach that integrates physical knowledge with learning algorithms.
Limitations and future scope
This study enhances the understanding of gear wear in the vibration signature, bridging a knowledge gap that has been scarcely addressed in the literature. However, several limitations should be noted for future work:
The wear seeding process aimed to mimic natural wear, yet discrepancies may exist between artificial and natural faults, warranting further exploration of real-world degradation.
The variance introduced in the data stemmed solely from assembly operations; future work could incorporate additional realistic methods to better simulate real-world conditions.
The suggested HI is inherently speed-dependent, with performance potentially varying under different operational conditions, indicating a need for additional research with appropriate data acquisition.
This study focused on anomaly detection; leveraging the insights gained here, future investigations could expand to address fault severity estimation and other wear prediction tasks.
Footnotes
Acknowledgements
We extend our deepest appreciation to Amit Lazar for his dedication and commitment to the experiments presented in this study. We gratefully acknowledge the invaluable support of the Pearlstone Foundation. Omri Matania is supported by the Adams Fellowships Program of the Israel Academy of Sciences and Humanities
Declaration of generative AI and AI-assistedtechnologies in the writing process
During the preparation of this work, the authors used ChatGPT 3.5 exclusively to improve readability and language. After using this tool, the authors meticulously reviewed and edited the content as needed and take full responsibility for the content of the publication.
Declaration of conflicting interests
The author(s) declared no potential conflicts of interest with respect to the research, authorship, and/or publication of this article.
Funding
The author(s) received no financial support for the research, authorship, and/or publication of this article.