
Abstract
Aerospace composite components require effective monitoring techniques to detect possible internal damage from impact events. To ensure reliable impact identification, sensor measurements can provide valuable information about impact energy and identify potential issues that may require further investigation. However, selecting the most appropriate sensor technology to measure impact force and energy is a challenge. In this article, a systematic and structured approach is presented to compare the expected performance of sensors and their metrological parameters in terms of their ability for impact identification in aerospace composites. The proposed methodology is demonstrated using an application example where fibre Bragg grating (FBG) are compared with piezoelectric (PZT) sensors through comprehensive tests. These tests include the correlation test, the sensitivity test, and the factor test. The correlation test showed a high agreement between FBG and PZT sensors in the time and frequency domain. The sensitivity test indicated a significant correlation between the signal features and the impact energy levels in the energy profiling diagrams, revealing nonlinearities and energy losses indicative of damage. Furthermore, these results emphasise the superior resolution of the FBG sensors and the comparable repeatability of the two sensor types. Finally, the factor test showed that FBG sensors are sensitive to different angles of incidence, while PZT sensors have a more stable directivity. Further analysis also showed that the signal strength of both sensor types decreases with increasing distance from the impact source. Overall, the proposed approach enables a thorough evaluation of the capabilities and limitations of both sensor types. Consequently, it provides information to make an informed decision on the most suitable sensor for impact monitoring systems.
Keywords
Introduction
In aerospace applications, high-performance composites offer several advantages, including high strength-to-weight ratio, optimal aeroelastic tailoring, superior aerodynamic efficiency, low coefficient of thermal expansion, versatile design options, high-dimensional stability and excellent wear resistance. 1 However, the primary safety issue for aerospace composites is the so-called ‘barely visible impact damage’ (BVID). 2 BVID can result from impact events with no visible surface effects and can lead to catastrophic failure if not detected in time. 3
The need to better detect and characterise BVID and to optimise maintenance actions has led to the development of more efficient and integrated monitoring techniques. Consequently, structural health monitoring (SHM) has emerged as a promising method for assessing the condition of composite structures. SHM methods have been developed to improve current aircraft maintenance practises through advanced and automated technologies that incorporate built-in sensors and intelligent algorithms.4,5
In this context, sensor readings can offer valuable information for establishing a reliable impact identification method, developing condition monitoring systems, predictive maintenance techniques and efficient design strategies. However, identifying the most suitable sensor technology for performing an inverse impact response analysis is a significant obstacle in providing a practical solution for SHM in aerospace.
A number of studies in the literature report discussions on sensor solutions for monitoring systems in impact identification applications, many of them based on fibre Bragg grating (FBG) measurements. Frieden et al. (2012) 3 used strain data from FBG sensors to evaluate natural frequencies for an optimisation approach to characterise impact damage in composite materials. The identification results showed reasonable agreement between numerical and experimental changes in natural frequency. Similarly, Rezayat et al. 6 developed a model-based identification approach based on FBG-measured strain signals to localise and reconstruct single-point forces on structures. The proposed method, based on variable selective least squares, achieved better accuracy than the classical methods, such as the pseudo-inverse method. In addition, Jang et al. 7 investigated a neural network algorithm for identifying impacts in a composite wing box structure using FBGs. The research focused exclusively on source localisation and showed greater efficiency when applied to realistic structures compared to previous work.
However, despite the promising results reported on FBG monitoring systems, there is a lack of comprehensive studies that systematically and impartially evaluate the performance of a specific sensor technology compared to a well-established sensor system. Previous studies relied on test setups designed for a single-sensor technology and limited quantitative assessment. To overcome these limitations, this article introduces a novel structured scheme for measuring and evaluating sensor performance and metrological parameters for impact identification.
When evaluating the performance of sensors, it is crucial to assess the effectiveness of their signal features. These features play a critical role in the accuracy, sensitivity and robustness of identification and monitoring systems. Efficient features enable accurate detection and identification and reduce false alarms and missed detections, especially in noisy environments. In this context, previous research8–15 has consistently associated high noise levels with reduced performance and increased modelling errors in impact identification methods. Therefore, the proposed approach also implements a stepwise signal processing framework to extract relevant features and improve the signal-to-noise ratio, thus deriving valuable information from the sensor data.
Moreover, signal features with high discriminatory power and interpretability are particularly valuable for informed decision-making and diagnosis. Accordingly, this article proposes the use of energy-sensitivity features as input for the comparative analysis. These energy sensitivity features, also referred to as relative energy measures, are essential for accurately characterising the dynamic response to impacts and precisely quantifying energy transfer during impact. For instance, their integration into neural networks has been shown to enhance predictive accuracy, as demonstrated by Sharif et al. 16 and Kalhori et al. 17 Additionally, they contribute to solving inverse problems, identifying and localising damage, and distinguishing between impact severities.18,19 This approach optimises detection capabilities and supports the development of more efficient monitoring systems.20,21
Establishing effective impact monitoring systems requires consideration of both optimised signal features and critical interaction factors. As such, several factors can influence impact response and measurement performance. In particular, the sensitivity of optical sensors varies depending on the direction of propagation of the dynamic waves, as the grating period and refractive index are mainly influenced by the axial strain. 22 In addition, attenuation is another important influencing factor, especially for composite materials. These materials are susceptible to attenuation effects due to energy dissipation and wave scattering caused by the viscoelastic nature of the matrix and material inhomogeneities. 23 Therefore, within the proposed framework, a comprehensive investigation is carried out to analyse how the directivity and attenuation properties influence the selected signal characteristics.
In order to validate and contextualise the designed framework for its application in impact identification, a drop-weight impact test was conducted. Overall, the main objective is to assess the ability of state-of-the-art sensors to estimate impact energy in a test setup designed to position both sensors in the same location under various impact scenarios. Low-energy and high-energy impacts are applied to the target structure so that impact responses can be analysed in both the pristine and damaged states. The data was collected using two prominent sensor technologies: FBG and Piezoelectric (PZT) sensors. Piezoelectric sensors offer high sensitivity, compact size, lightweight, robustness and low-power consumption and serve as both actuators and sensors. 24 However, they are susceptible to electromagnetic interference, require wired connections and have an operating temperature limit of up to 150°C.1,4 In contrast, FBGs are immune to electromagnetic interference, offer high sensitivity and are easy to integrate. These optical sensors are sensitive to axial displacements and use a multiplexed optical fibre with a narrow-band reflector consisting of uniformly distributed gratings.1,25,26 Although FBG sensors are well-suited for dynamic strain detection, they also have limitations, such as directionality and limited sampling rate.
Several authors16–21,27–31 have validated the effectiveness of PZT sensors in SHM systems. These studies underline the robustness, high sensitivity and reliability of PZT sensors in detecting and localising impact events. Therefore, the results of PZTs are used as a reference for evaluating the performance of FBGs. This evaluation includes comprehensive tests to analyse signal correlation in both the time and frequency domain, sensitivity to noise and impact energy, and the effects of attenuation and directivity. Using a robust methodology, this work presents for the first time a structured approach to evaluating the strengths and limitations of sensor technologies, providing key insights for informed decision-making in the selection of sensors for impact monitoring systems. The potential of this approach is significant as it can be extended to evaluate the performance of any emerging sensor system for impact monitoring systems. Such evaluation is particularly important given the ongoing efforts to develop new sensor technologies to overcome the limitations of current sensors, such as long-term durability, integration into composite materials and signal interpretation under operational conditions.
This article is structured as follows: Drop-weight impact tests section outlines the application example, which includes the description of the material, the dynamic properties, the experimental procedure and the damage assessment by phased array scan inspections. Systematic comparison method section presents the structured approach to measuring sensor performance, focusing on relative energy measures, metrological parameters, signal processing schemes, comparison metrics and comprehensive testing. Results and Discussion section summarises the main findings and demonstrates the application of the frameworks. Finally, the last section explains the main conclusions.
Drop-weight impact tests
The application example presented in this section is based on a standard impact test, capable of addressing various sensor evaluation aspects in impact identification methods.
Material description
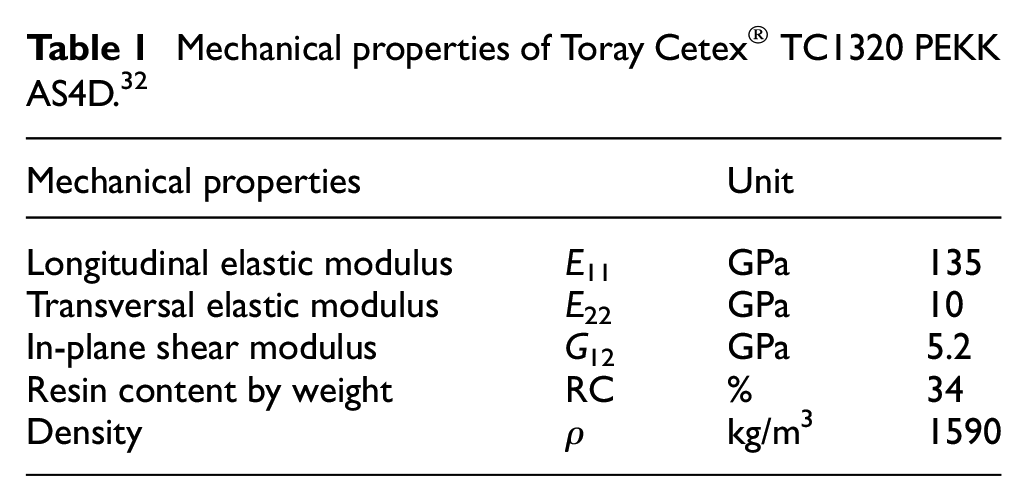
A square composite panel (1000 × 1000 × 3.55 mm) with a quasi-isotropic lay-up of 24 layers [−45, 0, +45, 90]3s and a ply thickness of 0.14 mm was manufactured by an autoclave moulding process with Toray Cetex® TC1320 PEKK (PolyEtherKetoneKetone) AS4D prepreg thermoplastic composite. Table 1 shows the elastic properties of the composite material at the lamina level, as specified by the manufacturer.
Mechanical properties of Toray Cetex® TC1320 PEKK AS4D. 32
Dynamic properties
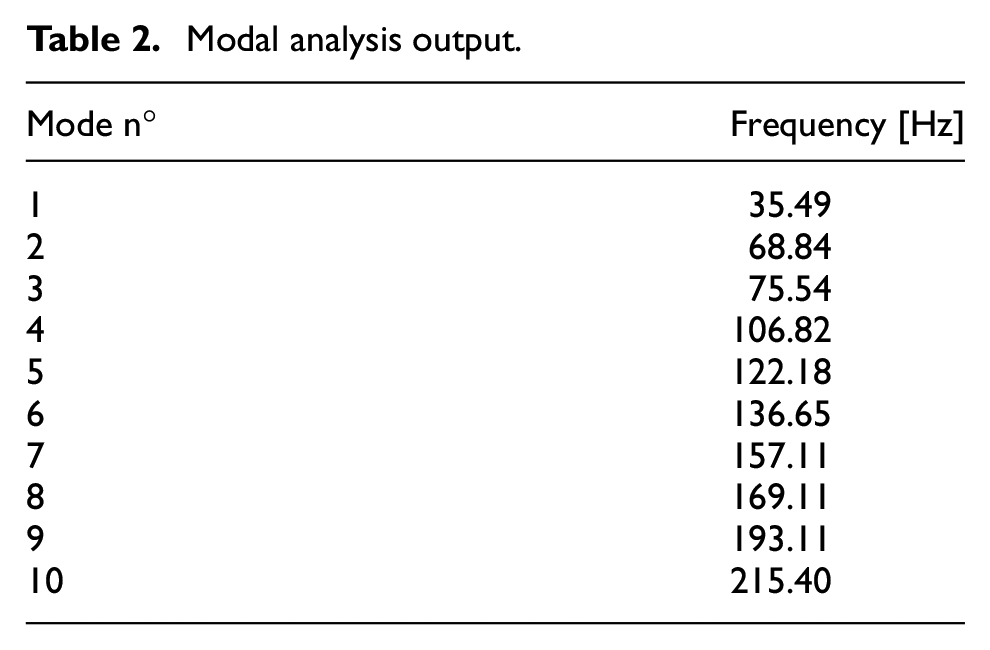
Dynamic properties are crucial to understanding the complex response observed in intermediate-mass impacts 33 and are, therefore, essential for a comprehensive comparison of the sensor technologies. In order to perform frequency analysis of the composite plate system, a finite element (FE) model was developed using the ABAQUS® software with a linear perturbation procedure. Given the small thickness of the composite laminate, it was discretised with linear four-sided shell elements (S4R). The composite layup was defined by specifying the orthotropic material engineering constants in a composite section. The orientation, geometry and material properties of the lamina were assigned as described in Table 1. The modelled area of the specimen corresponds to 960 × 960 mm, and the boundary conditions simulate clamped edges, as shown in Figure 1. The results of this analysis are summarised in Table 2 and include the first 10 natural vibration modes of the plate.
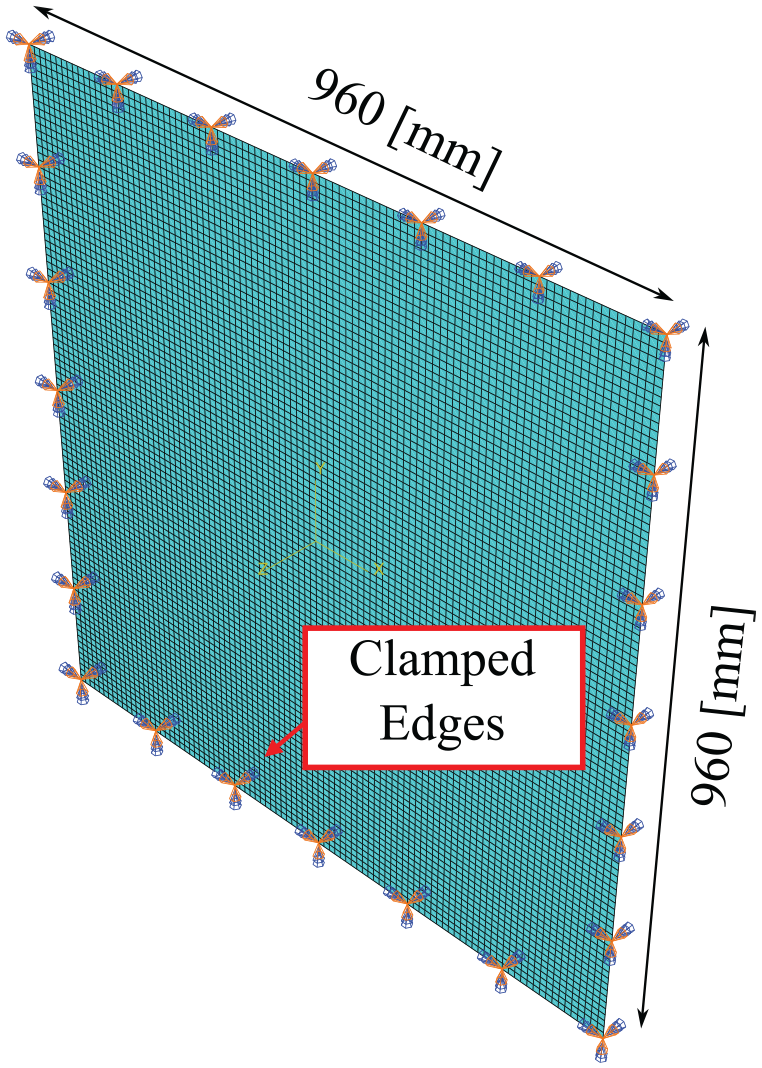
FE model for modal analysis.
Modal analysis output.
Experimental procedure
The composite panel was subjected to intermediate-mass impacts 33 using an impactor with a head diameter of 16 mm and a mass of 1.154 kg in accordance with the ASTM D7136M-15 34 guidelines. The test setup, shown in Figure 2(a), included an aluminium clamping frame to fix the panel onto the drop tower table.

Test setup and schematic experimental design: (a) test set-up and plate fixture, (b) schematic drop-tower assembly (sflag = 15 mm, sh = 127 mm), (c) sensor network configuration and impact locations ( PZT ★ Impact Locations). Dimensions in millimetres.
The instrumented drop-weight impact tower was designed to measure the contact load and velocity of the impactor during an impact. The assembly of the drop weight tower and its dimensions, namely sflag, sh and h, are shown in Figure 2(b). It is noteworthy that sflag and sh are constant throughout the experiment and are determined by the impactor characteristics. In contrast, the height h varies depending on the impact energy. A force transducer based on strain gauges, with a typical sensitivity of 0.5868 mV/V and a capacity of 9.961 kN compressive load, recorded the contact force during impact. The transducer was attached to the hemispherical tip of the impactor. In addition, a photosensor measured the velocity of the impactor before and after impact, as suggested in ASTM D7136M-15. 34 An HBM MGCplus measurement amplifier system and a National Instruments NI™ USB-625 data acquisition module were used to acquire the impact load and photosensor output signals at a sampling frequency of 250 kHz.
The measured values of the external excitation for the different impact energies are shown in Figure 3. Additionally, Table 3 contains details of 12 impact locations (I1–I12), including their respective coordinates and the nominal impact energies applied at each location. Notably, although Table 3 lists a maximum impact energy of 50 J, the corresponding force history is absent in Figure 3 due to unexpected issues with the load cell data collection for this specific impact. However, this limitation does not undermine the findings or the discussion that follows, as data from the other sensors were successfully recorded for this test run.
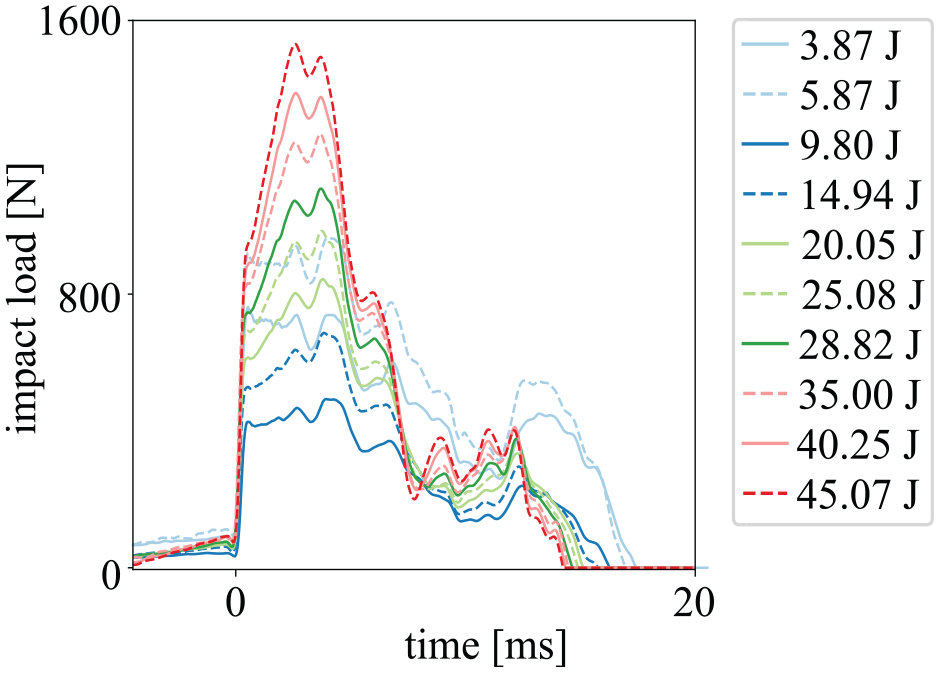
Force history at I12.
Summary of drop-weight intermediate-mass impact tests.
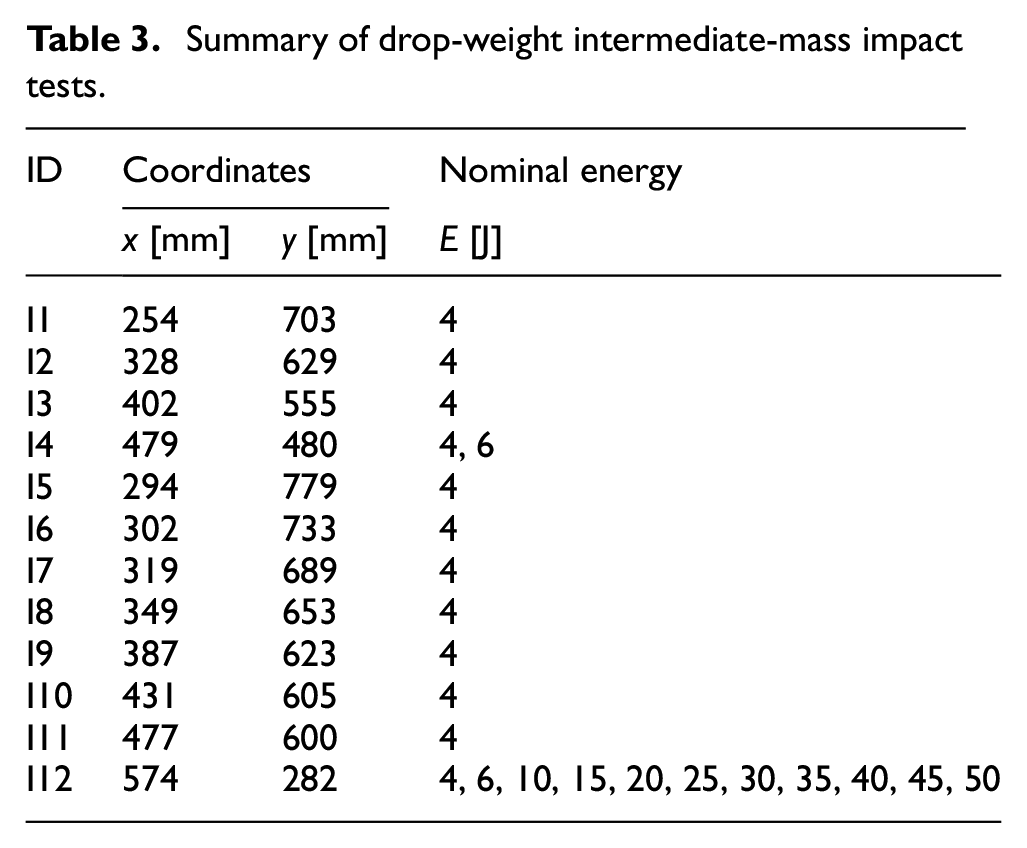
The experimental design, shown in Figure 2(c), presents both sensor and impact locations. The impact locations were systematically selected to take into account the factors that could influence the impact response. To measure the impact response, a single optical fibre equipped with eight FBG sensors and six piezoelectrics (P- 876 DuraAct Patch Transducer) were mounted on the test structure. The detailed configuration of the sensor network, including the specified coordinates, can be found in Table 4. Due to equipment constraints, the number of PZTs was limited to six, corresponding to the channel capacity of the oscilloscope. In contrast, the multiplexing capability of the FBG interrogation system allowed for eight sensors along the same fibre, explaining the differing quantities of PZTs and FBGs in the setup. The sensor readings were acquired using the USB Oscilloscope Handyscope HS6DIFF + HS5 data acquisition system for PZTs and the PhotonFirst interrogation system for FBGs. During impacts, the discrete impact response was recorded at a 100 kHz sampling frequency for PZTs and at approximately 19,230 Hz for FBGs. An example of a time signal during the impact test is shown in Figure 4.
Sensor network configuration.
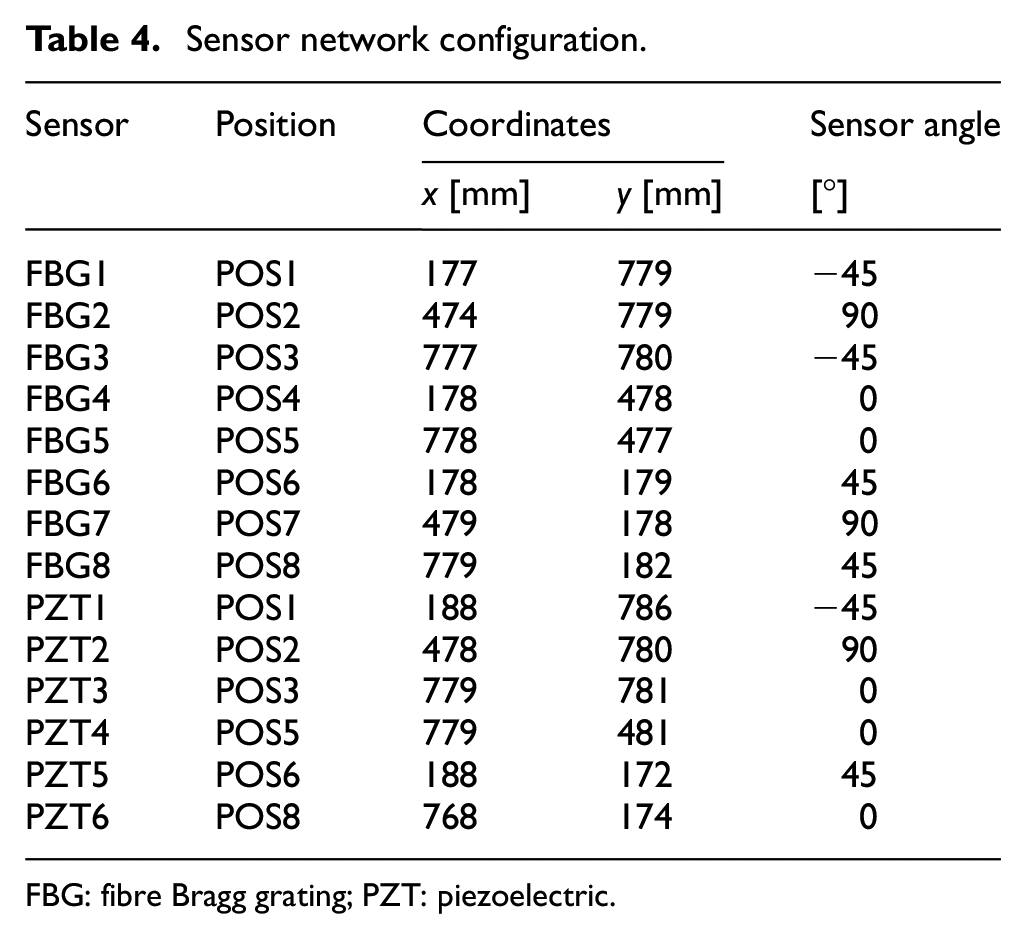
FBG: fibre Bragg grating; PZT: piezoelectric.
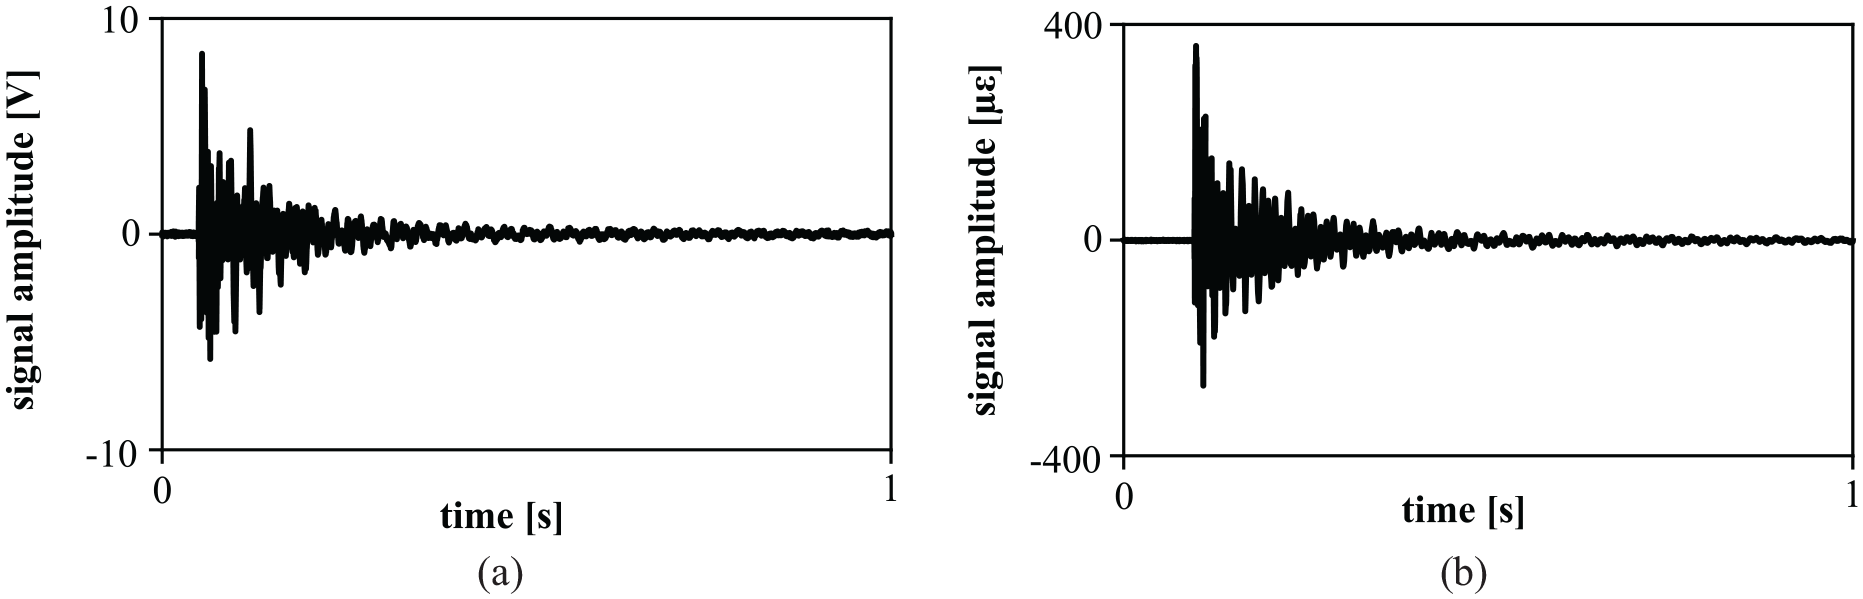
Raw signal response recorded by sensors at POS2 due to an impact event of 6.0 J at impact location I4: (a) impact response recorded by PZT2 and (b) impact response recorded by FBG2.
Phased array scan
Before and after the impact tests campaign, non-destructive inspections (NDI) were performed at all impact locations to characterise both the pristine and damaged states of the composite panel. Phased array scan tests were performed using an Olympus Omniscan-M-PA16-128 device equipped with a phased array transducer with 128 elements sampled at 100 MHz, 256 focal laws, 80 V pulse voltage per element and automatic probe recognition. A water-based couplant was used during the inspections to improve the transmission of sound energy from the transducer to the test piece.
Systematic comparison method
This section presents the structured approach for evaluating sensor performance for impact monitoring systems by analysing signal features and metrological parameters using comparison metrics.
Relative energy measures
Comparison metrics for different sensor technologies were obtained by analysing features extracted from the signals, which incorporated both time- and frequency- domain characteristics. This analysis focused on two key signal features: transmitted energy and spectral energy. These features were chosen due to their known sensitivity to variations in energy levels. As a result, they offer valuable applications for impact identification in composite structures.
The transmitted energy (Et) 35 is assumed to be the area under the square value of the time-domain curve, y(t). Essentially, it is a representative measure of the kinetic energy transferred to the sample due to the impact load captured by the sensor readings. Mathematically, it is expressed as follows:
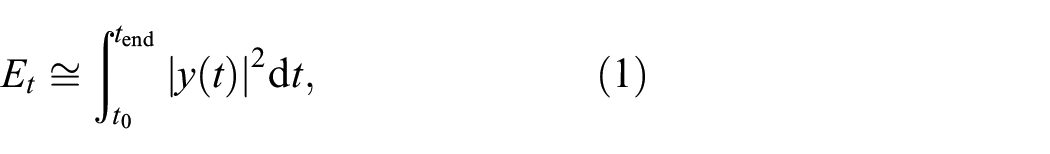
where the t0 and tend are the integration time limits. Here, t0 represents the time corresponding to the first data point at which the signal exceeds a predefined threshold, while tend corresponds to the moment at which the signal falls below a predefined threshold.
In addition, a detailed investigation of the low-frequency range of the power spectral density (PSD) was carried out using Welch’s method. 36 According to Plancherel’s theorem, integrating the squared value of the PSD curve, denoted as A(ω), over the frequency range provides a measure of the power of signals that can be related to the impact energy,16,37,38 as expressed in
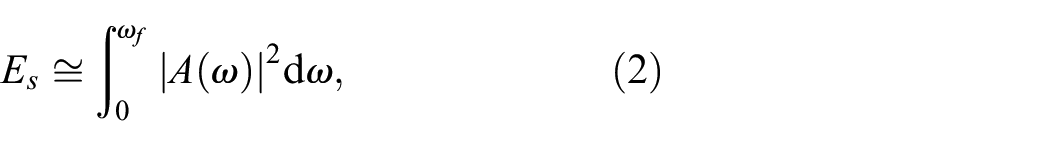
where ωf is the maximum value in the frequency spectrum of the signal that is limited by the Nyquist frequency of the windowed discrete Fourier transform. 39 As also noted by Hirano et al., 40 spectral energy distributions (Es) can be influenced by variations in absorbed energy and impact damage, particularly at frequencies associated with dynamic impact responses.
Both signal features, namely the transmitted energy and the spectral energy, ideally reflect the behaviour observed in the absorbed energy profiling diagram.41,42 The latter diagram is derived from the measured values of the droptower and illustrates the absorbed energy path of an impact event with variations in the energy levels.
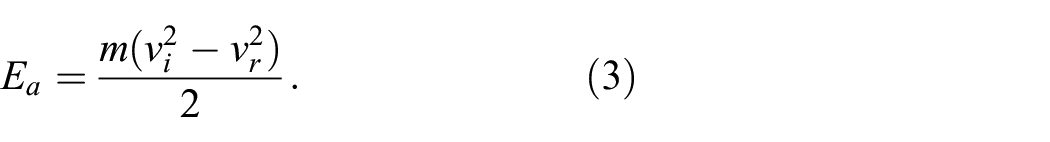
In order to construct these diagrams, both the impact velocity (vi) and the rebound velocity (vr) are measured with the instrumented impact device. The total energy absorbed by the panel under the impact load (Ea) can, therefore, be derived from the difference between the measured impact energy and the rebound energy according to 43
These parameters, specifically the transmitted energy, the spectral energy, and the absorbed energy, represent relative energy measures. Based on this understanding, the following sections describe methods for evaluating and comparing these energy metrics, providing useful guidance for comparing sensor technologies.
Metrological parameters
Further to analysing signal features and droptower readings, the comparison between the sensors also includes their metrological parameters. In particular, the resolution and repeatability are investigated, as they contribute to characterising the noise level, robustness and reliability of the measuring instrument.
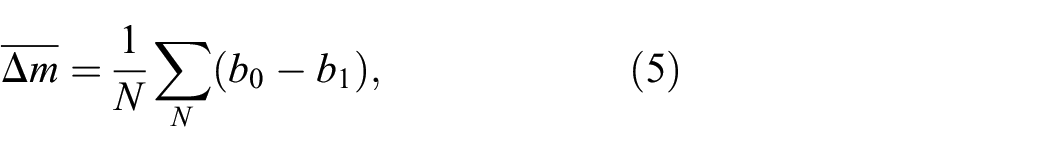
In this study, resolution refers to the variation of the monitored signal that exceeds one standard deviation of the noise level. 44 It is assumed that the noise b is stationary and, therefore, statistically independent over successive measurements under the same test condition. As a result, the resolution r is defined by
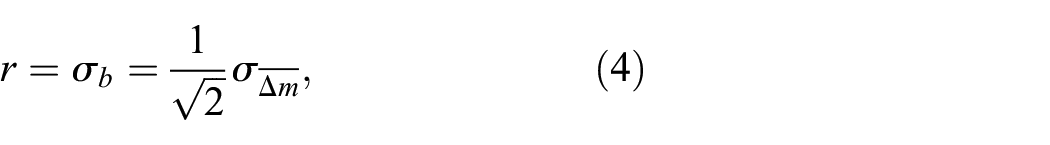
where
Finally, repeatability relates to the precision of measurements under the same conditions. It reflects the accuracy and noise level of acquired signals.44,45 Accordingly, repeatability involves the quantification of similarity in repeated experiments performed under identical setups.
For inverse impact identification problems, it is crucial to ensure that changes in sensor readings are easily distinguishable from the intrinsic characteristics of the device, such as resolution and repeatability. Overall, ensuring high repeatability and low resolution supports consistent and reliable results over the measurements. 46
Signal processing framework
A stepwise signal processing and data reduction scheme are implemented to improve feature extraction for the subsequent comparison metrics, as shown in Figure 5. Given the inherent presence of noise under real experimental conditions and the attenuation effects due to the peculiarities of the material system, preprocessing before feature extraction was a crucial step. Therefore, a discrete wavelet transform (DWT) denoiser 47 was applied to mitigate the influence of noise.
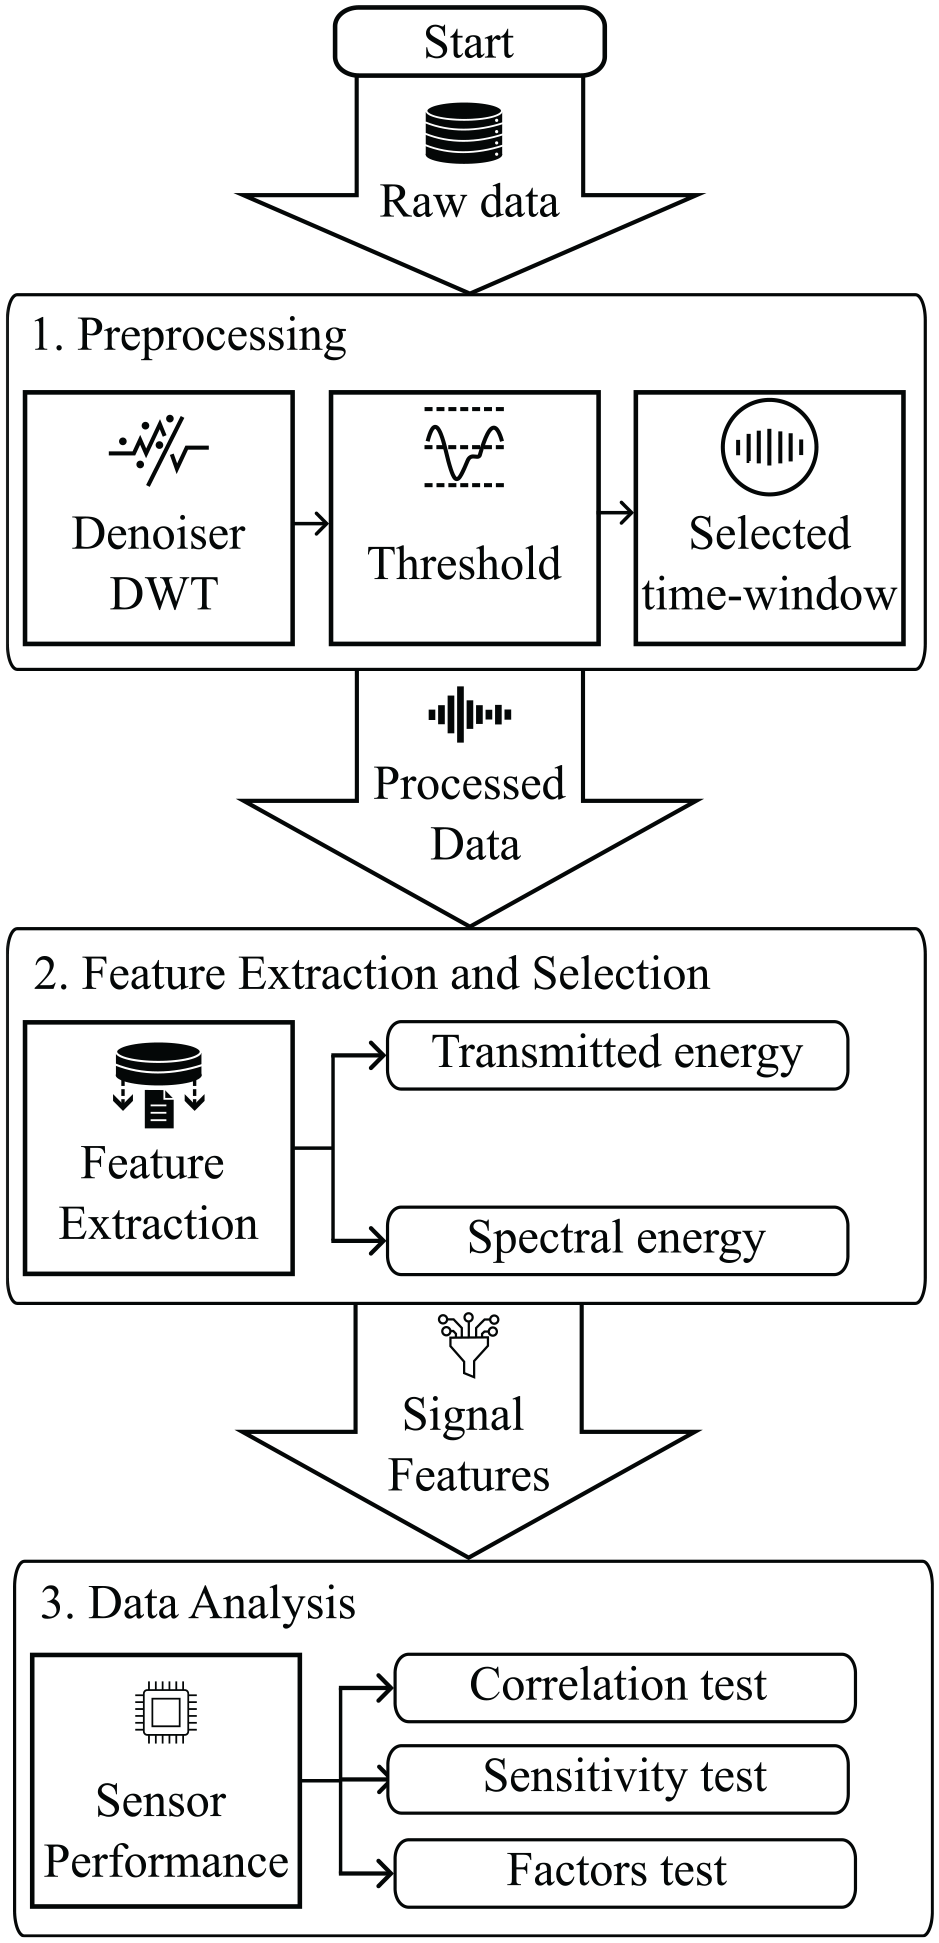
Signal processing and data reduction framework for comparative analysis of sensors performance.
The DWT supports various mother wavelets, including Harr, Daubechies, Biorthogonal, Symlet, Meyer and Coiflets. For this study, Daubechies wavelets of order 4 (db4) 48 were selected due to their orthogonality and effectiveness for non-stationary signals.49–52 It is noteworthy that this orthogonality property contributes to computational efficiency and numerical stability in signal processing applications. Also, this approach is in line with the work of Khodaei et al. 15 The effectiveness of the selected Daubechies wavelets in reducing the noise and improving the overall signal quality is evident in Figure 6, which highlights the contrast between the noisy and the denoised signal.
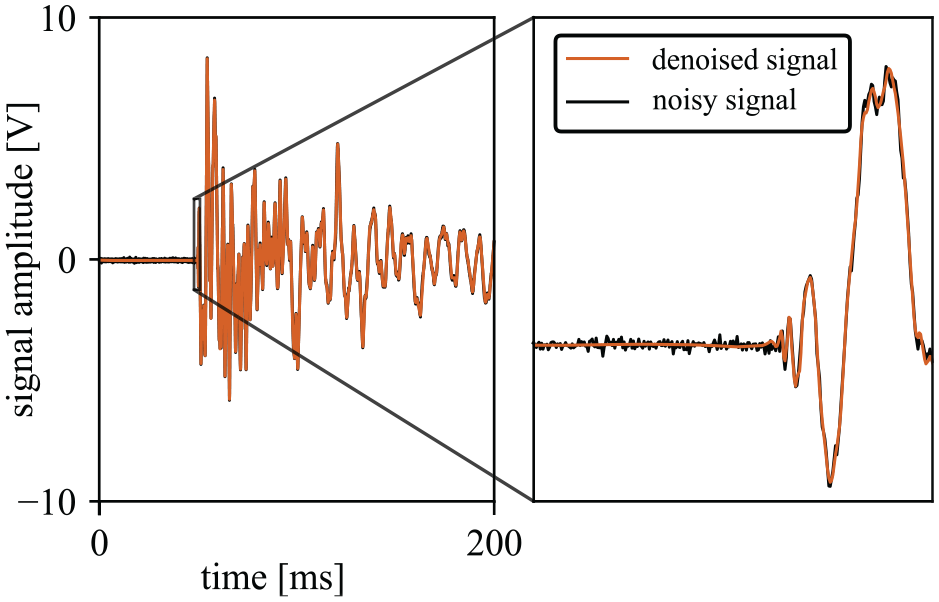
Comparison between the noisy and the denoised signal response recorded by PZT2 due to an impact event of 6.0 J at impact location I4.
Following the denoising step, a threshold is set by identifying the first peak that is above the noise level of the denoised signal (see Figure 7). In this study, a threshold value is chosen that is significantly higher than the nominal resolution of the sensor and higher than twice the noise level. Trial runs with random measurement samples have shown that the selected prominence argument provides a reasonable approximation of the first peak with respect to the surrounding points within the noise floor. This identified peak determines a time window that ensures a meaningful time signal for the subsequent analysis and helps to filter out the remaining noise components.
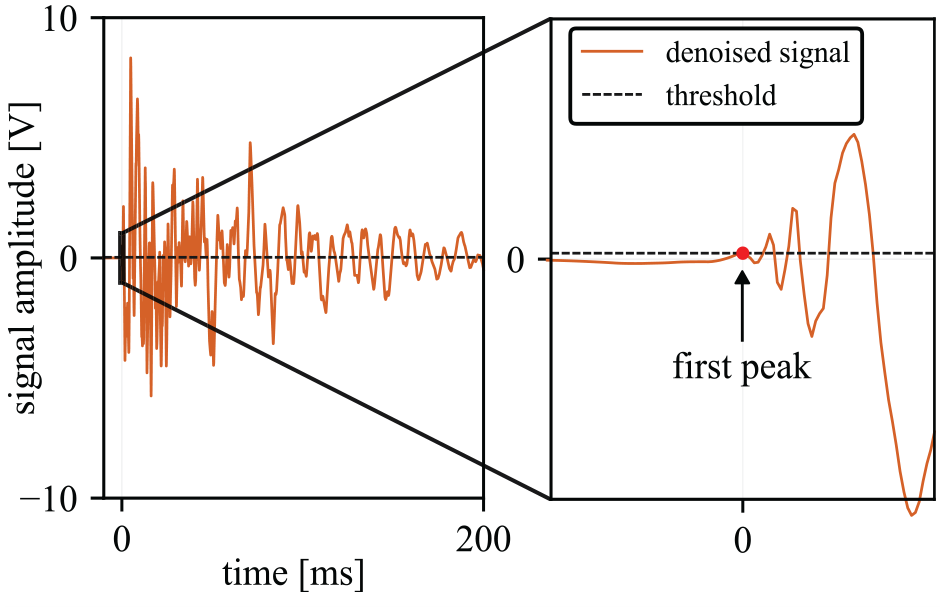
Threshold definition in the signal response recorded by PZT2 due to an impact event of 6.0 J at impact location I4.
The analysis proceeds with the extraction and selection of signal features, incorporating both time- and frequency-domain characteristics. In particular, the relative energy measures (see section Relative energy measures) are evaluated through comprehensive testing.
Comparison metrics
The impact responses from FBGs and PZTs have different physical units and scaling conventions. Optical signals result from variations in the optical path and are expressed in length units. In contrast, electrical signals resulting from the piezoelectric effect are expressed in voltage. In order to compare sensor parameters unbiasedly, each quantitative assessment value is rescaled to the range 0 and 1 using min- max normalisation. The general formula for scaling features is 53

where
A similarity score is then calculated using normalised values to quantitatively assess the correspondence between FBG signal features and reference features, such as outcomes derived from piezoelectric transducers, total absorbed energy or a reference time signal.
Overall, the similarity scores depend on the application. 54 The Euclidean distance, D(S, Q), was chosen due to its frequent use in similarity queries.55–58 and its common use as a distance metric for individual features.59,60 The more similar the values are, the shorter the absolute spatial distance between them. Based on Faloutsos et al., 56 the Euclidean distance (D) denotes the distance between two (equal length) sequences, S and Q, as given in
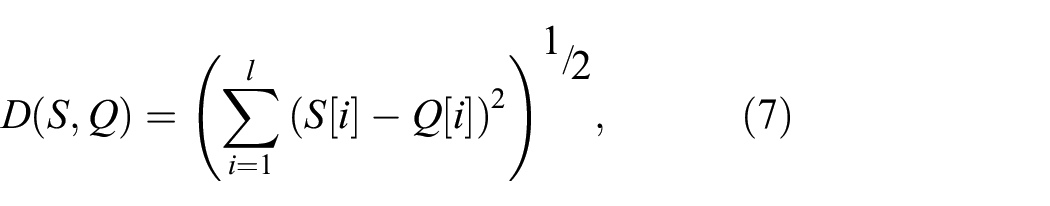
where l is the total length of the sequences. The signal features were then compared using a similarity index (SI). For this purpose, the Euclidean distance scores between the signal features were converted using the inverse relationship
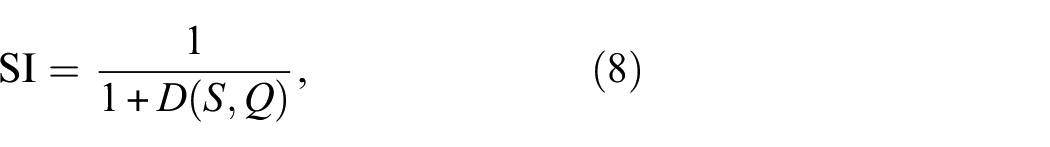
where SI

where x t 0 is the original time amplitude value, x t is the normalised value and X t is the array with all-time data values. The normalisation approach mentioned above preserves crucial information that allows an analysis of the effects of tension (+1) and compression (−1) on impact-induced deformation strains. This justifies the use of a different normalisation strategy than that of Equation (6). Finally, the correlation coefficients between two discrete-time sequences and associated spectral energy distributions were calculated using the correlation function available in the sub-package signal of SciPy, 61 which uses the cross-correlation method. The correlation coefficients range from 0 to 1, where 1 indicates identical discrete-time sequences.
Performance evaluation
The proposed framework includes a correlation test, a sensitivity test and a factor test to comprehensively evaluate the capabilities of the sensors.
For the correlation test, the processed data are used to quantitatively evaluate the impact responses of sensors in both the time and frequency domains, as shown in Figure 8. Before calculating the correlation coefficients, the processed time signal data must be resampled and synchronised to match the lower sampling frequency between the two sensor technologies. The correlation coefficients are then calculated for the normalised impact response (Equation (9)) and for the related PSD in the low-frequency range.
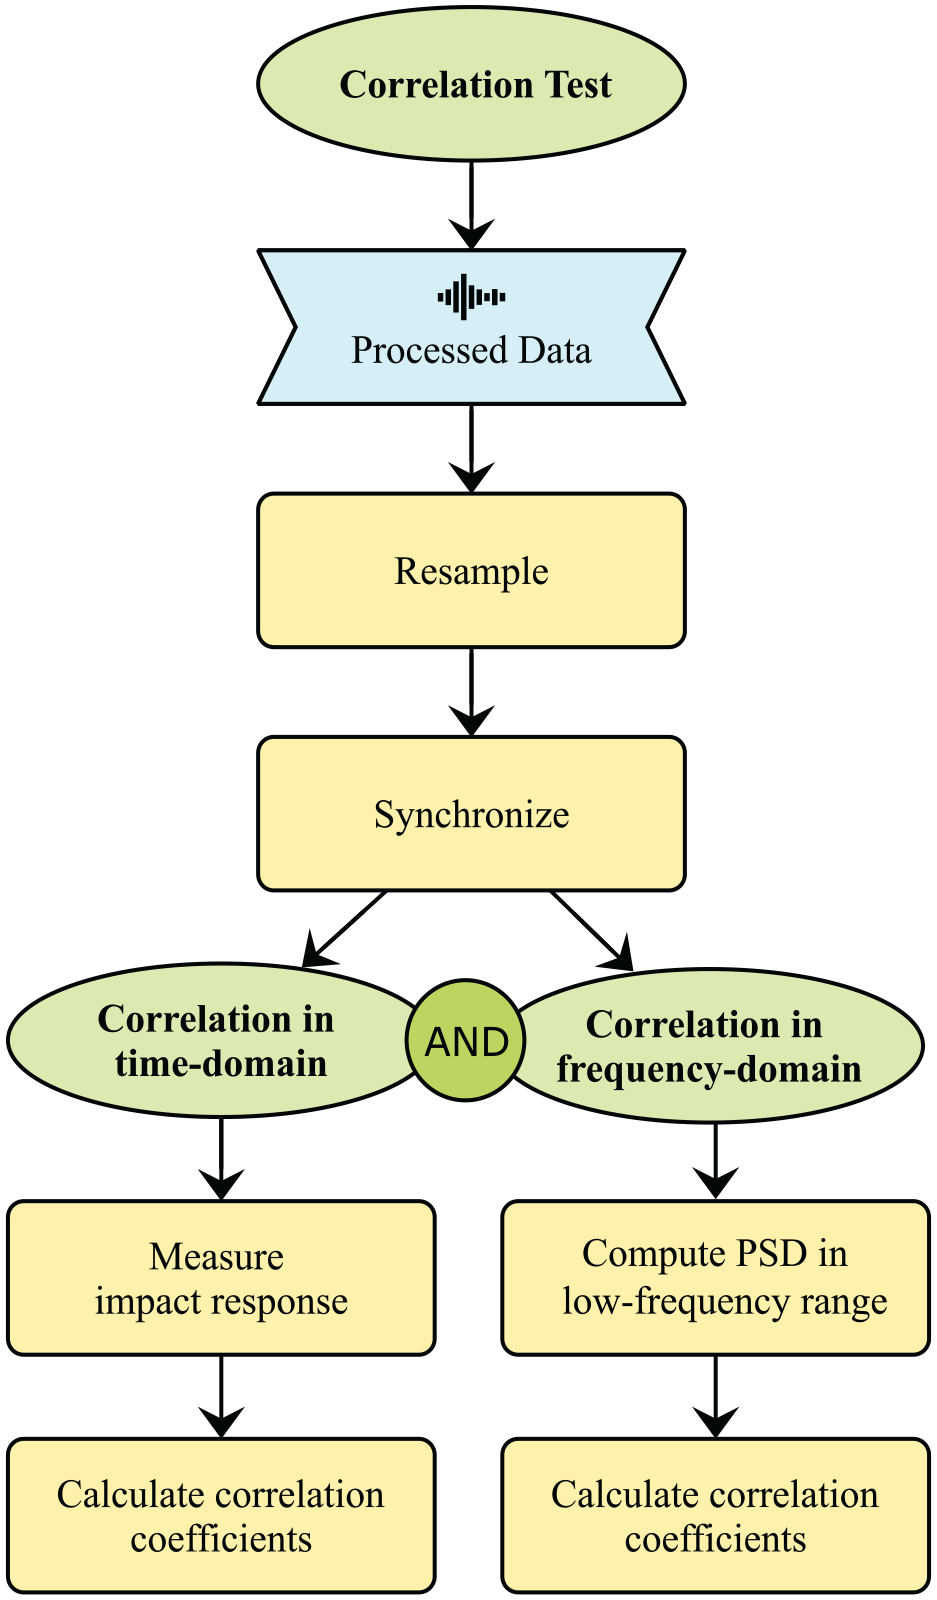
Correlation test framework.
The sensitivity tests, illustrated in Figure 9, address two critical aspects: sensitivity to noise and sensitivity of impact energy. The evaluation of sensitivity to noise involves examining the metrological parameters of signal responses. The resolution (Equation (4)) is determined by assessing the normalised measured noise (Equation (9)) from repeated test runs using raw data. In contrast, repeatability assessment employs processed data to measure the normalised impact response (Equation (9)) for repeated test runs and to calculate the Euclidean distance (Equation (7)) under the same test conditions.
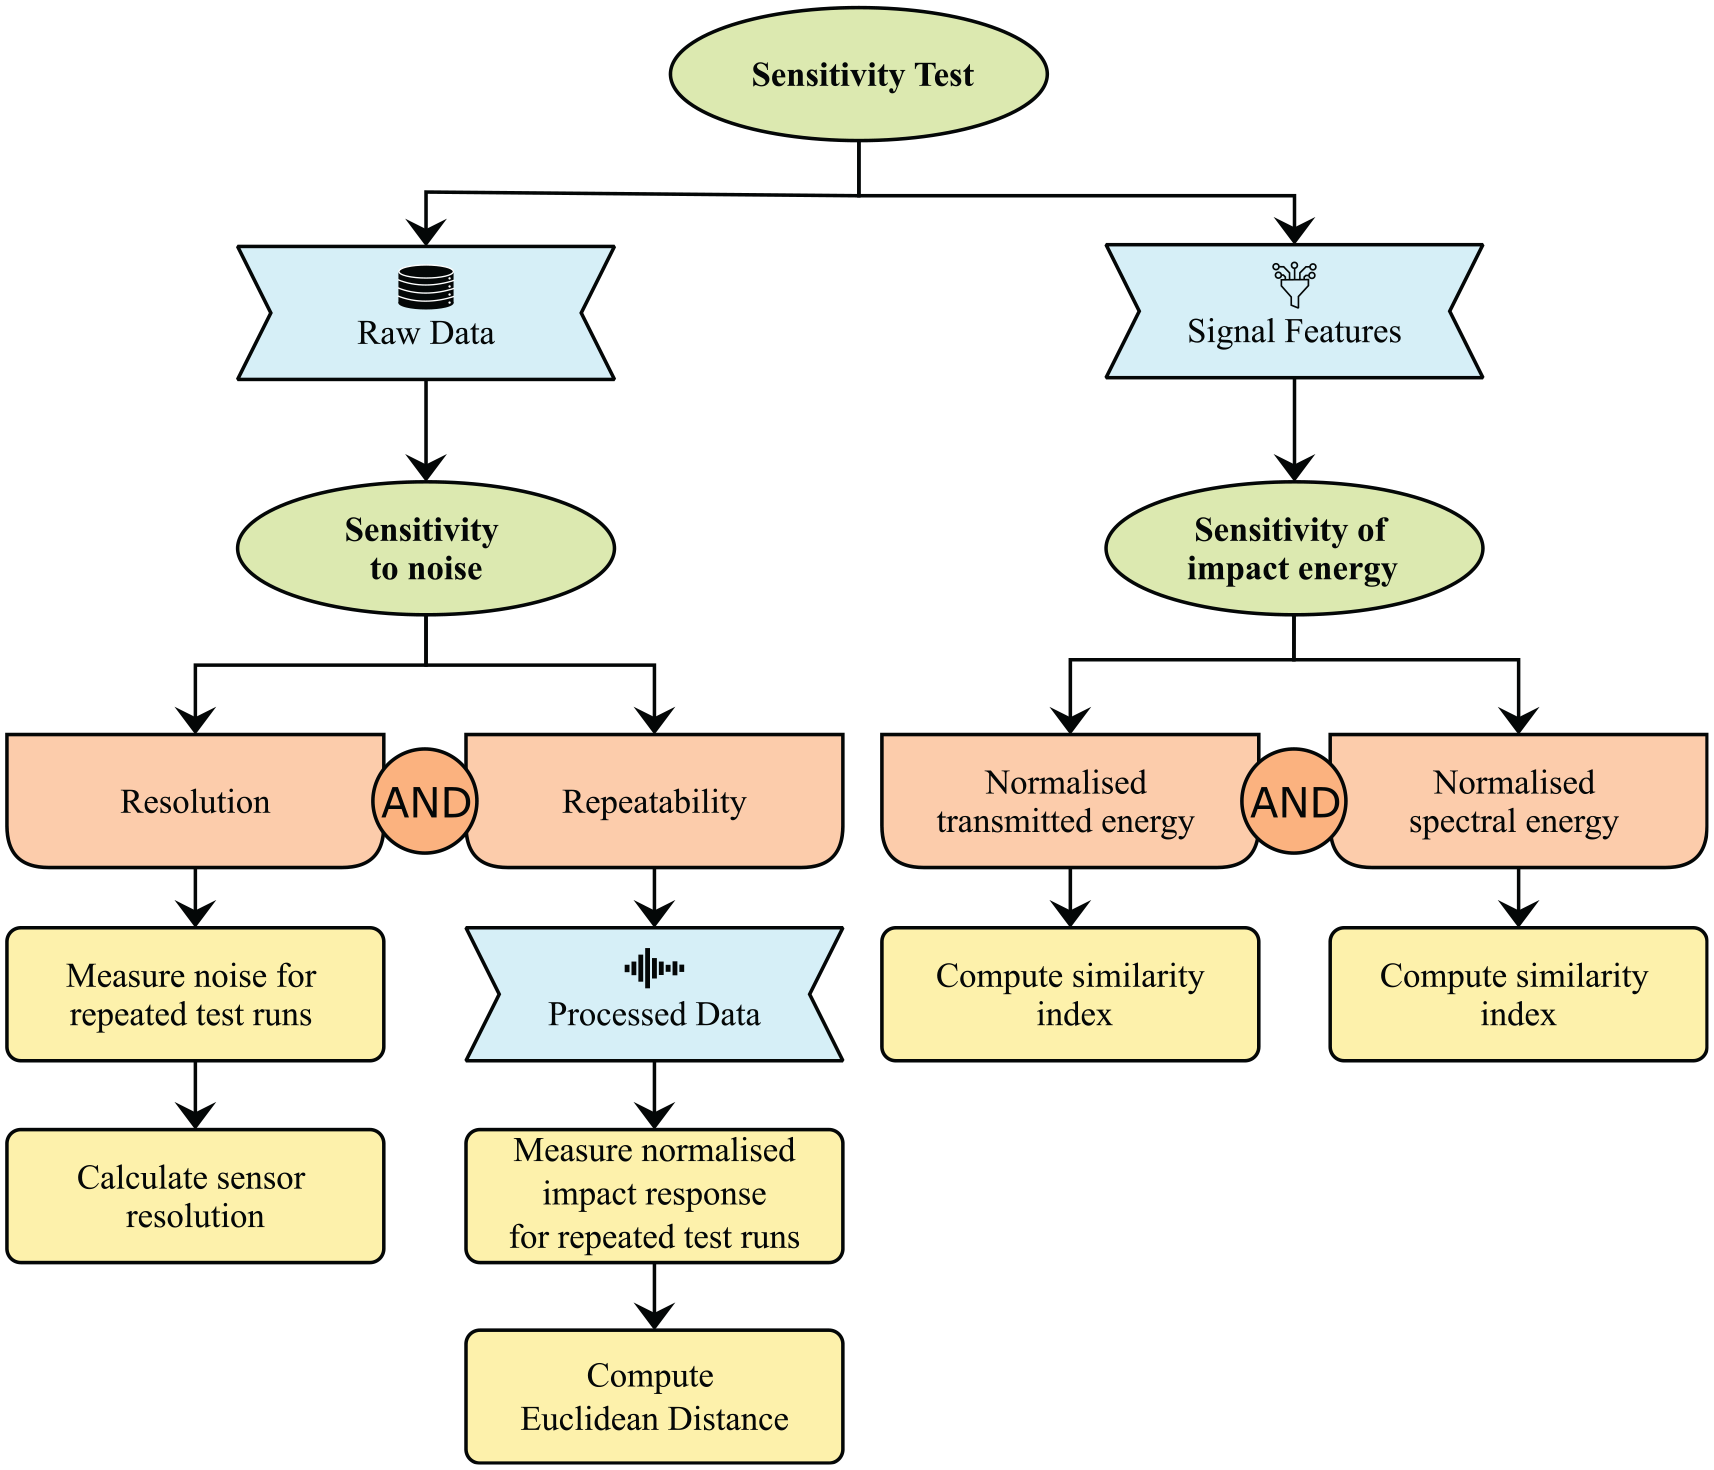
Sensitivity test framework.
Furthermore, the sensitivity of impact energy is evaluated by analyzing the performance of the sensors at various impact energies. In this context, similarity indices (Equation (8)) are computed for the normalised transmitted energy (Equations (1) and (6)) and the normalised spectral energy (Equations (2) and (6)). As explained in relative energy measures, these parameters are sensitive to variations in impact energy and are therefore suitable for such analysis.
Finally, the performance assessment of the sensors entails evaluating the directional and attenuation effects using the factors test, as shown in Figure 10. This test evaluates the aspects of the signal measurements over different distances to the source and varying angles of incidence using the normalised transmitted energy (Equations (1) and (6)) as input.
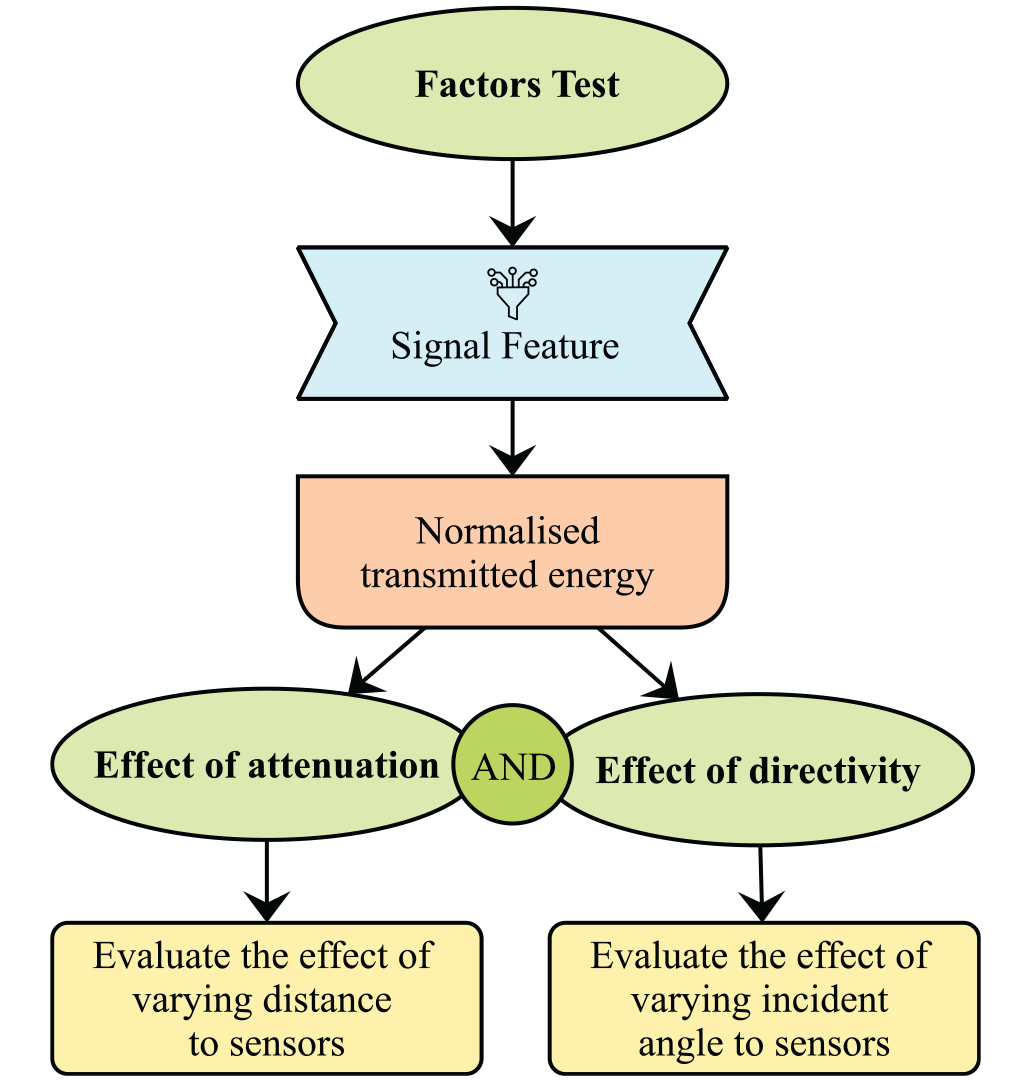
Factors test framework.
Overall, this systematic approach, embedded in comprehensive testing frameworks, considers both qualitative and quantitative aspects. As a result, it offers a comprehensive assessment of the capabilities and limitations of the target sensor.
Results and discussion
The performance evaluation of the sensor system is discussed as described in the previous section. The following results outline the key outcomes of the experimental investigation using the designed frameworks.
Correlation test
In correlation tests, the signal responses of FBG and PZT sensors were quantitatively evaluated in both the time and frequency domains. Specifically, the analysis used signals recorded by sensors located at POS6 due to 4.0 J impact at the I4 location, as well as signals recorded by sensors placed at the POS2 for varying impact energies at the I12 location. The choice of I4 was based on its central position and alignment with the sensor angle orientation, while I12 was selected for analysis as multiple energy levels were available at this location. Also, it is important to note that the sensors are located on opposite sides of the panel, which can lead to opposing behaviour in terms of tension and compression during impact. For this reason, FBG time signals are presented with an inverted y-axis to improve the clarity of the correlation analysis.
Time domain measurements showed a typical decay waveform for both sensor technologies, consistent with expectations for an intermediate-mass impact source. Furthermore, a comparison of the force-time curve and impact responses revealed a strong correlation between PZT and FBG signals during contact prior to collision during unloading (see region a in Figure 11).
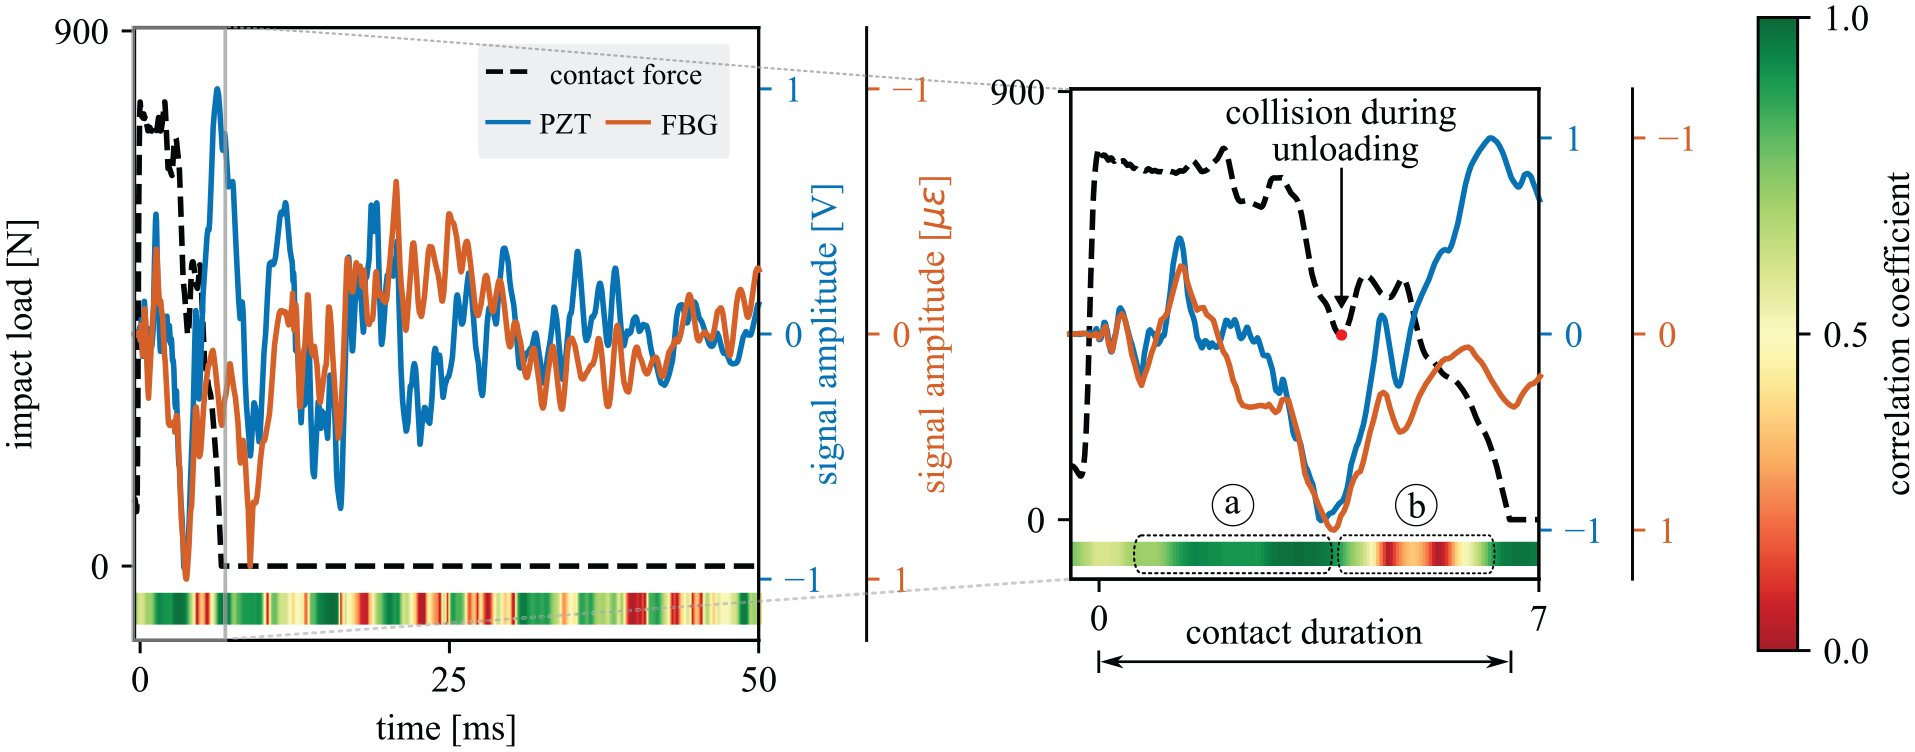
Impact response and impact load recorded by the drop tower force transducer and the sensors at POS6 due to an impact event of 4.0 J at impact location I4.
Despite these significant similarities, there were evident differences that developed after the collision during the upward phase (see region b in Figure 11). In addition, significant deviations can be seen once the impactor is no longer in contact with the target structure, possibly indicating dynamic waves reflected from the boundaries in the sensor readings. These different patterns can be caused by multiple reflections at the boundaries, non-uniform wave propagation and the directional nature of wave propagation in composite materials.62–64
Further analysis of the time series data revealed that different impact energies produced comparable waveforms, as shown in Figure 12. However, following the contact duration, the FBG impact response (Figure 12(b)) showed more irregular patterns compared to the PZT response (Figure 12(a)). This irregularity can be attributed to the directional measurement of the optical sensors in combination with the unpredictable angle of incidence of the reflection waves. In contrast to FBG sensors, PZT sensors are designed to have isotropic sensitivity, that is, they respond more uniformly to forces applied from different directions. Their isotropic nature ensures consistent performance across varying wave propagation angles.
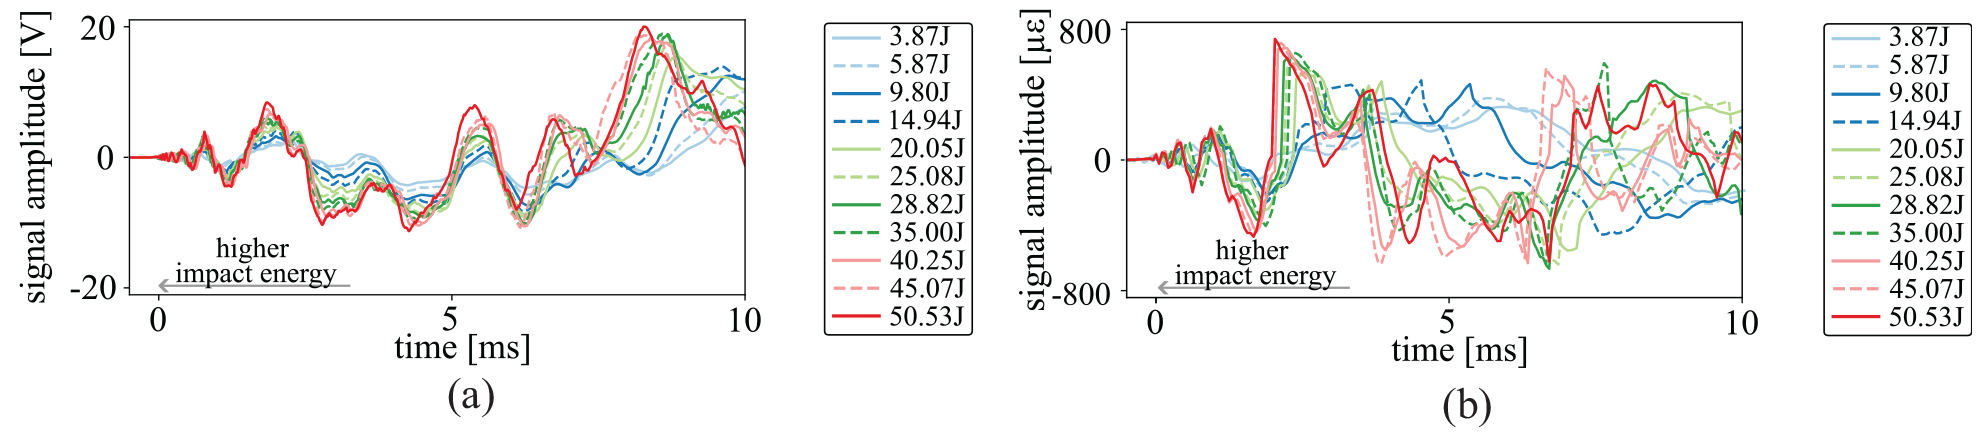
Impact response recorded by sensors at POS2 due to an impact event of various energies at impact location I12:(a) impact response recorded by PZT2 and (b) impact response recorded by FBG2.
In addition, an observable shift of the waveform to the left with increasing impact energy was noted for both FBGs and PZTs. This shift in the time domain may induce alterations in the slope of the phase and can be interpreted as a phase lead, indicating that one waveform is advanced relative to another.65–67 It is worth noting that these findings have implications for interpreting the frequency composition of the impact response.
For the low-frequency analysis, the PSD of the signals was calculated in the frequency range from 0 to 300 Hz with a frequency bin size of approximately 1 Hz. Consequently, in this calculation, the first 10 natural frequencies previously defined in Table 2 were taken into account. One of the primary outcomes is that the PSD of the FBGs (Figure 13(b)) shows a high agreement with the PZTs (Figure 13(a)). In addition, the measured PSD revealed that the energy of the impact load is concentrated on the natural vibration modes or a combination of them, with the frequency peaks slightly deviating compared to the results of the numerical simulation (see section Dynamic properties). However, this contrast could be due to the simulated boundary conditions, which may differ from the actual experimental conditions and can be adjusted accordingly. These results are consistent with earlier studies, 33 which also demonstrated the predominance of the lowest vibration modes of the impactor-plate system for intermediate-mass impacts.
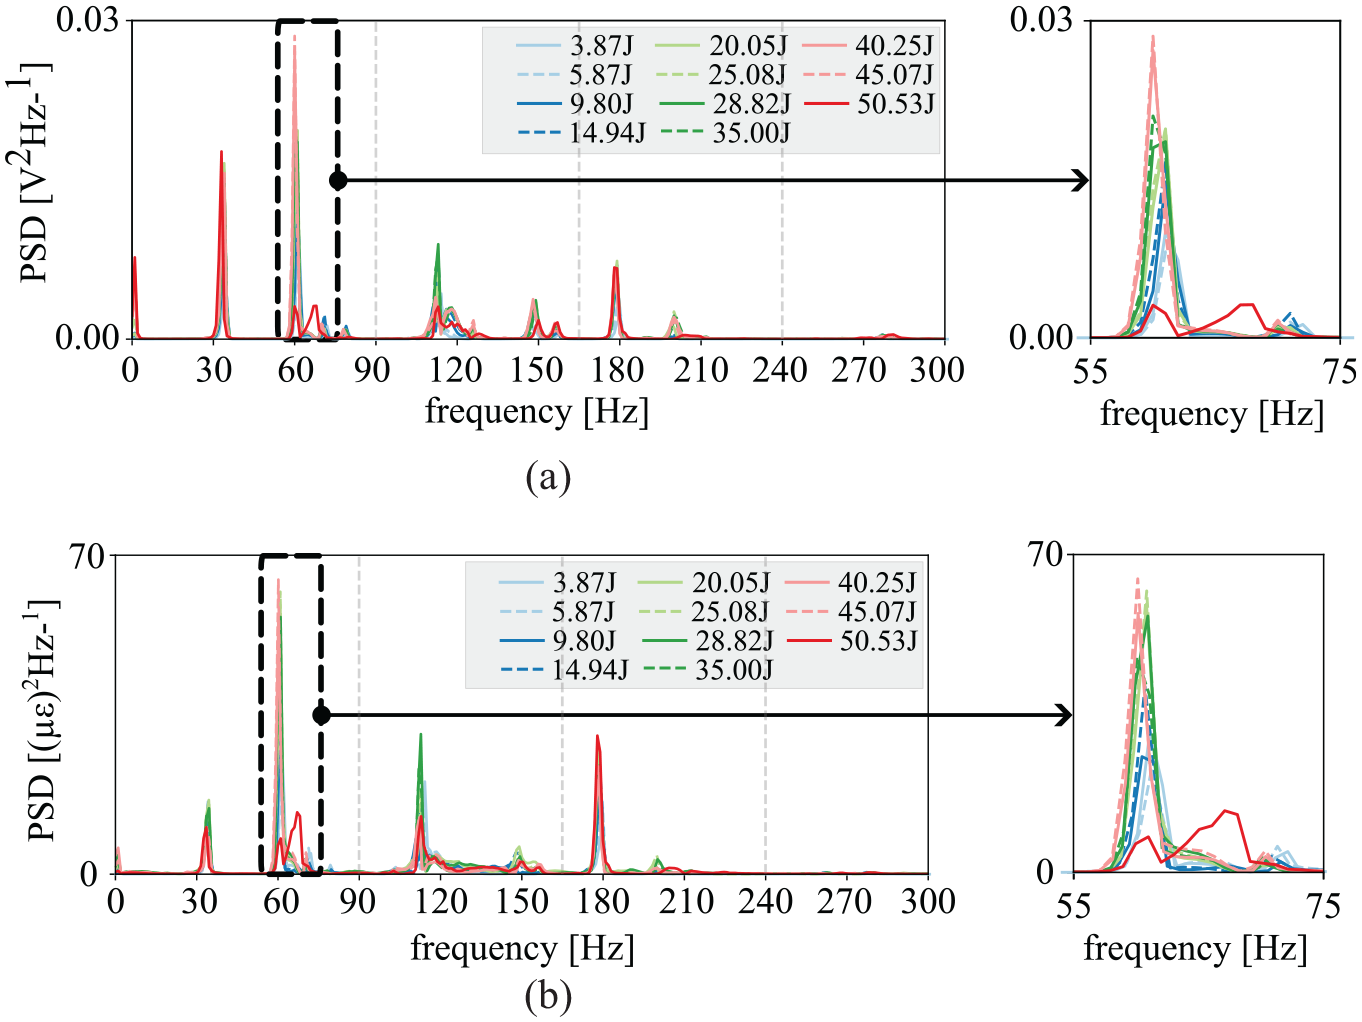
PSD at POS2 due to an impact event of various energies at impact location I12: (a) PSD PZT2 and (b) PSD FBG2.
These findings suggest that PSD analysis of FBGs and PZTs can provide valuable information on the dynamic behaviour of the structure for damage detection and impact classification purposes, as reported in previous research.16,71 In the PSD plots (Figure 13), the dominant frequency between 55 and 75 Hz is highlighted. The dominant frequency represents the primary mode of vibration, revealing sensitivity to structural changes. The results indicate nonlinear resonance and changes in damping around the dominant frequency with increasing impact energy. However, due to the limitations on frequency resolution imposed by the dimensions of the frequency bins, drawing explicit conclusions about the relationship between this observation and impact energy levels is challenging.
Previous studies68–70 indicate that non-linear responses to impact events may result from large deflections or structural damage. This research examines non-linearities primarily attributed to geometric effects stemming from large deformations under high-energy impacts. Non-linearities linked to damage initiation and progression could not be verified, as NDI were conducted only at the beginning and end of the experimental sequence rather than following each impact level. Nonetheless, although precise conclusions on the onset of damage remain limited, inspections following the experiments confirmed clear evidence of internal damage caused by a 50.53 J impact (Figure 14). Overall, the phased array scan results indicated the presence of dents (Figures 14(a) and (c)) and delamination (Figures 14(b) and (c)). The latter is known to significantly reduce the amplitude spectrum in bending modes, as the bending stiffness relies on the integrity and interaction of the laminate layers, 71 changing the mechanisms of load transfer between separated layers.

Phased array scan images after 50 J impact at location I12: (a) attenuation of the backwall (C-scan), (b) reflection view (C-scan), and (c) cross-sectional view (B-scan).
Moreover, the impact at I12 significantly affects the frequency and amplitude of the second mode more than the first mode, which is primarily due to the non-central location of the impact. Moreover, it is worth noting that the dominant frequency is associated with the second mode of vibration, which is a bending mode. Consequently, the presence of damage is also indicated by a significant reduction in the amplitude of the dominant frequency observed in both the FBGs and the PZT power spectra. This phenomenon, known from classical structural dynamics, occurs due to the reduced local stiffness of the structure resulting from the damage and thus leads to a change in the natural frequency amplitudes. 72
Finally, correlation coefficients were computed to quantify the similarity for different impact energies in the frequency domain. For these calculations, the PZT measurements and the lowest energy levels for both FBG and PZT were used as references. The analysis focused on the general behaviour of the low frequency (0–300 Hz) and the different frequency ranges (0–90, 90–165, 165–240 and 240–300 Hz). These intervals were systematically chosen to contain two resonant frequencies that potentially reflect modal participation factors and describe the contribution of each mode shape to the overall response. This approach made it possible to identify the frequency range that is most sensitive to variations in impact energy and to recognise the damage-induced changes.
Overall, the correlation coefficients between FBGs and PZTs decay with increasing energy, as illustrated in Figure 15(a). This decay can be attributed to the non-linear resonance. The peak shift notably affects correlation coefficients more than varying frequency amplitude or modal participation factors. To support this conclusion, simplified tests were conducted. The spectrum of an artificial sine signal was analysed, and then correlation coefficients were calculated by comparing the original signal with signals with peak shift and varying amplitude ratio. The results showed a 56% drop in correlation coefficient with a peak shift, while considering varying amplitude ratio only resulted in a 10% drop.
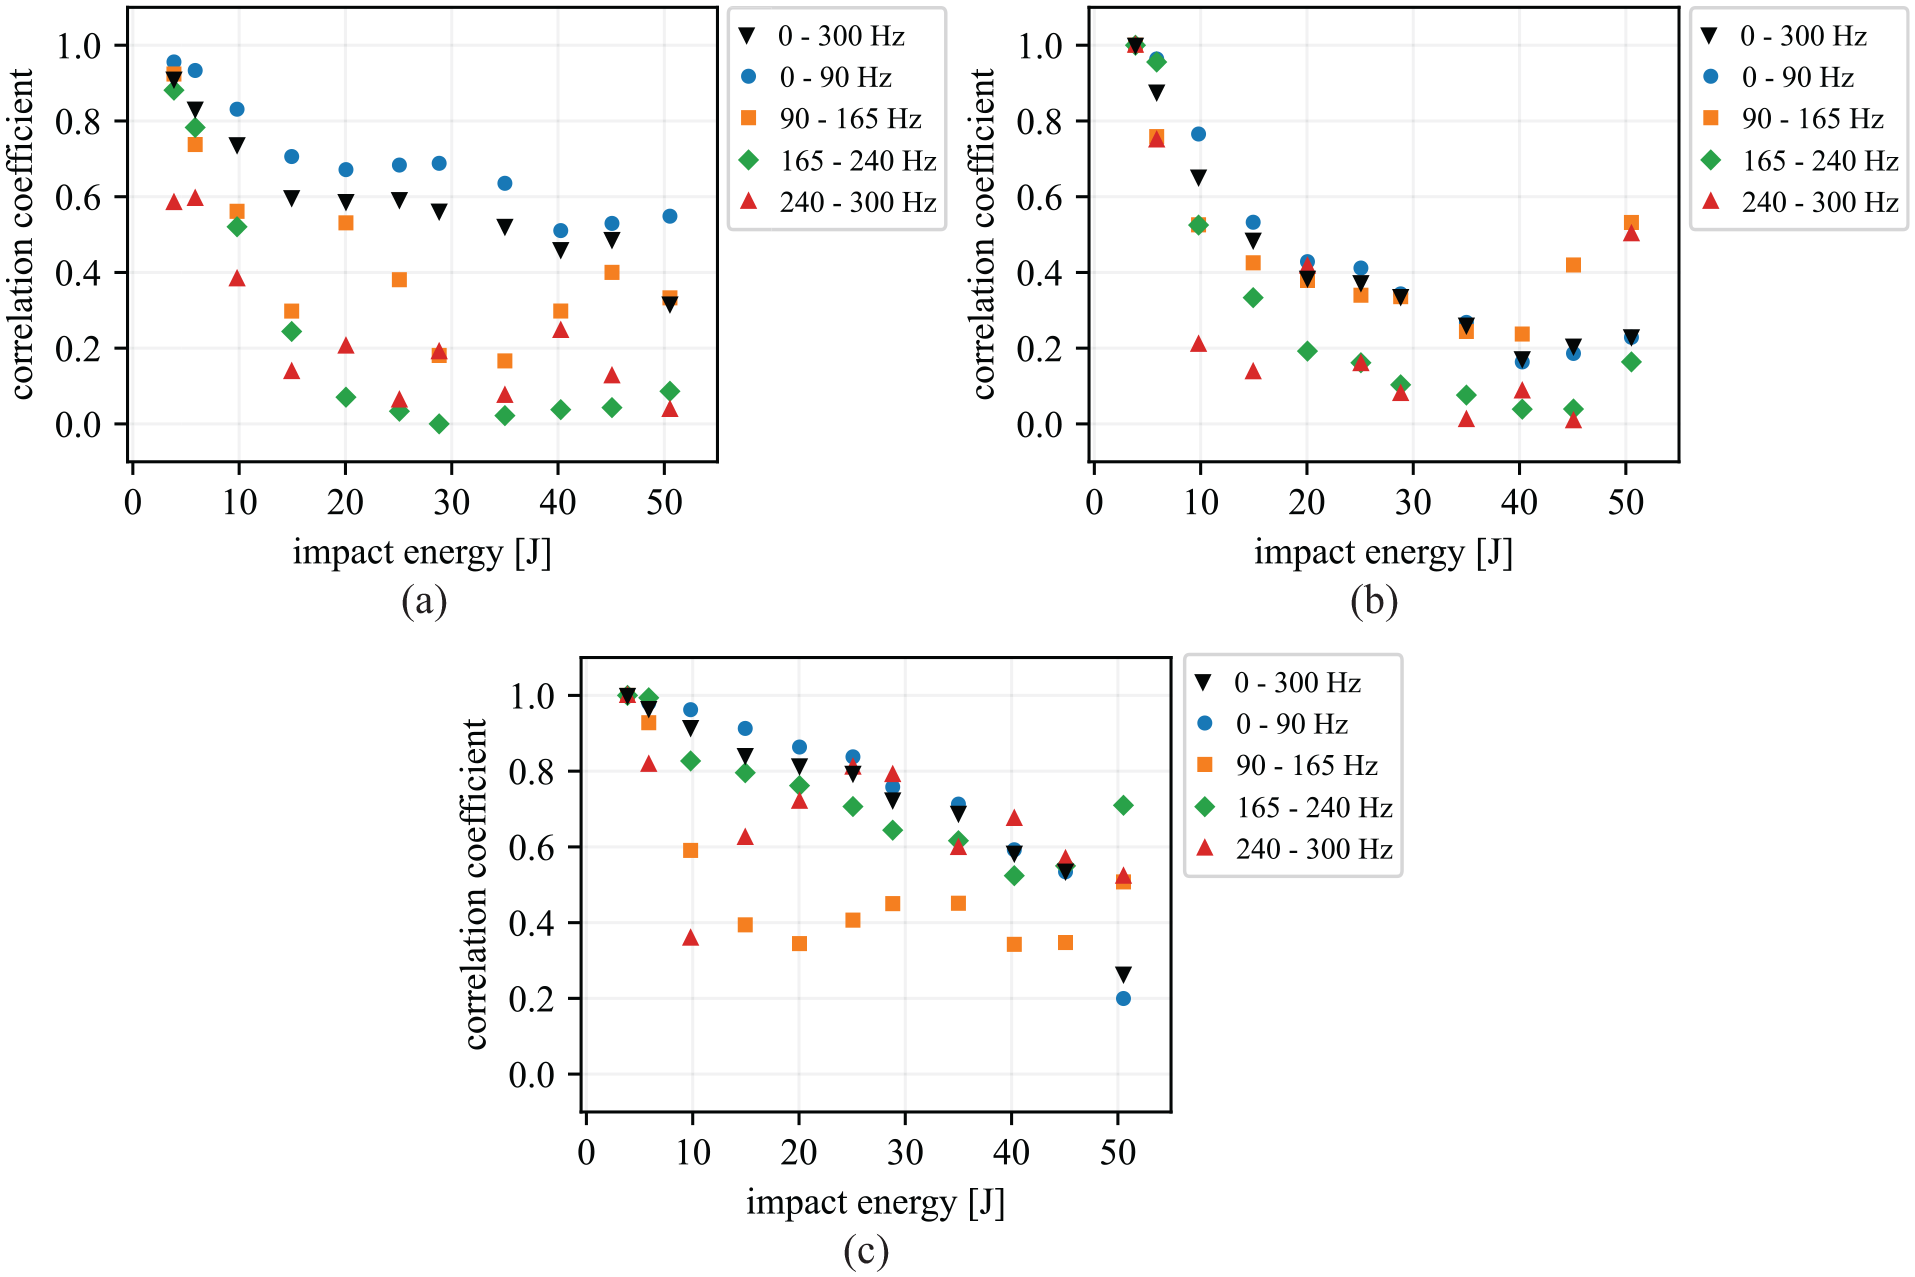
Correlation values of the PSD plots from sensors at POS2 due to an impact event of various energies at impact location I12: (a) correlation between FBG2 and PZT2 for varying impact energies, (b) correlation between varying impact energies for FBG2, and (c) correlation between varying impact energies for PZT2.
Furthermore, the behaviour in the lower-frequency range (0–90 Hz) is generally consistent with the overall pattern (0–300 Hz), except for the drop at 50 J related to damage. However, the intervals for the higher-frequency ranges (165–240 and 240–300 Hz) deviate from the general behaviour, indicating a steeply decreasing curve and a high sensitivity to variations in impact energy. Despite these clear trends, the intermediate frequency range of 90–165 Hz does not show a consistent pattern, making it difficult to establish a direct link between the specific spectrum and its response to impact energy.
When analysing the correlation of the FBG spectrum with increasing energy levels (Figure 15(b)), the behaviour of the diagram indicates an almost quadratic decay, as demonstrated by the rapid decrease in the coefficients. The frequency range 0–90 Hz shows an explicit agreement with the general behaviour (0–300 Hz). However, the intermediate range (90–165 Hz) shows a deviation at higher-energy levels. In addition, the deterioration of the correlation parameters is more pronounced in the higher-frequency ranges (165–240 and 240–300 Hz) than in the lower ones. The steep drop of the correlation coefficient values in this analysis is a clear indication that the non-linearity of the system increases with increasing impact energy.
In the PZT correlation evaluation, the correlation values also decrease with increasing energy level, as can be seen in Figure 15(c). The general characteristic of the curves is approximately linear, whereby this behaviour can be observed in all frequency intervals, except in the range of 90–165 Hz, which has no monotonic curve. It is particularly noticeable that the changes caused by the damage are more pronounced in the lowest-frequency range.
A more detailed analysis also shows that the overall curve (0–300 Hz) for PZT at energies higher than 40 J is more consistent with the existing literature than that of FBGs. In general, higher impact energies and the presence of damage can be expected to increase nonlinearities, leading to additional changes in natural frequencies. These changes may lead to lower correlation coefficient values that do not match the increasing values for impact energies greater than 40 J in the FBG correlation assessment (Figure 15(b)).
Sensitivity test
Sensitivity tests are performed to evaluate the main performance indicators of sensor systems for characterising impact events. These tests analyse the sensitivity of the sensors to normalised transmitted energy and spectral energy, which are important metrics for evaluating their response to different impact energies. In addition, the tests also evaluate noise sensitivity, focusing on resolution and repeatability measurements, which are critical for characterising the signal-to-noise ratio and robustness of the measurement device.
In this context, the energy profiling diagrams are used to investigate how signal features are correlated with changes in impact energy. In this diagrams, the transmitted energy (Figure 16(a)) and spectral energy (Figure 16(b)) of the FBG and PZT signals are compared with the absorbed energy, with all values normalised for an unbiased comparison. By analysing these plots, consistent patterns can be seen in the energy profiling curves of the absorbed energy and the signal features. For low-energy impacts (0–20 J), a linear behaviour is observed. However, as the impact energy increases (20–30 J), non-linearities become more apparent.
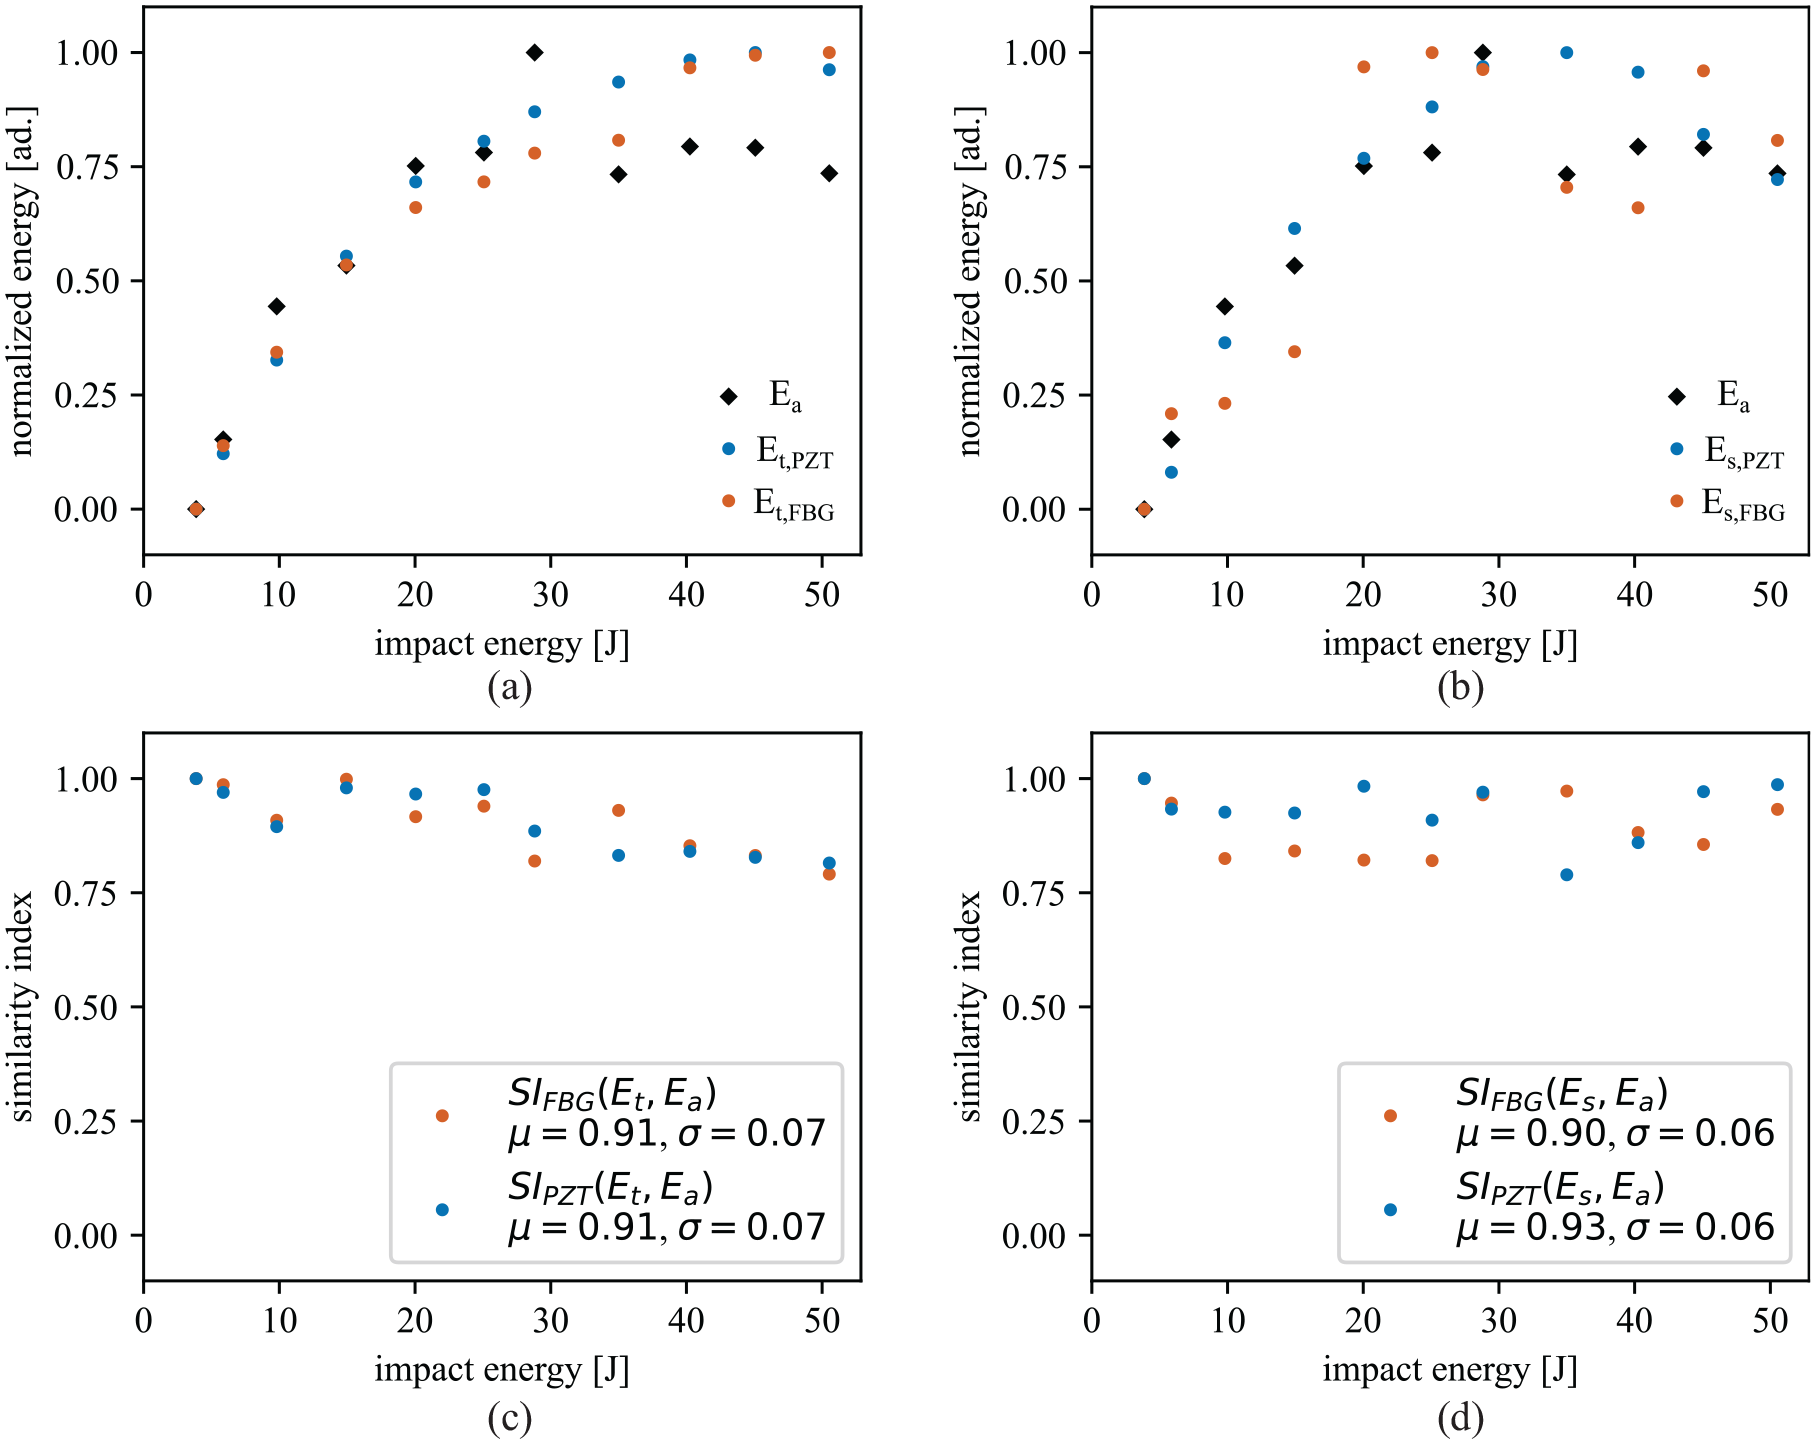
Energy profiling diagrams indicating sensitivity of impact energy and similarity between signal features and absorbed energy at impact location I12: (a) energy profiling diagram comparing transmitted energy from PZTs (Et,PZT) and FBGs (Et,FBG) with absorbed energy (Ea), (b) energy profiling diagram comparing spectral energy from PZTs (Es,PZT) and FBGs (Es, FBG) with absorbed energy (Ea), (c) similarity between absorbed energy and transmitted energy from FBGs (SIFBG (Et,Ea)) and PZTs (SIPZT (Et,Ea)), and (d) similarity between absorbed energy and spectral energy from FBGs (SIFBG(Es,Ea)) and PZTs (SIPZT (Es, Ea)).
Furthermore, a loss of transferred kinetic energy is observed at impact energies greater than 30 J, indicating possible damage. This energy loss can be partly attributed to the fact that the energy absorbed by the test structure is dissipated by the formation of damage. 73 At higher impact energies, the normalised spectral energy appears to be more sensitive to damage compared to the transmitted energy for both sensor types. This enhanced sensitivity is due to the ability of spectral energy to detect changes in specific frequency components that indicate damage, such as shifts or reductions in the amplitude of natural frequencies. In contrast, the broader, less detailed nature of the transmitted energy can cause these changes to be overlooked as it is limited to the total energy transmitted through the material.
The relative energy measures in the energy profiling diagram were used to quantify the similarity between the normalised signal features and the absorbed energy. It was found that the similarity between the signal features and the absorbed energy is high for both sensors. Figure 16(c) shows that the transmitted energy of FBGs and PZTs have very comparable similarity indices. In particular, the average µ and the standard deviation σ for the transmitted energy were identical for PZTs and FBGs. There was also no significant difference in these statistical measures for the normalised spectral energy, as can be seen in Figure 16(d). The average value for PZTs in the spectral analysis was only 3% higher, indicating a slightly better agreement with the absorbed energy behaviour, while the standard deviation was also identical compared to the FBGs results.
In addition, the signal features of FBGs were quantitatively compared with those of PZTs by using similarity indices as described in performance evaluation. The similarity matrix comparing the transmitted energy of the PZTs with that of the FBGs (Figure 17(a)) shows values closer to one and centred on the main diagonal, indicating a high degree of similarity between the sensor signals for the corresponding feature. On the other hand, the similarity matrix comparing the spectral energy of the PZTs with that of the FBGs (Figure 17(b)) shows indices closer to one scattered across the matrix, especially at energies above 20 J. This observation indicates discrepancies between the power spectra of the FBGs and the PZTs and no apparent correlation across the different energy levels. This conclusion is also confirmed by the correlation test (Figure 15(a)), which showed that the correlation coefficients decrease in the higher-frequency range (165–300 Hz) and approach zero, especially at impact energies higher than 20 J.
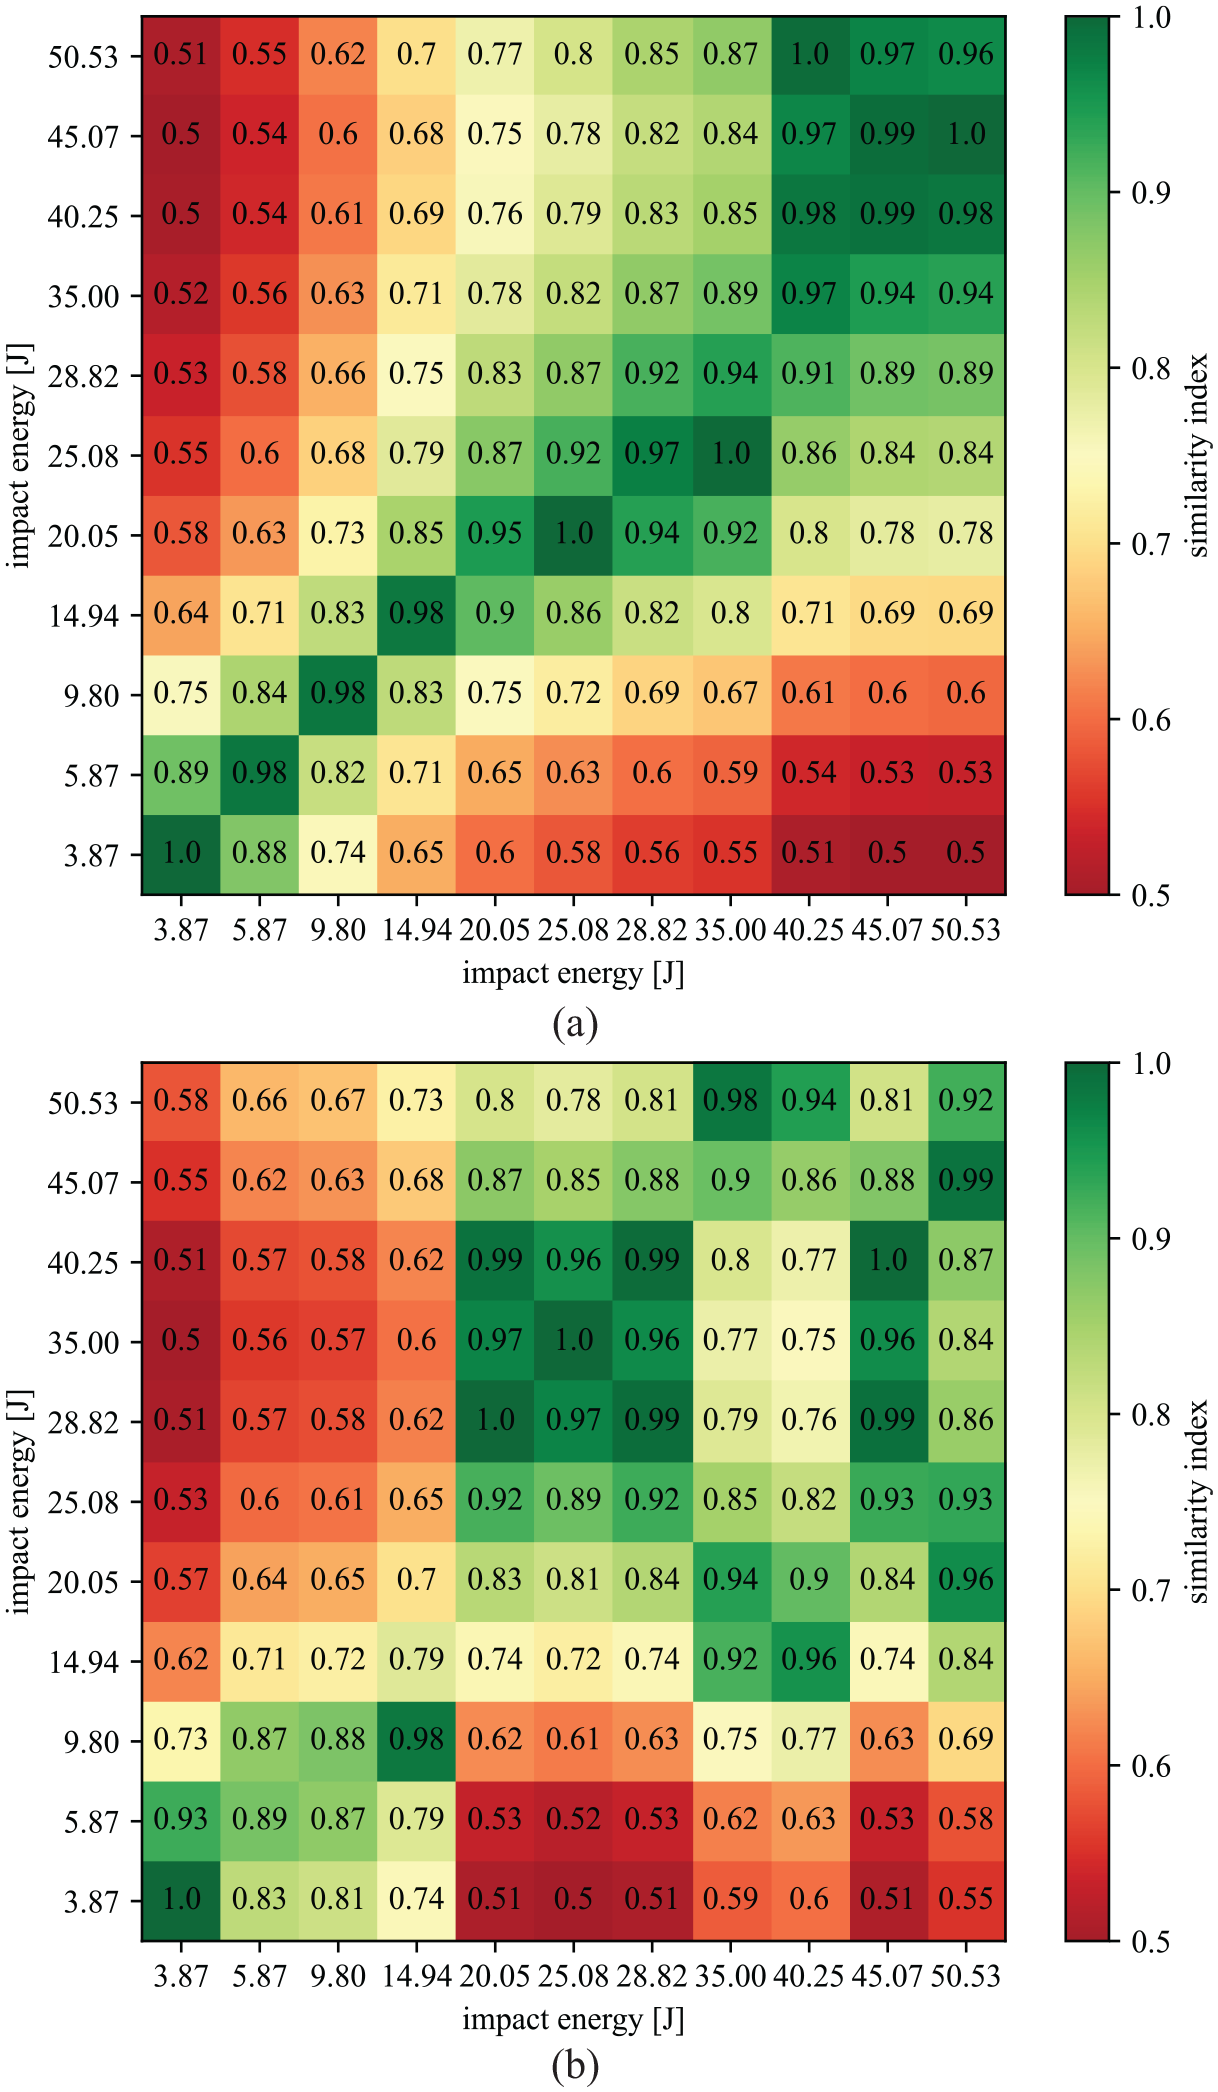
Similarity matrices for an impact event of various energies at impact location I12: (a) similarity matrix comparing transmitted energy from PZTs with FBGs, SI(Et,PZT, Et,FBG) and (b) similarity matrix comparing spectral energy from PZTs with FBGs, SI(Es,PZT, Es,FBG).
In the last part of the sensitivity tests, the metrological aspects were evaluated. The resolution performance of the sensors r was determined by averaging the values obtained across all sensors in the network. For this evaluation, the measurement noise of two consecutive 6.0 J impact responses (b0, b1) at the central location I4 were considered. Table 5 shows better resolution performance of the FBG sensors compared to the PZT results. On average, the resolution of the FBG network was about 3.7 times lower compared to the PZT outcomes, indicating that the optical sensors had lower noise levels.
Metrological aspects comparing FBGs with PZTs due to consecutive measurements of an impact event of 6.0 J at I4.
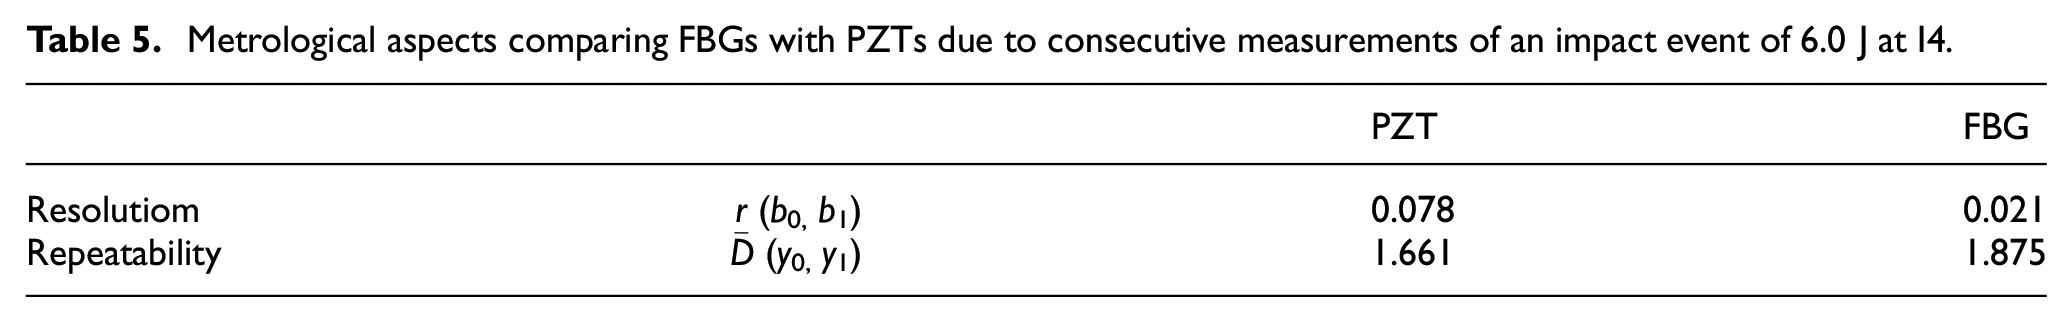
A further metrological analysis was performed to assess the repeatability performance of the PZTs and FBGs. This analysis aimed to determine the consistency of three successive replicate measurements under identical conditions. To evaluate the repeatability measurements, the Euclidean distance of the processed data was averaged across all sensors in the network, denoted as
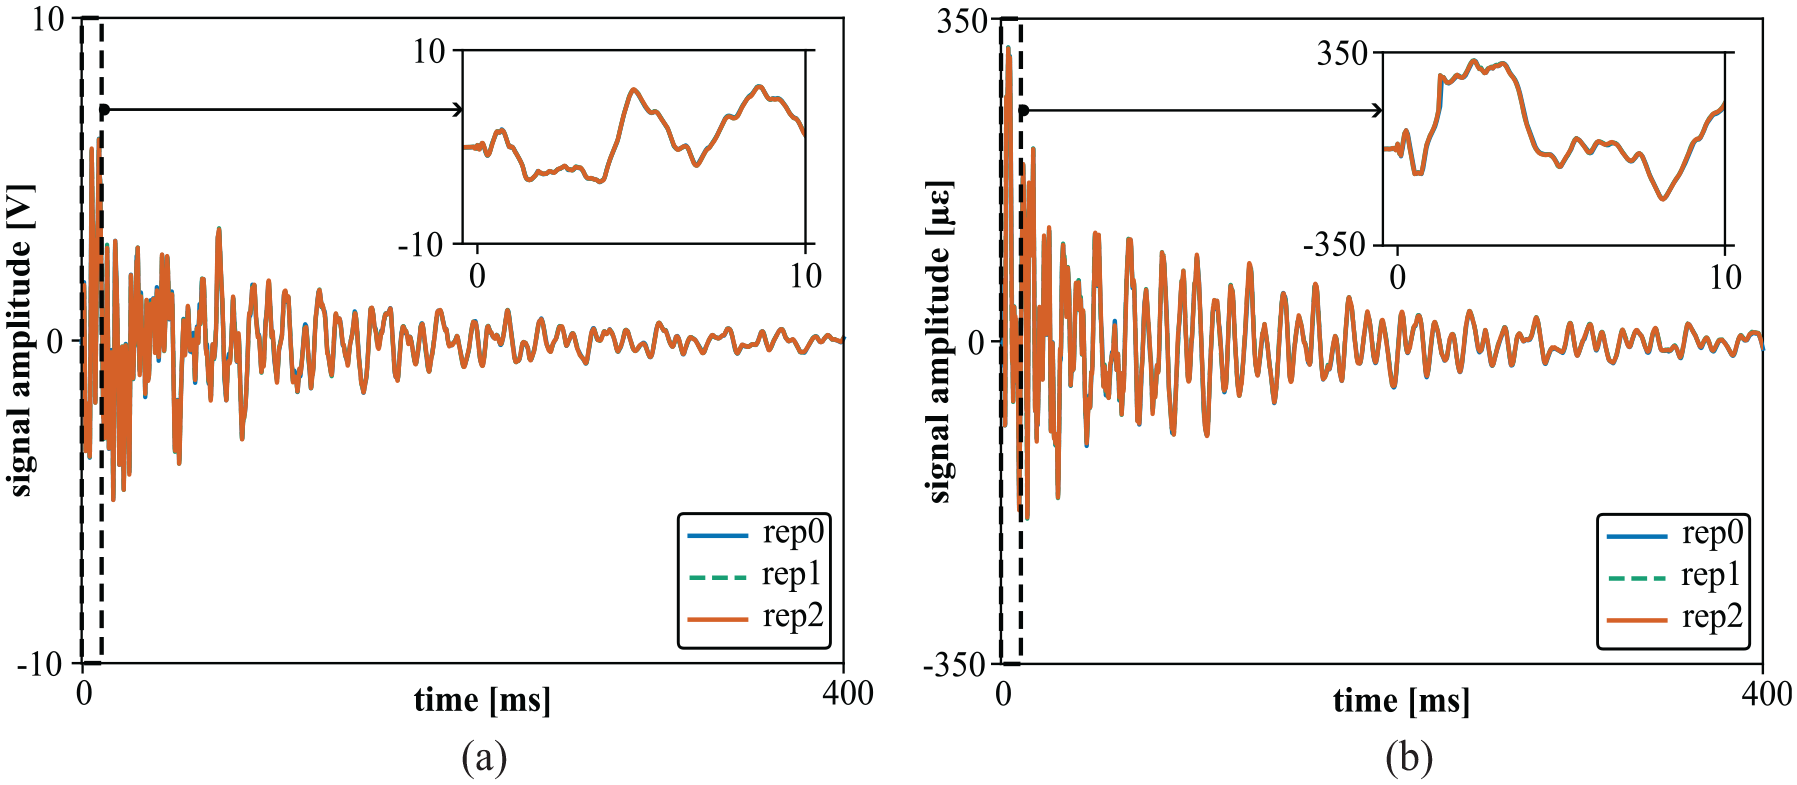
Three repetitions of the signal recorded by sensors at POS2 due to an impact event of 4.0 J at impact location I4:(a) repeatability recorded by PZT2 and (b) repeatability recorded by FBG2.
Factors test
The directional performance was experimentally evaluated by measuring the normalised transmitted energy resulting from 4 J impacts. To investigate the effect of the propagating wave incident angles on the sensor, impact locations (I5–I11) were arranged in a quarter circle around the sensors at POS2, as shown in Figure 2(c). This configuration defined seven evenly spaced angles, ranging from 0° to 90° relative to the main direction of the sensors. The distance between the sensor position and the impact source was kept constant at 180 mm.
Overall, the FBG sensor showed a higher sensitivity to different angles of incidence compared to the PZT sensor, as evidenced by the steeper slope in the linear fit (Figure 19(a)). The analysis showed a sharp decrease in directivity between 0° and 45°, followed by relatively constant values between 45° and 90°. Similar patterns were observed for PZTs, although they exhibited less pronounced directionality at lower angles of incidence (0° to 45°). In agreement with these results, previous studies22,74,75 have also emphasised the directional sensitivity of FBG sensors in monitoring systems.
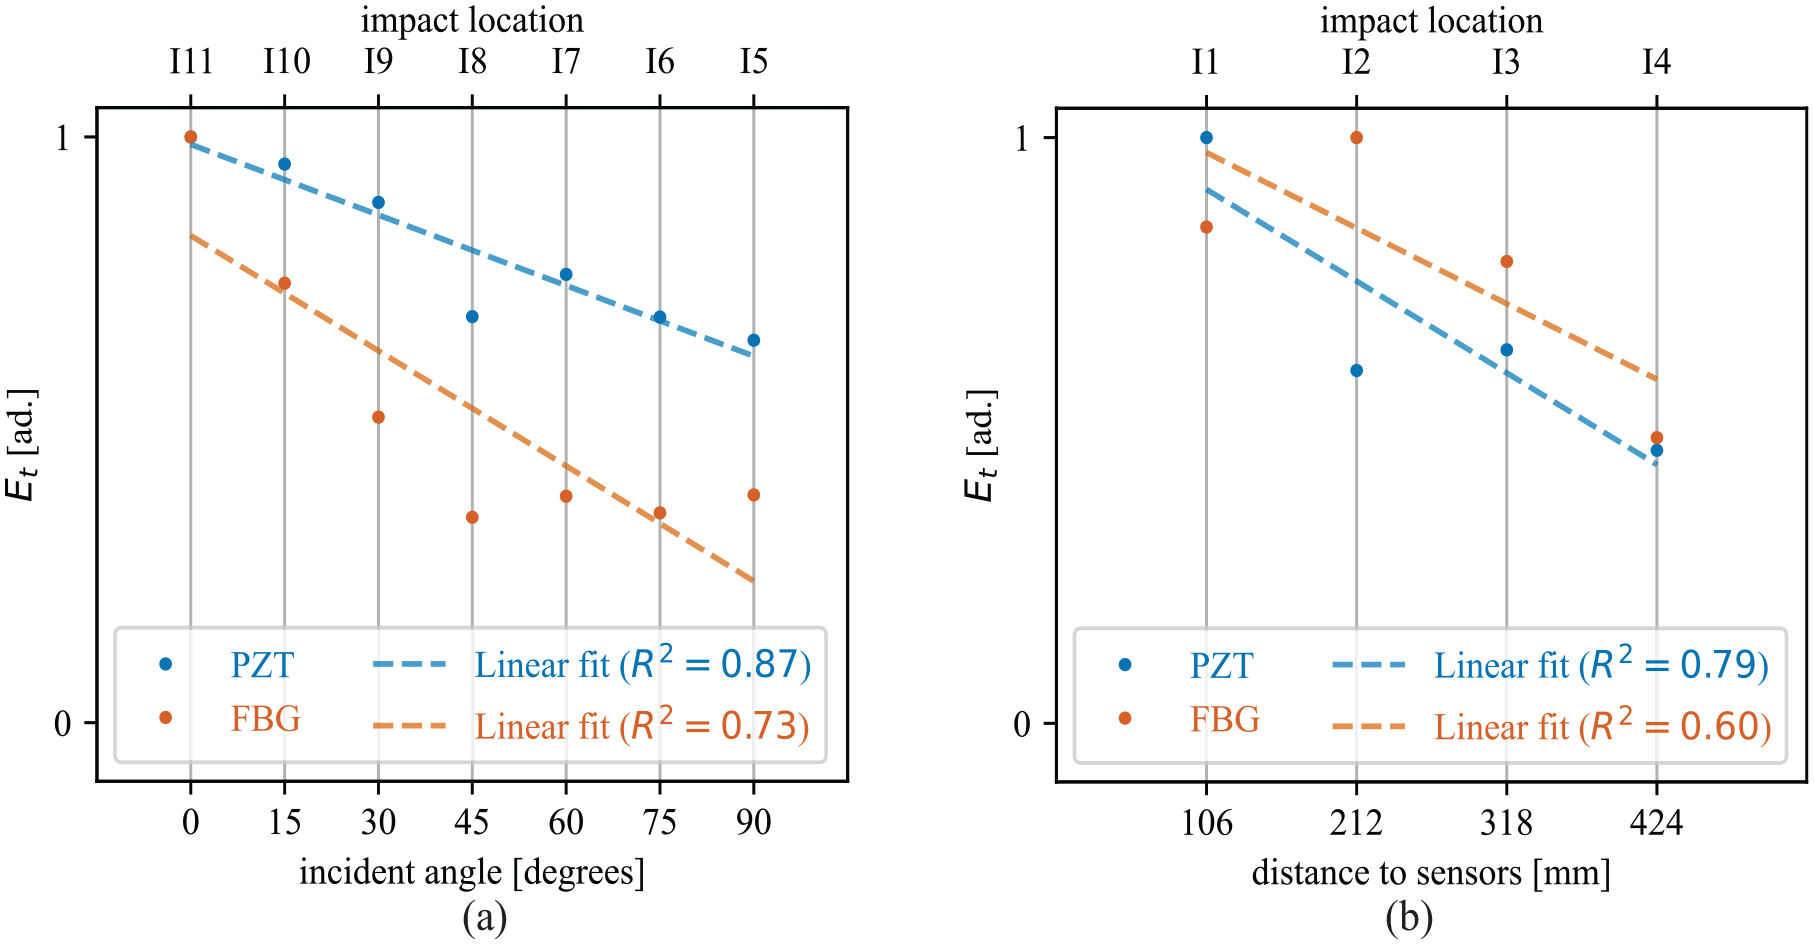
Factors test for an 4.0 J impact event: (a) normalised transmitted energy for varying incident angle (I5–I11) to sensors at POS2 and (b) normalised transmitted energy for varying distance (I1–I4) to sensors at POS1.
It is worth noting that despite the lower sensitivity of PZTs to different angles of incidence and their inherent isotropic sensitivity, a drop in the impact feature was also observed. This is mainly attributed to the rectangular geometry of the sensor, which affects the directional dependence of the mechanical properties and the stress concentrations at the edges. Consequently, this leads to different responses to impacts along different axes, influencing the overall performance of the sensor.
The evaluation of the attenuation effect on the sensors at POS1 was performed using the normalised transmitted energy extracted from 4 J impacts at four evenly distributed locations (I1–I4) 106 mm apart. The analysis revealed a significant decrease in normalised amplitude with increasing distance for both PZT and FBG sensors (Figure 19(b)). These results are consistent with previous studies by Wei et al. 76 and Pang et al., 77 who also reported decreasing amplitudes with increasing distance from the impact source, indicating higher accuracy at shorter distances. Although the curve trends for both sensors are relatively consistent, the limited number of impact runs makes it challenging to draw definitive conclusions regarding the influence of distance on signal strength.
In addition to directivity and attenuation, several factors can influence sensor performance in practical applications, affecting both the dynamics of transmitted energy and sensor sensitivity. Key variables include impactor dimensions, boundary conditions, impact velocity, vibration noise and temperature changes.
While assessing every possible variation within the current experimental framework may be impractical, it is crucial to acknowledge the benefits of a broader evaluation for impact identification. This assessment would include a range of material properties, more realistic structural geometry and diverse operational and environmental conditions. Expanding the scope of investigation can enhance the reliability and adaptability of sensors in monitoring systems, as discussed by Seno and Aliabadi. 78
Concluding remarks
This article presented a practical and structured framework for comparing sensor performance in identifying impacts on aerospace composites. This framework enabled a thorough evaluation of each sensor type and provided important information for the selection of the optimal sensor for impact monitoring systems. To demonstrate the proposed approach, a relevant application example compared FBGs with PZTs in a standard impact test setup. The comprehensive comparison included three main tests, which led to the following results:
Indeed, the presented systematic comparison method offers the potential to optimise sensor networks for accurate and cost-effective structural health monitoring. In future investigations, this includes overcoming the challenges posed by geometrically complex full-scale aircraft components by selecting high-performance sensors. In addition, investigating the applicability of this approach to other emerging sensor technologies can provide valuable insights for the further development of impact monitoring systems.
Footnotes
Declaration of conflicting interests
The author(s) declared no potential conflicts of interest with respect to the research, authorship, and/or publication of this article.
Funding
The author(s) disclosed receipt of the following financial support for the research, authorship, and/or publication of this article: This work is part of the PrimaVera Project, which is partly financed by the Dutch Research Council (NWO) under grant agreement NWA.1160.18.238.