
Abstract
In ultrasonic testing, omnidirectional wave propagation presents challenges of nonfocus energy loss and interface interference. Traditional phased array (PA) methods, despite their focusing capabilities, suffer from limitations in energy utilization and target detection accuracy. Frequency diverse array (FDA) technology, initially developed for radar, has demonstrated potential for improved range-angle-dependent ultrasonic beampatterns but still exhibits limitations due to S-shaped coupling. This study proposes an ultrasonic nonlinear frequency diverse array (ultrasonic-NFDA) with nonuniform frequency offsets to address these issues. The ultrasonic-NFDA employs modulated frequency offsets by introducing nonlinear carrying functions and incorporating additional parameters to manipulate beamforming and enhances energy concentration at focal points. Furthermore, the multi-objective differential evolution algorithm is used for parameter optimization. The proposed method decouples the range-angle beampattern and improves the signal-to-interference-plus-noise ratio. Numerical evaluations and simulations demonstrate that ultrasonic-NFDA outperforms the ultrasonic linear FDA and PA series, achieving better peak sidelobe level and half-power beam width. Experimental validations confirm the effectiveness of ultrasonic-NFDA in practical ultrasonic testing scenarios, showing significant improvements in defect detection and imaging clarity. The optimized beampatterns effectively reduce artifacts and enhance the precision of defect localization. The proposed integration of nonlinear frequency offsets and parameter optimization in array testing offers a robust solution for more accurate and efficient ultrasonic inspection methodologies.
Keywords
Introduction
Ultrasonic testing is one of the active research topics in nondestructive testing (NDT) and structural health monitoring (SHM). 1 In view of the omnidirectional propagation characteristics of elastic waves, there are some problems such as nonfocus, energy loss, and serious interface interference in the scanning and detection of a single ultrasonic transducer.2,3 As a result, ultrasonic array testing has received a lot of attention from theoretical research to commercial applications such as medical imaging, pipeline inspection, and composite material evaluation.4–6 Ultrasonic arrays for NDT are traditionally employed to simulate monolithic transducers. This method relies on independently controlled parallel transmission circuits, allowing for the staggered activation of transmitter elements. This arrangement facilitates the translation and focusing of the physical wavefront introduced into a target specimen. 7 By combining the outputs from multiple sensors, the system can create a more comprehensive understanding of the target being observed. 8
Phased array (PA), also known as beamforming, has been widely used and researched because of its focus features and maneuverability. 9 By implementing suitable phase delays or time delays to the excitations or responses and subsequently summing the responses, the array output is maximized in the desired direction. Liu et al. 10 presented a PA method for detecting the damage in plate-like structures with a compact rectangular phased piezoelectric transducer array. Yang et al. 11 proposed a Lamb wave PA method based on frequency response function, which largely facilitates the experimental operation. However, both compact PA and sparse PA are only angle-dependent, so other post-processing methods are needed to achieve accurate positioning. 12 As a result, frequency diverse array (FDA) was first proposed and applied in the field of radar detection to achieve better-focusing effects. 13 Compared with traditional PA which only provides angle-dependent transmitting beampattern, by adopting a small frequency increment across the array elements, the FDA can generate a range-angle-dependent transmit beampattern. 14 Due to the unique property of range-angle dependence, the FDA can provide the potential of focusing transmit energy in a specific range-angle space. Zhang et al. designed a synthetic aperture radar in which transmitted waveforms of different subarrays occupy different frequency bands in the range frequency domain and achieved high-resolution imaging. 15 Lang et al. 16 developed an ultrasonic linear frequency diverse array (ultrasonic-LFDA hereafter) focusing imaging method for Lamb wave, thus demonstrating the feasibility of FDA in ultrasonic testing.
However, the basic FDA generates an S-shaped range-angle-coupled beampattern, which limits its application in target detection and localization. 17 Consequently, many potential interferences located at any maximum may make the resulting signal-to-interference-plus-noise ratio (SINR) worse, thus reducing the effectiveness of the detection signal. 18 To achieve a decoupled range-angle beampattern, various scholars have proposed FDA schemes with nonlinear frequency offsets (nonlinear frequency diverse array (NFDA)). Khan et al. introduced a uniformly spaced FDA with logarithmically increasing frequency offsets (log-FDA), which achieved a single maximum in the range-angle dimension. 19 However, log-FDA exhibited a trailing beampattern characterized by poor range resolution and a high peak sidelobe level (PSLL). Gao et al. 20 utilized square increasing and cubic increasing frequency offsets to decouple the range-angle relationship of the basic (FDA). Shao et al. 17 proposed the FDA with modified sinusoidal frequency offset (Msin-FDA), which provides a narrow pencil beampattern, but at the cost of massive computing resources.
Although these reported FDA schemes can form a range-angle-decoupled beampattern in the electromagnetic field, the effectiveness of these methods in ultrasonic testing has yet to be explored. This article proposed a novel FDA beampattern synthesis method with modified nonlinear carrying functions and modulated frequency offset (ultrasonic nonlinear frequency diverse array (ultrasonic-NFDA)). In ultrasonic-NFDA, the frequency offset can be verified under the same carrying function by introducing extra modulating parameters. Moreover, the introduced parameters bring the possibility of optimizing beamforming, which fully exploits the potential of NFDA on each carrying function. Compared with ultrasonic-LFDA, the proposed ultrasonic-NFDA has more parameter flexibility, thus performing better in beam aggregation and sidelobe suppression. It should be noted that the term “nonlinear” describing “frequency diverse array” refers to the nonuniform bias of frequency bias among the elements instead of the nonlinearity of wave propagation. As a result, this study will be still based on the linear model of ultrasonic waves.
The rest of this article is organized as follows. In section “FDA scheme in Lamb waves and beampattern synthesis,” the range-angle sensitivity of ultrasonic FDA is explained based on the acoustic model. Then ultrasonic-NFDA and its optimization method are proposed, followed by numerical evaluation and system simulation. In section “Experimental validation,” a set of experiments have been conducted to verify the effectiveness of ultrasonic-NFDA. Section “Conclusion” concludes this paper.
FDA scheme in Lamb waves and beampattern synthesis
Basic model of ultrasonic FDA
Both PA and FDA are first derived from radar, which are usually spatially uniformly distributed. However, the far-field assumption and the premise of small-frequency offset in radar FDA cannot be applied to the ultrasonic wave field. In the application scenario of ultrasonic testing, there are several reasonable hypotheses as follows: (1) The defects are possibly located near the array or far away from the array. As the far-field problem can be regarded as a special case of the near-field problem, the near-field case as shown in Figure 1 is considered here, and the waves are regarded as diverging spherical waves. (2) The working frequency of excitation usually lies at the magnitude of kHz and MHz. Therefore, the frequency offset is comparable with the frequency itself.
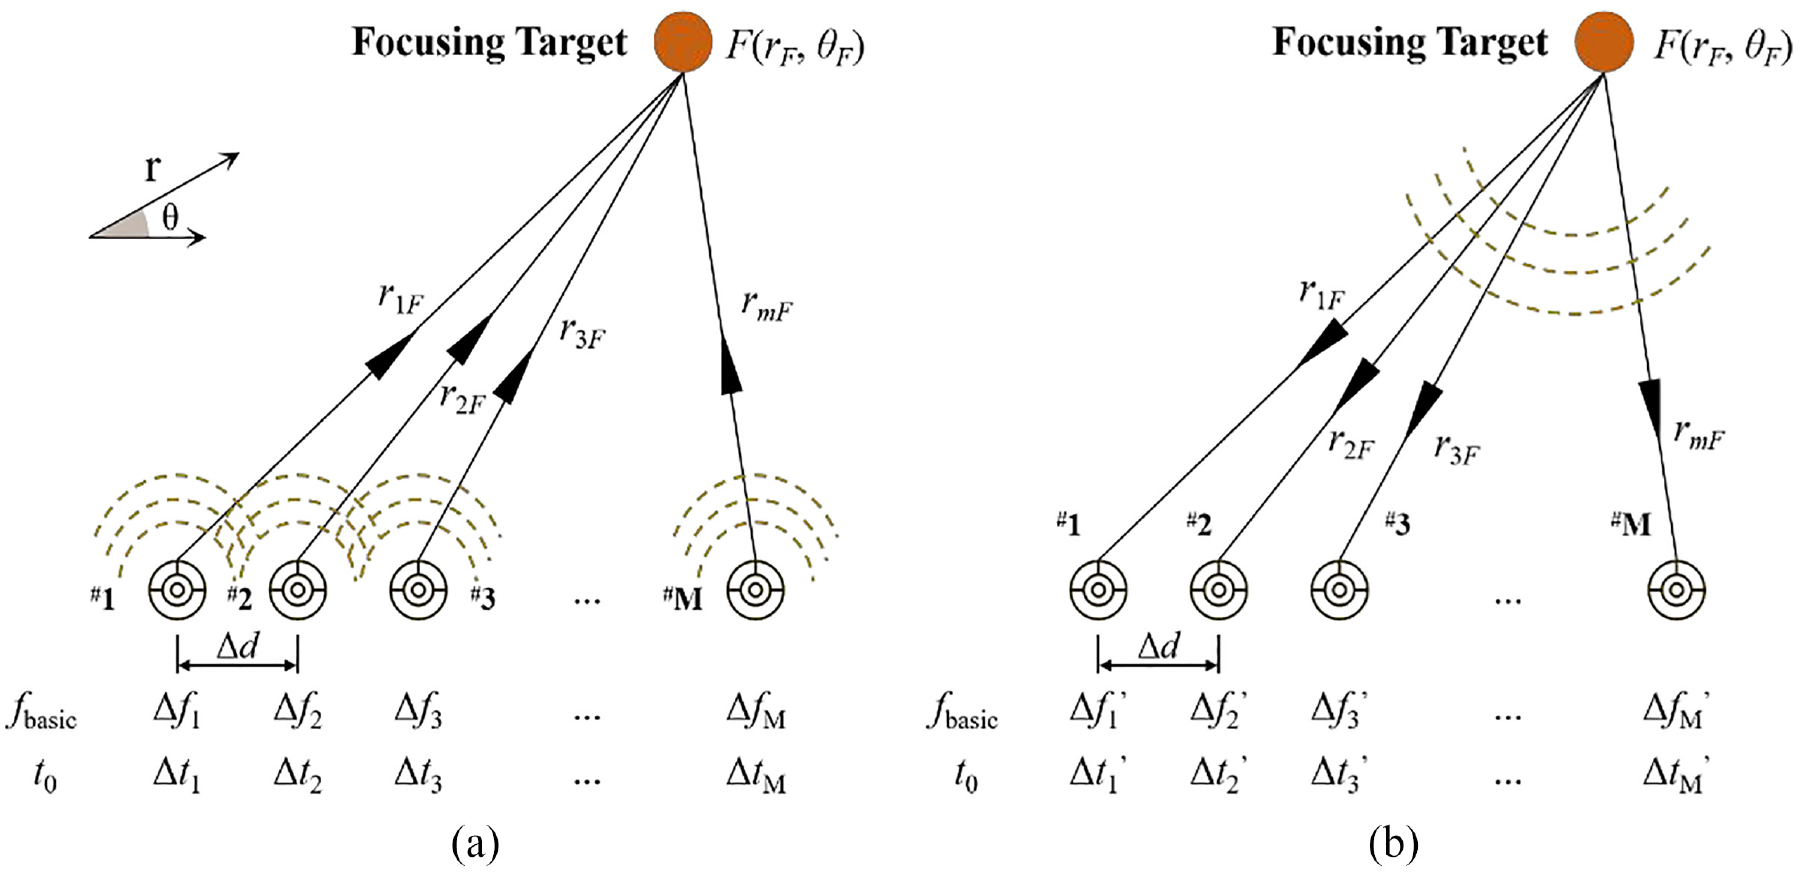
Diagram of (a) transmitting and (b) receiving cases for PA with diverse time delays and FDA with various frequency offsets.
Taking the leftmost element as the basic element, the transmitted signal frequency of ith element can be defined as

in which, fbasic is the carrier frequency of the reference element, and Δf i is the frequency offset of ith element. Based on these assumptions, the energy pattern of FDA in the polar coordinate can be derived as shown in the following equation
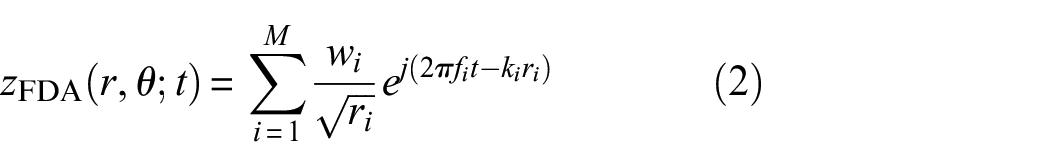
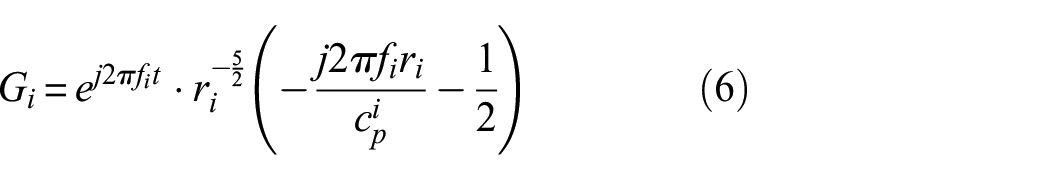
in which w i and f i represents the weight and the center frequency of ith piezoelectric ceramic transduer (PZT) element. In this study, w i is always set as 1 for simplicity. k i represents the wavenumber corresponding to the frequency f i , r i is the distance from the point R(r, θ) to the ith PZT P i (r i p , θ i p ). If the array energy is desired to be concentrated at the focal point F(r0, θ0), the focusing energy pattern of FDA can be derived taking phase offset into consideration, as the following equation
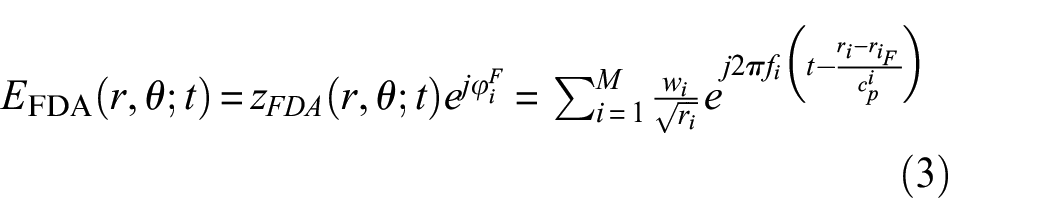
in which φ i F , riF, cp i is the phase offset, focusing distance, and signal’s phase velocity of the ith PZT, respectively. Since the far-field approximation conditions are not applicable in ultrasonic FDA, there are
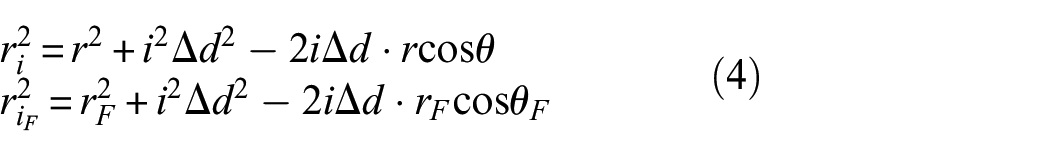
where rF and θF are the distance and angle from the origin to the point to the preset focal point. Δd is the distance d adjacent elements.
In order to explain the focusing property of ultrasonic FDA in both dimensions of distance and angle, the gradient can be derived. To investigate the focusing effect in both dimensions, let r = rF, θ = θF, there is
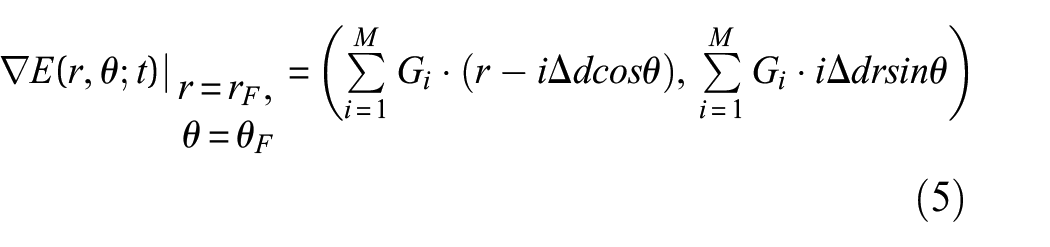
in which,
The aforementioned equations demonstrate that the energy pattern of FDA is time-variant, exhibiting clear periodicity and range-angle sensitivity attributable to the term
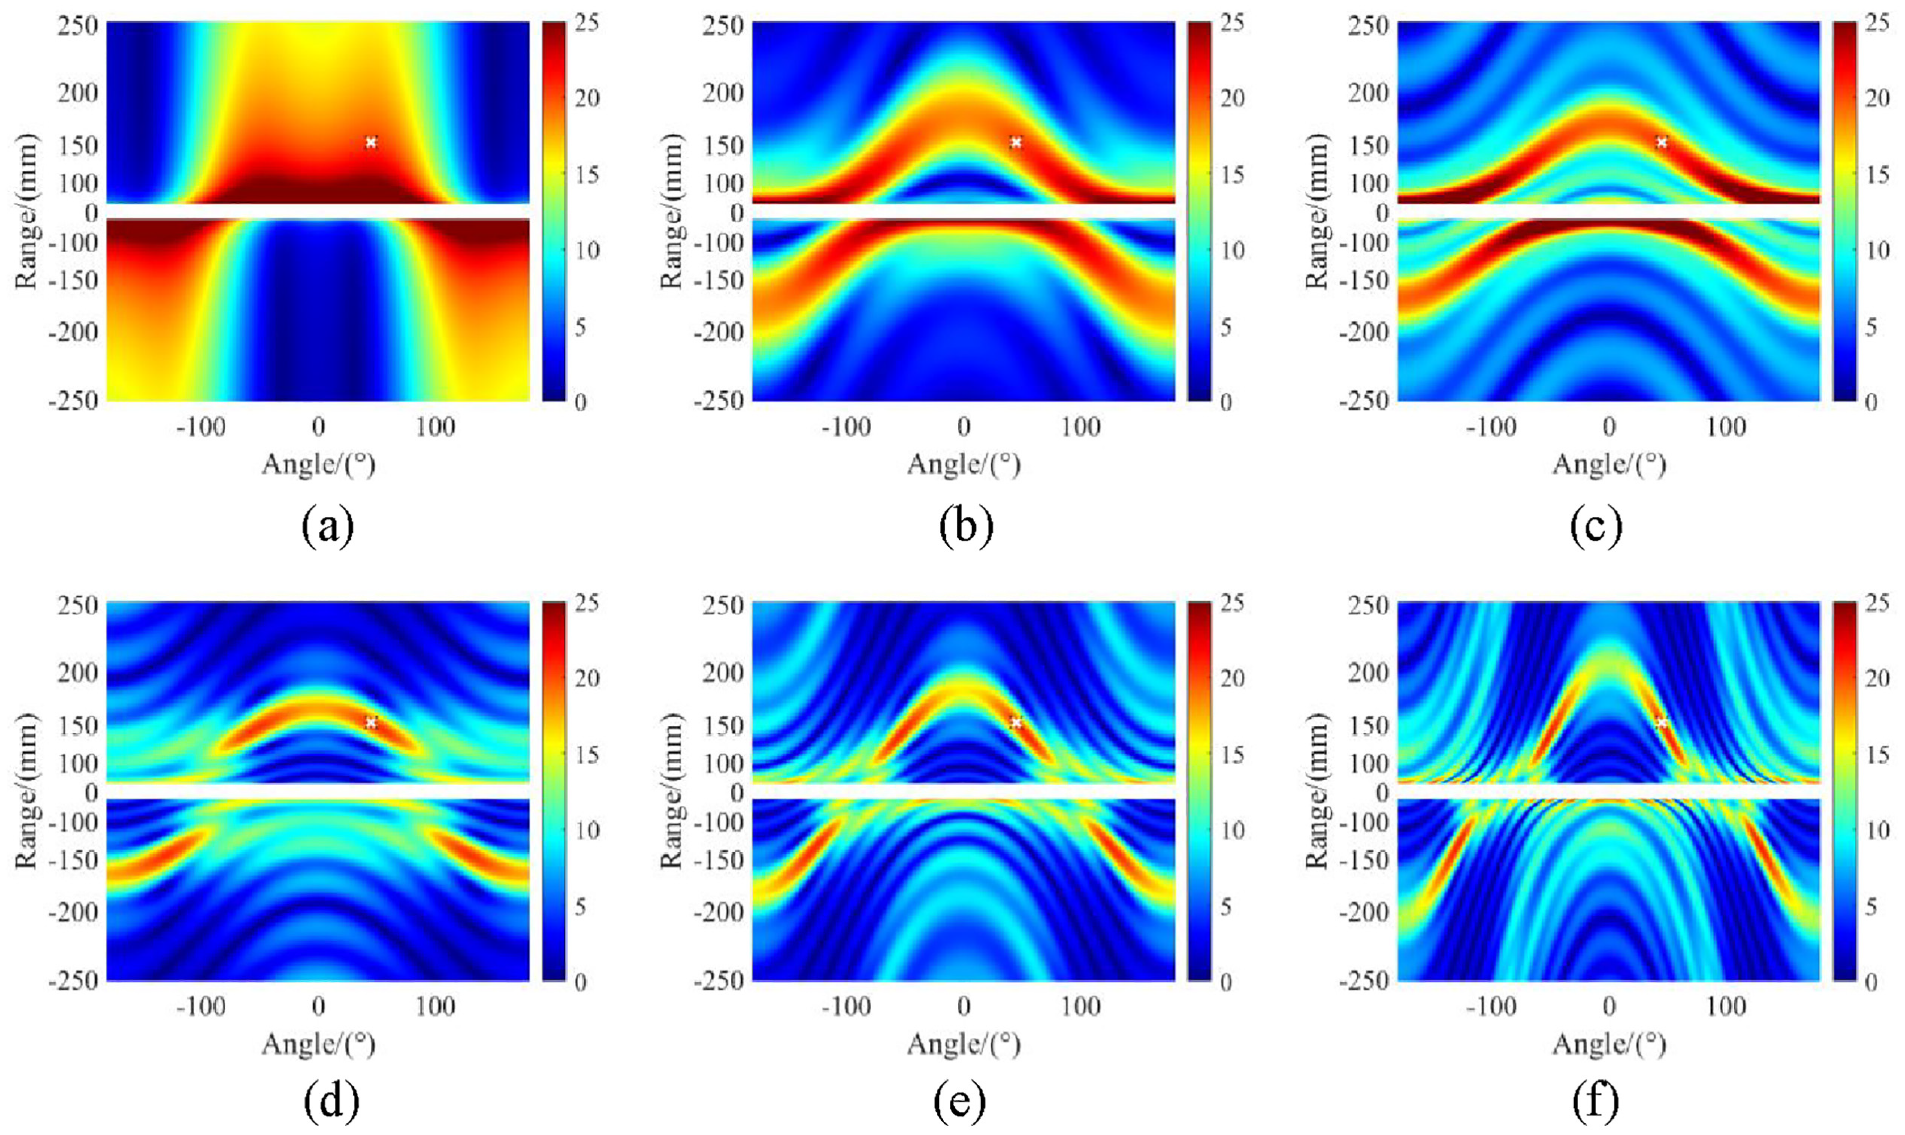
Focusing energy pattern at F(150 mm, 45°): (a)–(c) for fbasic = 50 kHz, Δf = [0, 15, 25] kHz. (d)–(f) for fbasic = [100, 200, 400] kHz, Δf = 25 kHz.
Frequency offset design
Because of the periodic term ej2πft in Equation (3), the uniform frequency offset may cause the energy gradient to be distributed with even periods, making most of the energy not act on the preset focusing point F. To solve the problem of low SINR caused by uniform frequency offset, a nonuniform frequency offset strategy is designed. Consider a uniformly spaced FDA structure consisting of M PZT elements, and the spacing between adjacent elements is d, as shown in Figure 1. Frequency bias can be realized by a nonlinear carrying function. For sin-FDA, the frequency offset of the ith element is

where α1 is the shape-controlling factor and β1 is the period-controlling factor, Δf is the referential frequency offset. For log-FDA, the frequency offset of the ith element is

where α2 and β2 both serve the same role in sin-FDA. For sigmoid-FDA, the frequency offset of the ith element is
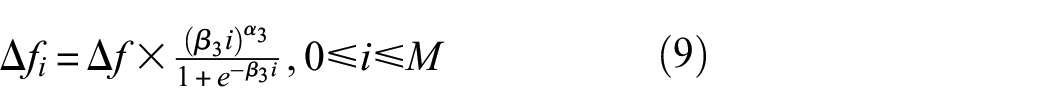
where α2 and β2 both serve the same role in sin-FDA.
To investigate the performance of NFDA under the three carrying functions, an 8-element array with the base frequency fbasic = 50 kHz and Δf = 15 kHz was adopted. For fairness of comparison, the mean excitation frequency of NFDA is set to be consistent with ultrasonic-LFDA. Therefore, let βk = 0.4, according to the calculation, α1 = 2.91, α2 = 2.33, α3 = 2.42. The array element frequency offset values are shown in Figure 3(a) to (c), with the comparison to linear offsets. The corresponding energy patterns are shown in Figure 3(d) to (f). Compared with the linear frequency offset at the same fundamental frequency in Figure 2(b), the focusing modes under the three carrying functions show a narrower high-energy band near the focus to different degrees. For sigmoid-FDA in Figure 3(d), the overall shape of the energy pattern is similar to that in ultrasonic-LFDA, but the high-energy band is narrowed. For log-FDA in Figure 3(e), the high-energy band narrows further and an in-band split begins to appear around the focal point. For sin-FDA in Figure 3(f), the band degenerates into a segment containing the focal point.
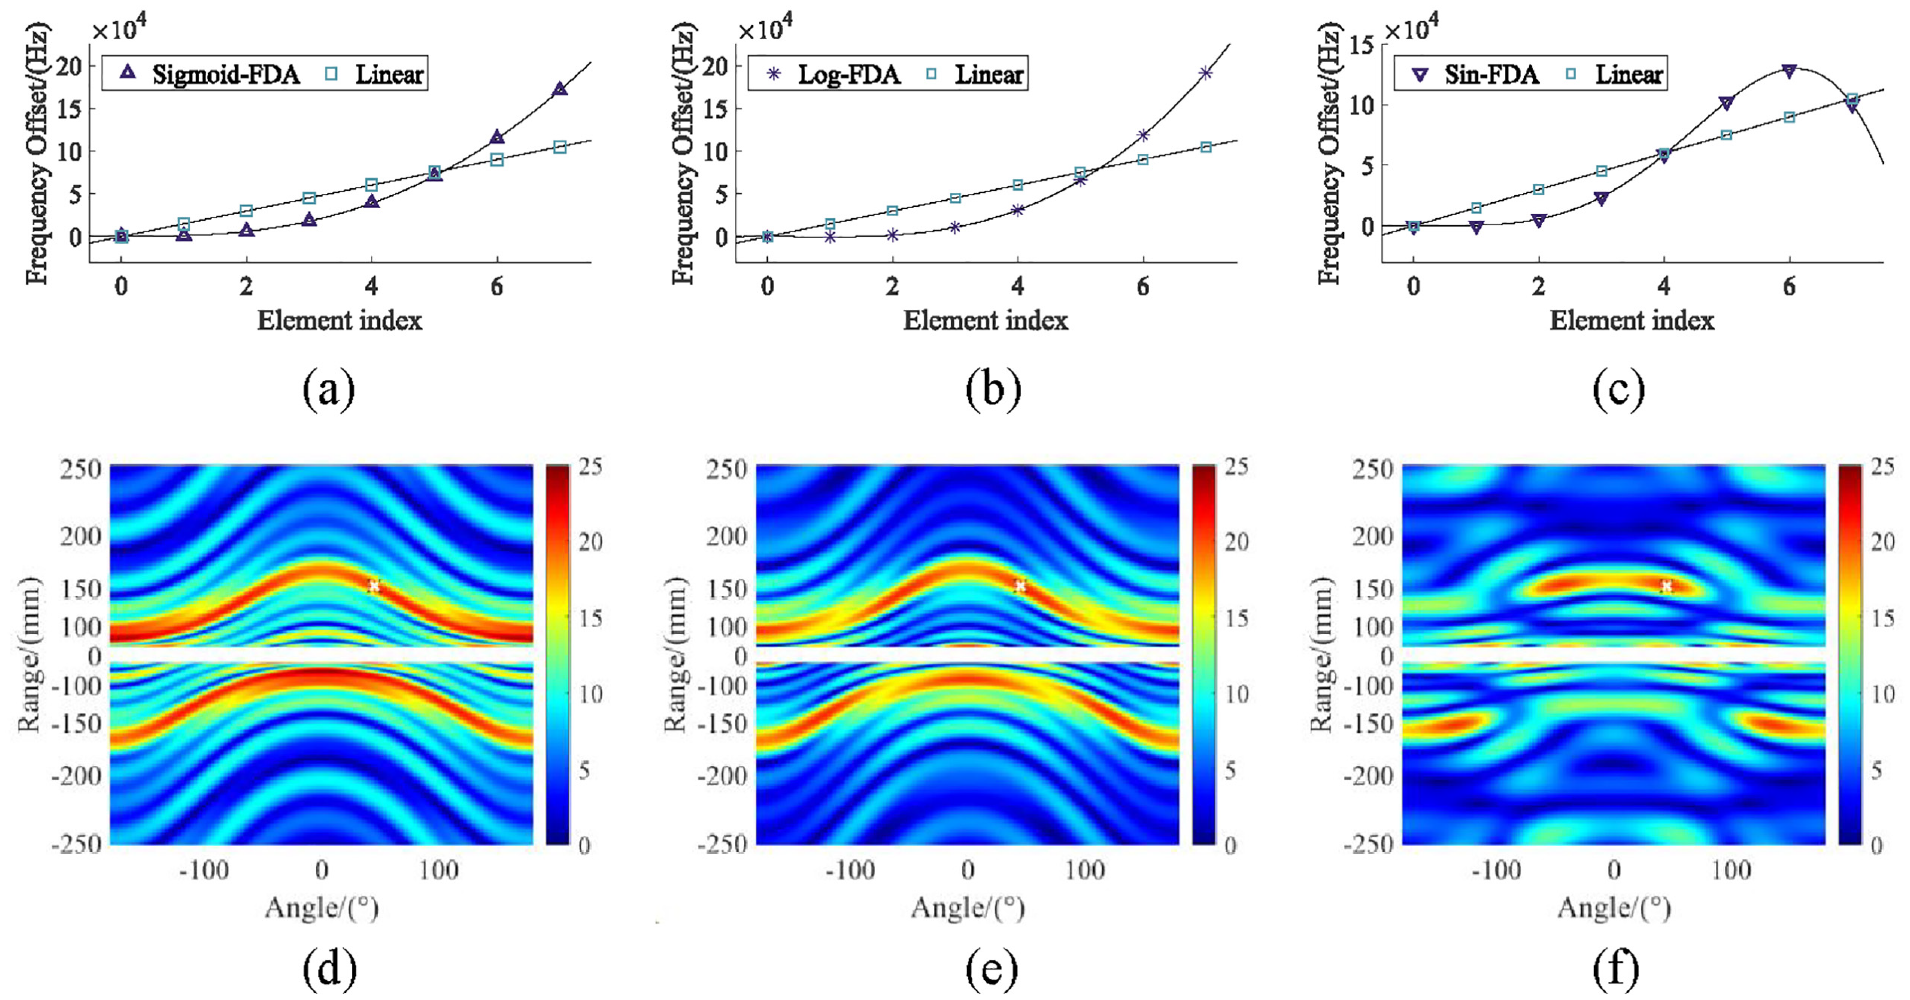
Focusing effect based on nonlinear carrying functions: (a)–(c) Frequency offset for sigmoid-FDA, log-FDA, and sin-FDA. (d)–(f) Focusing energy pattern at F (150 mm, 45°) for sigmoid-FDA, log-FDA, and sin-FDA.
Although the FDA under the nonlinear carrying function could show a better range-angle focusing effect, to get specific αk and βk (k = 1, 2, 3) to get optimal focusing property still requires further procedure.
Optimization design
An ideal focusing pattern shows both a narrow high-energy band and a high side-lobe suppression feature at the same time. Therefore, two focusing effect evaluation metrics are adopted: (1) PSLL and (2) half-power beam width (HPBW). Due to the failure of far-field effect in the scenario of ultrasonic inspection, the calculation method of these two indicators needs to be rederived according to their definition. PSLL is defined as the ratio between the peak power of the main lobe and the peak power of the maximum sidelobe, usually expressed in decibels (dB), as the following equation for PSLL r ,
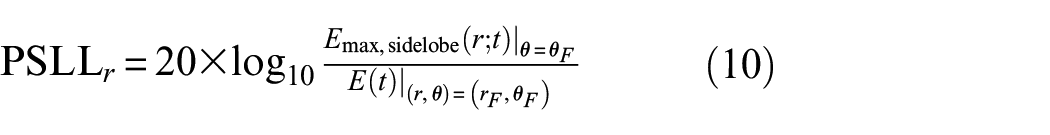
similarly, for PSLL θ ,
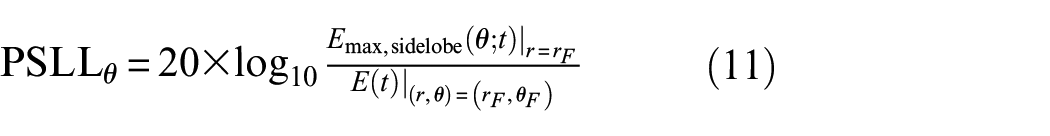
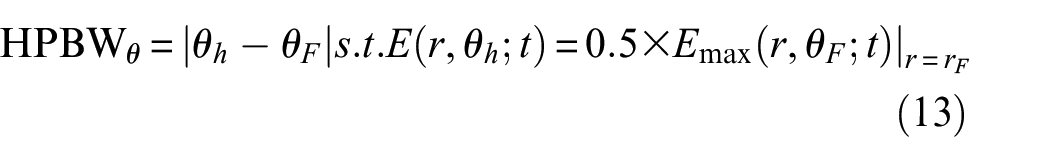
in which the sidelobe usually locates symmetrically beside the focal point as local maximum. HPBW is a measurement of the main beam width, that is, the angle between two points at which the power drops to half the maximum power, as the following equation for
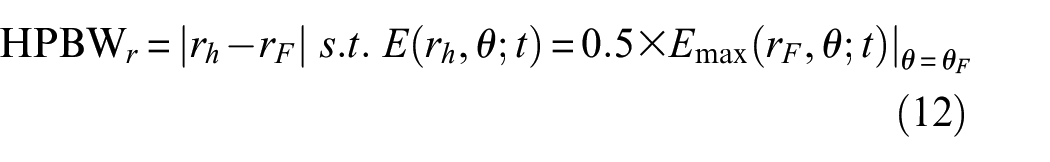
similarly for
For an ultrasonic-NFDA of desired performance, both PSLL and HPBW should be as low as possible. Considering these two kinds of metrics, the objective function of NFDA is designed as
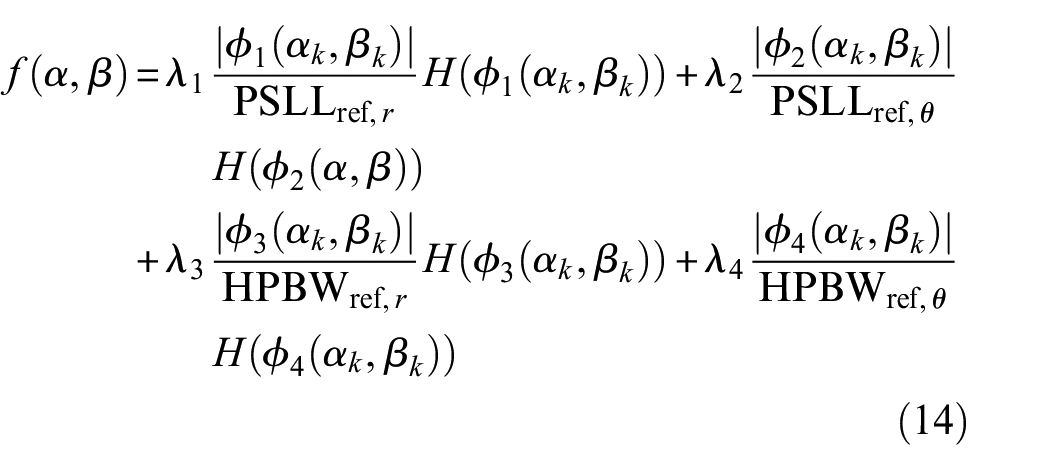
wherein
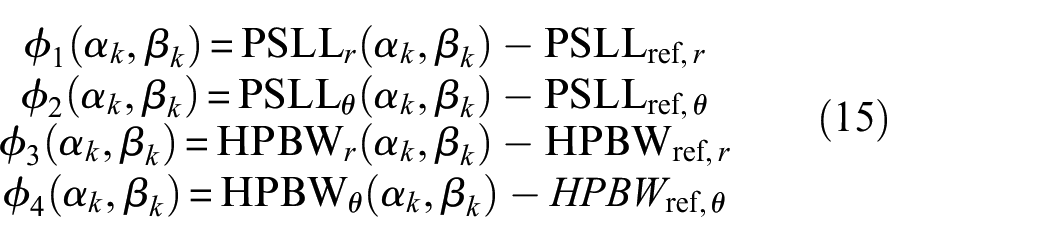
where PSLL(αk, βk) is the PSLL of synthesized beampattern, and HPBW(αk, βk) are the HPBW in angle and range dimensions, respectively. PSLLref is the initial value of the PSLL in range and angle dimensions. The HPBWref is the reference value of HPBW in range and angle dimensions where α = 0 and β = 0.1.
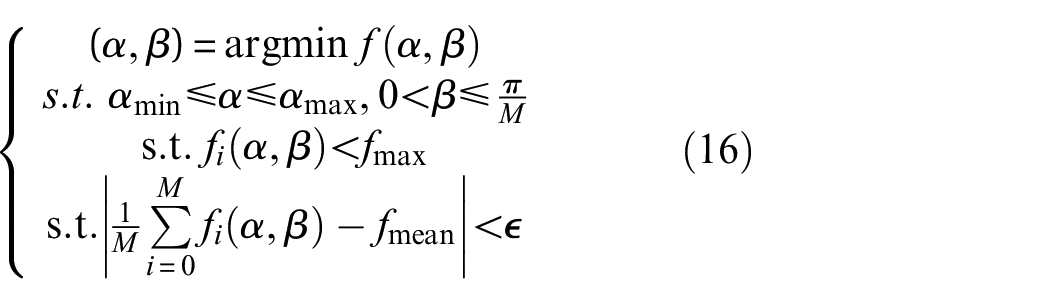
It is noteworthy that a large value of α results in the frequency offset of elements near the central element approaching zero, leading to high sidelobes in the angular dimension. Consequently, an additional constraint is introduced to limit the value of αmax and αmin. This constraint not only prevents the formation of beampatterns with high sidelobes but also reduces the time required for the optimization process. Additionally, for sin-FDA modulating, given that the period of |sin(m)| is π, the limits of β are defined as 0 < β ≤ π/M, which ensures all elements obtain frequency offset in a single period, given as
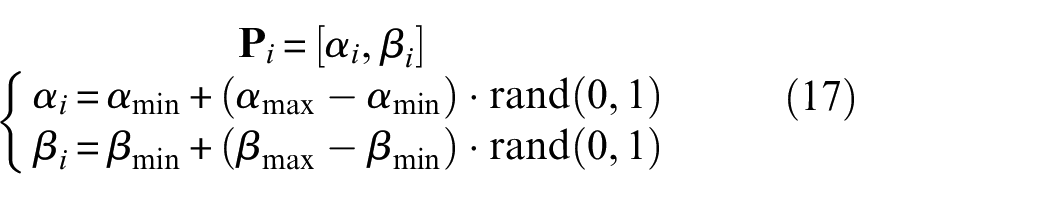
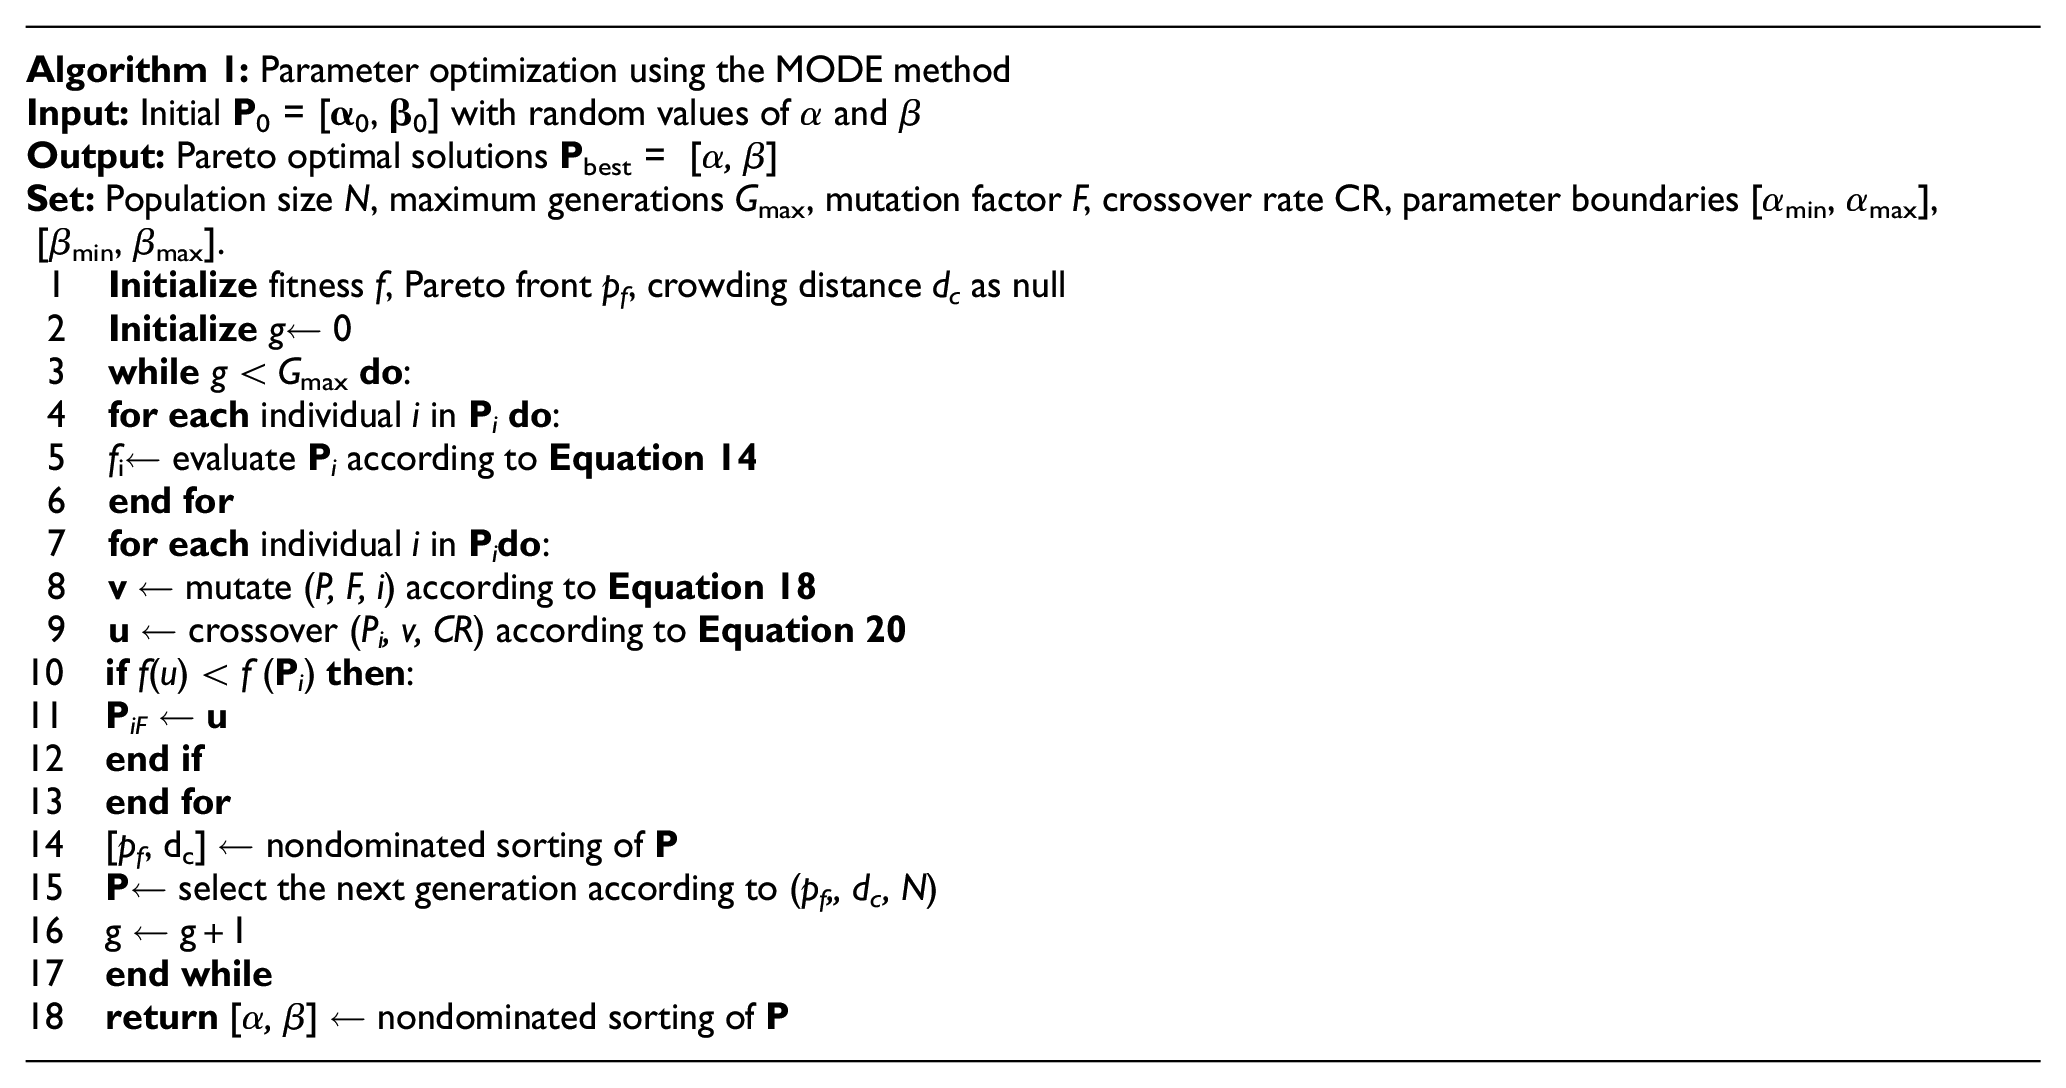
The proposed algorithm leverages the multi-objective differential evolution (MODE) approach to optimize the parameters α and β. The algorithm initializes a population of potential solutions and iteratively evolves this population through mutation, crossover, and selection operations. It evaluates each solution based on the cost function (Equation (16)). By employing nondominated sorting and crowding distance calculations, the algorithm ensures a diverse set of Pareto optimal solutions. This approach not only enhances the accuracy of beam-pattern focusing but also minimizes side-lobe interference and computational time. During initialization, each individual in the population is generated according to Equation (17). Assume the population size is N, and each individual
The mutation operation generates a new mutant vector v i ,

where

The crossover operation generates a trial vector
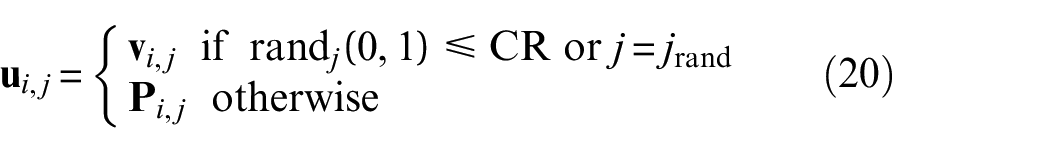
where CR is the crossover probability, and jrand is a randomly selected dimension (either α or β). Specific formulas are:
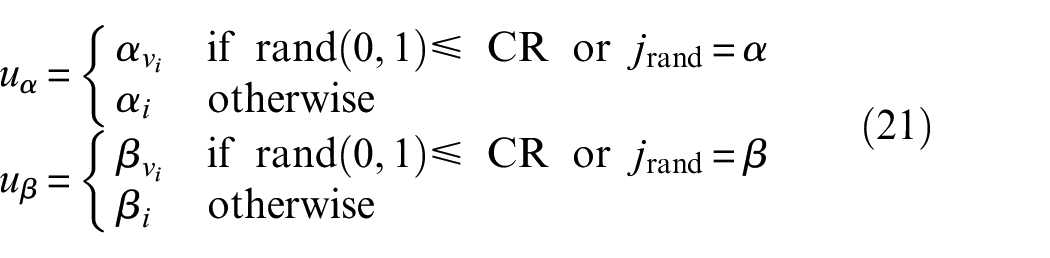
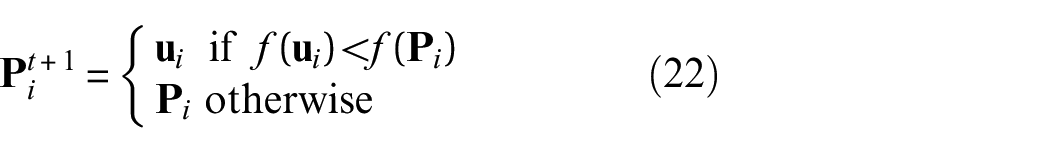
Thus, the trial vector
The algorithm pseudocode is as follows:
Numerical evaluation
To evaluate the performance of the proposed ultrasonic-NFDA beam-pattern optimization, a series of numerical experiments were conducted. The evaluation metrics focused on PSLL and HPBW to ensure the effectiveness of the beampattern in both range and angle dimensions.
The simulations employed an 8-PZT element array with a base frequency fbasic = 50 kHz and various frequency offset designs: linear, logarithmic (log-FDA), Sigmoid (sigmoid-FDA), and sinusoidal (sin-FDA). The initial offset parameters were set as αk=2, βk=0.4, and Δf = 15 kHz. The performance of the optimized nonlinear frequency offset strategies was compared against the linear frequency offset strategy.
Table 1 summarizes the optimized parameters and corresponding PSLL and HPBW values for each FDA design. The comparison between raw and optimized metrics clearly demonstrates the enhancement in beampattern performance through the ultrasonic-NFDA approach. Figure 4 shows the optimized beampattern of log-FDA, sigmoid-FDA, and sin-FDA, respectively. Each pattern illustrates the beam’s focusing ability at the specified focal point. Comparing Figure 4(a) with Figure 3(d), Figure 4(b) with Figure 3(e), and Figure 4(c) with Figure 3(f), the optimized beam focusing effect is better than the original NFDA under each basis function.
Optimized parameters of ultrasonic-NFDA.
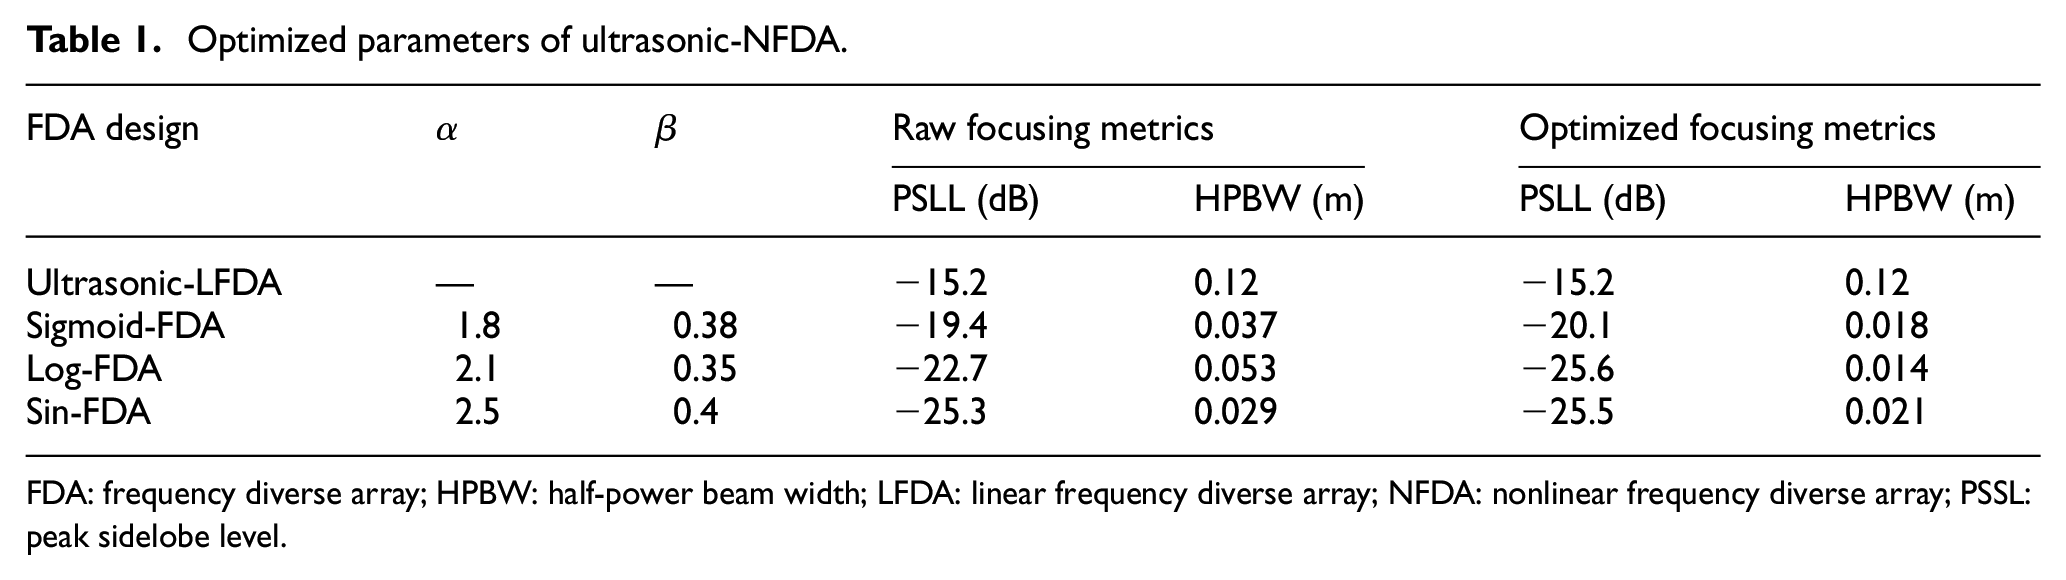
FDA: frequency diverse array; HPBW: half-power beam width; LFDA: linear frequency diverse array; NFDA: nonlinear frequency diverse array; PSSL: peak sidelobe level.
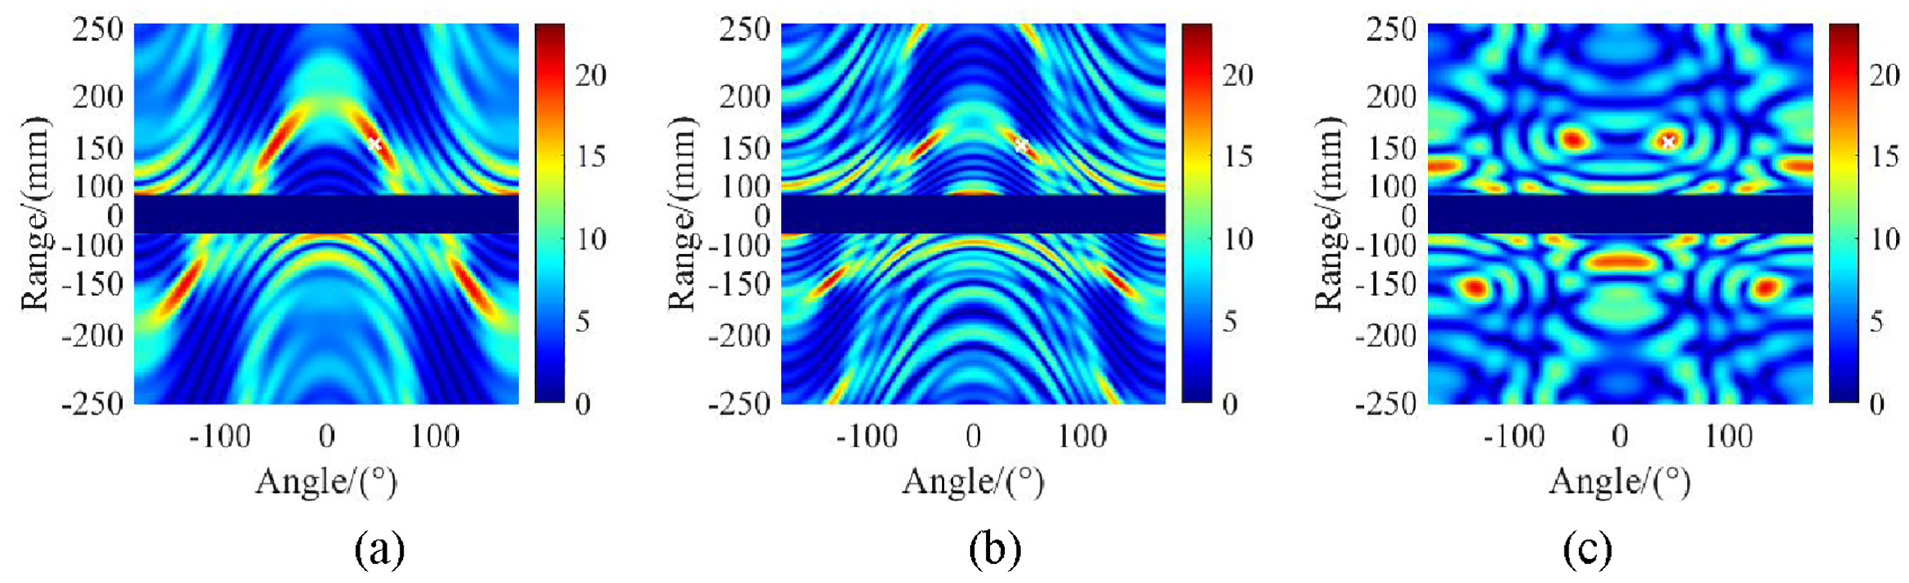
Focusing pattern based on ultrasonic-NFDA under fbasic = 50 kHz and Δf = 15 kHz: (a)–(c) frequency offset for log-FDA, sigmoid-FDA, and sin-FDA, respectively.
The results indicate that the nonlinear frequency offset designs outperform the ultrasonic-LFDA in terms of both PSLL and HPBW. The sin-FDA, with the highest concentration of energy at the focal point, provides the best performance with the lowest PSLL and HPBW values. This improvement is attributed to the efficient focusing capability of the nonlinear frequency offsets, which mitigate the range-angle coupling effect and enhance the beampattern’s clarity and precision.
Simulation evaluation
In order to intuitively explain the operation mechanism of ultrasonic-NFDA shown in Figure 5(a), a series of simulation cases were conducted to evaluate the focusing effects using the finite element (FE) analysis method. COMSOL Multiphysics 6.2 was used for ultrasonic wave simulation. The aluminum plate of 500 mm × 500 mm × 3mm was modeled as the specimen, with the center of the plate taken as the origin of the coordinates. The X-axis and Y-axis are parallel to the horizontal and vertical sides of the plate, respectively. Eight array elements are set on the center line of the aluminum plate, that is, (−52.5, 0), (−37.5, 0), (−22.5, 0), (−7.5, 0), (7.5, 0), (22.5, 0), (37.5, 0), (52.5, 0) mm in position. The focal point is set at the F1 (106.1, 106.1) mm and F2(180, 0) mm in position. At the excitation frequency specified in the numerical and simulation experiments, some wave packets reflect off the structural boundary and couple with other wave packets due to a different group speed between different modes. This phenomenon largely affects the purity of A0 mode wave signal used for detection. As a result, low-reflection boundary condition is set for all boundaries in nonthickness directions in the software.
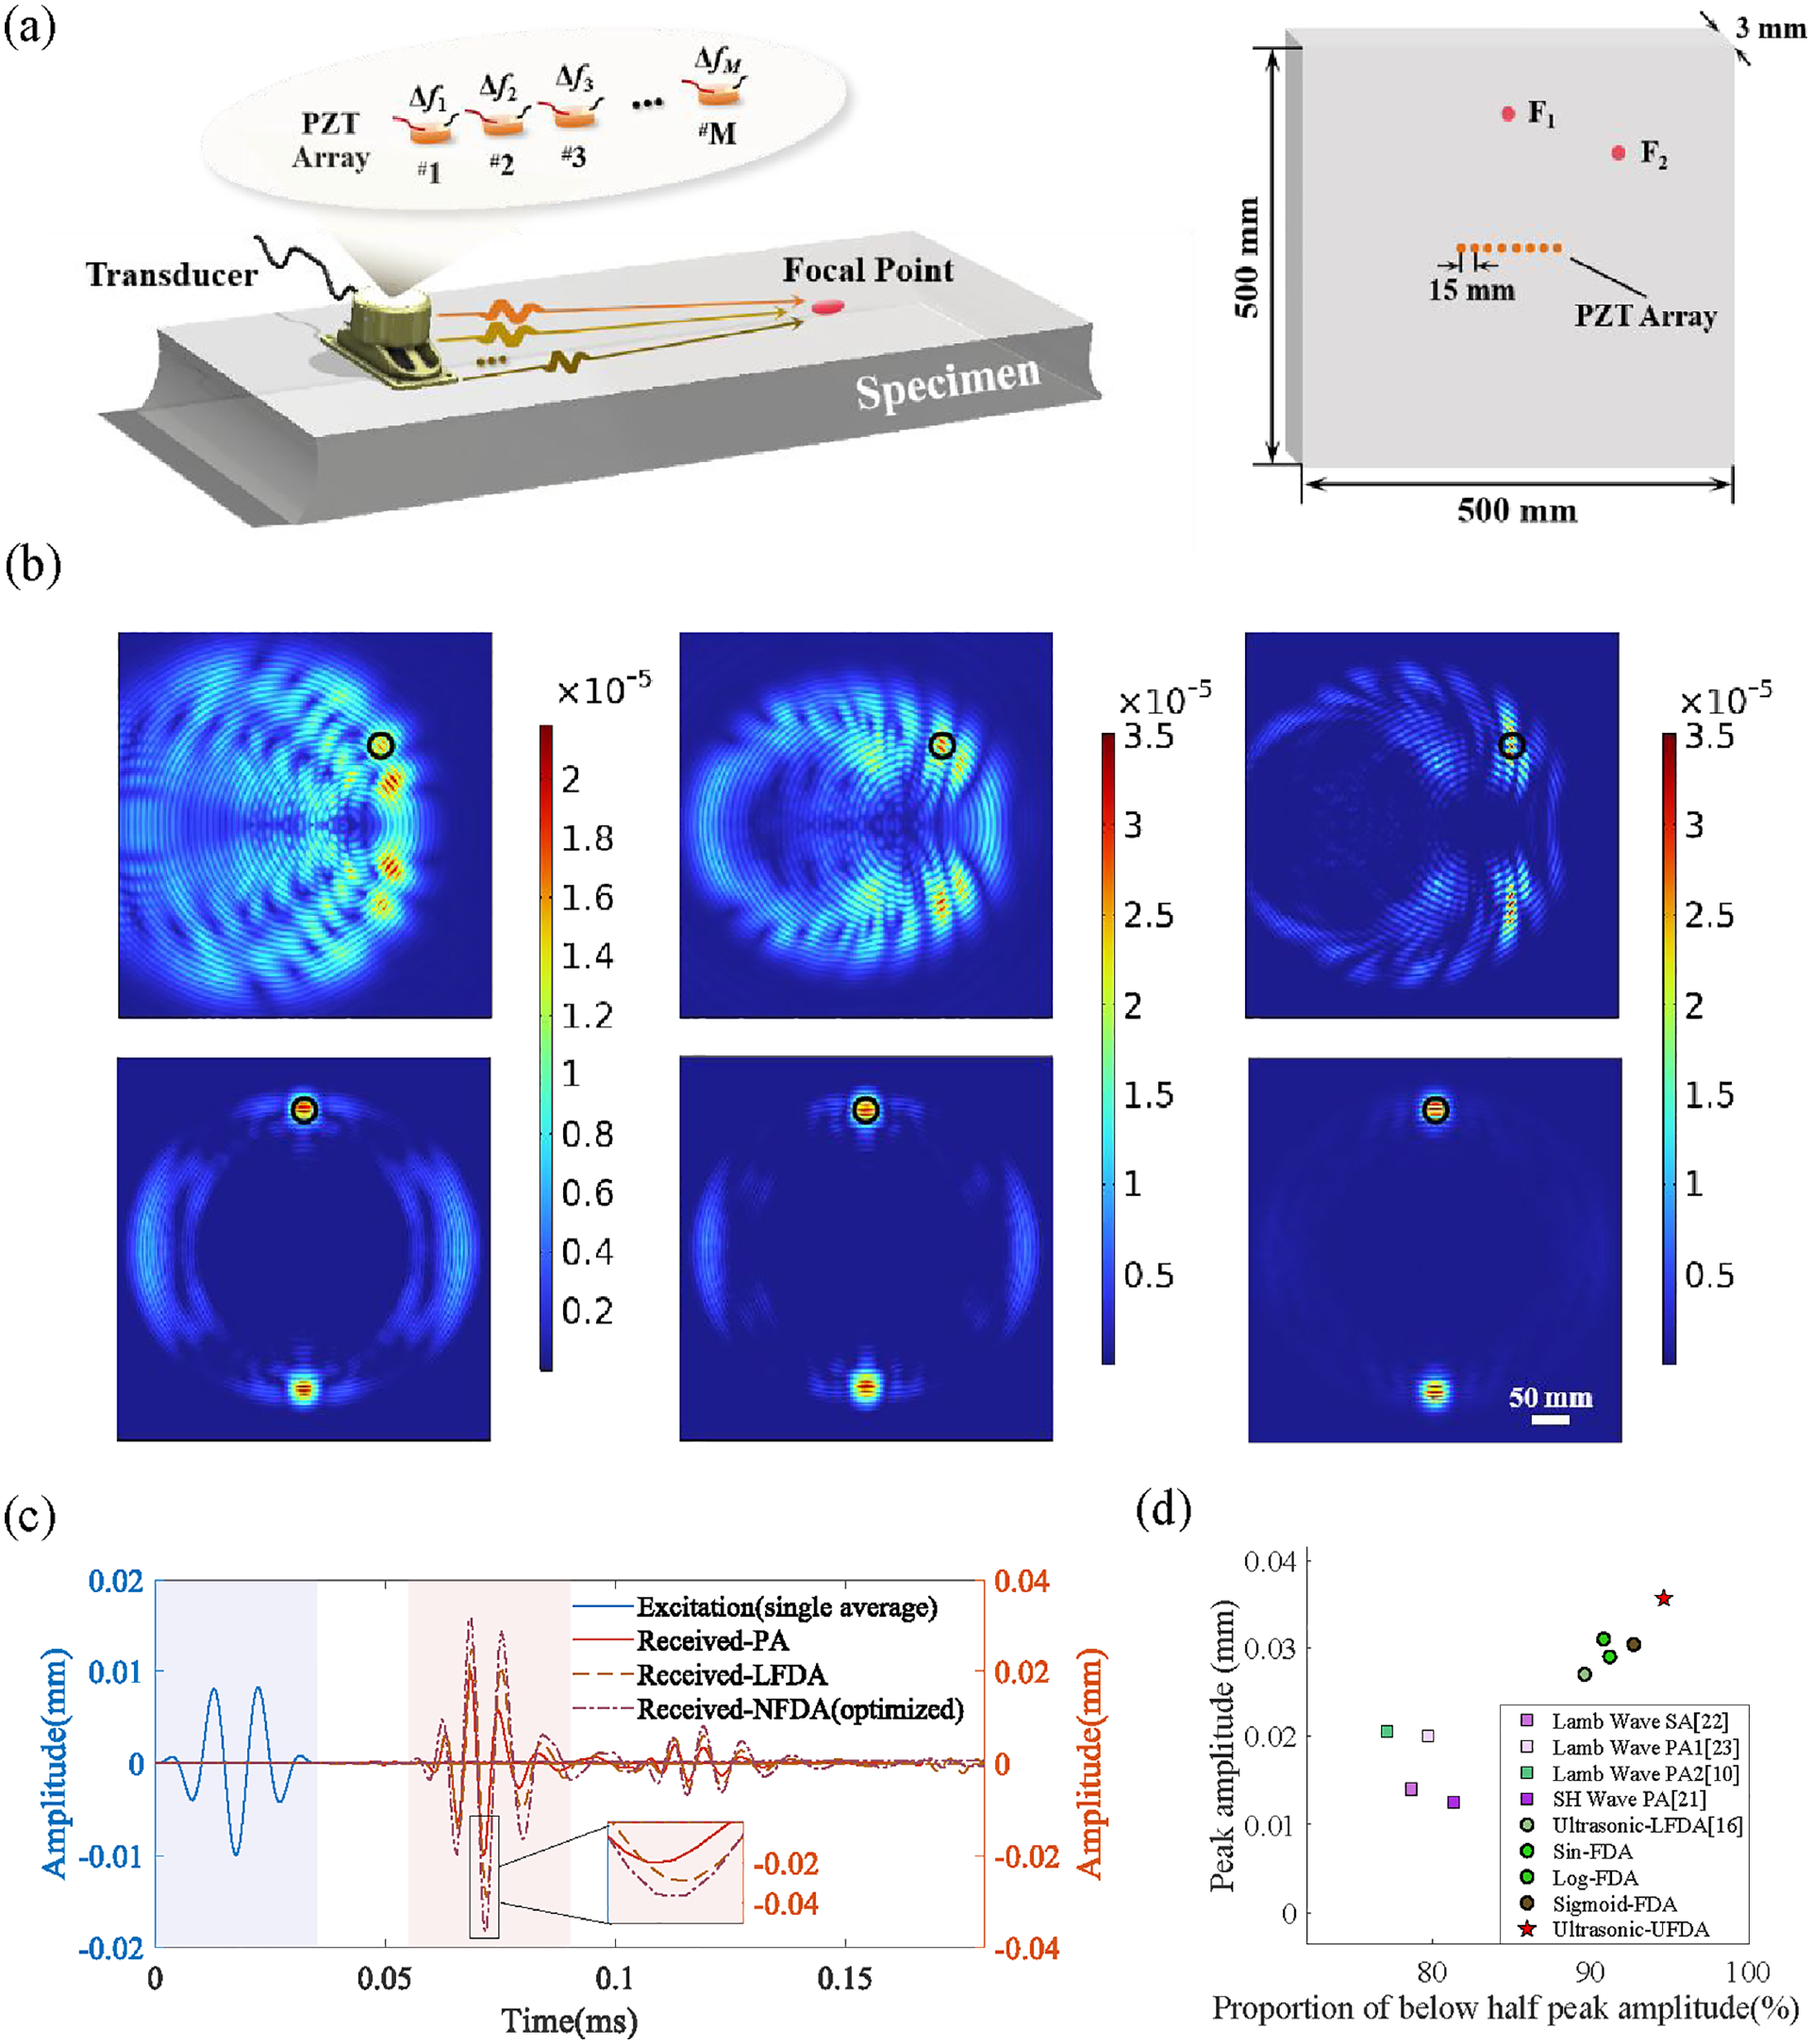
FE simulation case diagram: (a) FDA detection scheme and FE model, (b) Wave pattern of PA, ultrasonic-LFDA, and ultrasonic-NFDA with focal points at F1 (106.1, 106.1) mm and F2 (180, 0) mm, respectively, (c) Signals captured in the time domain from the focusing cases of PA, ultrasonic-LFDA and ultrasonic-NFDA at postion F1 and (d) Amplitude and low-amplitude point proportion comparison between different focusing strategies.
The excitation signal of each element is a 3.5-period sinusoidal signal of the Hanning window envelope, which is excited by the displacement of a specified point with an amplitude of 0.01 mm. The mesh type was selected as a free tetrahedral mesh with a size 1/10 of the wavelength corresponding to the element with the highest excitation frequency within the array.
The wave field (displacement) is solved under the same average excitation frequency (100 kHz) but different strategies including PA, ultrasonic-LFDA (fbasic = 65 kH, Δf = 10 kHz), and ultrasonic-NFDA optimized based on sin-FDA (fbasic = 55 kH, Δf = 10 kHz, α = 3.368, β = 0.360). Due to the characteristic of lower transmitting speed and higher amplitude of A0 mode in this scenario, a wave packet of A0 mode is chosen for beamforming. The results are shown in Figure 5(b)’s left, middle, and right pattern, while the first and second rows are of focal points F1 and F2, which are circled black. The wave field simulation results in face direction indicate that the focused wave packet of the PA encompasses multiple regions simultaneously, resulting in relatively dispersed energy throughout the entire field. In contrast, the focused wave field of ultrasonic-LFDA is more concentrated. This observation aligns with the theoretical derivation and numerical results discussed in earlier sections. The phenomenon may be attributed to the fact that different excitation frequencies yield varying wave velocities for both beamforming and non-beamforming modes, rendering the designed time delay effective only for the wave packet of the targeted beamforming mode. Compared to the previous two methods, the optimized ultrasonic-NFDA exhibits a more concentrated focus area at the focal point, indicating its stronger advantage in actual defect detection.
After all cases are evaluated, the temporal signal of F1 in focusing mode of PA, ultrasonic-LFDA and ultrasonic-NFDA is captured and shown as an example in Figure 5(c). For the purpose of detailed comparative analysis, the waveform corresponding to the average excitation frequency is also presented, represented by the blue curve. In an ideal scenario without damping, the excitation peak amplitude of each array element is 0.01 mm, resulting in a combined amplitude of 8 × 0.01 = 0.08 mm at the focal point. However, due to damping effects and the viscoelastic properties within the system, the wave will experience attenuation upon reaching the focus, leading to interference. Therefore, maximizing the peak amplitude at the focus through effective focusing strategies is a critical criterion for evaluating the quality of these strategies. The captured temporal data in Figure 5(c) illustrates that the time-domain signals generated by the three focusing strategies are similar. However, in terms of amplitude, ultrasonic-NFDA exhibits greater advantages than both ultrasonic-LFDA and PA, as the energy at the moment t f is the highest.
To further compare the performance of the proposed ultrasonic-NFDA and other existing strategies, the same simulation setup is used for multiple computations. The SH wave PA, 21 the Lamb wave sparse array, 22 the Lamb wave compact array, 10 the Lamb wave PA, 23 the ultrasonic-LFDA, 16 the NFDA based on sine, log, and sigmoid function (with αk = 2, βk = 0.4), respectively, and the proposed ultrasonic-NFDA. In order to get a more indexed evaluation result, we have designed the evaluation criteria in two dimensions: (1) peak amplitude at the focal point and (2) proportion of grid points of which the amplitude is below half peak amplitude at t f . The former indicator reflects the effectiveness of focusing energy at the target point, while the latter indicator describes the ability to inhibit energy concentration at nonrelevant sites.
Figure 5(d) reveals the respective performance of the above works. In the figure, the vertical axis represents the peak amplitude, while the horizontal axis indicates the proportion of points with low amplitude. The results of the PA series are in the lower left quadrant, whereas the results of the FDA series—particularly the ultrasonic-NFDA method proposed in this article—are skewed toward the upper right quadrant. This observation demonstrates the superiority of the proposed focusing strategy in energy concentration.
Experimental validation
Experiment setups
In this section, an experiment is conducted to verify the effectiveness and applicability of the proposed method. The experimental setup is depicted in Figure 6. The system is composed of NI PXIe-1085 chassis unit, NI controller PXIe-8840 express card, NI PXIe-5413 arbitrary waveform generator, NI PXI-6115 acquisition card, NI BNC-211B screw terminal block, and ATA-4000 amplifier. A 1061 aluminum alloy plate of 500 mm in length and width and 3 mm in thickness was selected as the experimental sample.
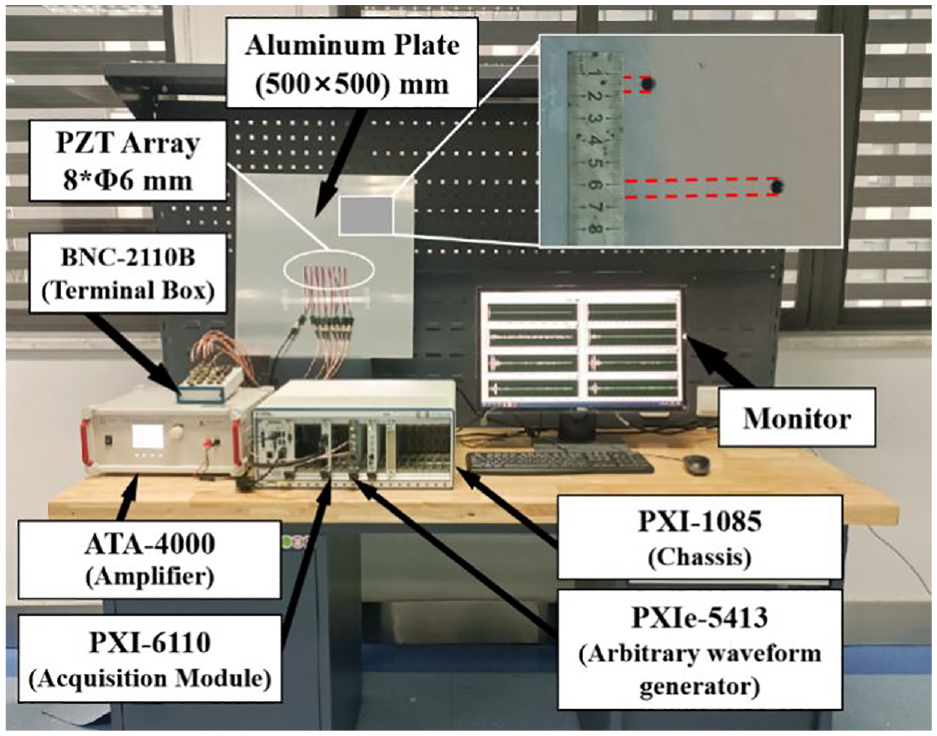
Layout of test bench.
A unit step signal with a duration of 1.25 ms, featuring a rise time of 0.15 ms, is generated using an arbitrary waveform generator. Subsequently, the signals are amplified by the power amplifier and applied alternately to the PZTs positioned on the surface of the sample. Signal acquisition is conducted using the pitch-catch technique. Each acquisition process is configured for 5000 sampling points at a sampling frequency of 4 MHz.
The dataset comprises a defective condition and an intact condition. The intact condition contains two penetrating defects to be detected, which are located at D1 (110, 145) mm and D2 (165, 85) mm, respectively. The defects were round and 5 mm in diameter.
Experiment measurement
To get a clear contrast of intact signal and defected signal, the step response signals collected is first transferred into sinusoidal modulation response using the frequency response function (FRF) method. 11 The process can be represented by the following formula,
in which H(ω) is the FRF, j is the imaginary number unit, ω is angular frequency, φ(t) is the unit pulse response, and Uφ(ω) is the unit step response. After the FRF is measured, the measurement of sinusoidal modulation response can be obtained by

in which U(ω) is the desired frequency response under pre-designed excitation F(ω). The corresponding time-domain response, U(t), can be derived through the application of the Inverse Fourier Transform. By adopting this method, the problem of multi-excitation frequency between different channels can be solved in a post-processing way. Figure 7(a) and (b) shows the dispersion curve of testing plate. In this diagram, the red dashed line denotes the anti-symmetric mode, while the black solid line indicates the symmetric mode. The group velocity of the S0 mode is more than two times faster than that of the A0 mode during 20–300 kHz. Meanwhile, according to the simulation results and previous research by other scholars, 24 the wave amplitude of S0 mode in this range of frequency is obviously lower than that of A0 mode. Figure 7(c) shows the step response signal excited by PZT #6 and received by PZT #2. A virtual excitation signal with a center frequency of 100 kHz is selected, and the soft measured response calculated by FRF method is shown in Figure 7(d), where the direct wave, damage-reflected wave, and boundary-reflected wave packets are determined through time-of-flight (ToF) analysis.
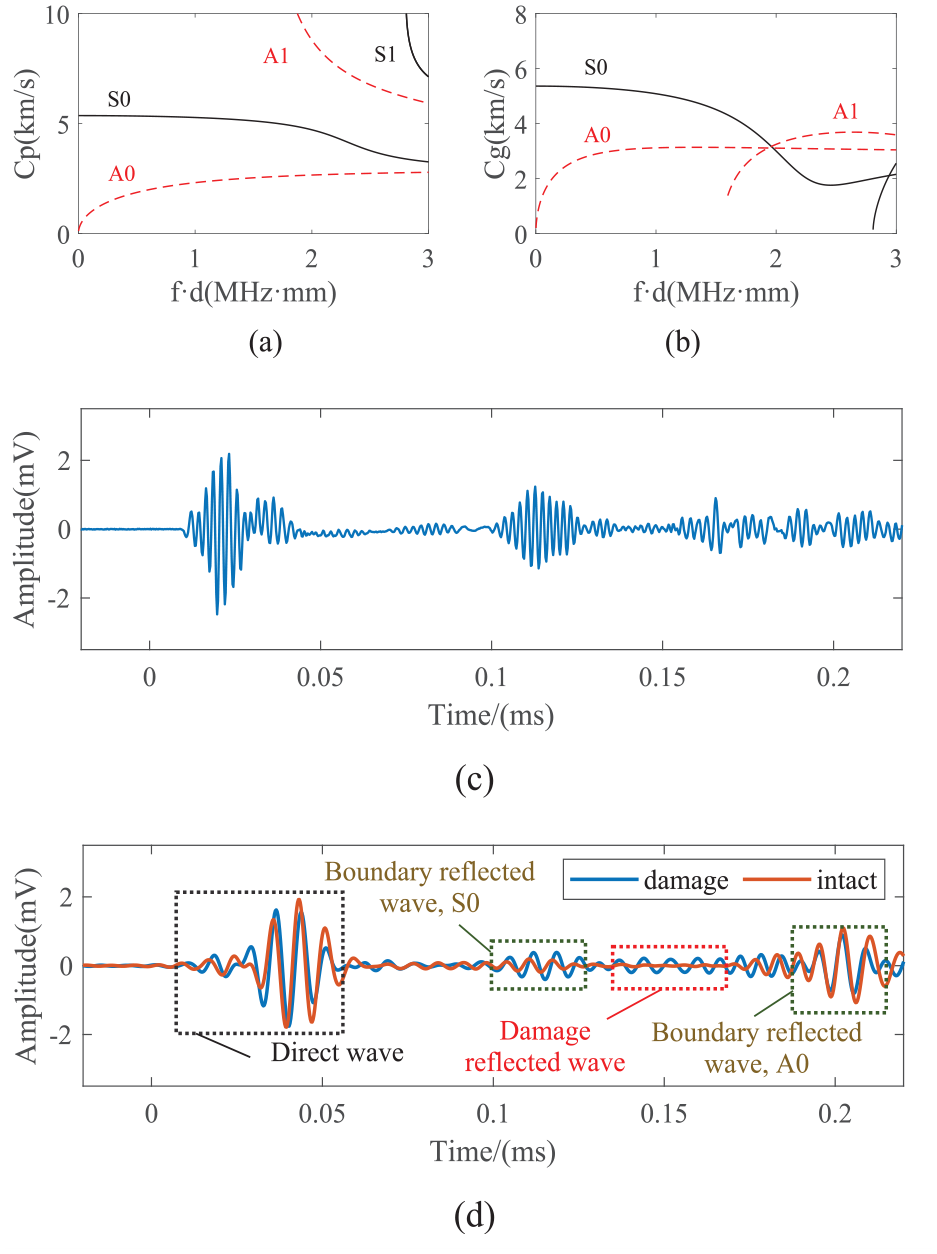
Frequency dispersion curve and signal examples of 1061 aluminum alloy plate of 3 mm in thickness: (a) phase velocity, (b) group velocity, (c) step response signal acquired, and (d) soft measurement signal acquired given a 100-kHz sinusoidal excitation.
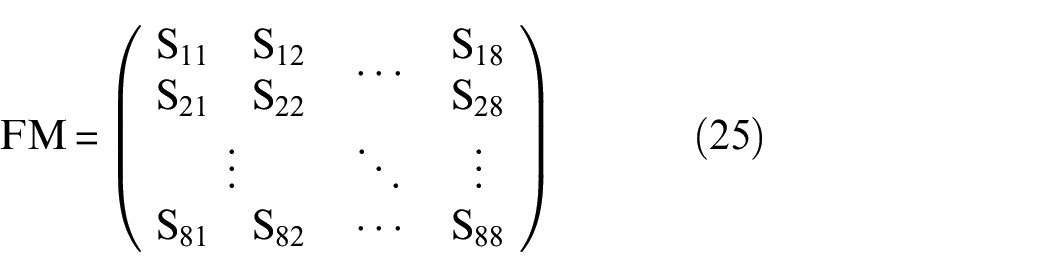
To obtain imaging results, the full matrix capture (FMC) method is adopted. 7 Every element in an 8-PZT array acts as a transmitter and receiver in turn. This process involves the following steps: (1) Each element in the array emits an excitation signal sequentially. (2) All elements receive the echoes from each transmission. The result is a matrix of time-domain signals, where each row corresponds to a different transmitting element and each column corresponds to a receiving element. The resulting FMC matrix consists of eight rows and eight columns, where each entry represents the received signal from the corresponding transmitter-receiver pair. Assuming S ij is the signal received by ith PZT when jth PZT transmits. The FMC matrix (FM) for an 8-PZT array can be described as
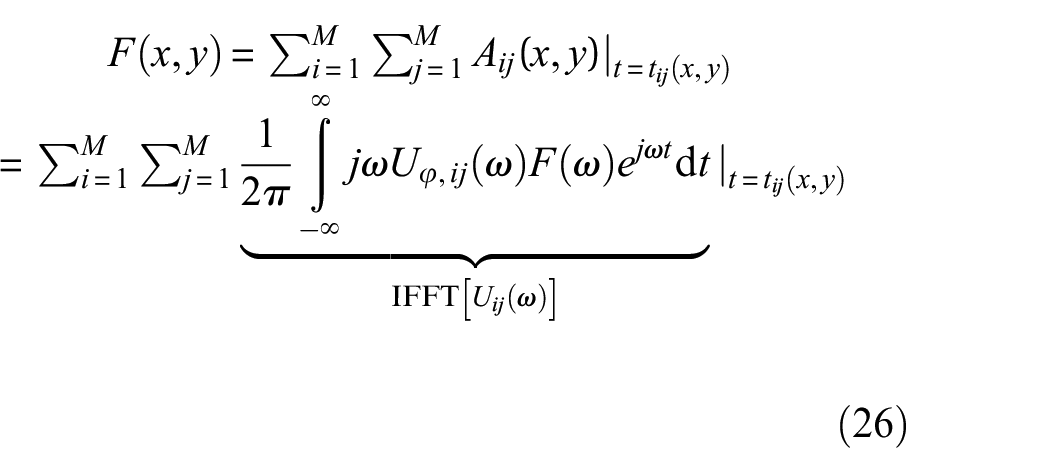
The total focusing method (TFM) is then used as a post-processing technique that uses the data captured through FMC to produce a high-resolution image of the inspection area, as illustrated in Figure 8, where
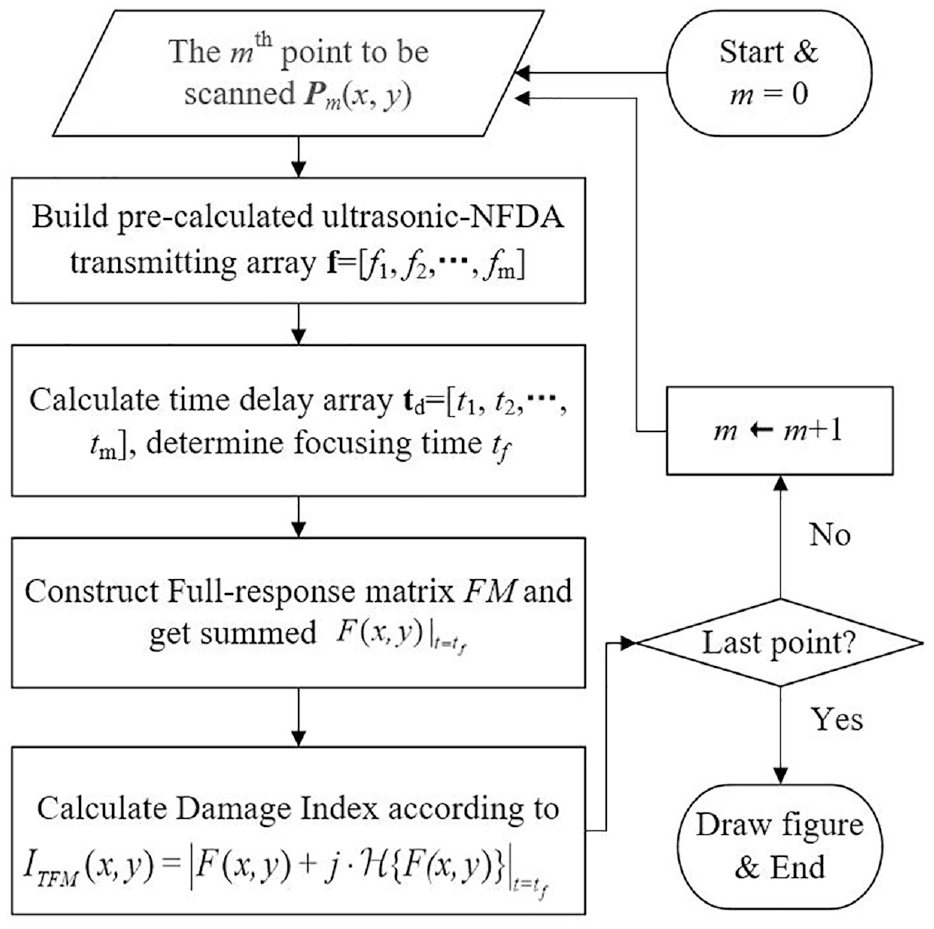
Flowchart of damage index construction.
Results and discussions
Firstly, one of the targeted points D1 (110, 145) is highlighted and its domain signal with and without defect is concerned in order to further evaluate the focusing effect of ultrasonic-LFDA and NFDA at the waveform level. Figure 9(a) and (c) show the summed signals and their Hilbert envelope of intact condition, in which no obvious signal exists around focusing time. Figure 9(b) and (d) show the same combination but under the defect condition using ultrasonic-LFDA and sin-FDA, respectively. Both figures can be found in distinct wave packets that appear around the focusing time. Centered on tf, the wave packet length extends in both directions to the points where the envelope gradient is zero (highlighted in green). It can be found that the wave packet length under sin-FDA with the same excitation frequency is significantly smaller than that of ultrasonic-LFDA, which means that the former better concentrates the energy on the moment of focus.
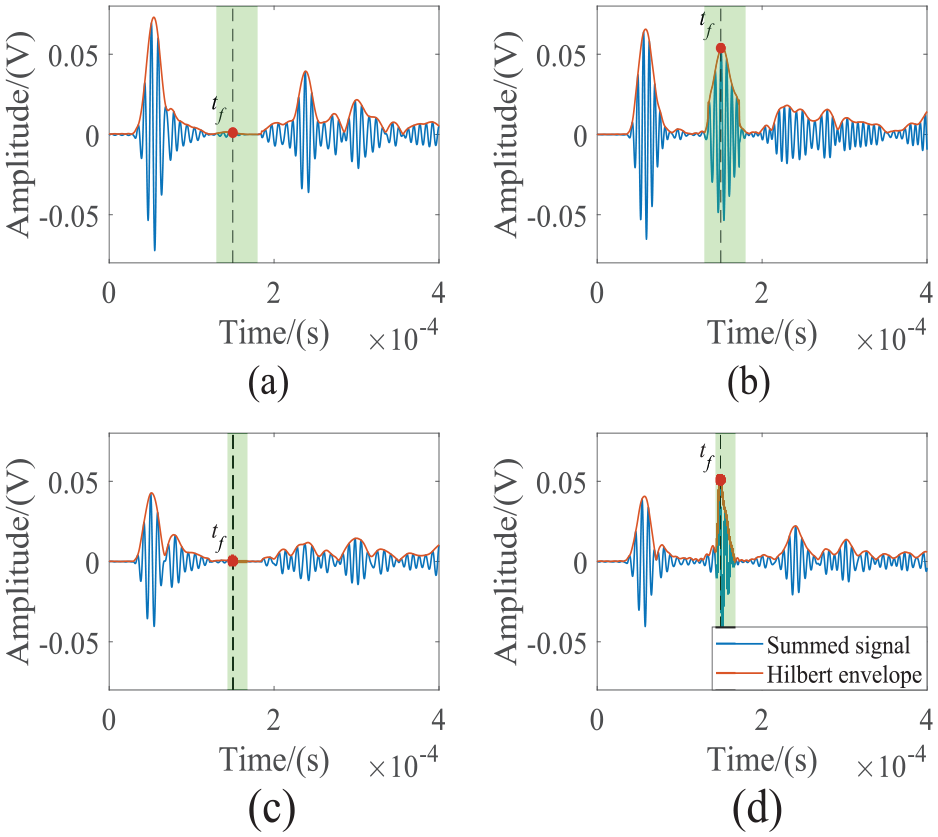
Summed signals at the intact condition (a), (c) and the defect condition (b), (d) at point D1 (110, 145) from: (a) and (b) ultrasonic-LFDA, (c) and (d) sin-FDA.
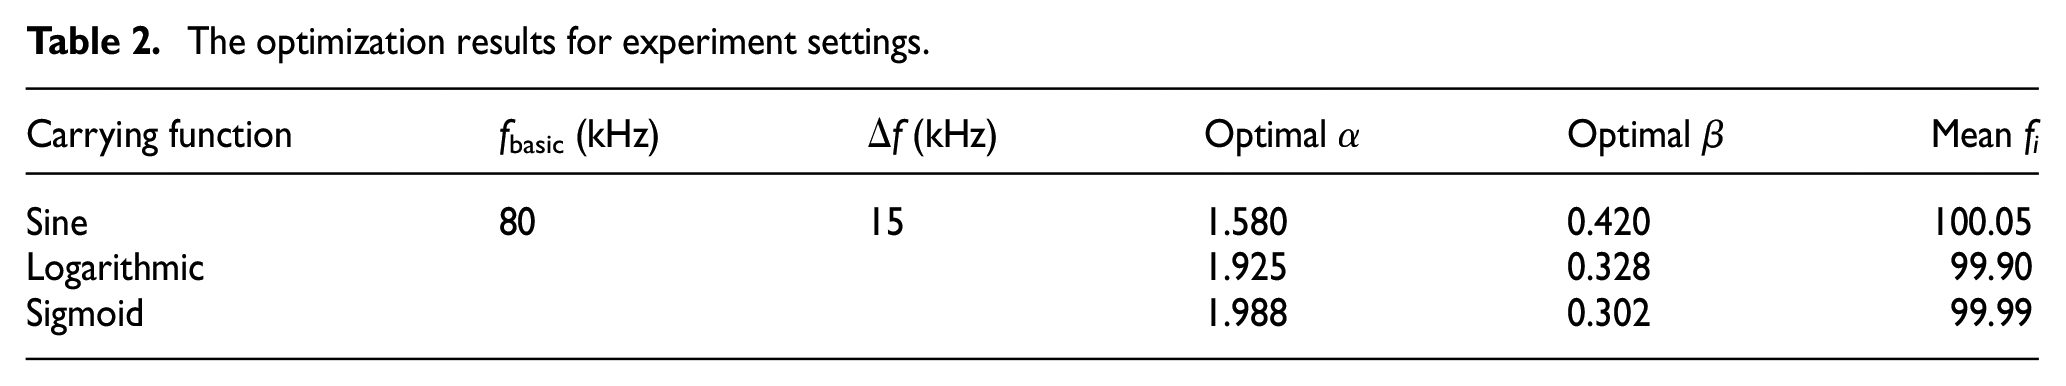
For further evaluation, the imaging results under different methods but similar mean excitation frequencies are compared. For fair comparison and better discussion, the damage images are displayed in dB with the dynamic range of [−2, 0] dB in this article. Firstly, the nonfrequency offset array (PA) imaging is acquired as Figure 10(a). At the excitation frequency of 100 kHz, the corresponding image spot appears at the damage position (highlighted by white cycle). How-ever, the size of the image does not correspond to the actual damage, and artifacts appear in irrelevant areas of the image. Then, the ultrasonic-LFDA of fbasic = 82.5 and 65 kHz, Δf = 5 and 10 kHz are deployed and their images are shown in Figure 10(b) and (c). It can be found that the same problem occurs in ultrasonic-LFDA, but the artifact problem is alleviated when the frequency offset is set larger. Subsequently, the unoptimized NFDA of sin-FDA (fbasic = 95 kHz, Δf = 25 kHz, α = 0 and β = 0.25), log-FDA (fbasic = 95 kHz, Δf = 15 kHz, α = 0 and β=0.1), and sigmoid-FDA (fbasic = 95 kHz, Δf = 8 kHz, α = 0 and β = 0.1) are deployed, and their images are shown in Figure 10(d) to (f), respectively. These images acquired by NFDA display roughly the correct location of the lesion but too large image spots, indicating significant range-angle coupling. Thus, in images of sigmoid-FDA, and sin-FDA, several spots appear at the nonlesioned location. Finally, these NFDA methods are optimized using the MODE algorithm, of which the images are shown in Figure 10(g) to (i), and the optimization results are shown in Table 2. All three image spots are significantly narrowed, indicating better focusing around the focal point. The optimized patterns, particularly for sin-FDA in Figure 10(i), demonstrate improved clarity and eliminate the artifacts, enhancing the focusing precision, thus validating the effectiveness of the proposed optimization method.
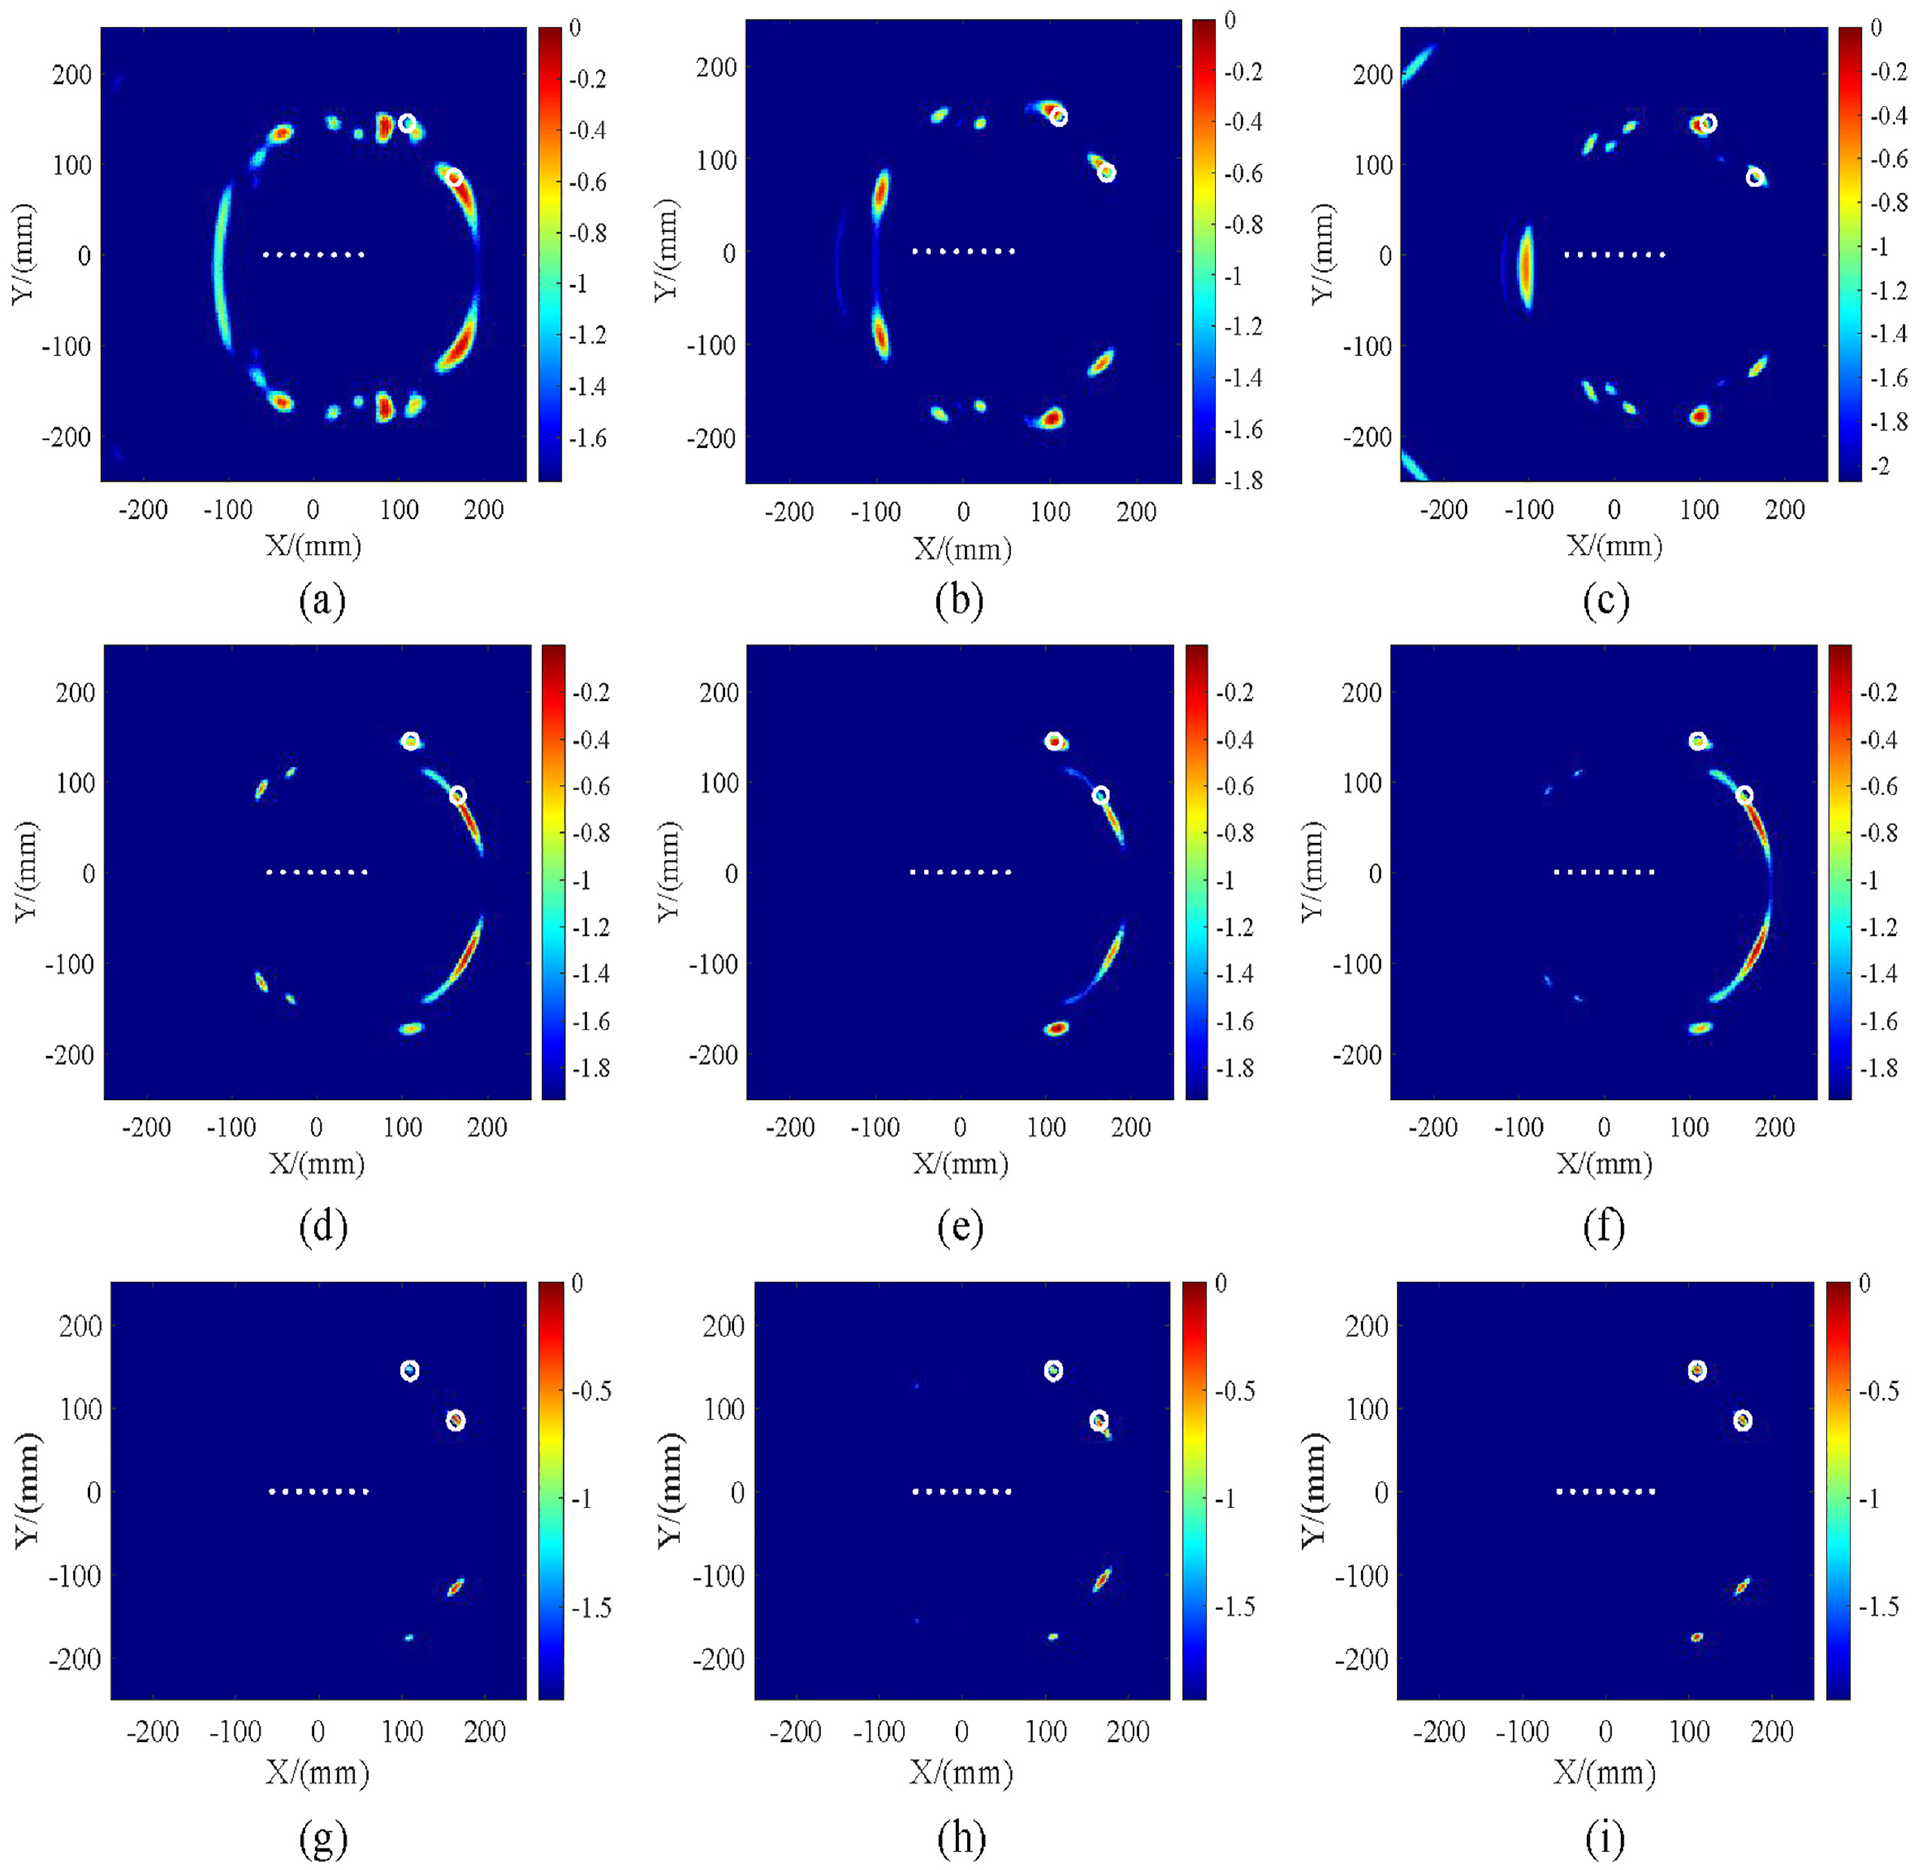
Damage images excited by 5-cycle tone burst with (a) PA of f = 100 kHz, (b) ultrasonic-LFDA of fbasic = 82.5 kHz and Δf = 5 kHz, (c) ultrasonic-LFDA of fbasic = 65 kHz and Δf = 10 kHz, (d) sin-FDA of fbasic = 95 kHz, Δf = 25 kHz, α = 0 and β = 0.25, (e) log-FDA of fbasic = 95 kHz, Δf = 15 kHz, α = 0 and β = 0.1, (f) sigmoid-FDA of fbasic = 95 kHz, Δf = 8 kHz, α = 0 and β = 0.1, and (g–i) of optimized sin-FDA, log-FDA and sigmoid-FDA, respectively.
The optimization results for experiment settings.
Conclusion
This article introduces a novel approach to ultrasonic testing by developing the ultrasonic-NFDA with nonuniform frequency offsets. By addressing the inherent challenges of omnidirectional wave propagation and nonfocus energy loss, the ultrasonic-NFDA method demonstrates significant advancements over traditional PA and ultrasonic-LFDA techniques.
Through the integration of nonlinear frequency offsets and the application of the MODE algorithm for parameter optimization, the ultrasonic-NFDA effectively decouples the range-angle beampattern and enhances the SINR. Numerical evaluations and simulations confirm the superior performance of ultrasonic-NFDA in terms of PSLL and HPBW, compared to ultrasonic-LFDA and PA methods.
Experimental validations further demonstrate the practical applicability of ultrasonic-NFDA in real-world ultrasonic testing scenarios. The proposed method not only improves defect detection and imaging clarity but also reduces artifacts, thereby enhancing the precision of defect localization. The optimized beampatterns achieved through ultrasonic-NFDA provide a robust solution for more accurate and efficient array inspection methodologies in NDT and SHM.
Overall, the ultrasonic-NFDA with nonlinear frequency offsets presents a significant leap forward in ultrasonic testing technology, offering enhanced energy concentration, improved detection accuracy, and greater operational efficiency. Future work will explore the scalability of this approach and its application to a broader range of ultrasonic testing environments.
Footnotes
Appendix 1
Appendix 2
Declaration of conflicting interests
The author(s) declared no potential conflicts of interest with respect to the research, authorship, and/or publication of this article.
Funding
The author(s) disclosed receipt of the following financial support for the research, authorship, and/or publication of this article: This work was supported by the National Natural Science Foundation of China (Grant No. 52175104), The sixth “333 Talents” Training Support Project of Jiangsu Province.