
Abstract
This study utilizes the linear and nonlinear features of guided waves (GWs) for detecting and evaluating heat damage in reinforced concrete (RC) beams. The RC beams with embedded sensors attached at rebar ends are experimentally studied using longitudinal GW at 200 kHz after heating the specimens in a furnace from 100°C to 300°C. For the studies investigating the effect of heat damage on the RC beams beyond 300°C, the rebar ends are exposed outside the concrete so that the longitudinal transducers can be attached there. These specimens are then experimentally studied using GW with an excitation frequency of 100 kHz. In this study, the RC beams are prepared as fully bonded and debonded specimens. The experimental study shows that heat damage in the RC beams causes debonding between rebar and concrete enabling GW signal to generate second harmonics. The experimental study also discussed the linear features of GW, which shows that the amplitude of the GW signal increases with elevated temperatures in the RC beams. To distinguish material nonlinearity and contact nonlinearity, two types of nonlinear parameters are defined in this study. The nonlinear parameter due to the contact acoustic nonlinearity effect in the RC beams is defined as β, whereas the nonlinear parameter due to material nonlinearity is defined as β m . The study shows that β m is negligible in comparison to β at relevant heated temperatures. With the increase in temperature, the nonlinear parameter β is significantly increased at elevated temperatures. The peak amplitude of the nonlinear parameter β is observed at the maximum heated temperature 800°C for both bonded and debonded specimens.
Introduction
Reinforced concrete (RC) structures are subjected to various damages, such as debonding, delamination, corrosion, cracks, and defects which can lead to deterioration and affect the serviceability of the structure. In the worst case, it can lead to catastrophic failure. Many studies used nondestructive techniques to identify damages in RC structures. Linear and nonlinear guided waves (GWs) have been proven to be useful in detecting damage in RC structures. They can identify debonding and delamination in RC.1–6 GWs can also detect corrosion damages at steel rebars in RC beams.7,8 Lu et al. 9 and Mustapha et al. 10 studied damage in RC using GWs. Aseem and Ng 11 detected the debonding between steel rebar and concrete using nonlinear features of GWs. The presence of surface cracks and notched cracks were also detected using GWs.12,13
The studies focused on GWs in the literature are limited to damage detection at room temperature, at which the mechanical properties of steel and concrete do not deteriorate. These damages are studied by creating debonding, corrosion, cracks, and other defects. However, the temperature change can also affect the structural integrity of RC structures. Chang et al. 14 demonstrated the reduction in residual compressive strength, ultimate stress, and elastic modulus of concrete after heating the samples from 100°C to 600°C, where they tested the mechanical properties of concrete after each heating interval. Later, this phenomenon was well explained in. 15 At elevated temperatures, the water vapors are generated inside the concrete, and they tend to migrate to lower-pressure regions, that is, outside the concrete. Due to this activity, the generated pore pressure can develop cracks in concrete and result in spalling of concrete at high temperatures. It was shown that the relative compressive strength of ordinary concrete reduced by 20%–30% after it is heated from 100°C to 300°C, and around 70% reduction when the temperature increases to 600°C. The splitting tensile strength is also reduced by 70% after heating the concrete to 600°C. Ozbolt et al. 16 also numerically showed the reduction in relative Young’s modulus, compressive strength and tensile strength of concrete from 100°C to 800°C. A sharp reduction of 80% in the mechanical properties of concrete is observed at 800°C. Ghazaly et al. 17 and Shamseldein et al. 18 also studied the reduction in bond strength of RC with heated temperature. With the reduction in mechanical properties, the serviceability of concrete structures is also affected. The flexural capacity of concrete beams is reduced by around 40% when they are heated up to 800°C.19,20 It showed the reduction in the compressive, tensile, and bending capacity of steel fiber-RC. The reduction in splitting tensile strength of concrete at elevated temperature reflects the reduction in the bond strength of the concrete. The reduction in bonding between rebar and concrete at increased temperature affects the integrity of the RC structure. The generation of debonding between rebar and concrete at heated temperatures can affect the serviceability and feasibility of the RC structure. If the RC structure is required to be made serviceable after fire or heat damage, it is necessary to investigate the debonding damage and condition of the concrete.
There were very limited studies in the literature focused on investigating the damage of RC beams subjected to heated damage using nondestructive testing. Monte et al. 21 used ground penetrating radar to study the development of water pore pressure in concrete subjected to heated temperature, which can result in the spalling of concrete. Ground penetrating radar has proven to be useful in detecting cracks or delamination in RC structures as studied by Miramini et al. 22 , Lee et al. 23 used the impact echo method to study heat-damaged slabs. The change in ultrasonic pulse velocity across the various depth of the slab can also predict the damage state. The velocity tends to be faster at a distance further from the exposed heated surface of the slab, whereas the ultrasonic pulse velocity is lowest at the heated face. Similarly, acoustic emission (AE) energy has been used by Xargay et al. 24 to determine the damage state of high-strength concrete (HSC) and HSC with fiber-reinforced. The study shows the increase in AE energy with the elevated temperature for HSC samples. Chobola et al. 25 have demonstrated the use of nonlinear ultrasonic spectroscopy to study concrete nonlinearity subjected to heat damage. For heated samples, the nonharmonics are increased because of concrete material nonlinearity at elevated temperatures. Aseem et al. 26 investigated the fire-damaged RC building using an ultrasonic pulse velocity test and a conventional rebound hammer test. With the reduction in concrete core compressive strength of fire damaged structural members, the ultrasonic pulse velocity is also reduced.
Therefore, the above studies reflect the material degradation of fire-damaged concrete using various nondestructive techniques. It is noted that mechanical properties, such as flexural, compressive, and tensile strength of heat-damaged concrete, are also reduced. However, these studies have not investigated the degradation in bonding between steel rebar and concrete of fire-damaged RC beams. The presence of debonding can significantly reduce the flexural and shear strength of the RC structure. The serviceability of the RC structure is reduced due to the generation of debonding damage. Due to debonding between steel rebar and concrete, contact surfaces are generated at the interfaces of steel and concrete. These contact surfaces can generate higher harmonics as discussed by Solodov et al. 27
This article first investigates the effect of heat damaged specimens on bonding between steel rebar and concrete using linear and nonlinear longitudinal GWs, and then uses them to detect and evaluate the heat damage. In section “Methodology,” the methodology is discussed for detecting heat damage using linear and nonlinear features. The ability of nonlinear features to detect debonding or contact-type damage is explained. In section “Experimental study,” an experimental study is discussed, and experimental case studies are defined for bonded and debonded RC specimens at heated temperatures. Section “Results and discussions” discusses the results obtained from experimental case studies. The heated temperature shows the generation of second harmonics in receiving the GW signal. The nonlinear parameter defined in section “Methodology” is then calculated for results obtained in the experimental case studies. In section “Conclusion,” a conclusion is derived for this experimental study.
Methodology
Linear and nonlinear GWs are used to detect damage due to elevated temperature in the RC beam. The linear features of GWs, such as time of arrival and amplitude of the longitudinal GW can give us an indication of the presence of damage. The nonlinear features, such as the generation of second or higher harmonics, are sensitive to heat damage.
For damage detection using longitudinal GWs in RC beams, piezoceramic transducers (PZTs) are attached at the cross-section of embedded rebar ends as shown in Figure 1. The longitudinal GWs are exited at one rebar and received at the other rebar end. At room temperature, the rebar in the intact sample is fully bonded with concrete. In the unheated RC beam, there is no indication of damage via GWs. When the beam is heated in the oven, the pore water pressure develops resulting in the generation of micro cracks. Due to the development of micro-cracks and the degradation of concrete material at elevated temperatures, the bonding between steel and concrete is depreciated. It can cause debonding between steel rebar and concrete surfaces. The debonding behaves as contact surfaces for propagating longitudinal GWs in embedded rebar. The generation of second harmonics due to contact nonlinearity is explained in the literature. 27
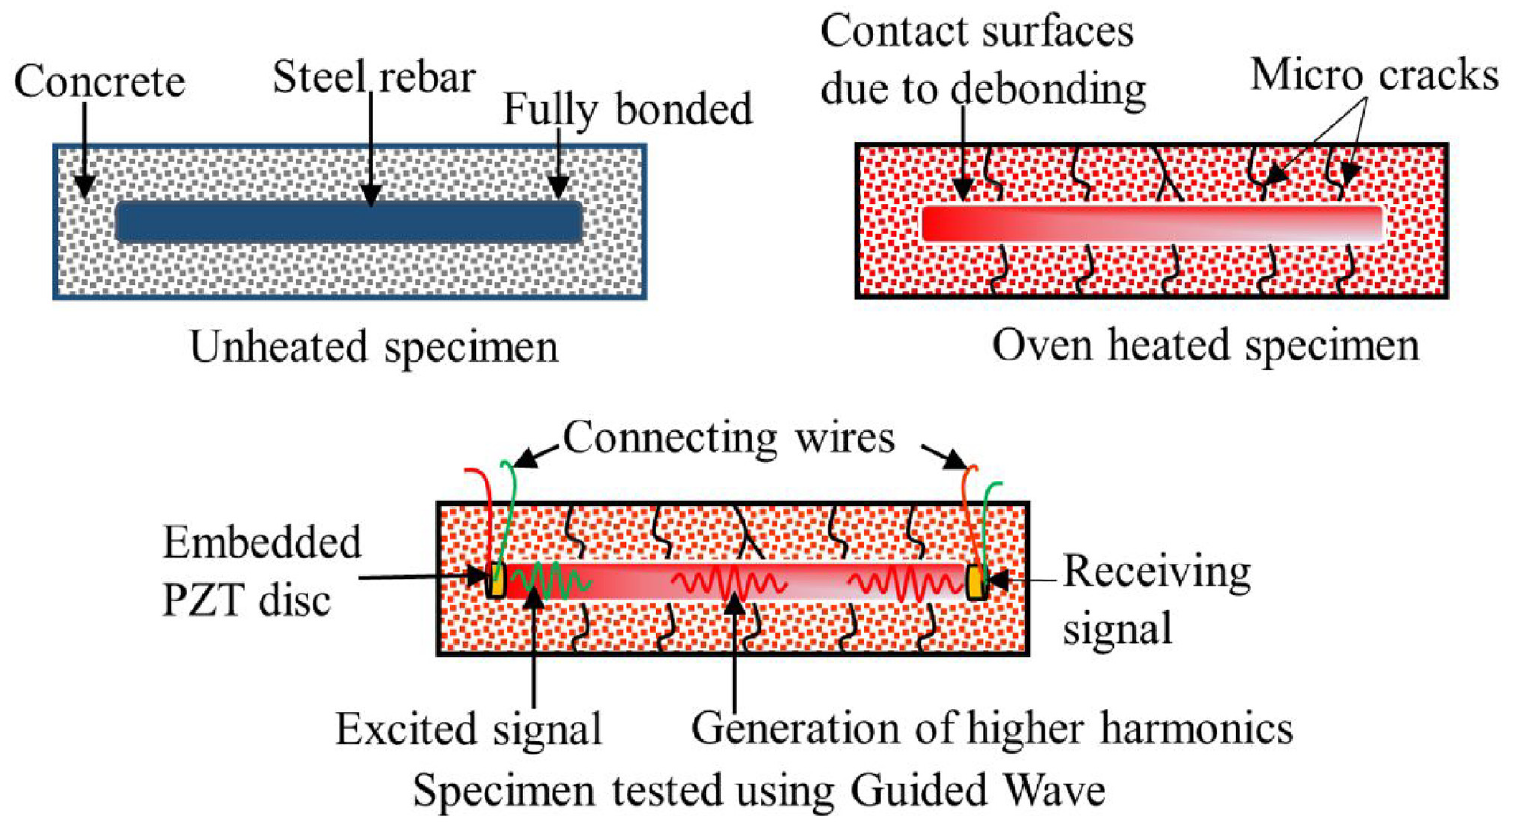
Heat damage detection using longitudinal guided waves in reinforced concrete beam.
RC beam with embedded rebar ends
In RC structures, steel rebars are embedded inside the concrete. If the structure is subjected to fire damage, the embedded rebars cannot be accessed for installing PZTs. To overcome this problem, PZTs are attached at rebar ends before casting the RC; hence, they are embedded in the specimens as shown in Figure 2. The RC beam with embedded rebar ends is referred to as specimen type 1 in this study. Fully bonded and debonded samples are monitored using linear and nonlinear GWs at elevated temperatures as shown in Figure 2(a) and (b). An artificial debonding is created between steel rebar and concrete as shown in Figure 2(b). The epoxy used to glue the PZTs to the rebar in this study has high temperature resistance, which is discussed in section “Experimental study.” The mechanical properties of piezoceramic material and epoxy change when the temperature is beyond 300°C; hence, specimen type 1 is heated up to 300°C in this study. PZTs have high sensitivity and are beneficial for studying the sensitivity of the nonlinear features of GWs. However, piezoelectric materials undergo thermal instability and degradation in piezoelectric and electromechanical properties beyond their curie temperature
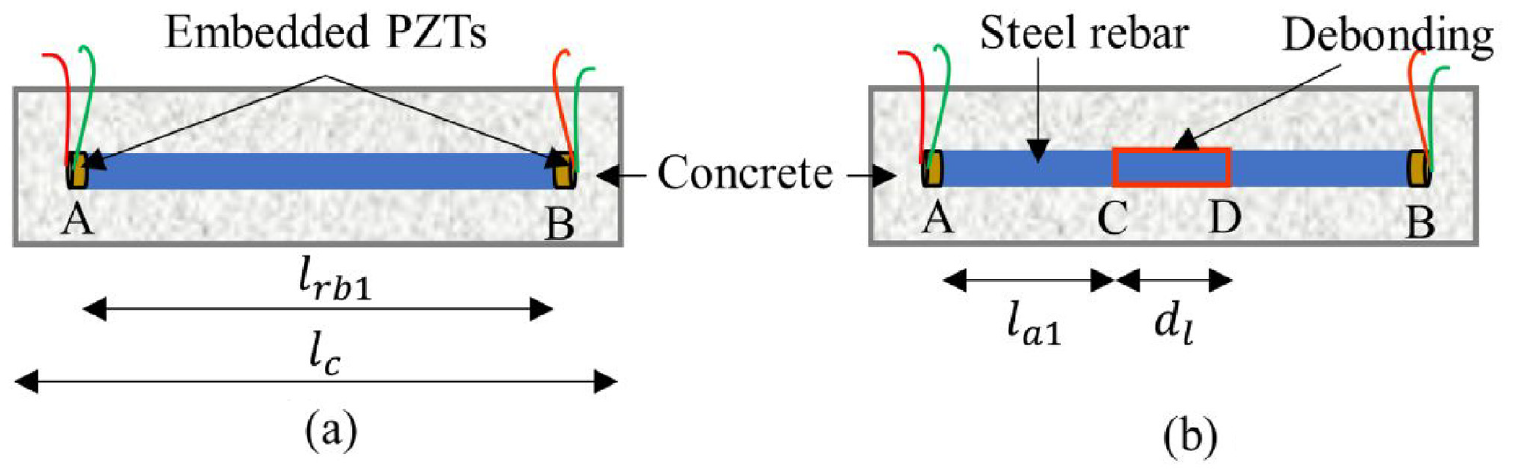
(a) Fully bonded and (b) debonded specimen with embedded rebar ends for heat damage study.
Considering this limitation of embedded PZTs at elevated temperatures, they are used to monitor the heat damage from room temperature to 300°C in this study. It should be noted that RC members in fire damaged structures can be exposed to higher temperatures, for example, 1000°C, as found in the literature. At higher elevated temperatures, the mechanical properties of RC members are deteriorated and can have a significant impact on the bonding of rebar and concrete. To study this damage effect by considering experimental constraints at elevated temperatures, the embedded rebar is exposed outside the concrete as discussed in the section below.
RC beam with exposed rebar ends
To monitor the heat damage beyond 300°C using the linear and nonlinear GWs, embedded rebars are exposed outside the concrete beam and are connected to longitudinal transducers. The transducers are attached to rebar ends after each heating interval to excite and receive GW signals as shown in Figure 3. Both bonded and debonded specimens are prepared for the RC beam with exposed rebar ends. The RC beam with exposed rebar ends is labeled as specimen type 2 in this study.
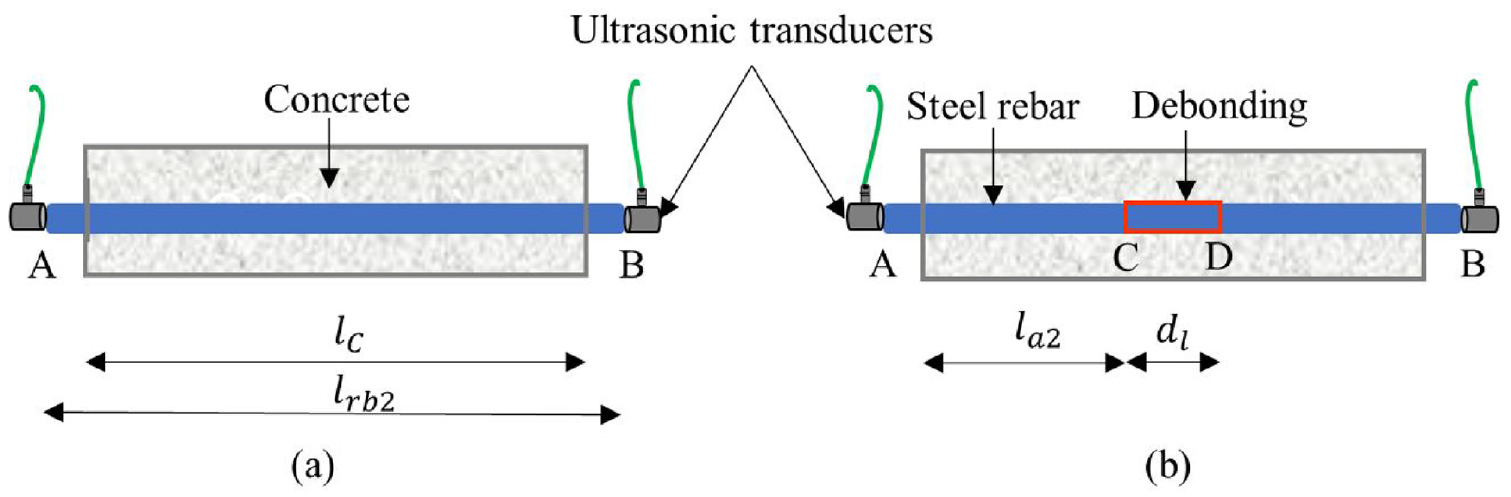
(a) Fully bonded and (b) debonded specimen with exposed rebar ends for heat damage study.
Linear and nonlinear features for heat damage detection
For the RC beam with rebar ends embedded inside the concrete as shown in Figure 2, the longitudinal GWs signal is excited at location A with PZT and received at location B with PZT. The time of arrival of the GW signal at location B for specimen type 1 can be written as:
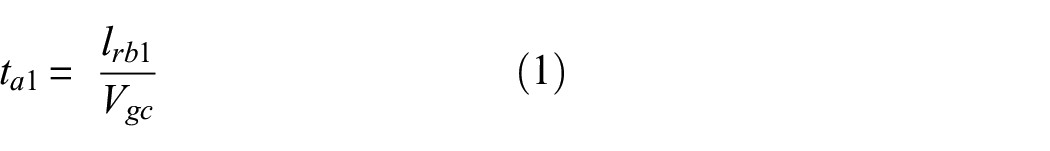
where
In exposed rebar specimen type 2 as shown in Figure 3, the longitudinal GWs are excited at exposed rebar end A with transducer and received at exposed rebar end B. For this specimen type 2, the time of arrival of the longitudinal GW can be written as:
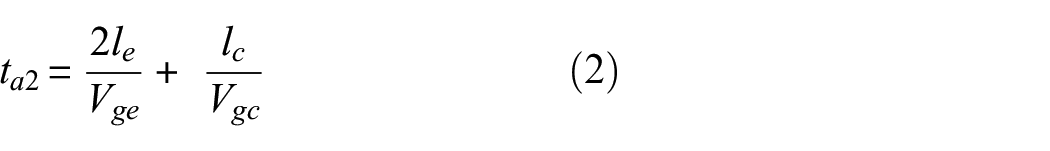
where
In addition to the linear features, the second harmonic, which is a nonlinear feature, is used in this study to detect heat and debonding damage. Due to the contact-type damage from heated samples, the second harmonics are received at the rebar end as shown in Figure 1. The nonlinear parameter

where
where
GW dispersion curves
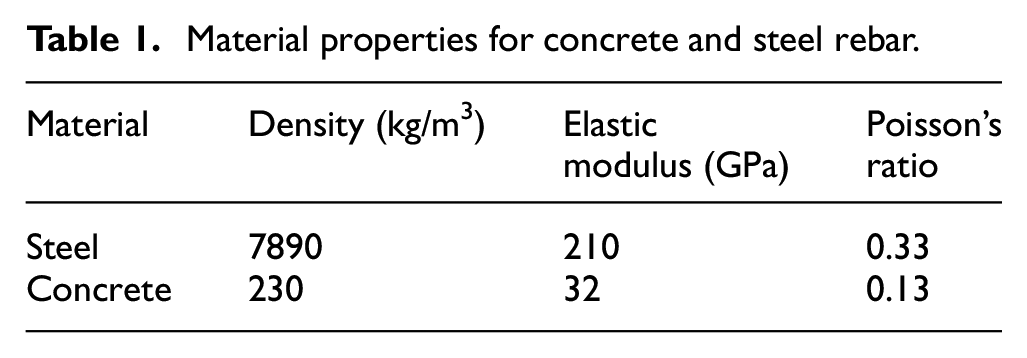
The study focuses on longitudinal GWs for heat damage detection in the rebar and RC beam. Longitudinal GWs are dispersive. There is a larger number of GW modes in embedded rebar than in bare rebar. Dispersion curves are plotted using DISPERSE software 30 to understand the presence of longitudinal GW modes in bare and embedded rebar as shown in Figure 4(a) and (b), respectively. A circular steel rebar of 24 mm diameter with material properties as shown in Table 1 is modeled in DISPERSE to trace the dispersion curve. 30 For rebar embedded in concrete, the cross-section of the beam is selected as 75 mm × 75 mm with 24 mm diameter circular rebar at the center. The outer concrete in the embedded rebar is defined as a radial feature to trace longitudinal GW modes.
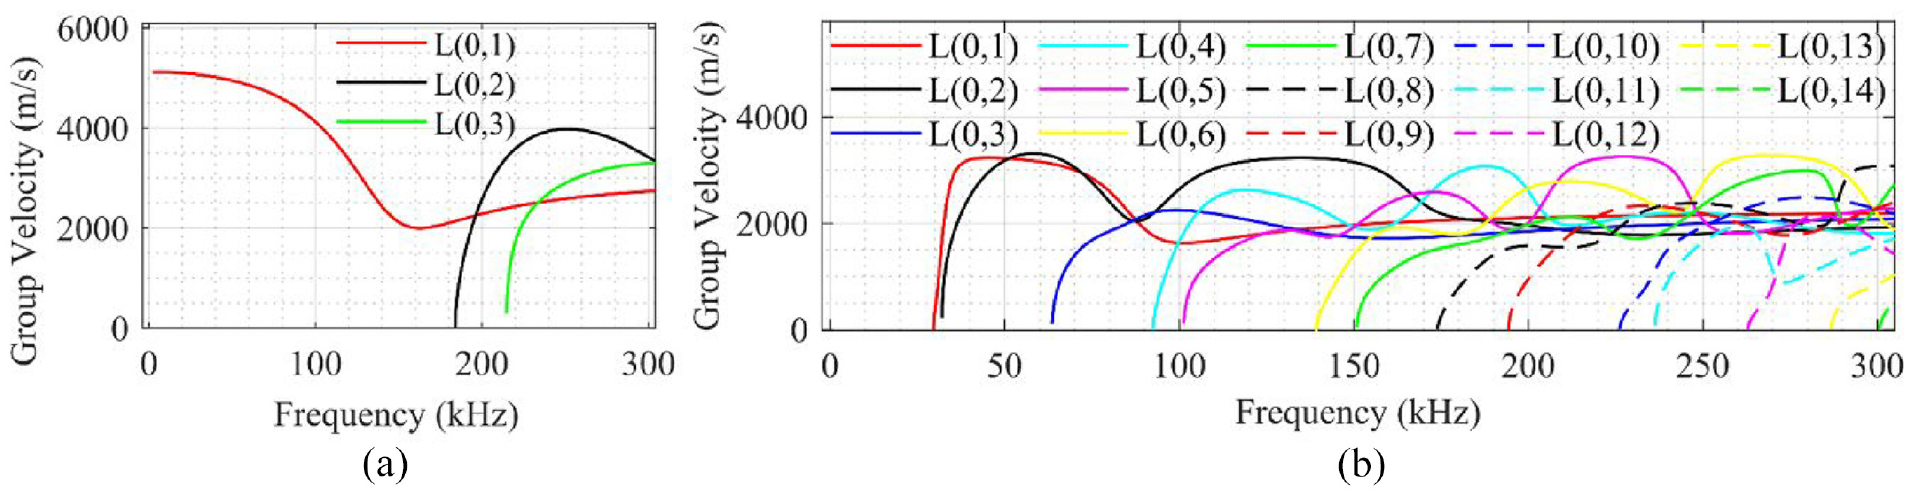
Longitudinal group velocity dispersion curve for (a) bare rebar and (b) reinforced concrete beam specimen.
Material properties for concrete and steel rebar.
Based on the dispersion curve, there are fewer longitudinal GW modes at lower frequencies, that is below 100 kHz. To avoid multiple longitudinal GW modes at a higher frequency, a low frequency is used in this study for the excitation of the GW signal. Considering the size of the specimen selected for this study, the excitation frequency cannot be below 50 kHz for longitudinal wave modes to propagate through the embedded and bare rebar. The experimental setup and case studies are discussed in section “Experimental study.”
Experimental study
The experimental study is carried out in this section to investigate the debonding in the RC beam due to heat damage. The bare rebar and specimen type 1 and 2 are subjected to heat damage at elevated temperatures. The bare rebar and specimens are tested using a GW signal at an undamaged state and after every heated elevated temperature.
Installation of PZTs for embedded rebar specimen
For the embedded rebar specimen, the PZTs are attached using high-temperature-resistant epoxy. Before carrying out the study for embedded rebar specimens, the propagation of longitudinal GW in bare rebar is studied to excite and receive GW signal using high temperature resistant epoxy. A plain steel rebar of 24 mm diameter having 300 mm length is used for the bare rebar and specimen type 1 study. PZTs are attached at the rebar ends as shown in Figure 5. As PZTs used in this study have an operating temperature of around 300°C with a curie temperate of 350°C, the bonding epoxy and electric wires must be suitable to work after being heated up to this temperature. The silver conductive epoxy resin generally used for bonding PZTs has an operating temperature of up to 90°C along with electric copper wires. To achieve an operating temperature of 300°C, Cotronics Duralco 4703 high-temperature epoxy resin is used to bond PZTs with rebar. This epoxy resin provides high bond strength with ceramics and high-temperature stability. As this resin has electrical resistivity and nonconductive properties, it cannot be used for bonding electric wires to PZT or rebar. For achieving electric current flow, silver conductive epoxy is used to attach the high temperature wires to PZT or rebar, which is then protected by high-temperature epoxy resin as shown in Figure 5. The high-temperature wires used in this study are ceramic fiber thermocouple cables, which can be heated up to 1200°C.
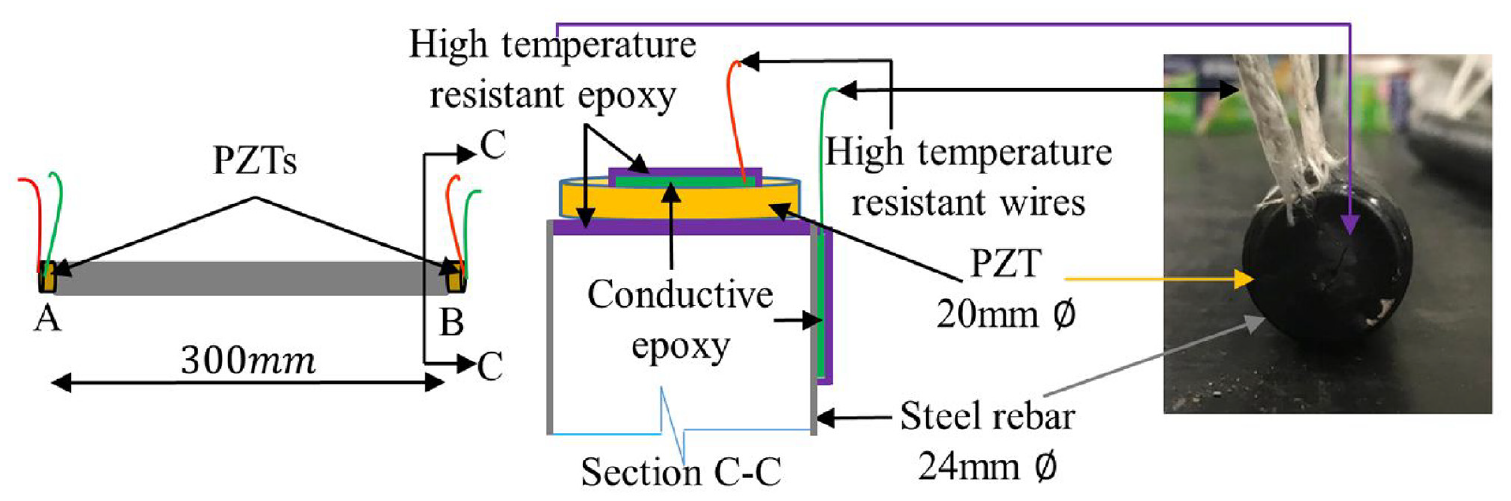
Installation of PZTs and high-temperature-resistant wires using epoxy at rebar ends for heat damage study.
Duralco 4703 is prepared by mixing resin and hardener, which is then cured as per the manufacturer specification and applied to the desired areas on PZTs and rebar as shown in Figure 5. After installation of PZTs to rebar ends, the bare rebar is tested for GW signal.
Experimental setup
A GW study is carried out using National Instrument (NI) PXIe 1073. The GW signal is generated using signal generator NI PXI 5412. The signal is amplified using CIPRIAN Amplifier, which is then excited using PZT for bare rebar and specimen type 1. After propagation of GW signal through bare or embedded rebar, it is received through NI PXI 5105. After initial testing of bare rebar and concrete beam specimens, they are heated at regular intervals in an electric furnace. Within each heated interval, the bare rebar and the specimen are tested for GW signal as shown in Figure 6. The bare rebar and specimens are uniformly heated at the rate of 10°C/min to reach every heated interval before GW testing. The heated intervals range from 100°C to 300°C for specimen type 1 and 100°C to 800°C for bare rebar and specimen type 2. When the temperature at the heated interval is obtained, it is maintained for 2 h before cooling it down to 100°C at 10°C/min. The chamber door is then opened to cool the specimen at ambient temperature.
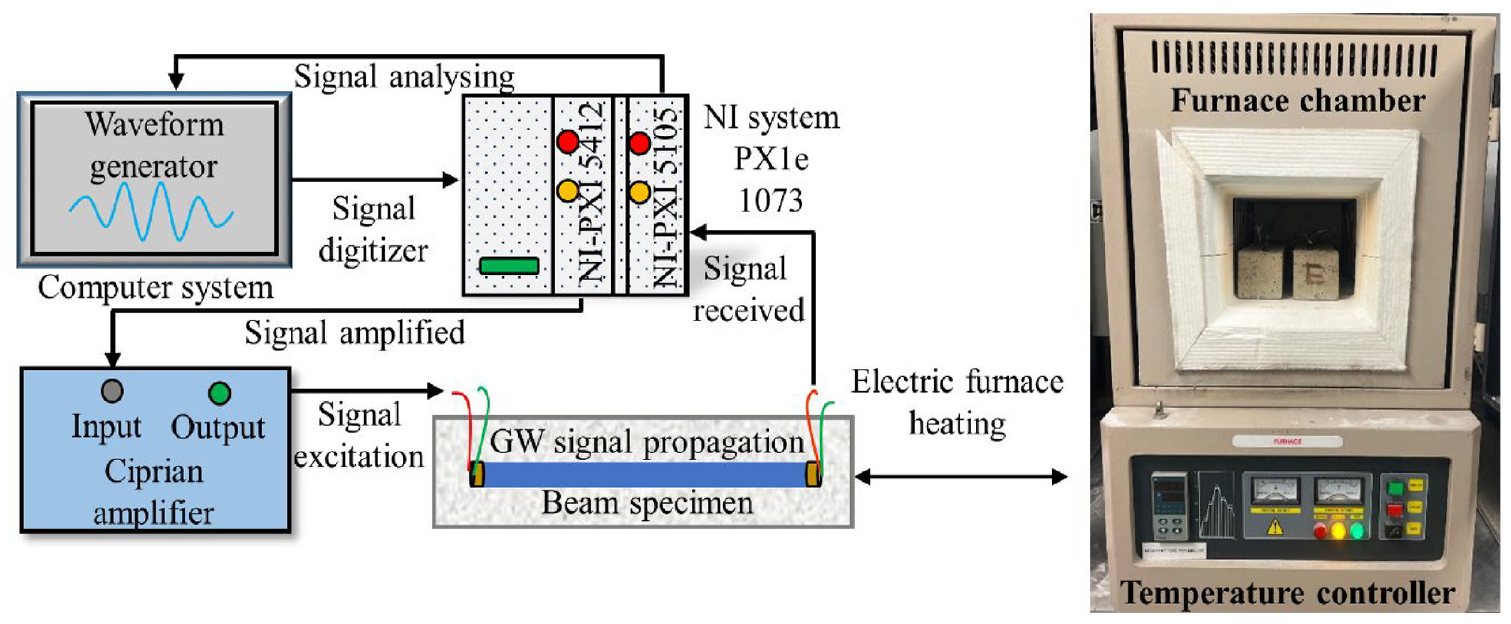
Experimental setup of heat damage study for rebar and reinforced concrete beam.
Validation of bare rebar for GW signal
Before casting the rebar with embedded ends in concrete for specimen type 1, the bare rebar with PZTs attached using high-temperature epoxy is tested for GW signal. The high-temperature epoxy resin is firmly bonded with PZTs for excitation and receiving of GW signal. The experimental setup used for testing bare rebar is shown in Figure 6, where the concrete beam specimen is replaced by bare rebar. An 80-kHz Hann windowed signal with 10 cycles is excited at the bare rebar end and received at the other rebar end. The input voltage is set to 0.6 V, which is amplified 400 times to 240 V. The measured time domain signal is presented in Figure 7(a). Based on the group velocity dispersion curve for bare rebar, L(0,1) GW mode propagates at 80 kHz as shown in Figure 4. The group velocity of the time domain signal in Figure 7(a) is found to be similar to L(0,1) GW mode in the group velocity dispersion curve for bare rebar. The time–frequency plot obtained using short-time Fourier transform 31 for the time domain signal is shown in Figure 7(b). Time–frequency data for L(0,1) GW mode from the dispersion curve is superimposed on the time–frequency plot of the GW signal in bare rebar. It reflects the propagation of L(0,1) GW mode at 80 kHz frequency. The first pulse received is L(0,1) GW mode confirming the propagation of longitudinal GW signal using high-temperature epoxy and wires.
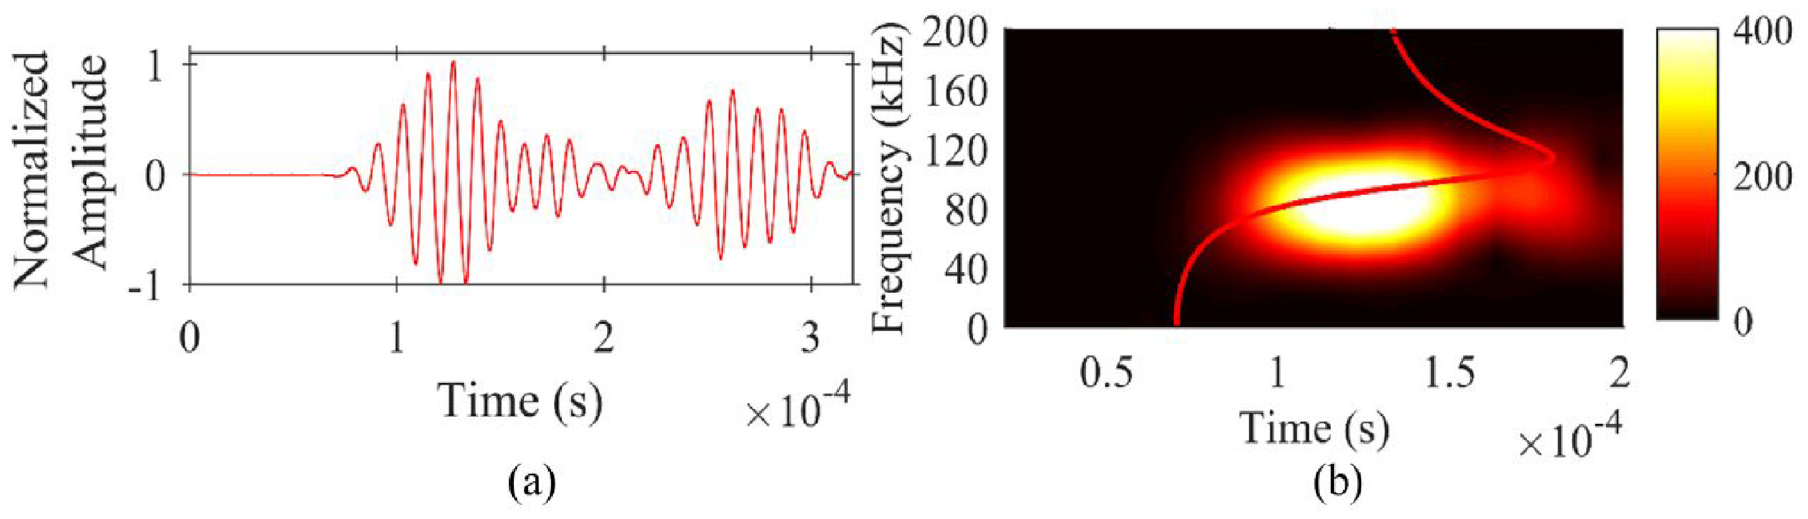
(a) Time domain and (b) time–frequency spectrum of 80 kHz excitation signal in bare rebar.
RC beam specimen with embedded rebar ends
The RC beam specimen type 1 and 2 are cast in the laboratory. For specimen type 1, the length of the concrete beam
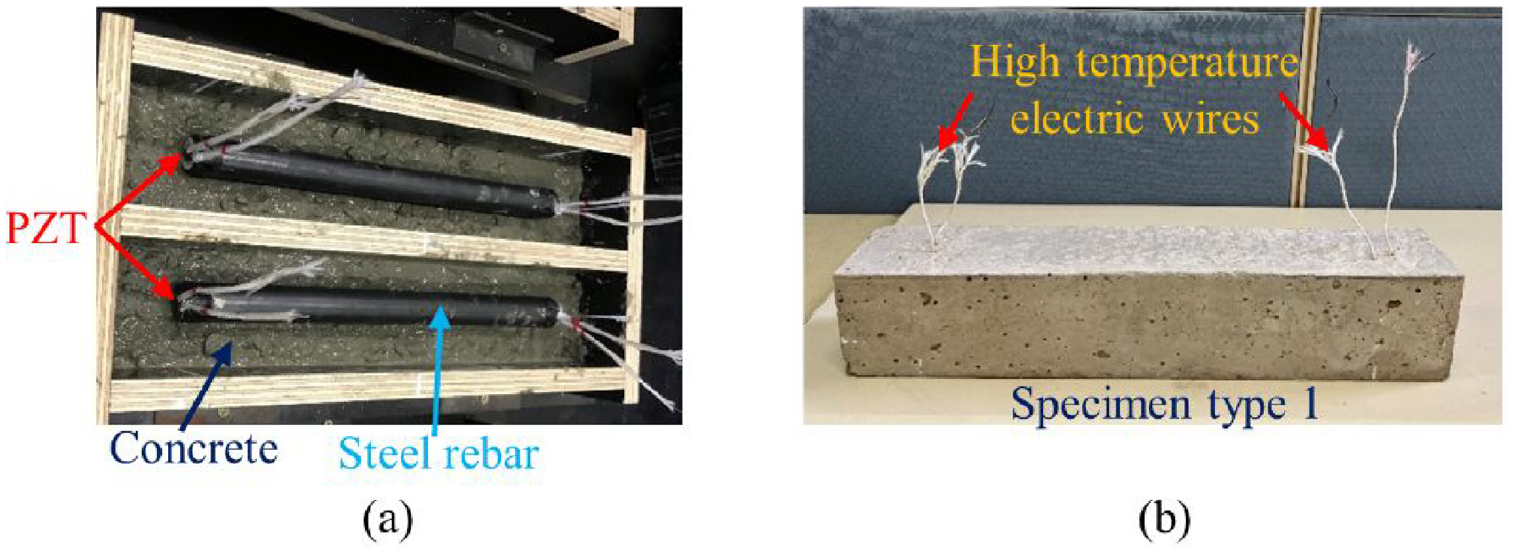
(a) Cast in situ specimen type 1 and (b) cured specimen type with high-temperature wires.
The size of the specimen is restricted to account for the heating furnace chamber size. Initially, the fully bonded specimen type 1 is studied for GW signal at room temperature. The exposed wires are connected to the NI setup as shown in Figure 6. For specimen type 1, the travel distance for the GW signal is only 300 mm. By considering the wavelength of GW at a higher frequency, a 200-kHz 10-cycle Hann windowed signal is excited at end A with a voltage of 240 V. The received time domain signal at end B is shown in Figure 9(a). Fast Fourier transform (FFT) is applied on the time domain signal and is shown in Figure 9(b). There are no second harmonics generated in the fully bonded specimen type 1 as there is no contact effect between steel rebar and concrete.
(a) Time domain and (b) frequency domain for fully bonded specimen type 1 without heat damage.
The debonding is created using a Mylar sheet wrapped around the steel rebar at a distance of 100 mm shown as CD in Figure 2(b). The debonded specimen is prepared to study and monitor the effect of heat damage on the inherent debonded specimen. The debonding between steel rebar and concrete produces contact surfaces for longitudinal GW to generate second harmonics. A similar 200-kHz 10-cycle Hann windowed signal is excited at end A for specimen type 1 with debonding as shown in Figure 2(b). The time domain signal is shown in Figure 10(a). With the FFT transform of this time domain signal, the presence of second harmonics at 400 kHz as shown in Figure 10(b).
(a) Time domain and (b) frequency domain for debonded specimen type 1 without heat damage.
Second harmonics are generated due to debonding in specimen type 1. It is worth mentioning from these results that embedded PZTs can be used to detect and monitor debonding type damage in RC structures using longitudinal GWs. These results for bonded and debonded specimens are acquired without any heat damage at room temperature. For heat damage, case studies are defined in section “ Experimental case studies” with results shown in section “Results and discussions.” For shorter rebar length in specimen type 1, the greater excitation frequency is selected due to shorter wavelength, whereas specimen type 2 has greater rebar length and lower frequency and is selected for GW study.
RC beam specimen with exposed rebar ends
As specimen type 1 can only be heated up to 300°C due to the operational temperature limit of PZTs and wires, specimen type 2 is prepared in the laboratory with exposed rebar ends to study the effect of heat damage on bonding between steel rebar and concrete beyond 300°C. The total length of the steel rebar shown as
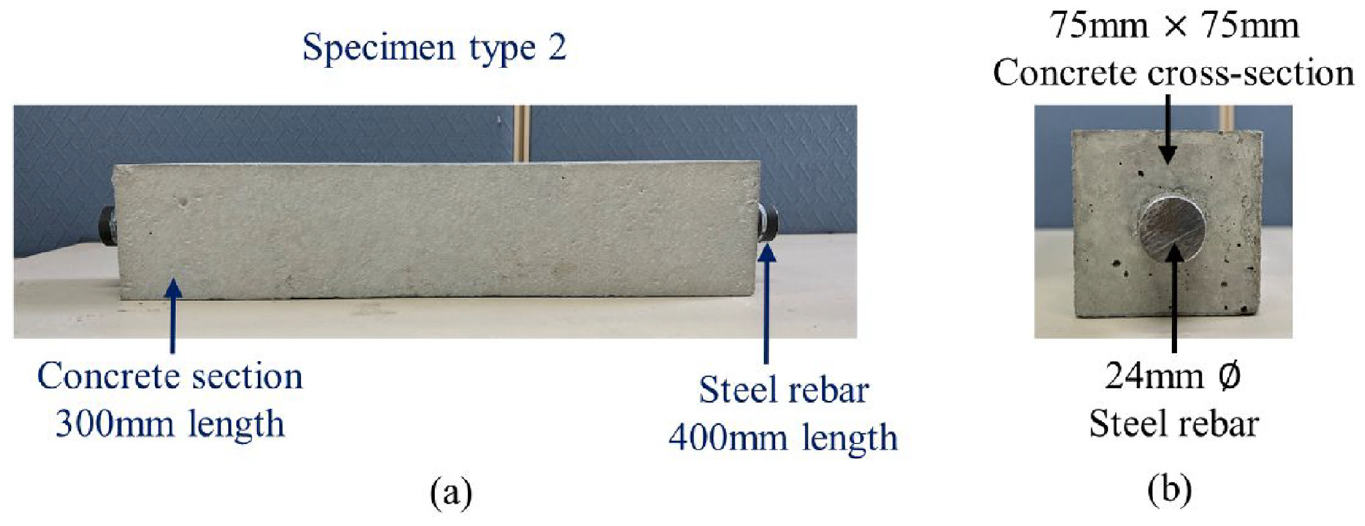
(a) Longitudinal and (b) cross-section view for specimen type 2 with exposed rebar ends.
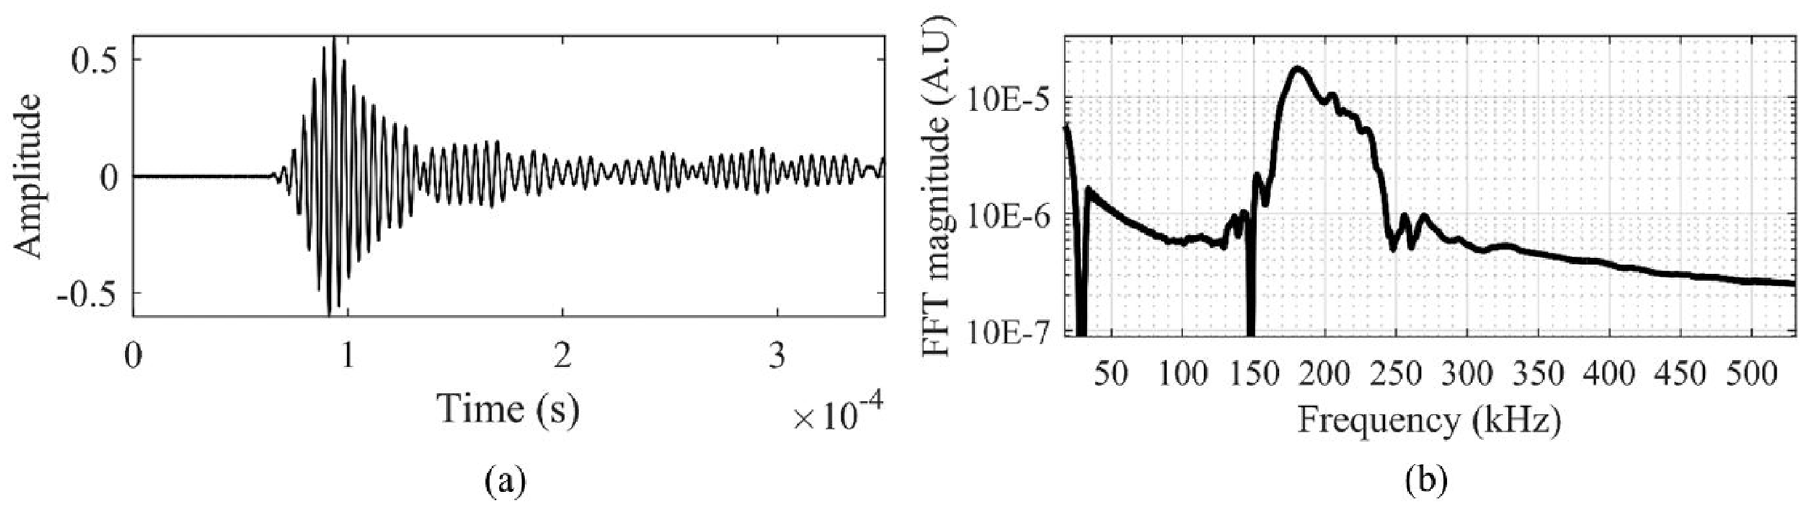
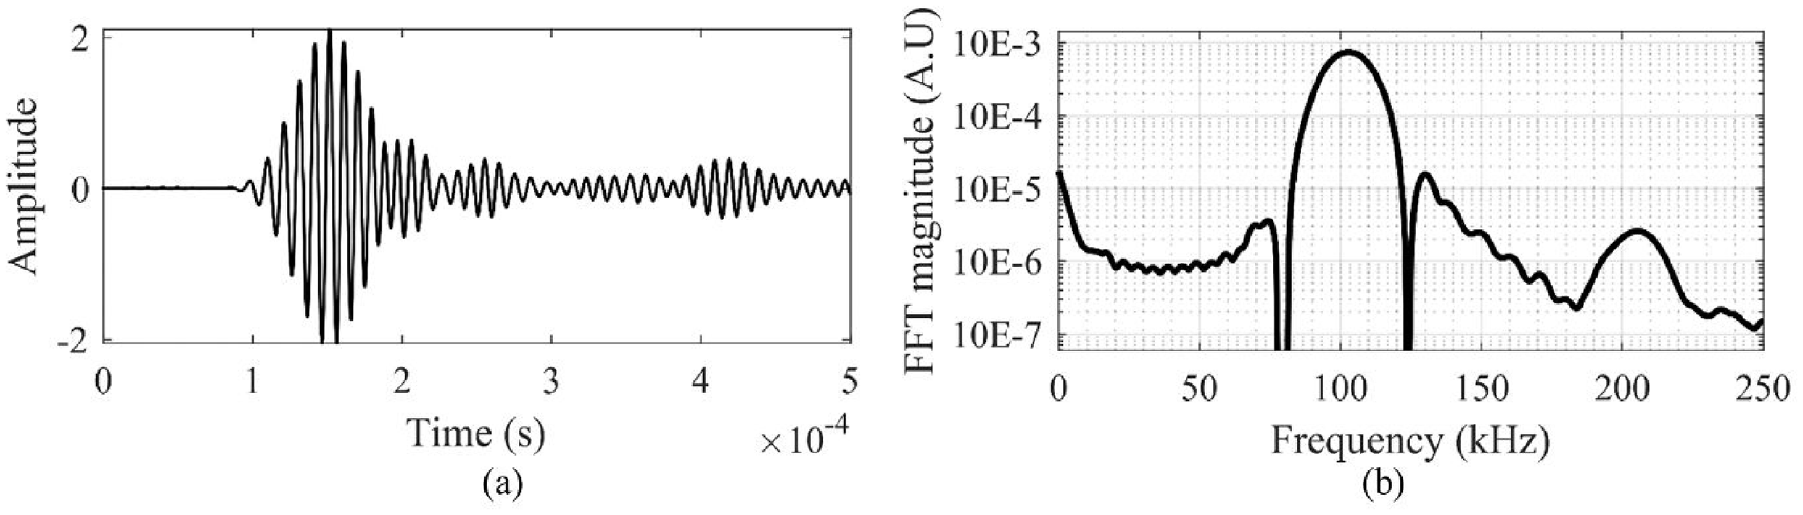
For excitation and receiving of longitudinal GW, G series ULTRAN transducers are attached to the exposed rebar ends. ULTRAN GC200-D13 is connected to excite 100-kHz 10-cycle Hann windowed signal. The GW signal is received at rebar end B using GC500D-13 as shown in Figure 12(a). The frequency domain represents the absence of second harmonics reflecting that the specimen is fully bonded as shown in Figure 12(b). The amplitudes of the time domain signal and FFT for specimen type 2 are larger than that of specimen type 1. As PZTs are embedded and surrounded by concrete in specimen type 1, the amplitude of the GW signal propagated in the embedded rebar is smaller for similar excitation voltage in specimen type 2. On the contrary, specimen type 2 has bare rebar ends.
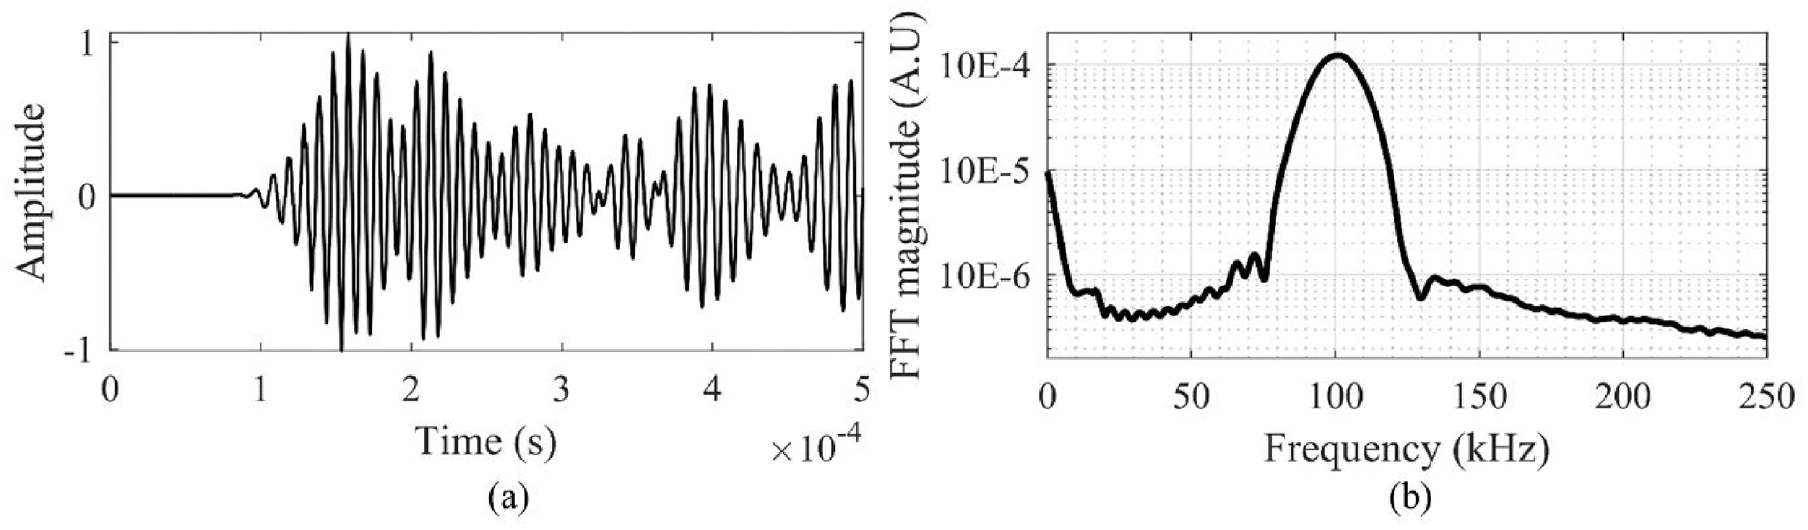
(a) Time domain and (b) frequency domain for fully bonded specimen type 2 without heat damage.
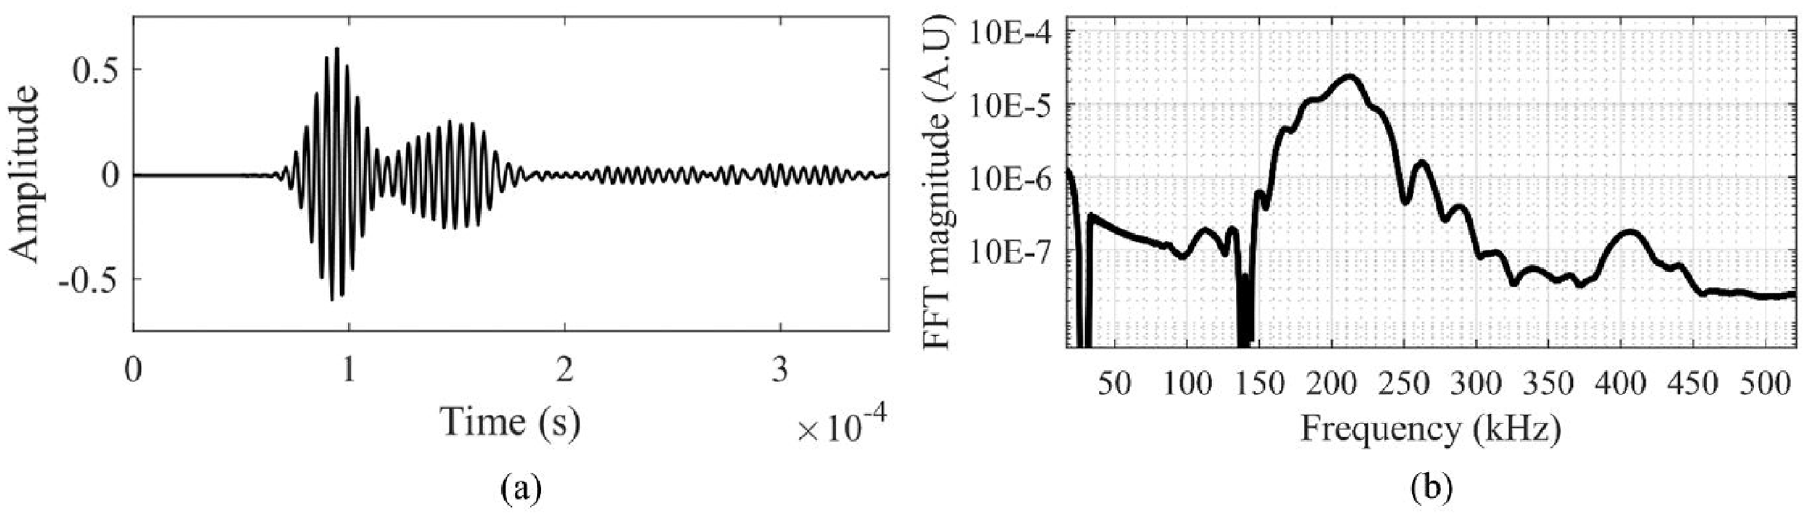
The specimen type 2 is also prepared with debonding length
(a) Time domain and (b) frequency domain for debonded specimen type 2 without heat damage.
The time domain signals for bonded and debonded specimen type 2 are also different. The GW signal for a fully bonded specimen is more dispersive and has a greater number of GW modes as compared to the debonded specimen. It is understood that GW can detect debonding with the presence of second harmonics.
Experimental case studies
The bonded and debonded specimen type 1 and 2 are analyzed for heat damage study using GW. Specimen type 1 for fully bonded and debonded are heated up to 300°C. The debonding length in debonded specimen type 1 is 100 mm. Specimens 1B and 1D are heated up to each interval as shown in Table 2 and then cooled to room temperature for GW testing. For specimen type 2, the GW study is carried out using exposed rebar ends, for which the maximum heated temperature is 800°C. For GW study using specimen type 2, the transducers are attached to exposed rebar ends after the specimen is cool down in each heated interval. Specimen type 2 is heated until the cracks widely open and break the RC beam specimen as shown in section “Linear feature for heat damage in RC specimen.” The linear and nonlinear GW study can give an indication of the effect of debonding between steel rebar and concrete for both fully bonded and debonded specimens. The time domain and FFT data for each case study are shown in section “Results and discussions.”
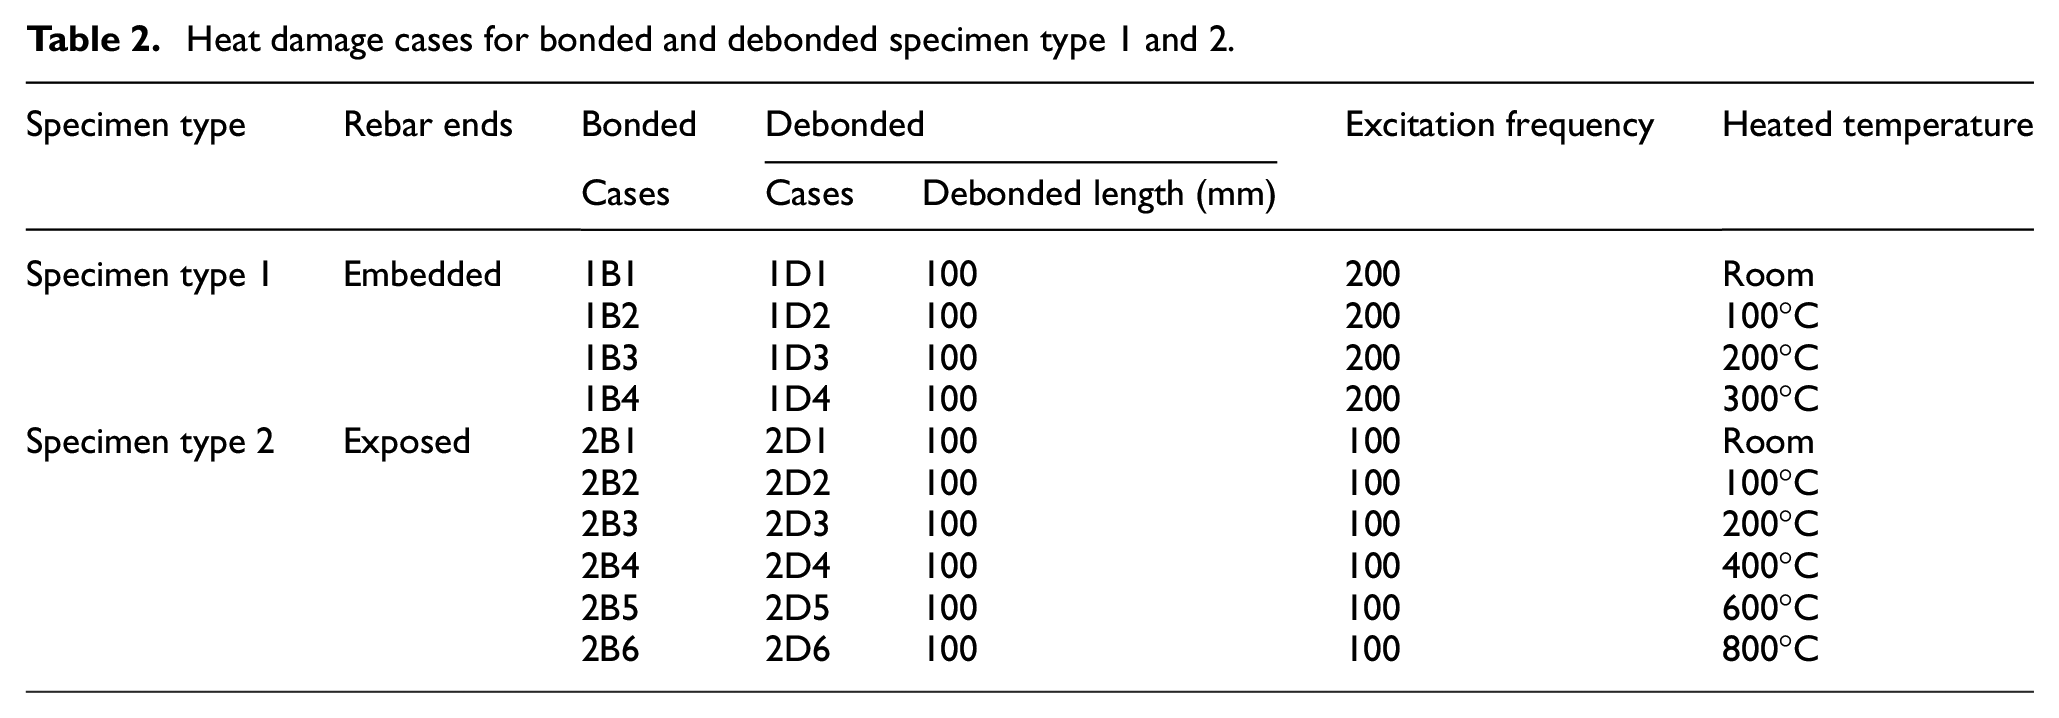
Heat damage cases for bonded and debonded specimen type 1 and 2.
The nonlinear study investigates the presence of second harmonics in heat damaged and debonded cases, which is due to the initial debonding or debonding generated due to heat damage. As discussed in section “Methodology,” the second harmonics can be generated due to material nonlinearity. When the specimen is heated, the temperature change can produce material nonlinearities in embedded rebars through which GW is propagated. If there is any material nonlinearity due to heat damage in the rebar, it can be monitored using GW study on bare rebar. To study material nonlinearity in bare rebar, the case studies are defined in Table 3.
Heat damage cases for bare rebar type 1 and 2.
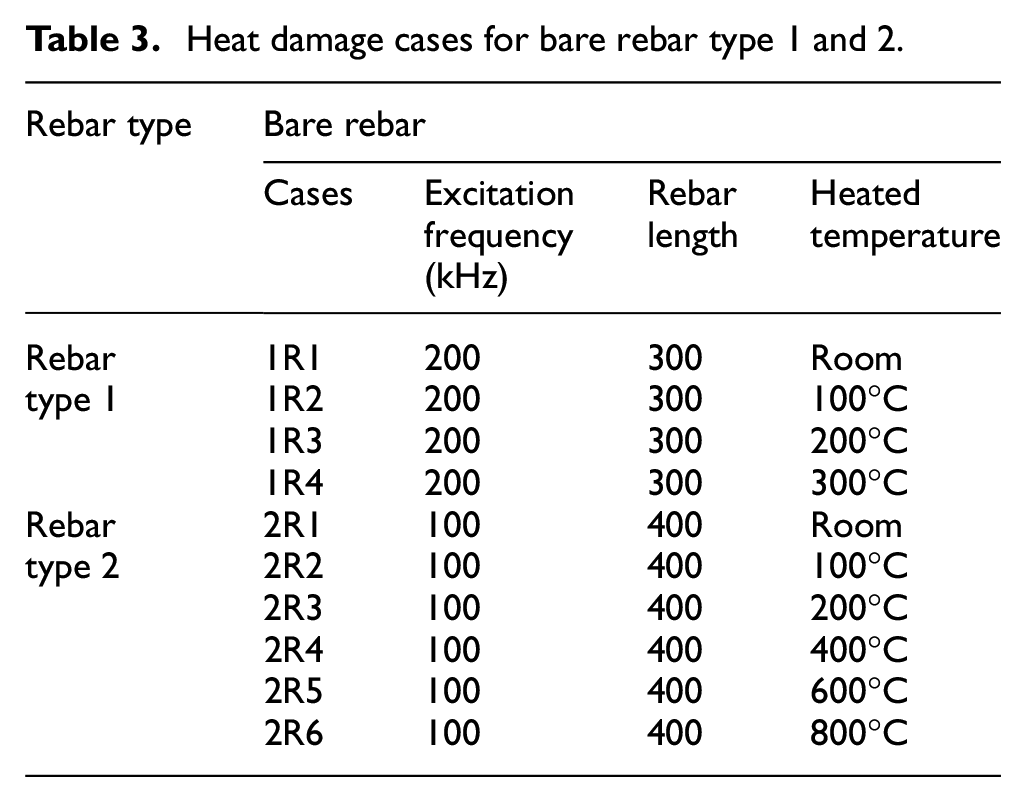
The rebar type 1 is 300 mm in length, which is similar to the embedded rebar in specimen type 1. The rebar type 2 is 400 mm in length, which is similar to the rebar in specimen type 2. These rebars are subjected to heated intervals as shown in Table 3 to determine any second harmonics generated due to material nonlinearity.
Results and discussions
The linear and nonlinear GW results are discussed for RC beam specimens and the bare rebar in this section. The heat damage has an impact on the time domain signal for the RC beam specimen. The heat damage creates debonding between steel rebar and concrete to generate second harmonics. The bonded and debonded specimen type 1 are similar to each other except the debonding length is 100 mm. Similarly, the bonded and debonded specimen type 2 have similar characteristics except the debonded has 100 mm of debonding length. The bonded and debonded specimen are tested for heat damage to understand the linear and nonlinear characteristics of GW signal with and without debonding in the RC beam.
Second harmonics due to heat damage in specimen type 1
After initial GW testing of fully bonded specimen type 1 at room temperature, it is heated at 100°C, 200°C, and 300°C. After each heated interval, the bonded specimen is tested for GW signal at 200 kHz with an input voltage of 240 V. The time domain data received for fully bonded specimen type 1 heated cases is shown in Figure 14(a). The FFT for each heated case for fully bonded specimen type 1 is shown in Figure 14(b). The time domain signal is normalized to plot the frequency data. Figure 14(a) shows an increase in second harmonics magnitude at 400 kHz with the increase in temperature. The maximum amplitude of second harmonics is observed for 1B4 at 300°C. It is obvious that heat damage has created debonding between steel rebar and concrete to generate contact surfaces for second harmonics. The amplitude of the time domain signal is also increased for heated cases, and the maximum amplitude happens in case 1B4.
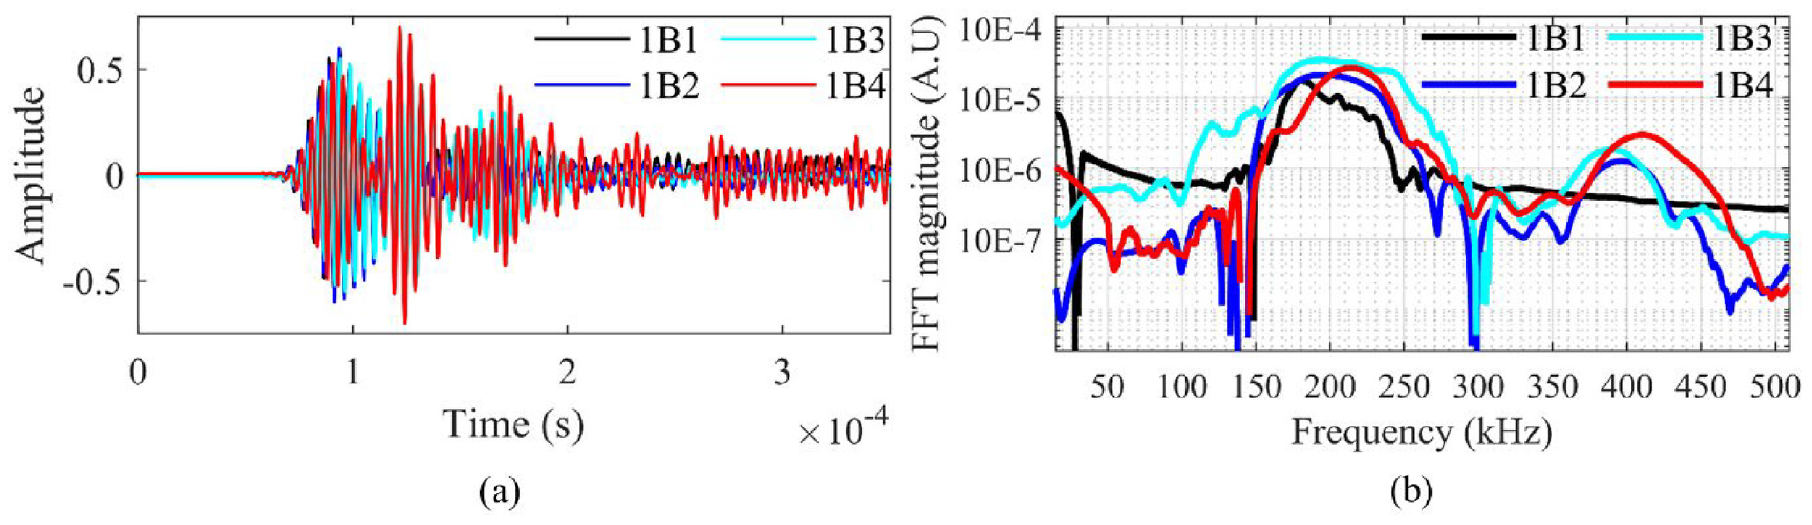
(a) Time domain and (b) frequency domain for fully bonded specimen type 1 at heat damaged cases.
Similarly, specimen type 1 with 100 mm of debonding is considered in the heat damage cases to observe the time domain signal and second harmonics. The excitation signal is 200 kHz with 240 V for each heated case. The time domain signal for debonded specimen type 1 at heat damaged cases is shown in Figure 15(a). Initially, the second harmonics are produced due to the artificial debonding created in the specimen for case 1D1. The heated cases 1D2, 1D3, and 1D4 show an increase in the amplitude of second harmonics as shown in Figure 15(b). It depicts that further debonded regions are produced in embedded rebar due to heat damage to generate second harmonics. The heat damage case ID4 shows the maximum amplitude of second harmonics at 300°C.
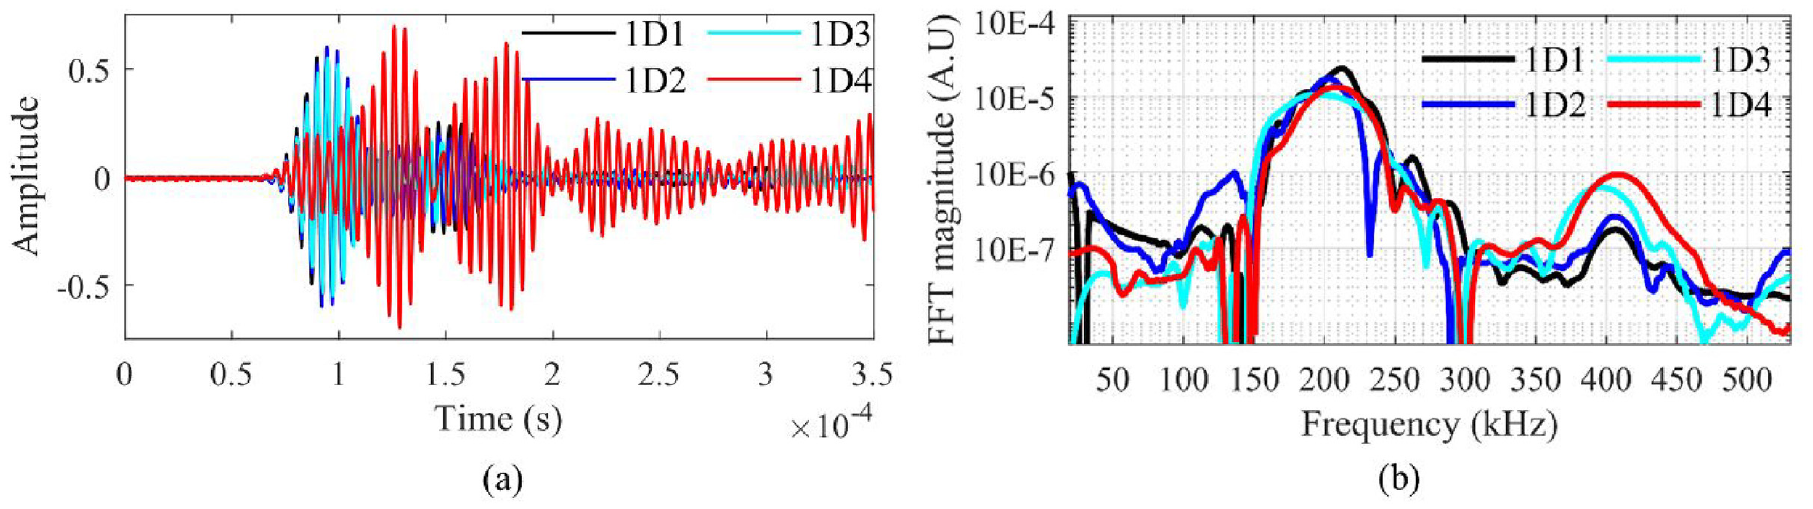
(a) Time domain and (b) frequency domain for debonded specimen type 1 at heat damaged cases.
Second harmonics due to heat damage in specimen type 2
The embedded PZTs could not be tested for GW after the specimen was heated beyond 300°C due to its limitation. To overcome this issue, specimen type 2 with exposed rebar ends is heated beyond 300°C to monitor the GW signal for linear and nonlinear study. The specimen type 2 with fully bonded and debonded are heated up to 800°C. The specimen type 2 case studies for heated temperature are defined in Table 2. The excitation frequency for specimen type 2 is 100 kHz at 240 V. The time domain signal for fully bonded specimen type 2 cases is shown in Figure 16(a). The time domain signals are normalized to plot the data in the frequency domain as shown in Figure 16(b). The time domain signal represents a significant increase in amplitude for cases 2B5 and 2B6. In the frequency domain, the second harmonics appear for cases 2B2, 2B3, 2B4, 2B5, and 2B6 at 200 kHz. The maximum amplitude of second harmonics for fully bonded specimen type 2 is noted for case 2B6 at 800°C.
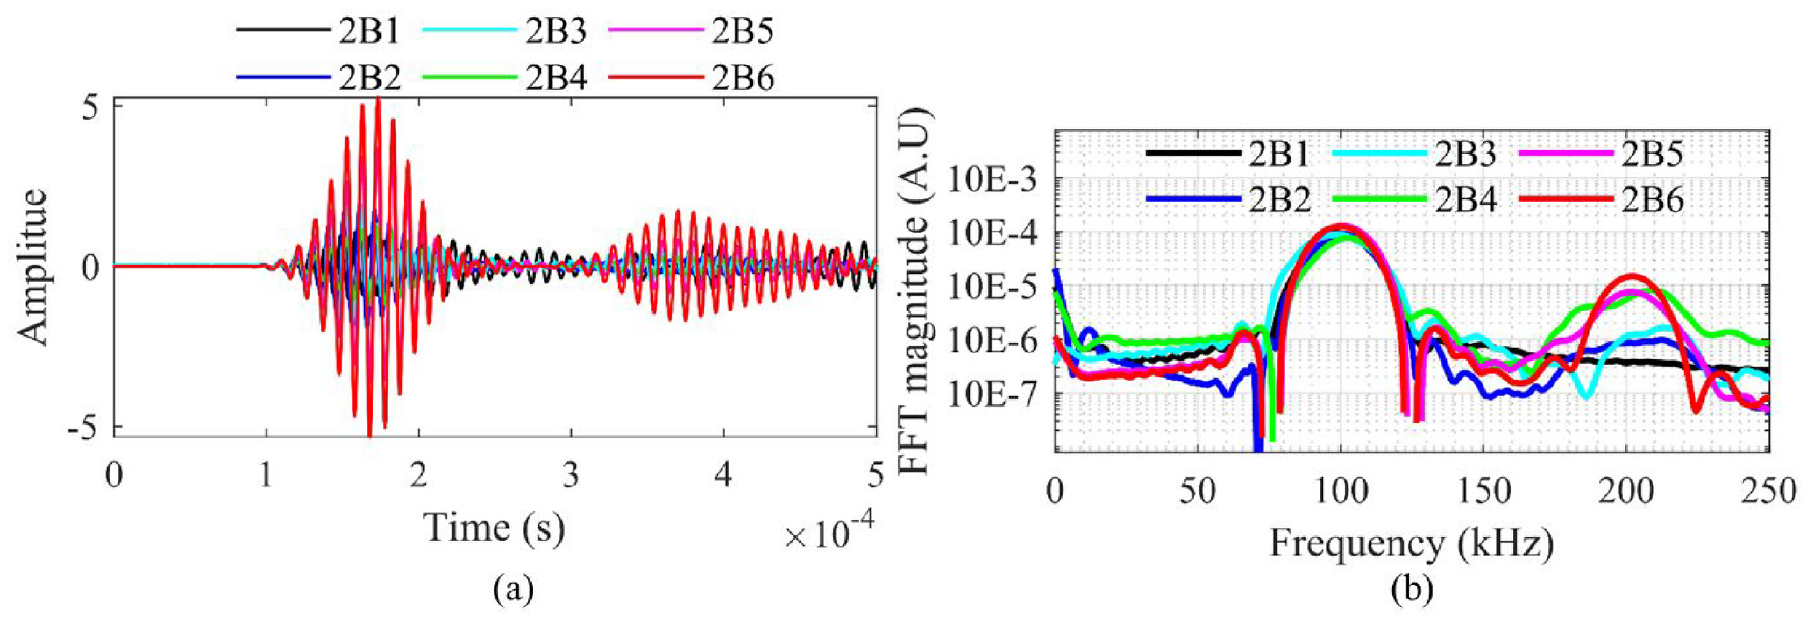
(a) Time domain and (b) frequency domain for fully bonded specimen type 2 at heat damaged cases.
The debonded specimen type 2 with 100 mm of debonding is heated for cases as shown in Table 2. The specimen is tested for GW signal at 100 kHz with 240 V after each heated case. The time domain signal for debonded specimen type 2 cases is shown in Figure 17(a). The amplitude of the time domain signal is significantly increased for heated cases 2D5 and 2D6 at 600°C and 800°C, respectively. The time domain signal is normalized to attain FFT as shown in Figure 17(b). The debonded heated cases 2D2, 2D3, 2D4, 2D5, and 2D6 show an increase in the amplitude of second harmonics. The maximum amplitude of second harmonics is observed for 2D6 at 800°C.
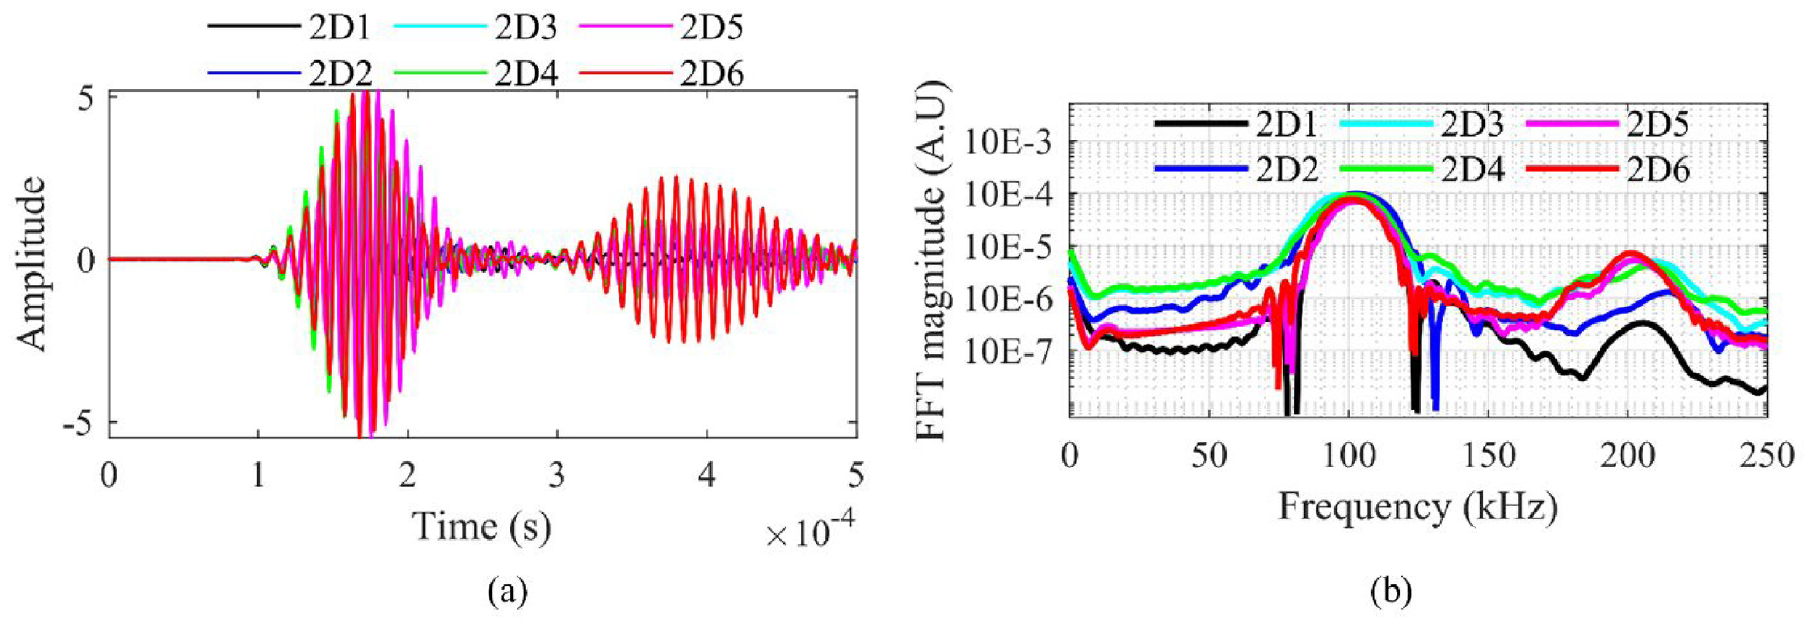
(a) Time domain and (b) frequency domain for debonded specimen type 2 at heat damaged cases.
The bonded and debonded specimen type 1 and 2 showed an increase in the amplitude of second harmonics with elevated temperatures. Therefore, the second harmonic is a useful indicator of the severity of heat damage, which deteriorates the bonding between steel and concrete.
Linear feature for heat damage in RC specimen
Sections “Second harmonics due to heat damage in specimen type 1” and “Second harmonics due to heat damage in specimen type 2” show the amplitude for the time domain signal of both specimen type 1 and 2 with the temperature. The peak amplitudes of time domain signals are plotted for bonded and debonded specimen type 1 and 2 at their respective heated temperatures as shown in Figure 18. For specimen type 1, the amplitude of the time domain signal is lesser than specimen type 2 as the PZTs are embedded inside the concrete. With similar excitation voltage for specimen type 1 and 2, specimen type 1 has greater energy leakage to surrounding concrete as compared to specimen type 2, which has exposed rebar ends. The amplitude is slightly increased at the elevated temperature beyond 200°C for specimen type 1. For both bonded and debonded specimen type 2, the amplitude of GW is significantly increased from heated intervals of 200°C to 800°C. For specimen type 2, the debonded specimen has a sharp increase in amplitude as compared to the bonded specimen. It has been acknowledged that heat damage has generated debonding between steel and concrete which results in a reduction of leaking GW energy into surrounding concrete. Due to this phenomenon, a larger amplitude of the GW signal is observed as the temperature progress.
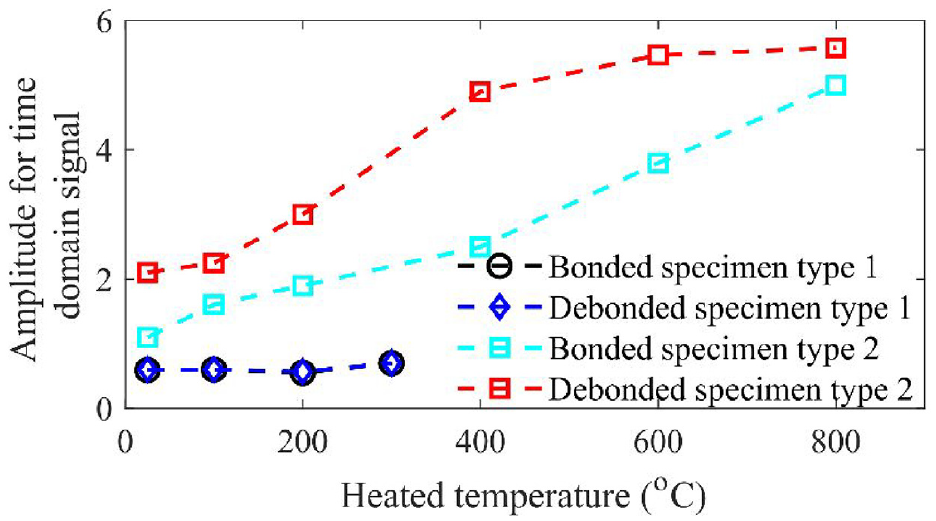
Change in the amplitude of guided waves signal for bonded and debonded specimen type 1 and 2 with elevated heat temperatures.
Apart from heat damage creating debonding between steel and concrete, it also has an impact on the concrete surrounding the rebar. With the increase in heated temperature, cracks appear on the concrete surface mainly beyond 200°C. These cracks tend to widen at increased temperature. The spalling of concrete is also observed beyond 400°C. The pattern of cracks for the bonded and debonded specimen is different. For bonded specimens, the cracks appeared near the edges at the approximate 1/3 location of the beam as shown in Figure 19(a). However, for debonded specimens, the crack appears at the center of debonding location, which was already known as shown in Figure 19(b). For progressive heat, the damage is concentrated at the center of debonding location in the debonded specimen. Considering this, in fully bonded specimens, the cracks tend to appear at the location, where the bonding of concrete with steel is weaker. At 1000°C, the concrete beam specimens are fully cracked and divided into sections as shown in Figure 19(c). After 1000°C, the steel rebar is manually pulled out of the concrete with ease showing no or minimal bonding with the surrounding concrete. As the steel rebar is pulled out, the concrete section is broken by itself and divided into sections. Figure 19(c) shows the cross-section of concrete at cracked locations showing the progress of the crack throughout the cross-section. It is therefore important to consider that heat damage creates debonding between steel rebar and concrete. The experimental results also reflect that structural health monitoring of RC can be carried out when they are exposed to fire or heat damage.
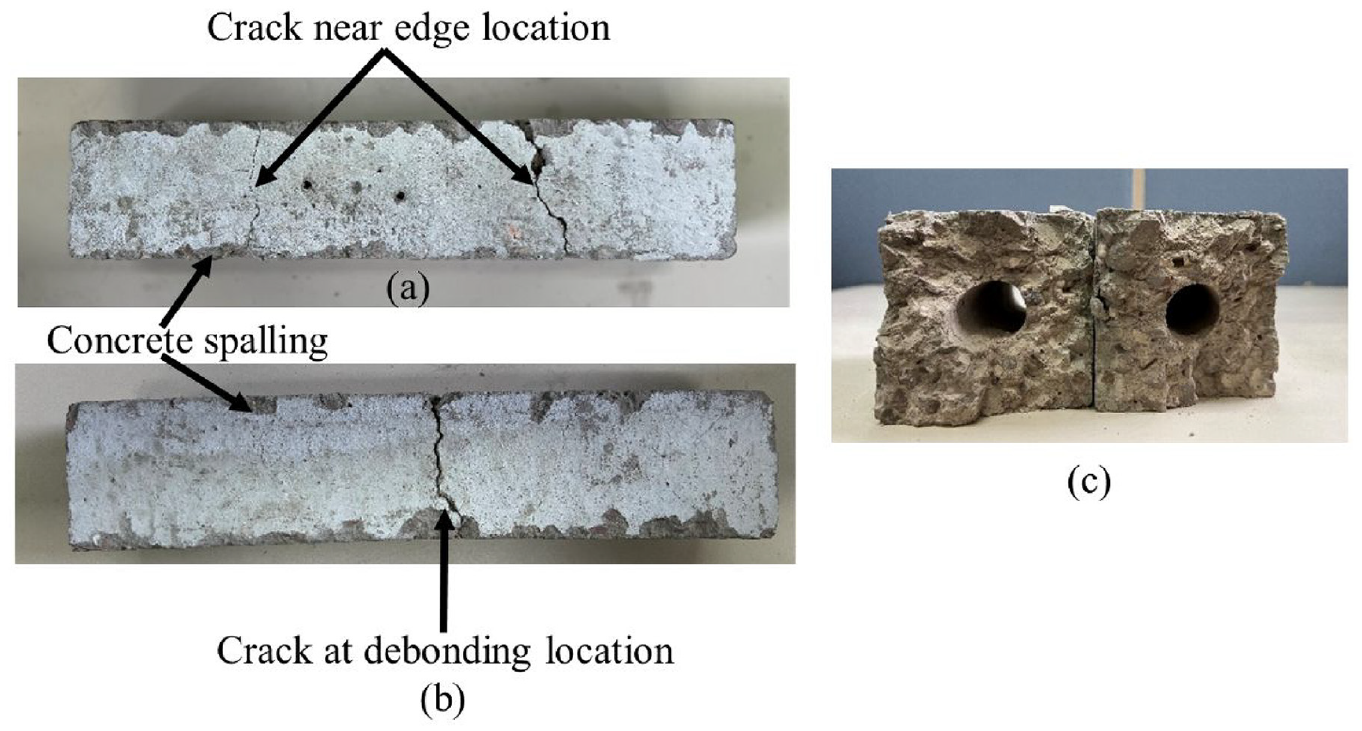
Crack pattern for (a) bonded and (b) debonded specimen type, (c) concrete cross-section at cracked location.
Rebar heat damage
The amplitude of second harmonics generated due to heat damage of bonded and debonded specimen type 1 and 2 have components of heat damage due to material nonlinearity of embedded rebar. To study the second harmonics due to material nonlinearity in rebar because of heat damage, the bare rebar cases are defined in Table 3. The rebar type 1 and 2 are tested for GW signal using ULTRAN transducers. ULTRAN G series GC200-D13 is used to excite the GW signal ULTRAN G series GC500D-13 is used to receive the GW signal using a similar experimental setup instead of the RC beam as shown in Figure 6. The excitation signal used for specimen type 1 is used for rebar type 1 with excitation voltage to be consistent at 240 V. The time domain signal for rebar type 1 at heated intervals is shown in Figure 20(a). At heated intervals, the frequency domain does not show any significant second harmonics as shown in Figure 20(b). The amplitude of the received signal is slightly reduced for heated case 1R4 at 300°C.
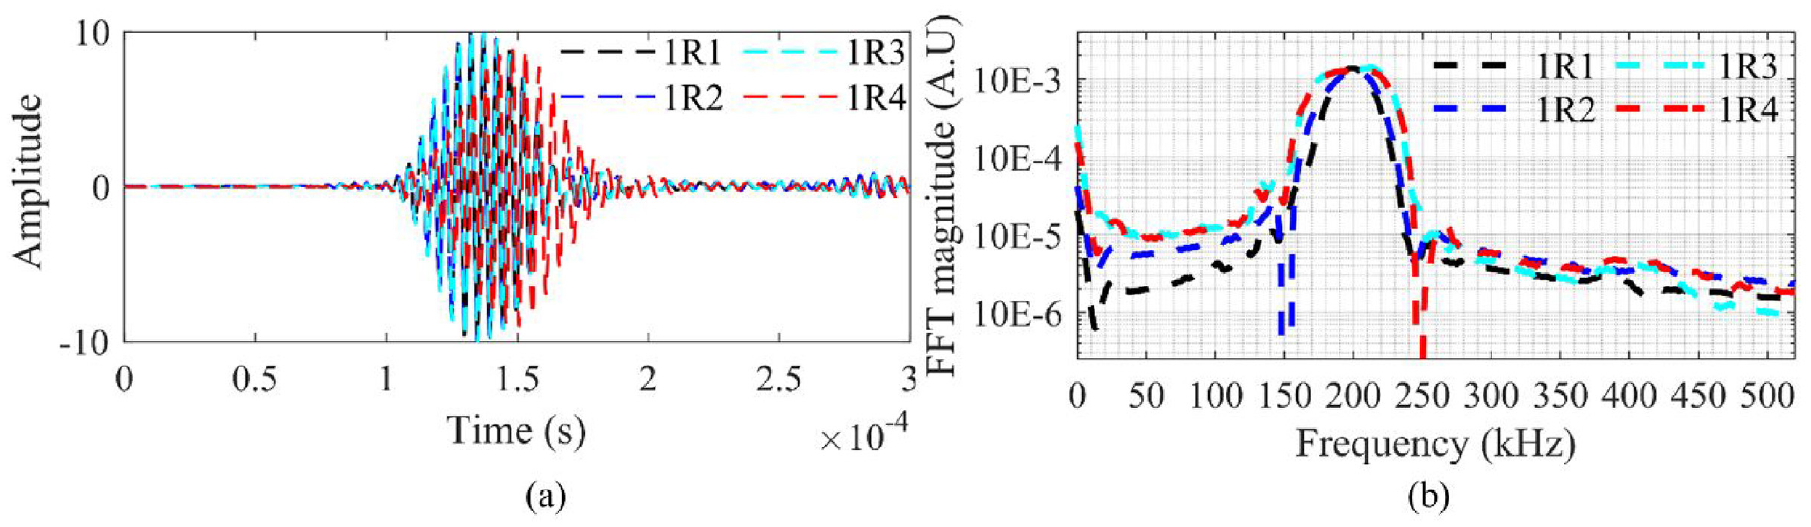
(a) Time domain and (b) frequency domain for rebar type 1 in heat damaged cases.
Similarly, the rebar type 2 is heated for temperature intervals as shown in Table 3. The excitation signal in rebar type 2 is similar to specimen type 2. The time and frequency domain of the signals is shown in Figures 21(a) and 21(b), respectively. The amplitude of the received signal slightly decreases at higher temperature with a consistent excitation voltage of 240 V. Again, the rebar type 2 did not show any significant second harmonics at heated temperature.
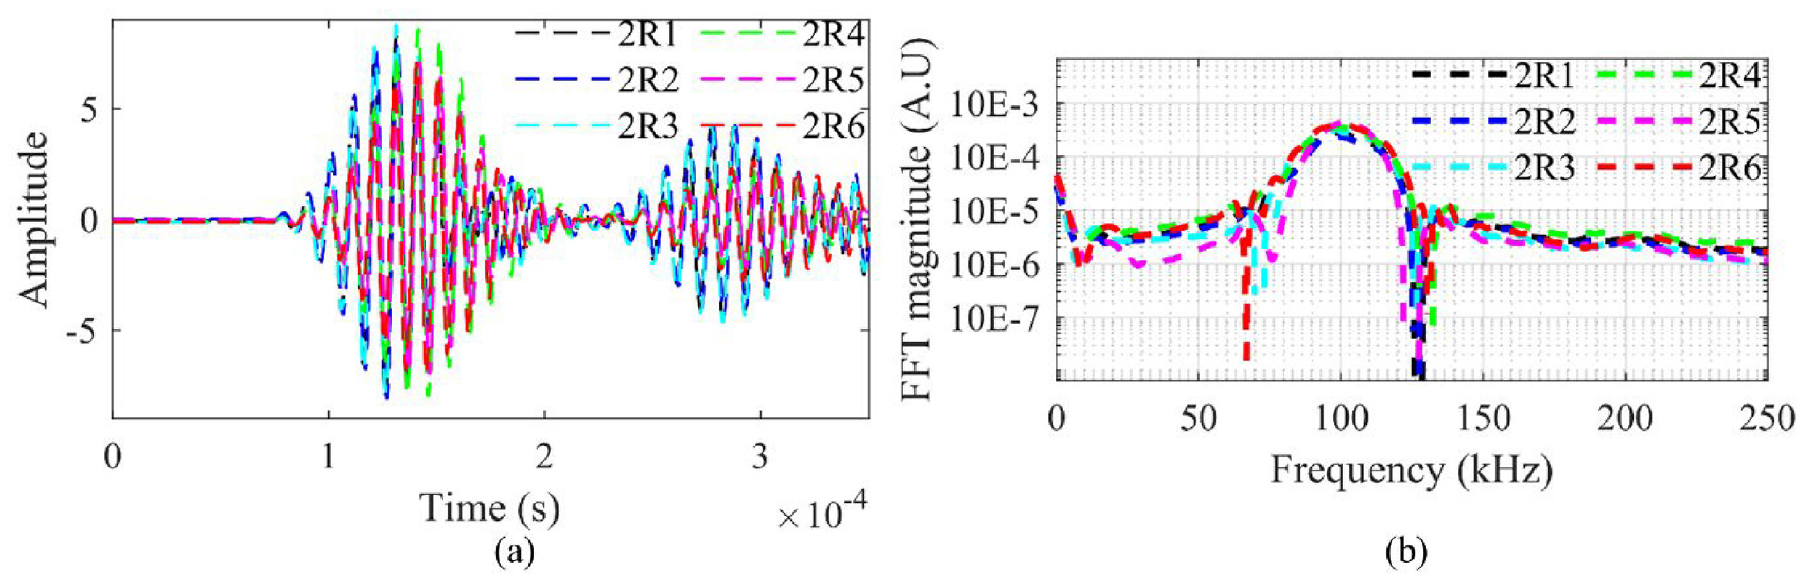
(a) Time domain and (b) frequency domain for rebar type 2 in heat damaged cases.
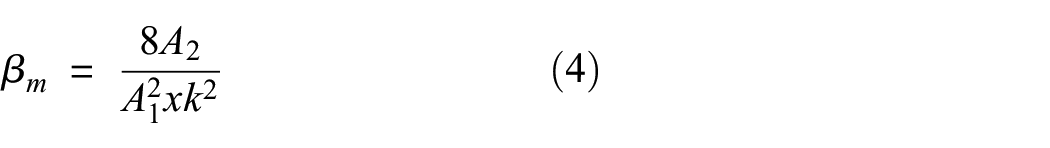
As the steel rebar undergoes changes in material properties and nonlinearity at elevated temperatures, the longitudinal GWs did not show the presence of any nonlinear features. Therefore, the nonlinear parameter calculated for material nonlinearity in bare rebar will not have a significant magnitude in comparison to the nonlinear parameter due to contact heat damage.
Nonlinear parameter
Based on heated damage, the nonlinear parameter
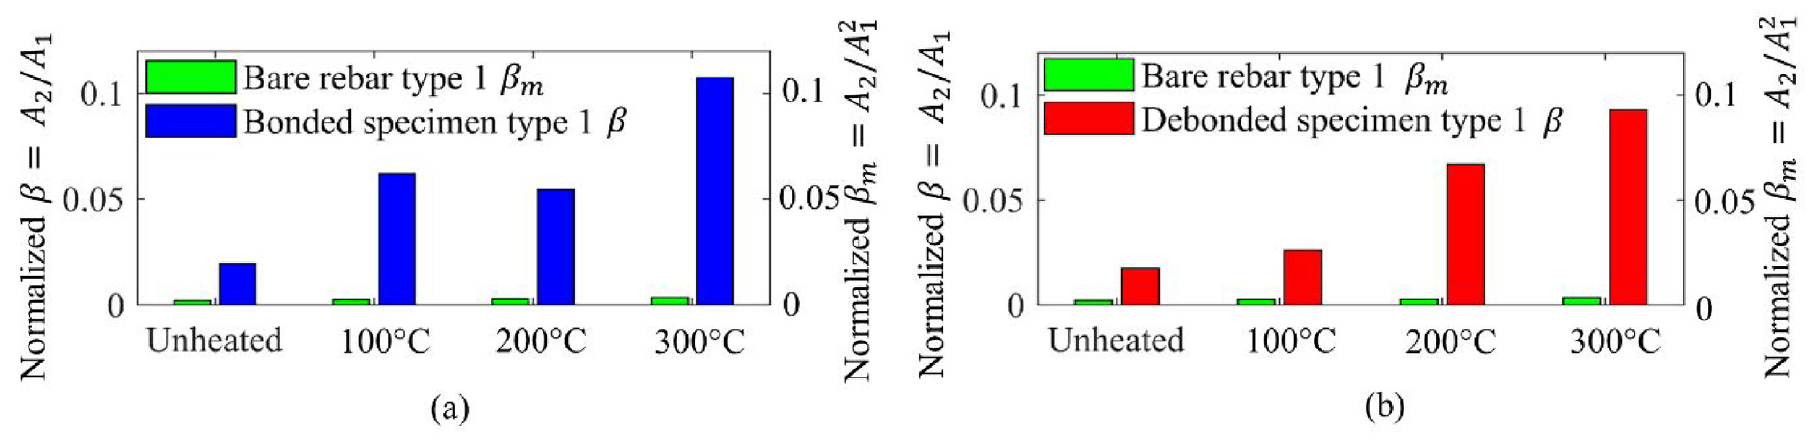
Nonlinear parameter βm for bare rebar type 1 and β for (a) bonded and (b) debonded specimen type 1.
For rebar type 2 and specimen type 2, the heated temperature is from 100°C to 800°C. The
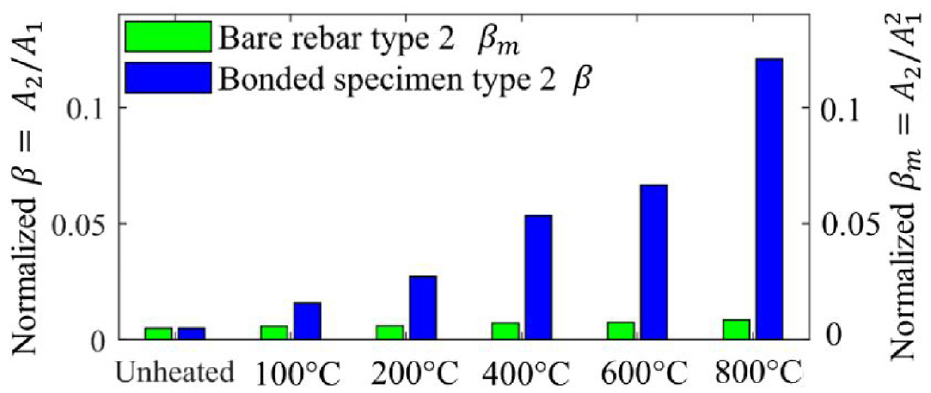
Nonlinear parameter βm for bare rebar type 2 and β for bonded specimen type 2.
The
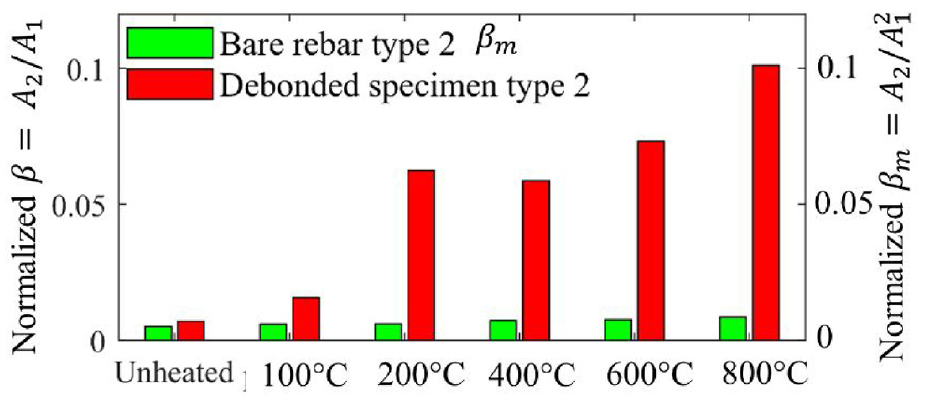
Nonlinear parameter βm for bare rebar type 2 and β for debonded specimen type 2.
After 800°C, the bonded and debonded specimen type 2 were cracked due to excessive heat damage at 1000°C as discussed in section “Linear feature for heat damage in RC specimen.” The nonlinear parameter
Conclusion
Linear and nonlinear GW features are studied experimentally to detect heat damage in the RC beams. The RC specimens are heated in a furnace to study debonding damage between rebar and concrete. Specimen type 1 has rebar ends fully embedded inside the concrete, whereas specimen type 2 has embedded rebars, whose ends are exposed outside the beam for attaching transducers. Specimen type 1 has embedded sensors attached to rebar inside the concrete, which can be subjected to heat damage at 300°C. For specimen type 2, the GW signal is propagated after the cool down of the specimen from the heated temperature. Therefore, specimen type 2 is tested up to 800°C before the cracks open in the RC beam at 1000°C.
For both specimen type 1 and 2, the bonded and debonded specimen are prepared. The debonding is created using a Mylar sheet wrapped around the steel rebar. For specimen type 1, a 200-kHz excitation signal is used for the GW study with the heated temperature at 100°C, 200°C, and 300°C. The debonded specimen type 1 shows the presence of second harmonics at room temperature as compared to bonded specimen type 1. This reflects that the embedded sensors can detect debonding between steel rebar and concrete in RC beams. The second harmonics are observed at heated temperatures for both bonded and debonded specimen type 1. Specimen type 2 is tested for GW signal using ULTRAN transducers at the exposed rebar ends. Specimen type 2 is heated at 100°C, 200°C, 400°C, 600°C, and 800°C temperature. The excitation frequency for specimen type 2 is 100 kHz. Both bonded and debonded specimen type 2 show that the presence of second harmonics at heated temperature. The presence of second harmonics in bonded and debonded specimen type 1 and 2 at elevated temperature reflects the development of debonding between steel rebar and concrete due to heat damage.
The linear features of the GW signal are also compared in this study. The peak amplitude of GW signals is compared for bonded and debonded specimen type 1 and 2 at elevated temperatures. The study has shown that the amplitude of the GW signal increases with an increase in heated temperature.
To quantify heat damage at elevated temperature,
Footnotes
Correction (May 2024):
Article updated to correct typos in Table 2 since its original publication.
Declaration of conflicting interests
The authors declared no potential conflicts of interest with respect to the research, authorship, and/or publication of this article.
Funding
The authors disclosed receipt of the following financial support for the research, authorship, and/or publication of this article: This work was funded by the Australian Research Council (ARC) DP210103307 and LP210100415 grants. The authors are grateful for the support.