
Abstract
Blind deconvolution (BD) has proven to be an effective approach to detecting repetitive transients caused by bearing faults. However, BD suffers from instability issues including excessive sensitivity of kurtosis-guided BD methods to the single impulse and high computational time cost of the eigenvector algorithm-aided BD methods. To address these critical issues, this paper proposed a novel BD method maximizing negative entropy (NE), shortened as maximum negative entropy deconvolution (MNED). MNED utilizes NE instead of kurtosis as the optimization metric and optimizes the filter coefficients through the objective function method. The effectiveness of MNED in enhancing repetitive transients is illustrated through a simulation case and two experimental cases. A quantitative comparison with three existing BD methods demonstrates the advantages of MNED in fault detection and computational efficiency. In addition, the performance of the four methods under different filter lengths and external shocks is compared. MNED exhibits lower sensitivity to random impulse noise than the kurtosis-guided BD methods and higher computational efficiency than the BD methods based on the eigenvalue algorithm. The simulation and experimental results demonstrate that MNED is a robust and cost-effective method for bearing fault diagnosis and condition monitoring.
Keywords
Introduction
Rolling element bearings have an excellent load-bearing capacity and are extensively used in wind turbines, helicopters, high-speed trains, etc. The bearings in long-term service may experience an increase in internal clearance or localized faults due to the harsh operating environment.1–3 Cyclic impulses are induced when rolling elements periodically pass through a loaded or faulty area. It has been proven that fault-induced vibrations exhibit the typical characteristics of repetitive transients.4,5 These characteristics are implicit in the complex signals that are collected in field tests. The measured signals are also disturbed by random noise and external shocks. How to eliminate fault-independent interference while enhancing fault-related repetitive transients is the key issue of bearing fault diagnosis.
In recent decades, numerous signal processing approaches have been proposed, such as envelope analysis,6–9 blind deconvolution (BD),10,11 modulation signal bispectrum,12,13 stochastic resonance,14–16 Vold–Kalman filtering, 17 morphological filtering 18 and variational mode extraction. 19 The kurtogram, despite being a powerful tool for identifying regions of interest in a signal, has a significant drawback. It is sensitive to random impulsive disturbances, and its diagnostic performance is greatly compromised when encountering single-pulse interference. Wavelet transform is a popular technique for analysing non-stationary signals but is influenced by basis function selection and scale determination.20,21 Hilbert–Huang transform overcomes some limitations of wavelet analysis but has issues with mode mixing. Recently, there have been studies combining the Hilbert–Huang transform with intelligent algorithms to achieve composite bearing fault diagnosis. 22 Ensemble Empirical Mode Decomposition (EEMD) addresses mode mixing but has limitations in parameter settings and computational complexity. In comparison, BD techniques possess advantages such as efficiency, adaptability and the absence of complex basis function selection. With the vigorous development of sensing, communication and computer technology, online monitoring is emerging in practical industrial applications. There is an urgent demand for computationally efficient and reliable signal processing methods for the promotion of online condition monitoring. Among these approaches, BD is one that is efficient in eliminating the influence of signal transmission paths while enhancing fault-associated features.
BD solves the optimal filter by optimizing a certain fault-related metric of signal to enhance fault-induced repetitive transients. The optimization metric for BD usually utilizes a sparsity measure, such as kurtosis,23,24 negative entropy (NE), 25 Lp/Lq norm,26,27 Gini index 28 and Hoyer index. 29 This is because the sparsity measure can effectively evaluate the impulsiveness of a signal. Sparse measures are also used to construct health indicators for mechanical health condition monitoring. 30 There are generally two classical algorithms for solving inverse filters, the objective function method (OFM) and the eigenvalue algorithm (EVA). Miao et al. 31 provided an exhaustive review of BD methods applied to mechanical fault diagnostics. Note that different combinations of optimization metrics and optimization techniques (i.e. the solution methods of inverse filter) result in BD methods with varying efficiency and performance.
The performance of BD methods in enhancing repetitive transients varies with the optimization metric used. Kurtosis is one of the most widely known of existing sparsity measures. Minimum entropy deconvolution (MED), recognized the first BD method developed by Wiggins, 32 is oriented towards maximizing the kurtosis of filtered signal. This process is realized through the OFM. Lee and Nandi 24 introduced the EVA technique to maximize the kurtosis, which is referred to as EVA-Kurt herein. The performance of EVA and OFM on impulse extraction was also compared. Since then, several variants of MED have been proposed. Endo and Randall 23 combined autoregressive model and introduced MED into rotating machine fault diagnosis. Sawalhi et al. 33 further improved MED by combining spectral kurtosis. Zhang and Hu 34 applied MED to the fault feature enhancement of planetary gears. McDonald et al. 35 proposed maximum correlated kurtosis deconvolution (MCKD) based on correlated kurtosis developed. McDonald and Zhao 36 then proposed MED with convolution adjustment and multipoint optimal minimum entropy deconvolution adjusted (MOMEDA), in which the definition of convolution of original MED was adjusted. The researchers further improved these classic MED variants. Cheng et al. 37 adopt particle swarm algorithm to optimize the filter coefficients of MED. However, kurtosis is extremely sensitive to outliers, thus tending to over-highlight dominant peaks of an input signal. These BD methods that use kurtosis and its variants as metrics more or less suffer from this issue. To overcome the reliance of MCKD and its variants on prior knowledge, Miao et al. 38 proposed an improved MCKD to estimate the fault period by iteratively calculating the autocorrelation of the envelope signal. Chen et al. 39 devised a waveform extension method to suppress the edge effect of MOMEDA and employed period modulation intensity to automatically estimate the fault period. However, the fault period is difficult to estimate accurately when the measured signals have a low signal-to-noise ratio.
NE is also popular in recent years among many sparsity measures. Entropy is a common concept in thermodynamics and informatics. Antoni 25 combined the NEs of the squared envelope and the squared envelope spectrum of filtered signal to characterize repetitive transients. Wang et al. 40 point out that kurtosis and NE both fit into the sum of weighted normalized square envelope. The key distinction between kurtosis and NE is whether the logarithm transformation is applied to form the weighting coefficients. Therefore, NE exhibits lower sensitivity to random shocks than kurtosis. Wang et al. 41 further constructed a Box-Cox sparsity measure (BCSM) from kurtosis and NE. By adjusting the transformation parameters, BCSM can obtain the performance between kurtosis and NE in fault diagnosis. NE is proven to be the best choice in BCSM and outperforms kurtosis to quantify the sparsity of fault-related repetitive transients in bearing fault diagnosis. A recent work derives a BCSM-guided BD method based on EVA, 42 from which the NE-guided BD method based on EVA (EVA-NE) can be derived. Peeters et al. 29 innovatively considered the sparsity indicators of the envelope spectrum as an optimization metric. The BD methods guided by spectral NE, spectral l2/l1 and spectral Hoyer index were developed, respectively. The BD method guided by time-domain NE was used for comparison, but the optimization technique employed was not explicitly stated.
The computational efficiency of the BD methods also varies with the optimization techniques used. Theoretically, any sparsity measure can be chosen as an optimization metric due to the inherent impulsiveness of the bearing fault signal. However, the object function used in OFM is required to be derivable. Some excellent indicators cannot be directly as an optimization metric to construct BD method. Compared with OFM, EVA has fewer requirements for optimization metrics and is easier to implement. However, as the length of the filter increases, the dimensionality of the cross-cumulative matrix and autocorrelation matrix increases, resulting in increased computational cost for EVA.29,43 For some signals with long length or complex components, to ensure the performance of BD in enhancing fault features, a longer filter length is required. At this scenario, EVA is obviously not an advisable choice from the perspective of computational cost.
Although many researchers have achieved fruitful results on BD, there are still some deficiencies. The kurtosis-guided BD methods are vulnerable to random impulse noise. EVA calculation takes a long time when the filter length is long. To address these issues, we investigate a cost-effective NE-guided BD method based on OFM, called maximum negative entropy deconvolution (MNED). Table 1 lists all four BD methods based on EVA or OFM and guided by kurtosis or NE: EVA-Kurt, EVA-NE, MED and MNED. To the best of the author’s knowledge, there have been no systematic comparative studies for these four methods. The main innovations and contributions of this paper are as follows:
1) The OFM is adopted to maximize NE of time domain signal, which derives a novel BD method, coined MNED. A comprehensive comparison of the performance of EVA-Kurt, EVA-NE, MED and MNED is conducted.
2) The effectiveness of MNED in enhancing repetitive transients is validated by simulated and measured faulty bearing signals. The advantages of MNED in fault detection and computational efficiency are illustrated by quantitative comparison.
3) The performance evaluation of MNED under different filter lengths and random shocks is carried out, as well as the comparison with three existing BD methods.
Comparison of three typical BD methods and the proposed method.
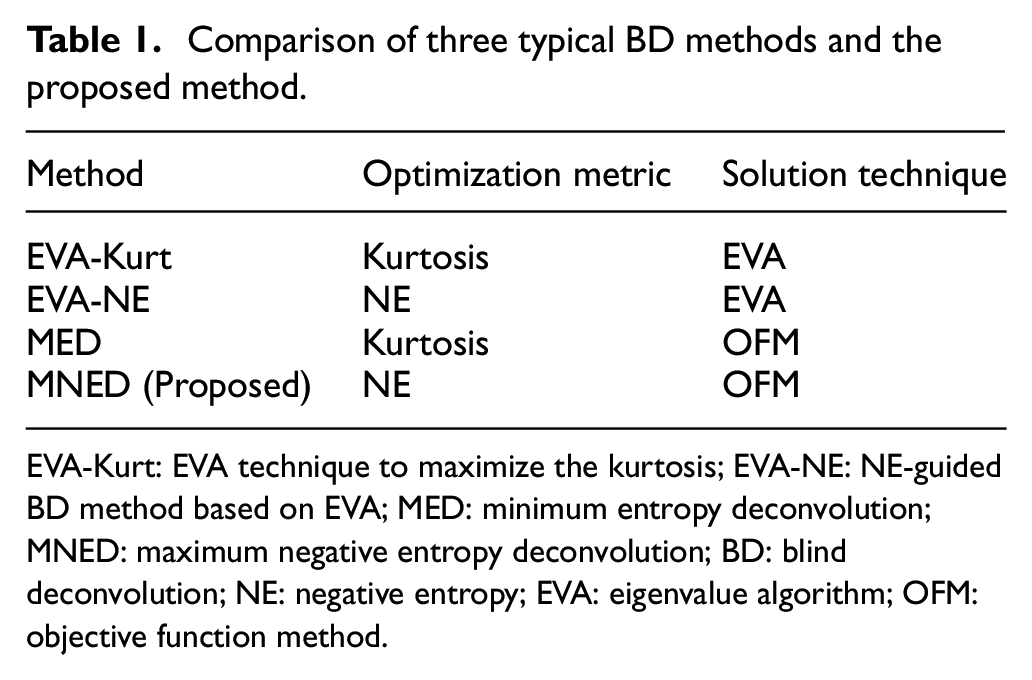
EVA-Kurt: EVA technique to maximize the kurtosis; EVA-NE: NE-guided BD method based on EVA; MED: minimum entropy deconvolution; MNED: maximum negative entropy deconvolution; BD: blind deconvolution; NE: negative entropy; EVA: eigenvalue algorithm; OFM: objective function method.
The remainder of this paper is organized as follows. The theory of BD and three classical BD methods are introduced in Section ‘Introduction’. In Section ‘Theoretical Background’, the theory and implementation procedure of MNED are introduced in detail. Section ‘Proposed Method: Maximum Negative Entropy Deconvolution’ conducts bearing fault signal simulation and illustrates the effectiveness of proposed method. In Section ‘Simulation Analysis’, the proposed method is validated using experimental signals collected from two different railway axle bearing test rigs, respectively. And the conclusions are drawn in Section ‘Experimental Results’.
Theoretical background
In this section, the theoretical background and practical framework of BD is illustrated. Three BD methods for comparative studies, MED, EVA-Kurt and EVA-NE, are also described.
BD problem statement
BD aims to construct an inverse filter to recover the cyclic impulses from a complex observed signal. The collected vibration signal

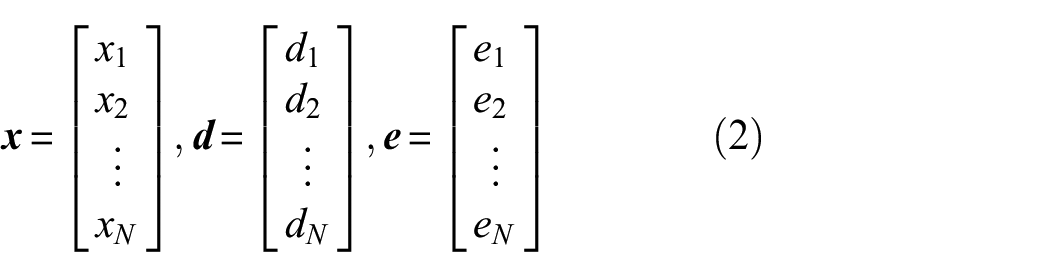
where * denotes the convolution operation, N is the length of signal,
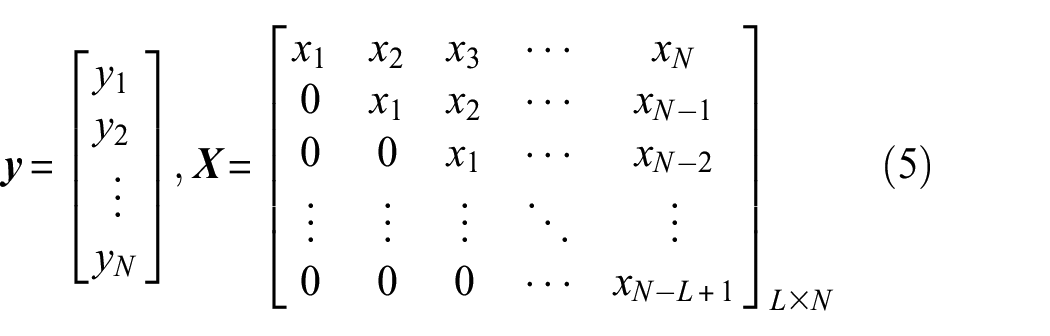
As shown in Figure 1, the purpose of BD is to design an optimal inverse filter

where

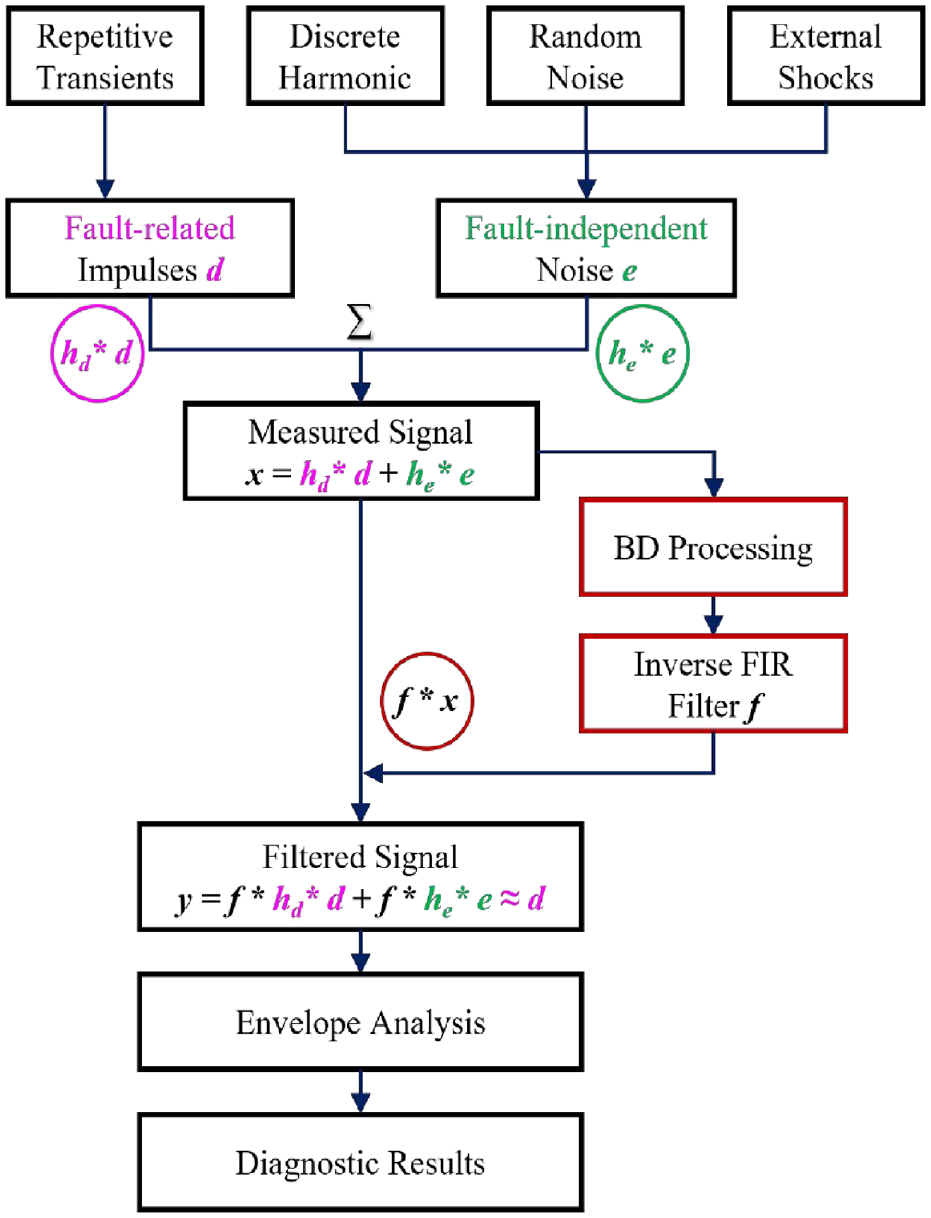
The BD process for bearing condition monitoring.
Minimum entropy deconvolution
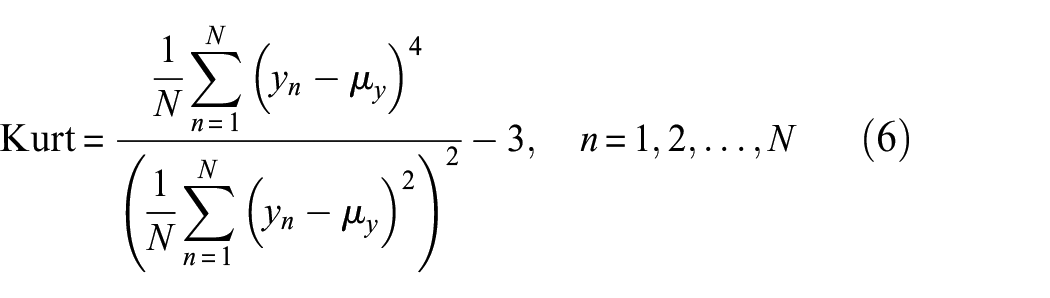
MED maximizes the kurtosis of the output signal through OFM. Kurtosis of the filtered signal is defined as
The filtered signal
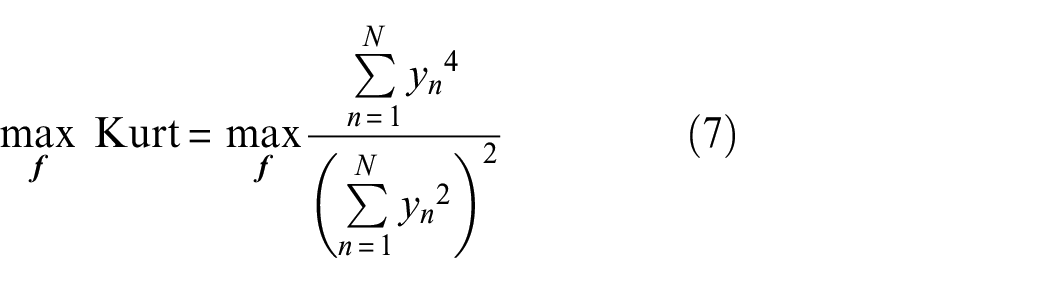
By solving for the zero of the derivative of kurtosis with respect to the filter coefficients,
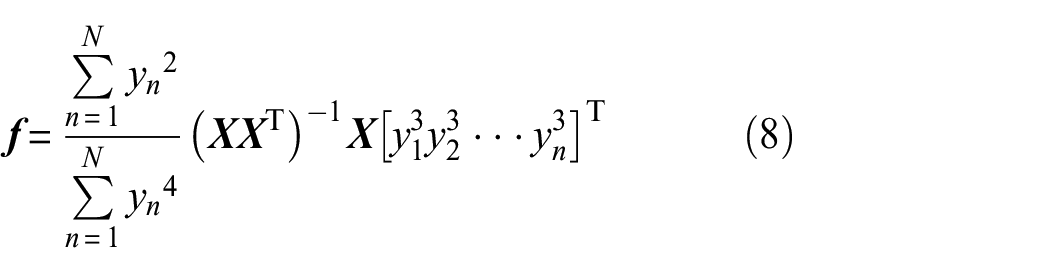
The detailed solution procedure is described in reference Endo and Randall,
23
the filter coefficient
EVA-Kurt and EVA-NE
This section describes two typical BD methods using EVA: EVA-Kurt and EVA-NE.
The kurtosis can be rewritten as
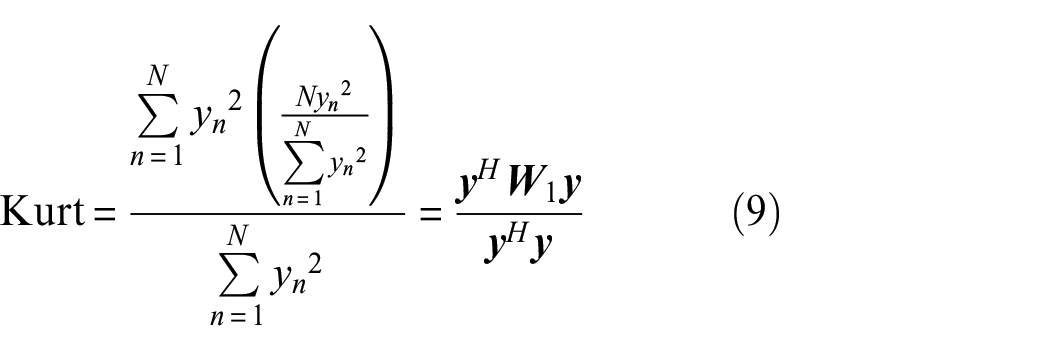
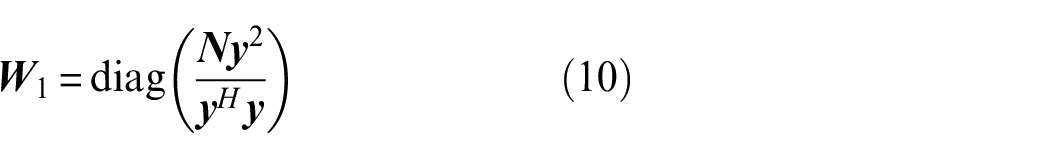
where
Substituting Equation (4) in Equation (9), and rearranging Equation (9) into a form of generalized Rayleigh quotient, as follows:
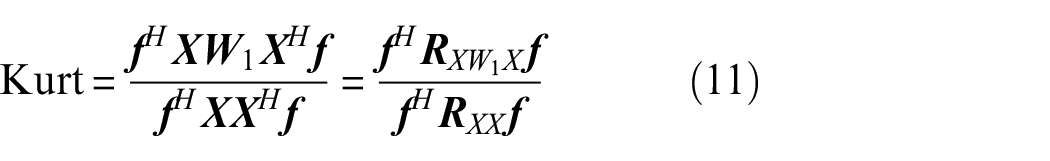
where
Maximizing kurtosis with respect to

The solution process is described in detail in references Peeters et al. 29 and Buzzoni et al. 43
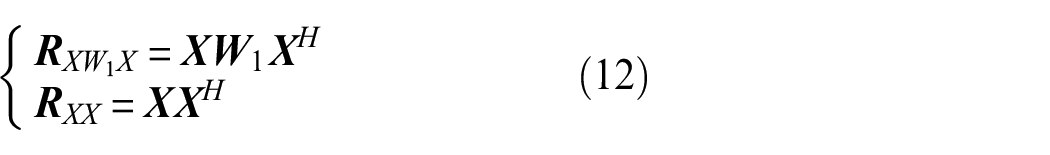
Similarly, rewriting NE of the filtered signal as
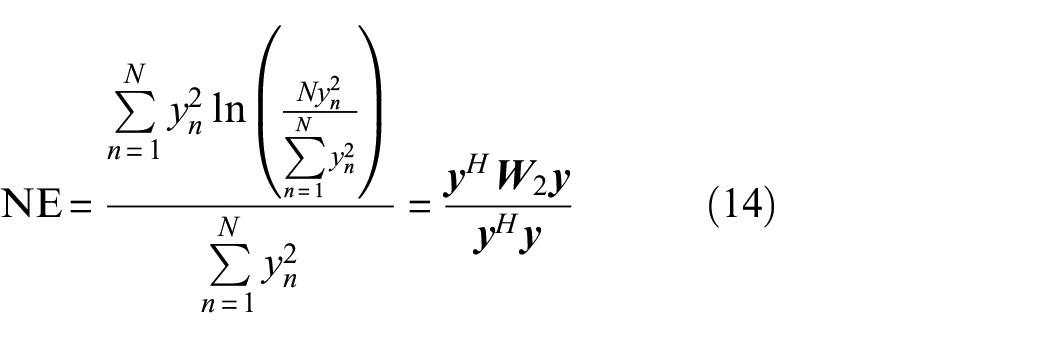
where
Further rearranging as
Comparing the weight matrices and their derived correlation matrices, it can be found that the difference between EVA-Kurt and EVA-NE is whether logarithmic operations are performed in the weight calculation, which is consistent with the conclusion obtained in reference Wang et al. 40
Proposed method: MNED
In this section, MNED is theoretically derived, and its algorithm flow is provided.
Maximum negative entropy deconvolution
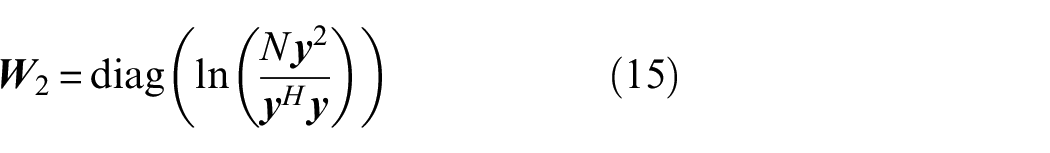
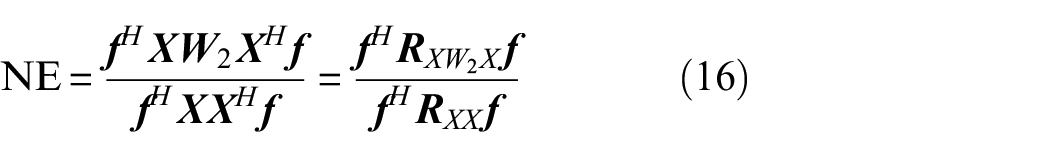
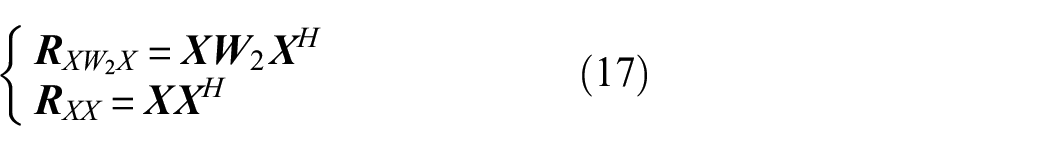
The aim of MNED is to maximize the NE of filtered signal by solving the optimal Finite Impulse Response (FIR) filter
where
where
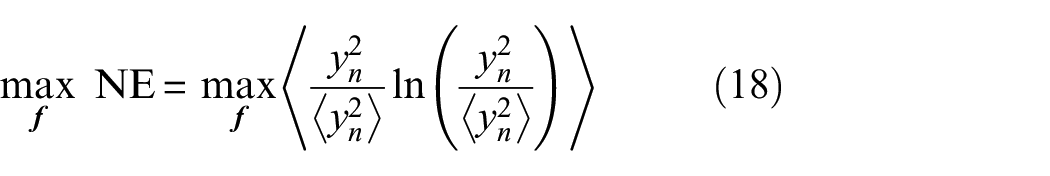
As shown in Equation (18), NE mainly consists of two terms:
First, find the derivative of each term with respect to

Then, the derivative of NE can be expressed as
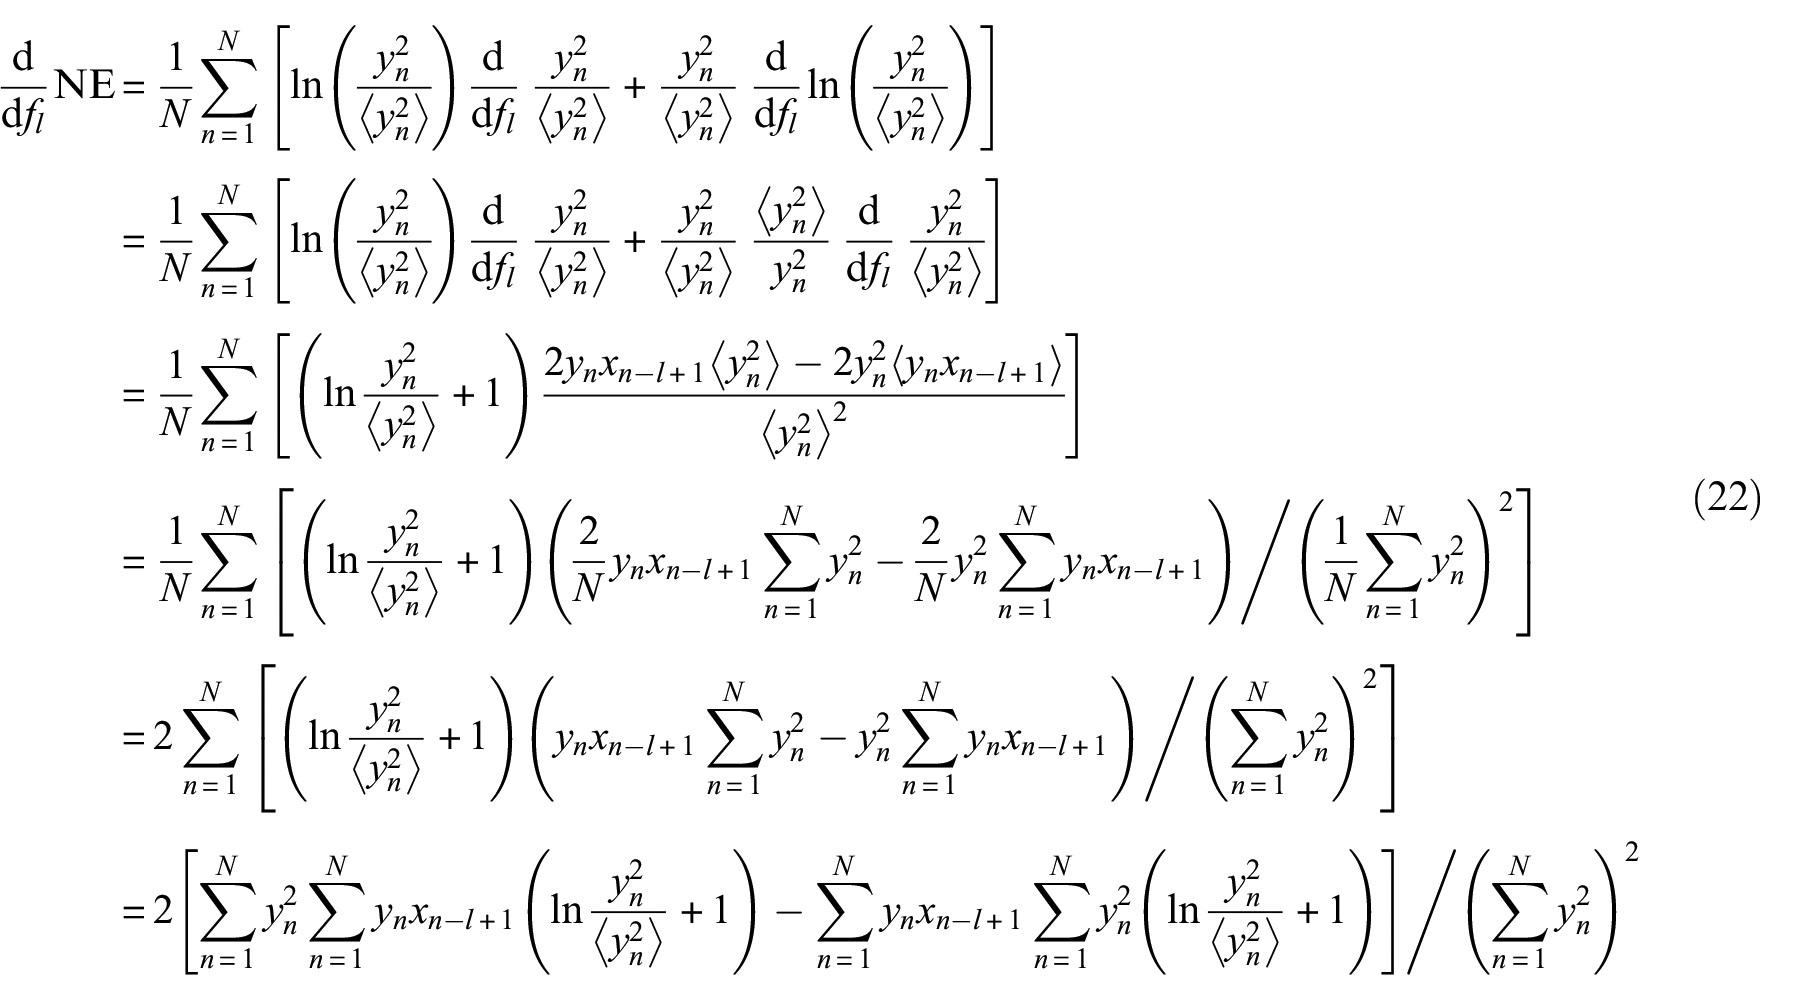
To rewrite Equation (22) in matrix form, referring to McDonald’s solution, 35 we set
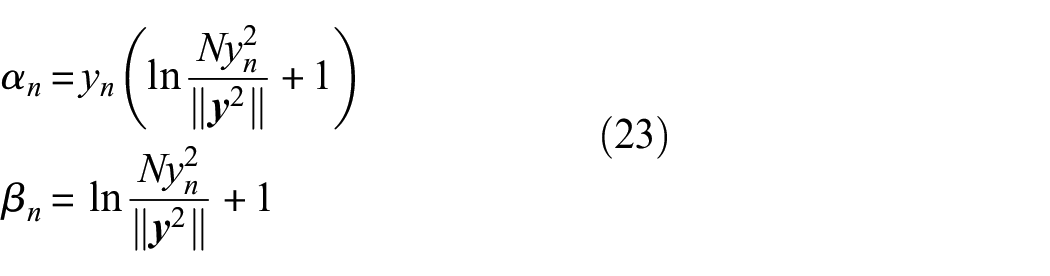
Substituting Equation (23) into Equation (22),
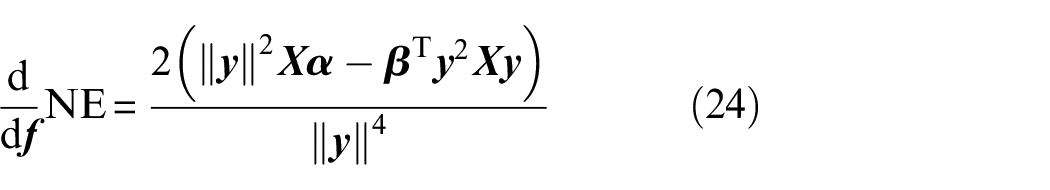
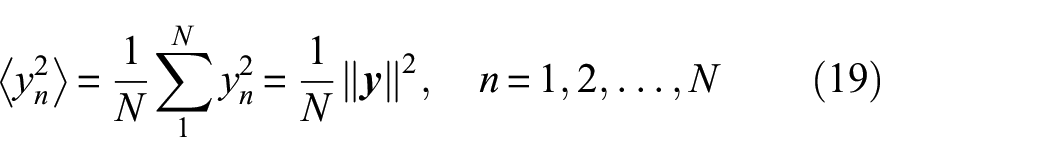
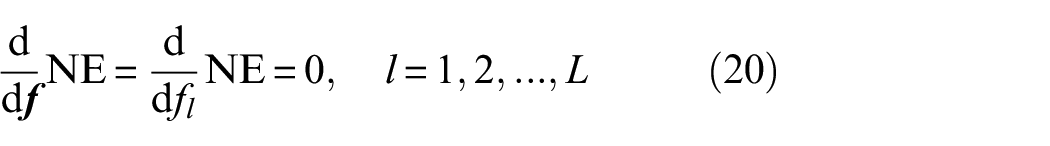
Accordingly, rewriting Equation (20)

And substituting the relation

Finally, we can get the optimal filter
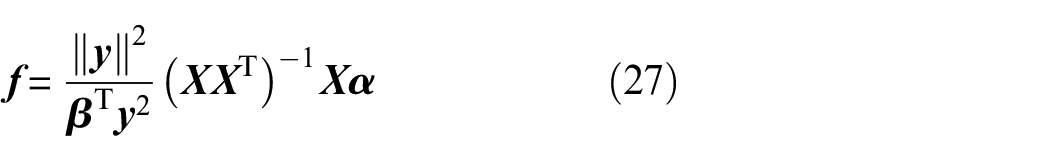
Equation (27) is the iterative update formula of the inverse filter of MNED method. By estimating the initial guess of the filter
Implementation procedure
Based on the above theoretical derivation, a flowchart of the proposed MNED method is presented in Figure 2, and the implementation process of MNED is summarized as follows:
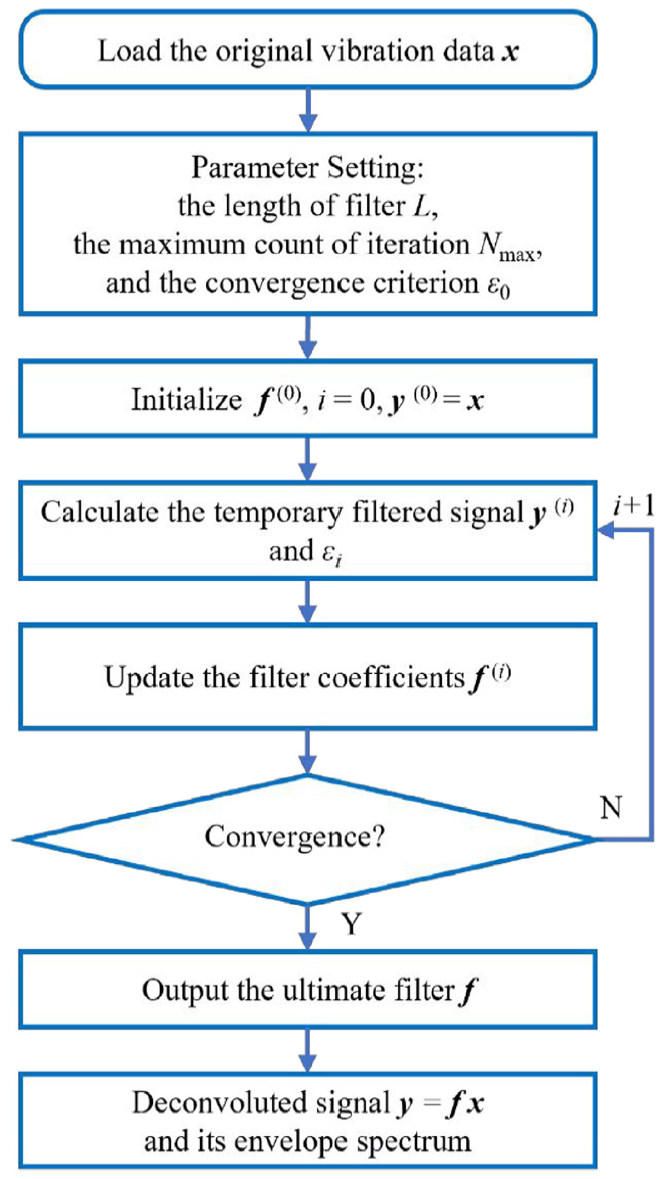
Flowchart of proposed MNED.
Simulation analysis
In this section, the effectiveness of MNED is verified with a simulation case. The maximum number of iterations is set to 100. The filter length varies from 10 to 50. The time consumption and performance of MNED are compared with three existing methods of MED, EVA-Kurt and EVA-NE under different filter lengths.
To demonstrate the effectiveness of MNED, a simulated outer race fault signal is investigated. As displayed in Figure 3, the bearing fault signal model

where t is the time sequence,
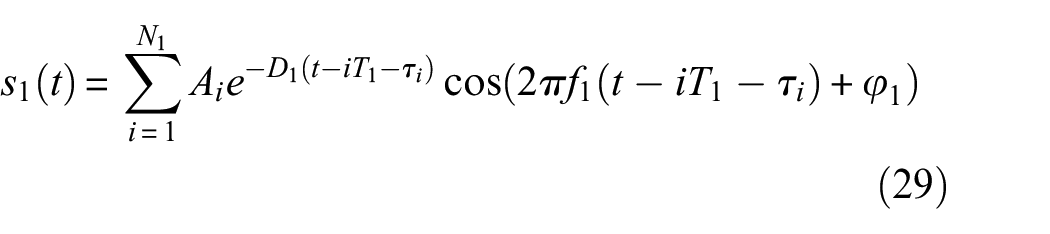
where N1 is the number of fault-induced impulses. T1 = 1/fo is the nominal fault period and fo is the fault characteristic frequency. Ai and
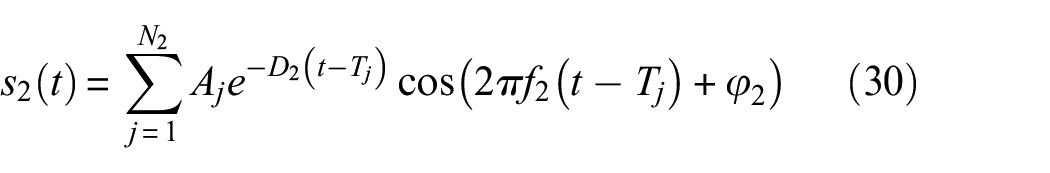
where N2 is the number of external shocks. Aj and Tj denote the random amplitude and the time of occurrence of the jth shock, respectively. f2, D2 and
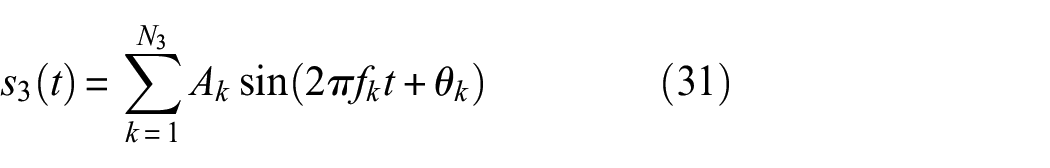
where N3 is the number of harmonic interferences. Ak, fk and
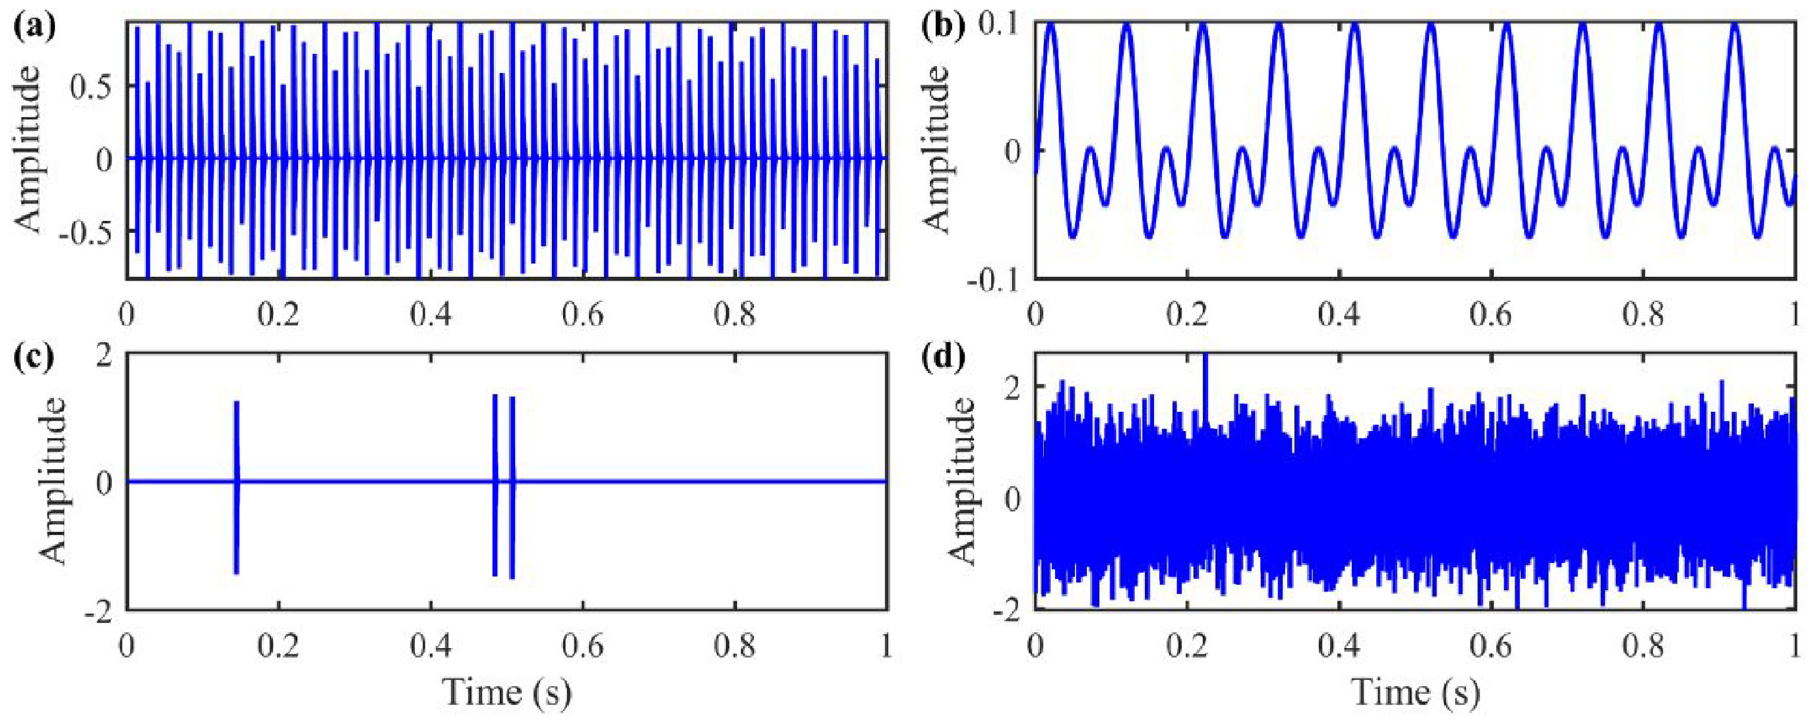
Simulated signal components: (a) fault-induced impulses, (b) interference harmonic, (c) external shocks and (d) random noise.
Parameters of the simulation bearing fault signal.
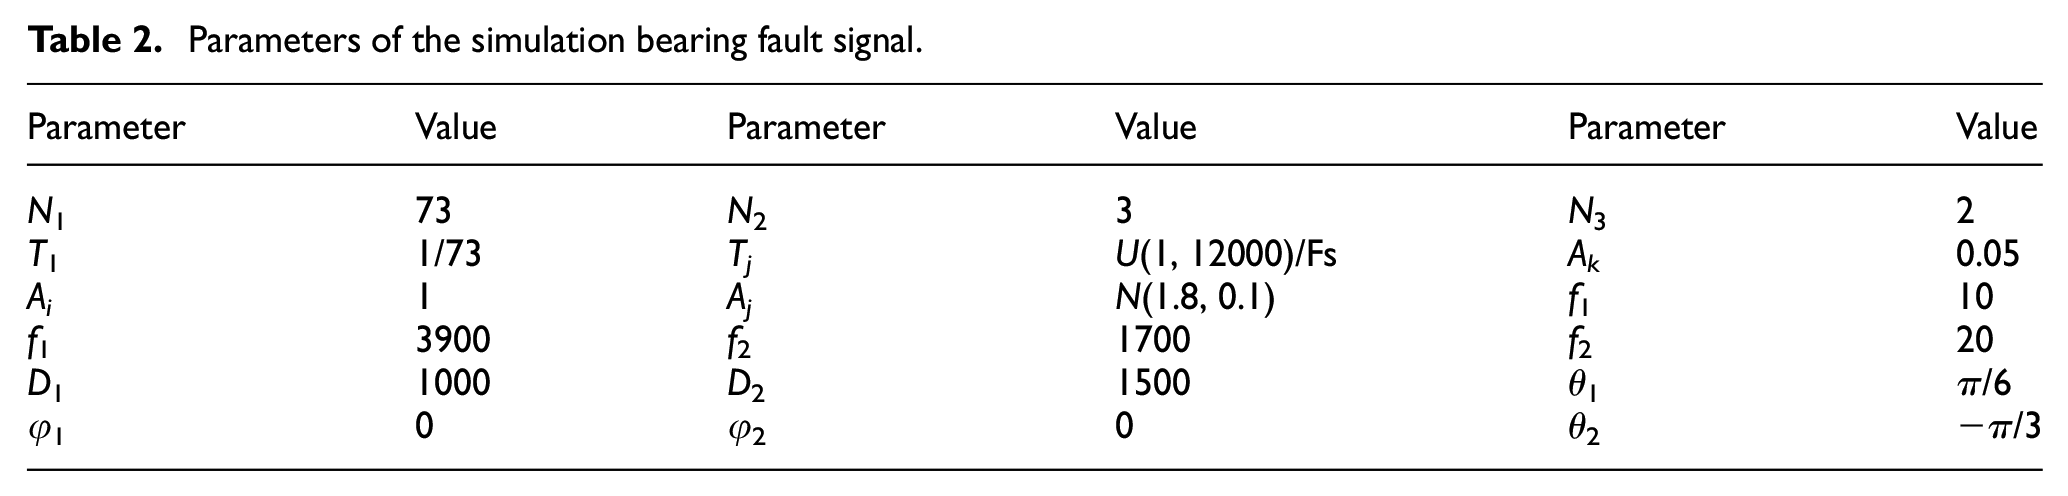
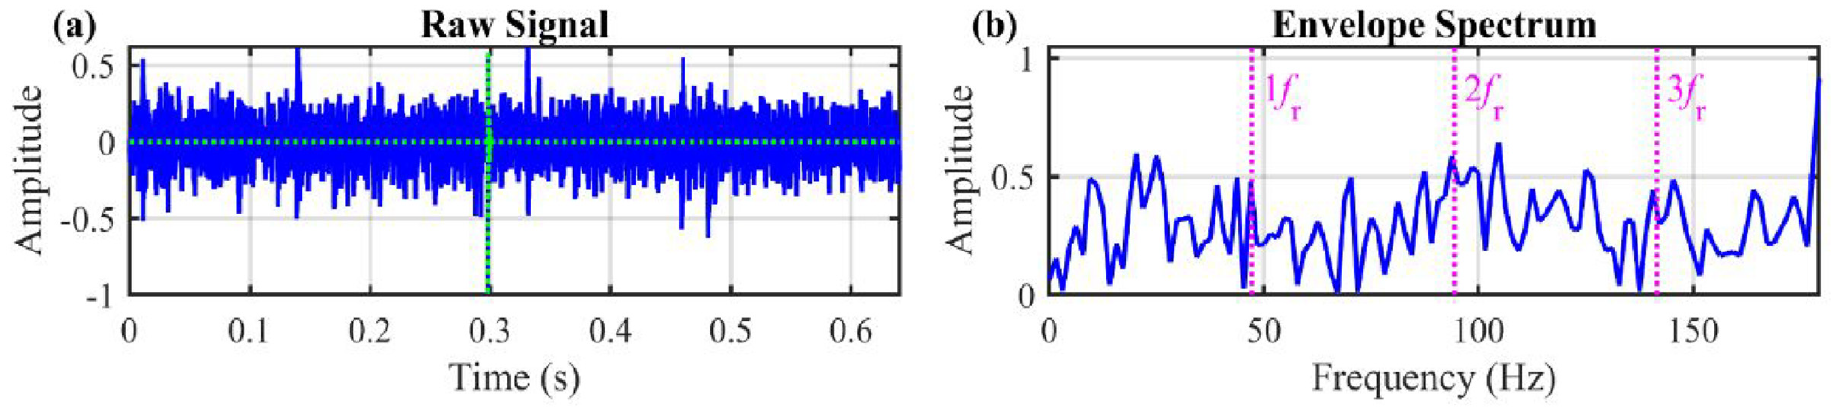
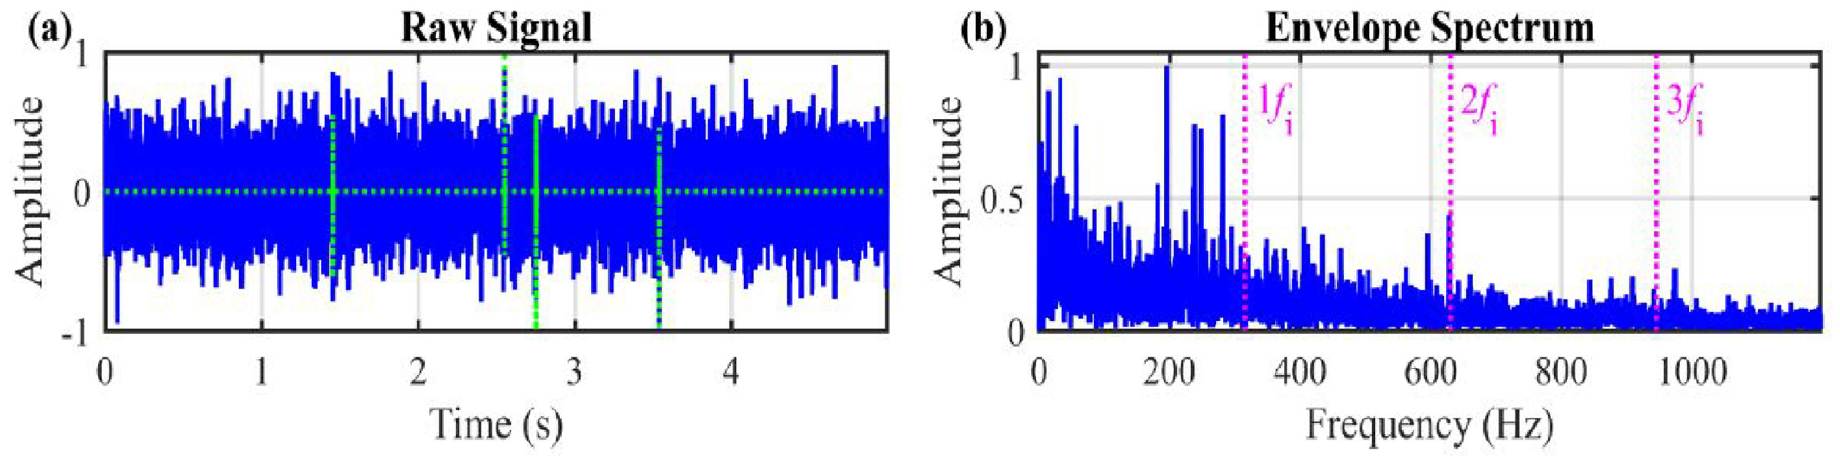
Figure 4 displays the waveform and envelope spectrum of the synthesized fault signal. The green dotted lines depict the external shocks. The magenta dashed lines indicate the corresponding characteristic frequencies and their harmonics (same below). The fault-independent noise components in the envelope spectrum exhibit considerable amplitudes, which increases the difficulty of fault identification.
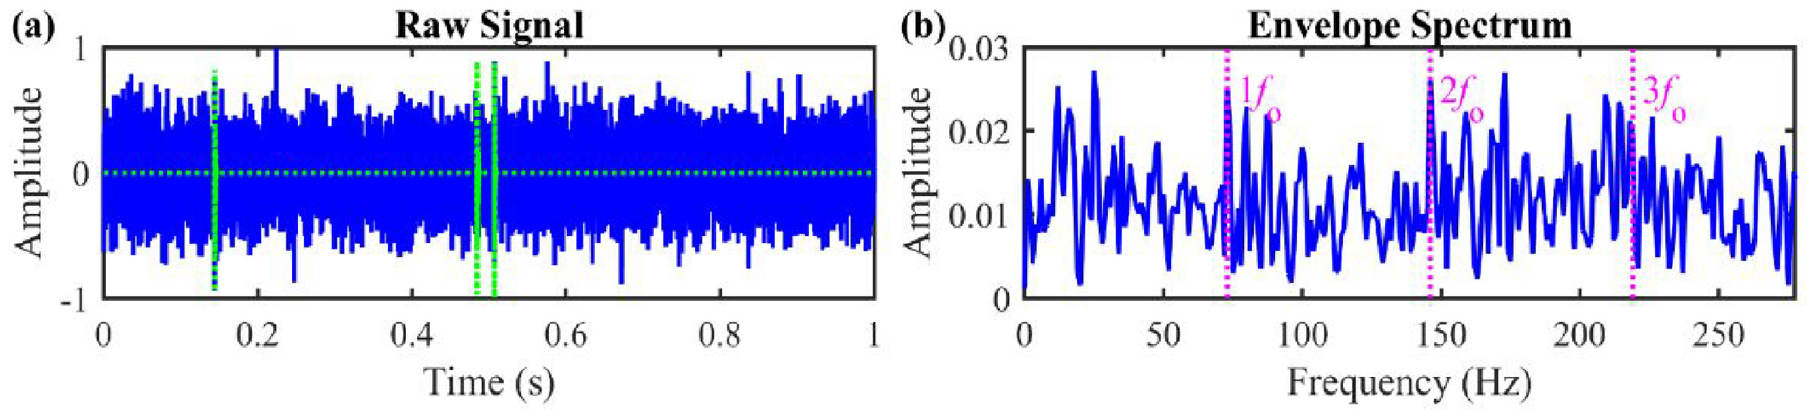
(a) Waveform and (b) its envelope spectrum for the simulation case.
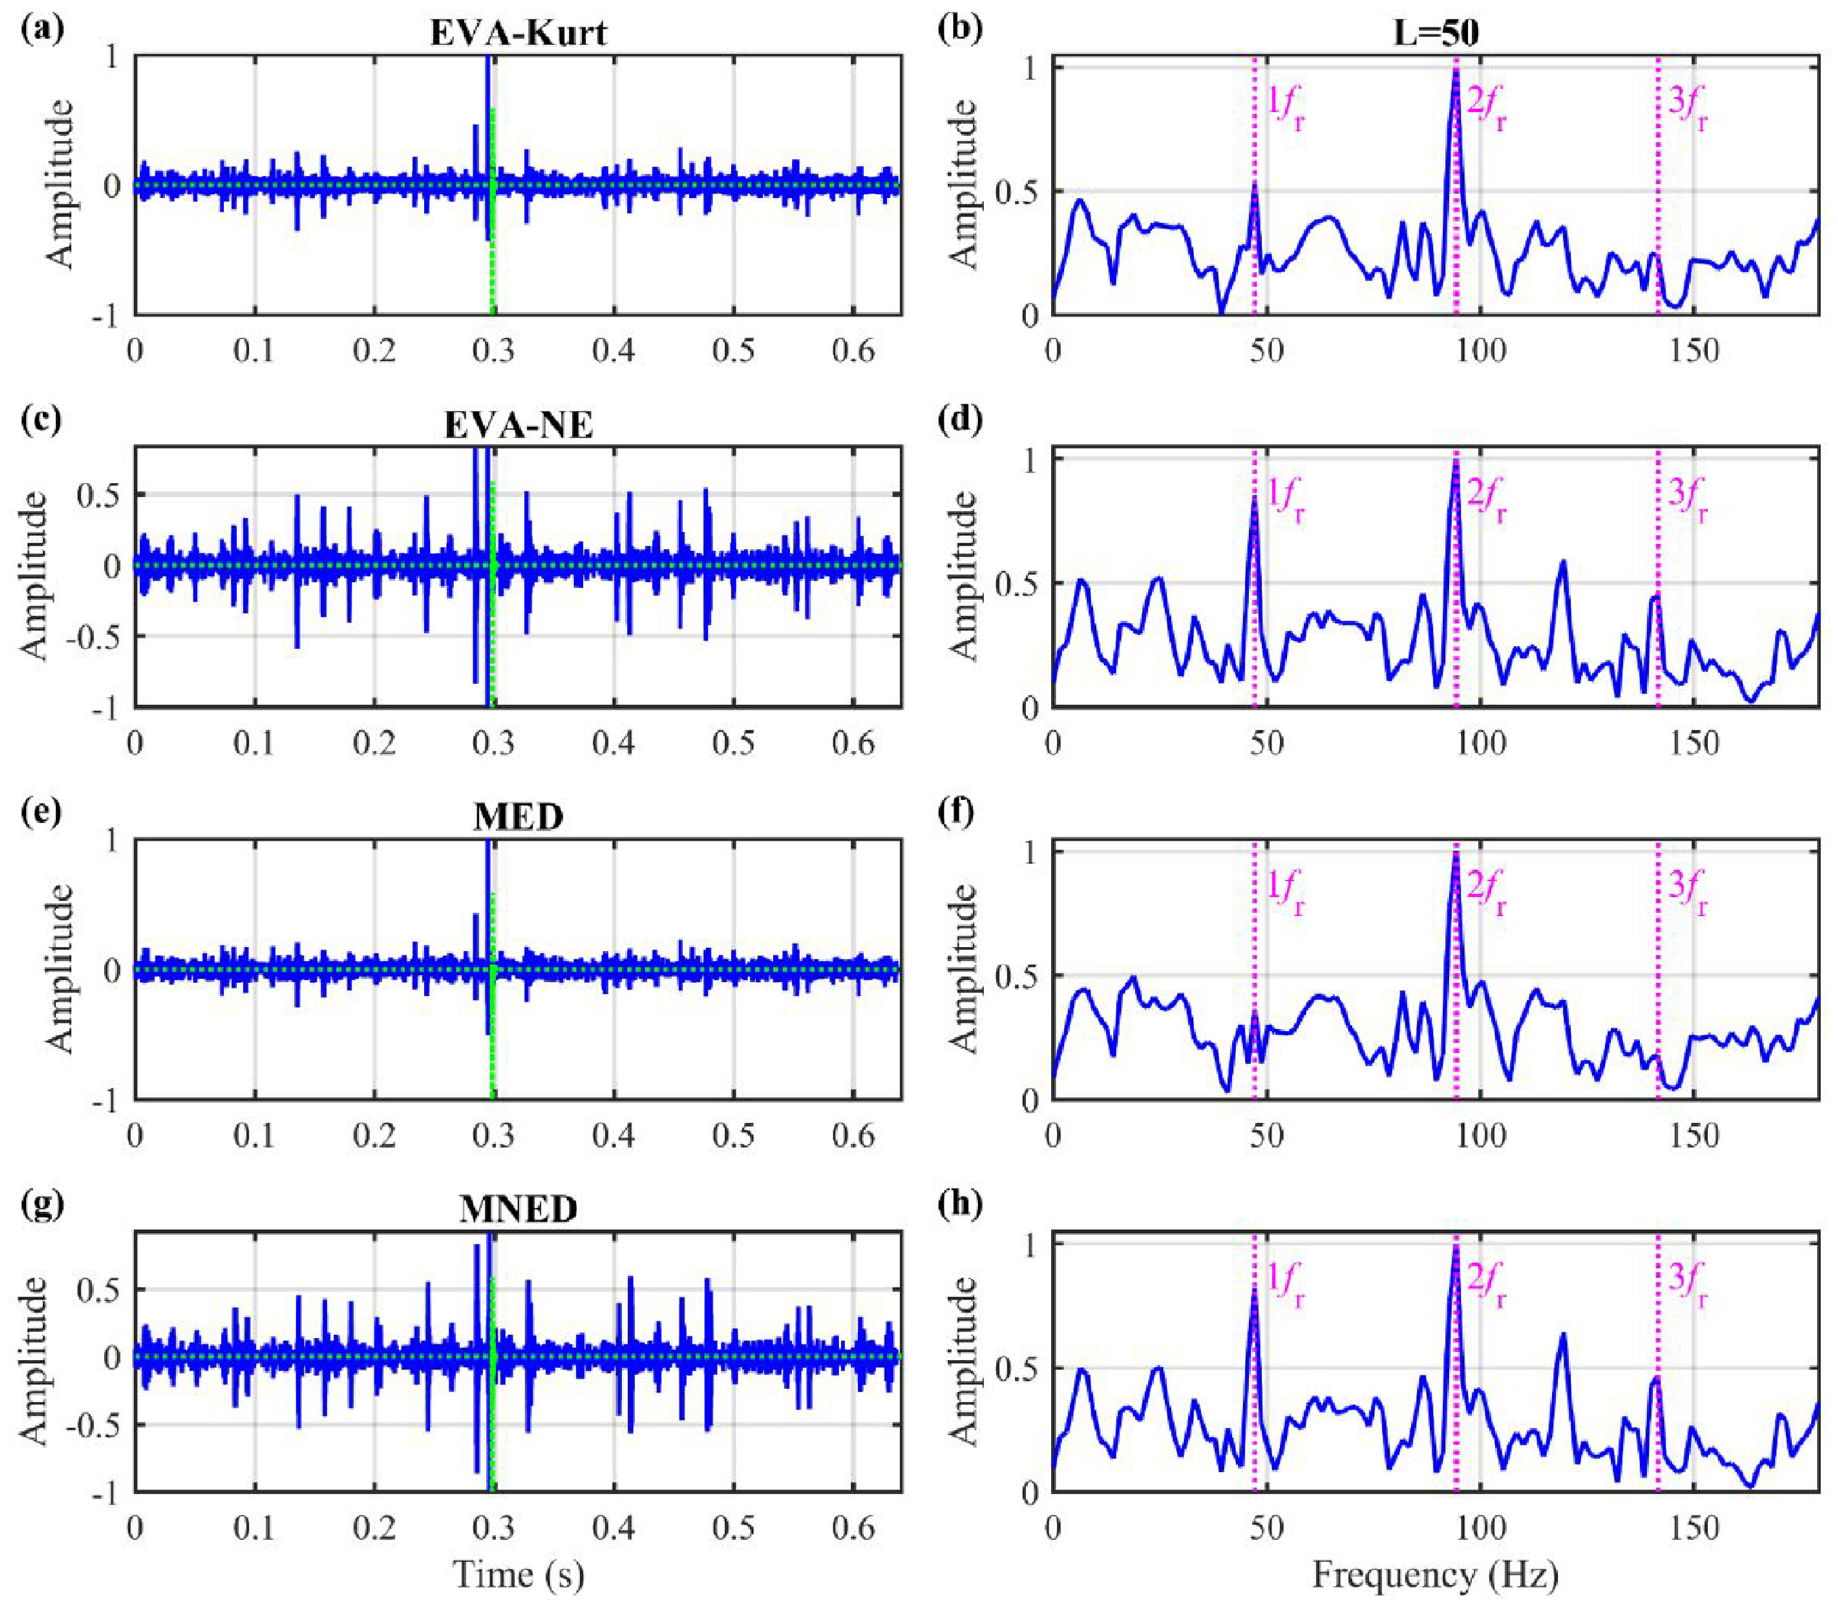
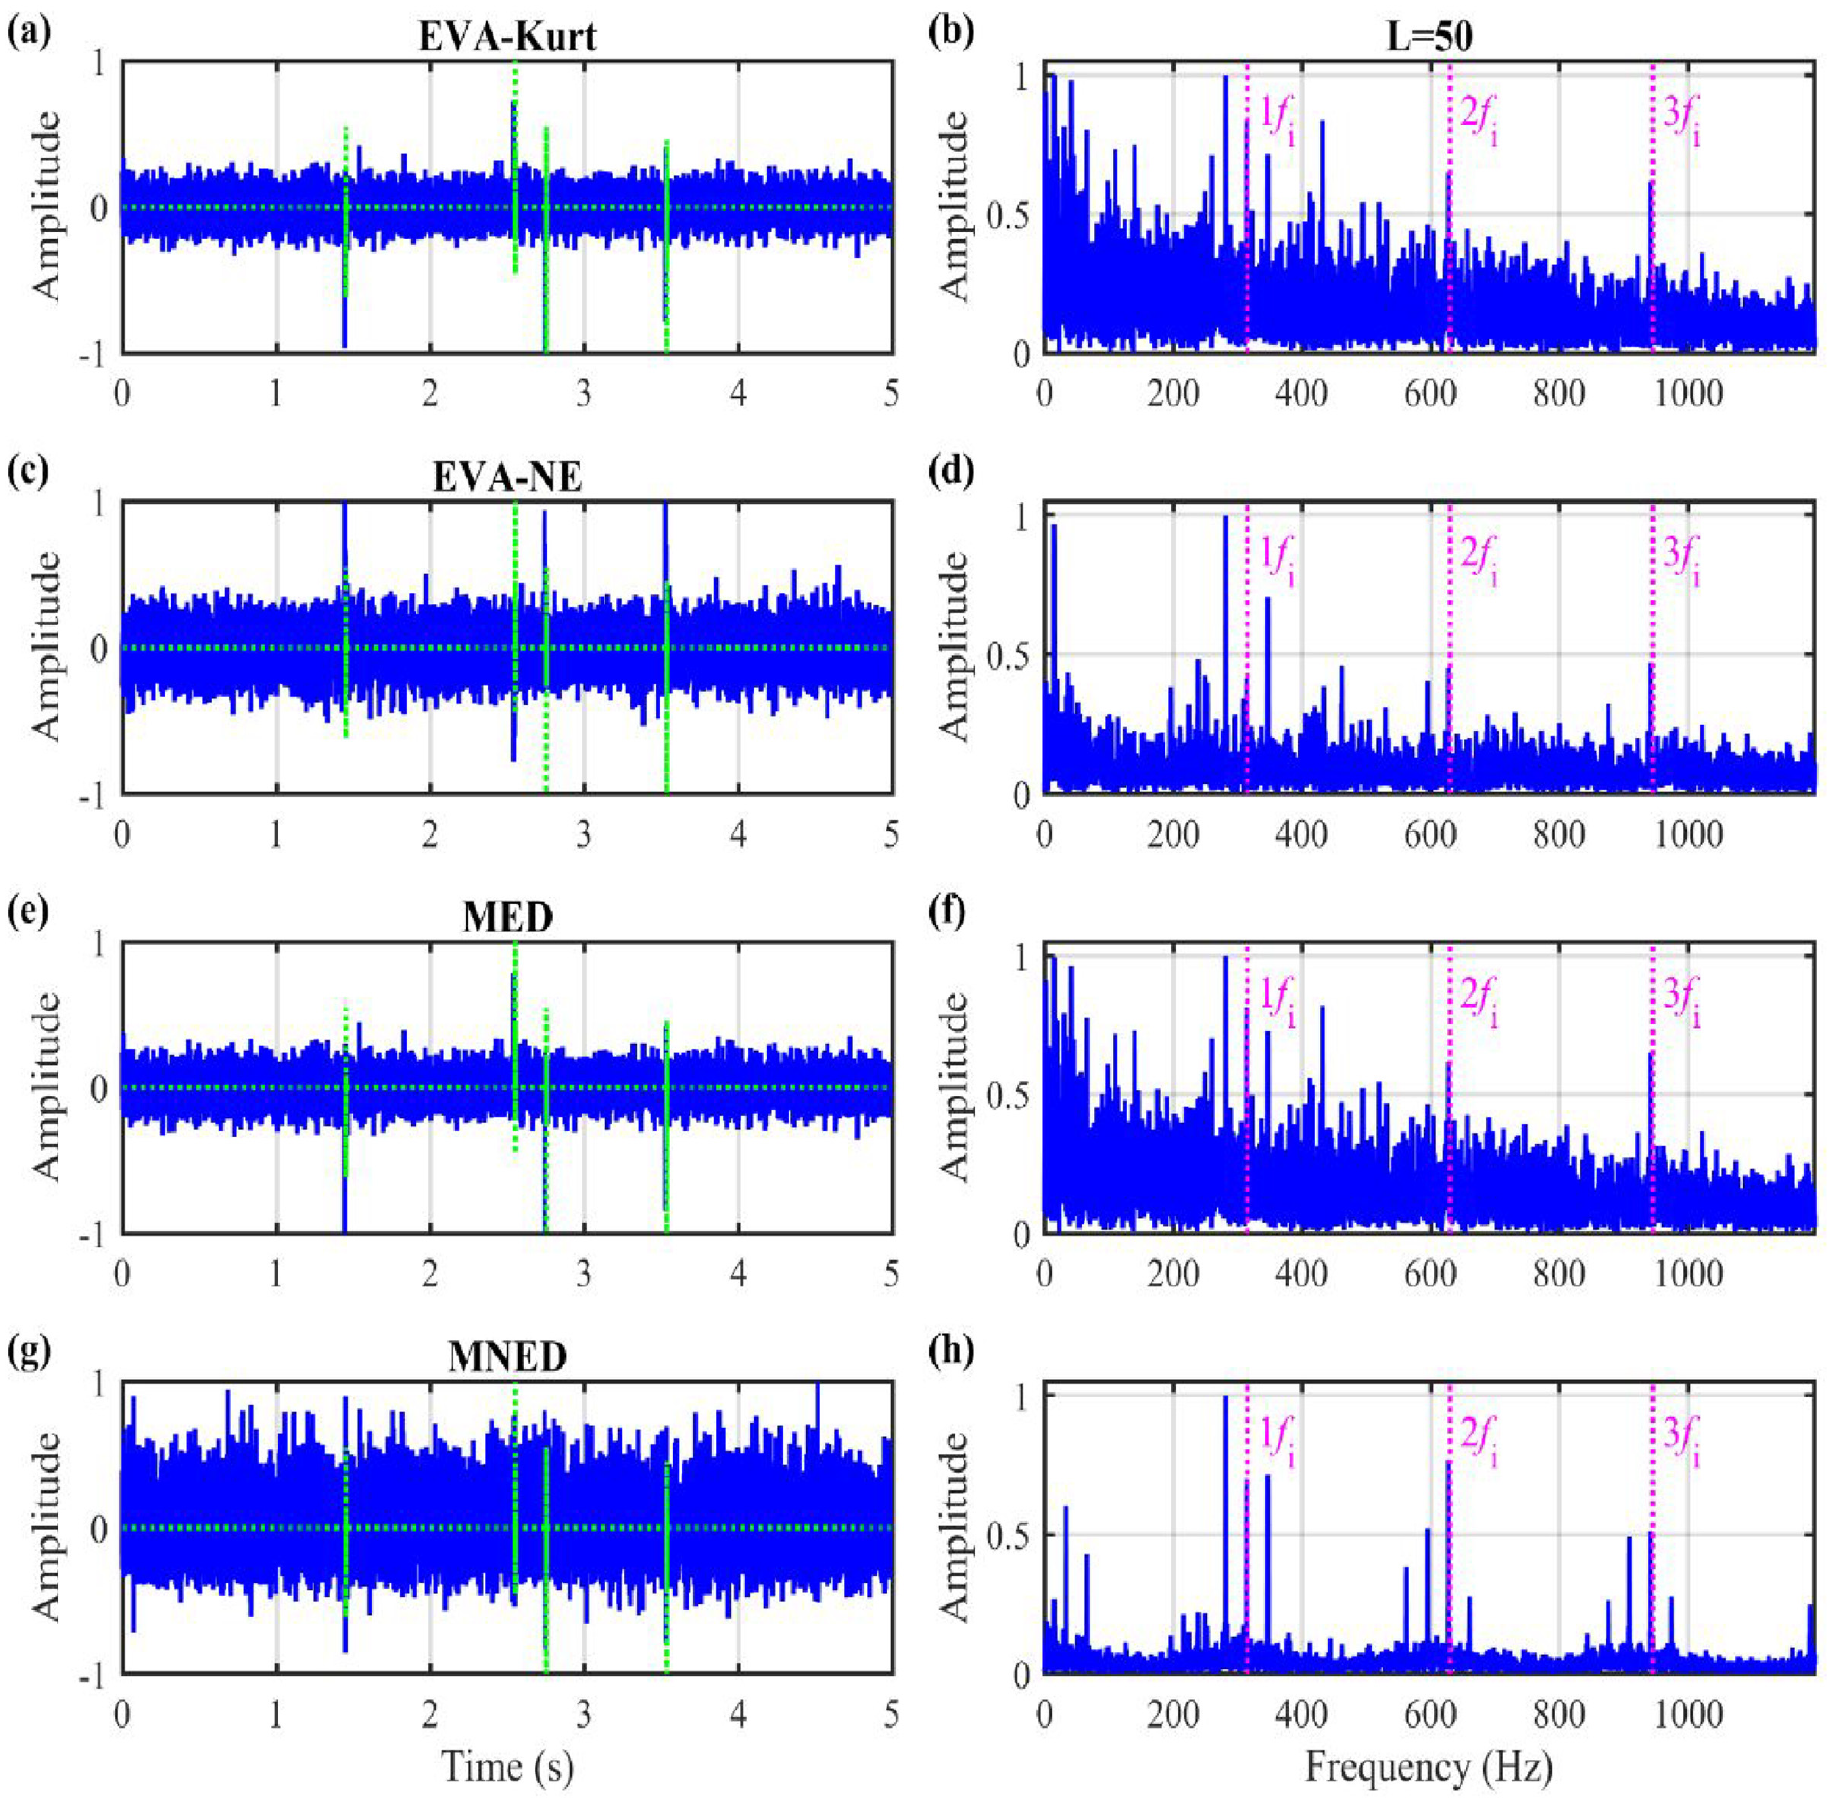
Figure 5 depicts the deconvolution results of the three BD methods and the proposed MNED when the filter length is 10. As shown in Figure 5(d) and (h), fo and its harmonics are the main components in the filtered envelope spectra obtained by the EVA-NE and MNED. And compared with original envelope spectrum in Figure 4(b), the fault-independent frequency components are significantly reduced. However, as shown in Figure 5(b) and (f), there is no clear peak at the fo and its harmonics in the filtered envelope spectra obtained by the EVA-Kurt and MED. The two kurtosis-guided methods fail to detect the simulated outer race fault, when the filter length is 10.
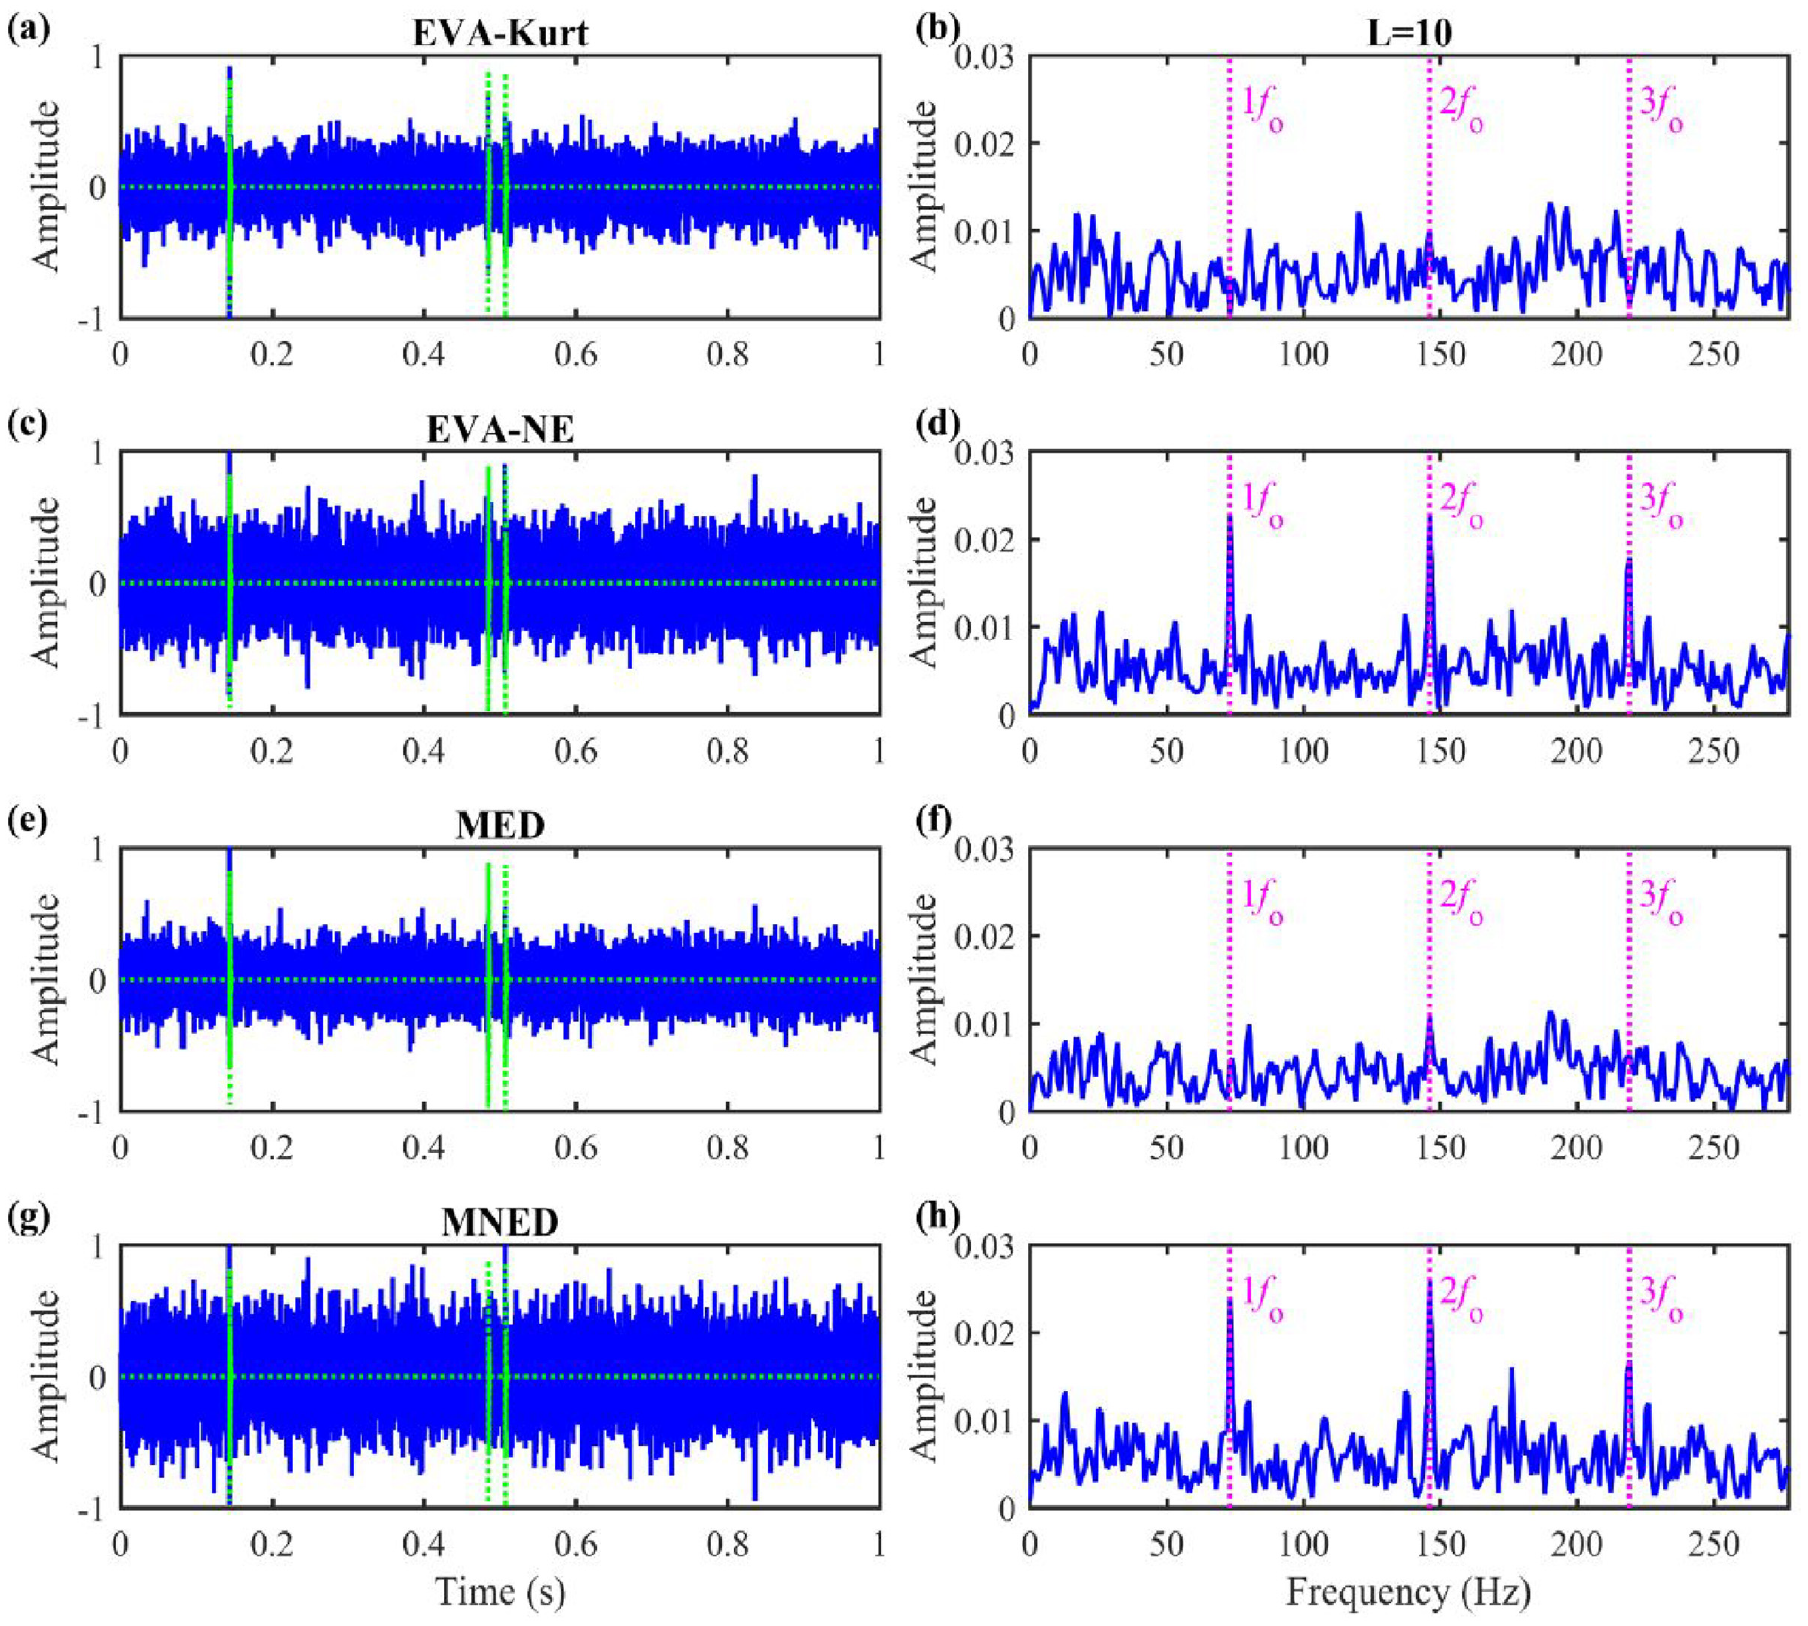
Filtered signals (L = 10) and their envelope spectra for the simulation case: (a) and (b) EVA-Kurt, (c) and (d) EVA-NE, (e) and (f) MED and (g) and (h) MNED.
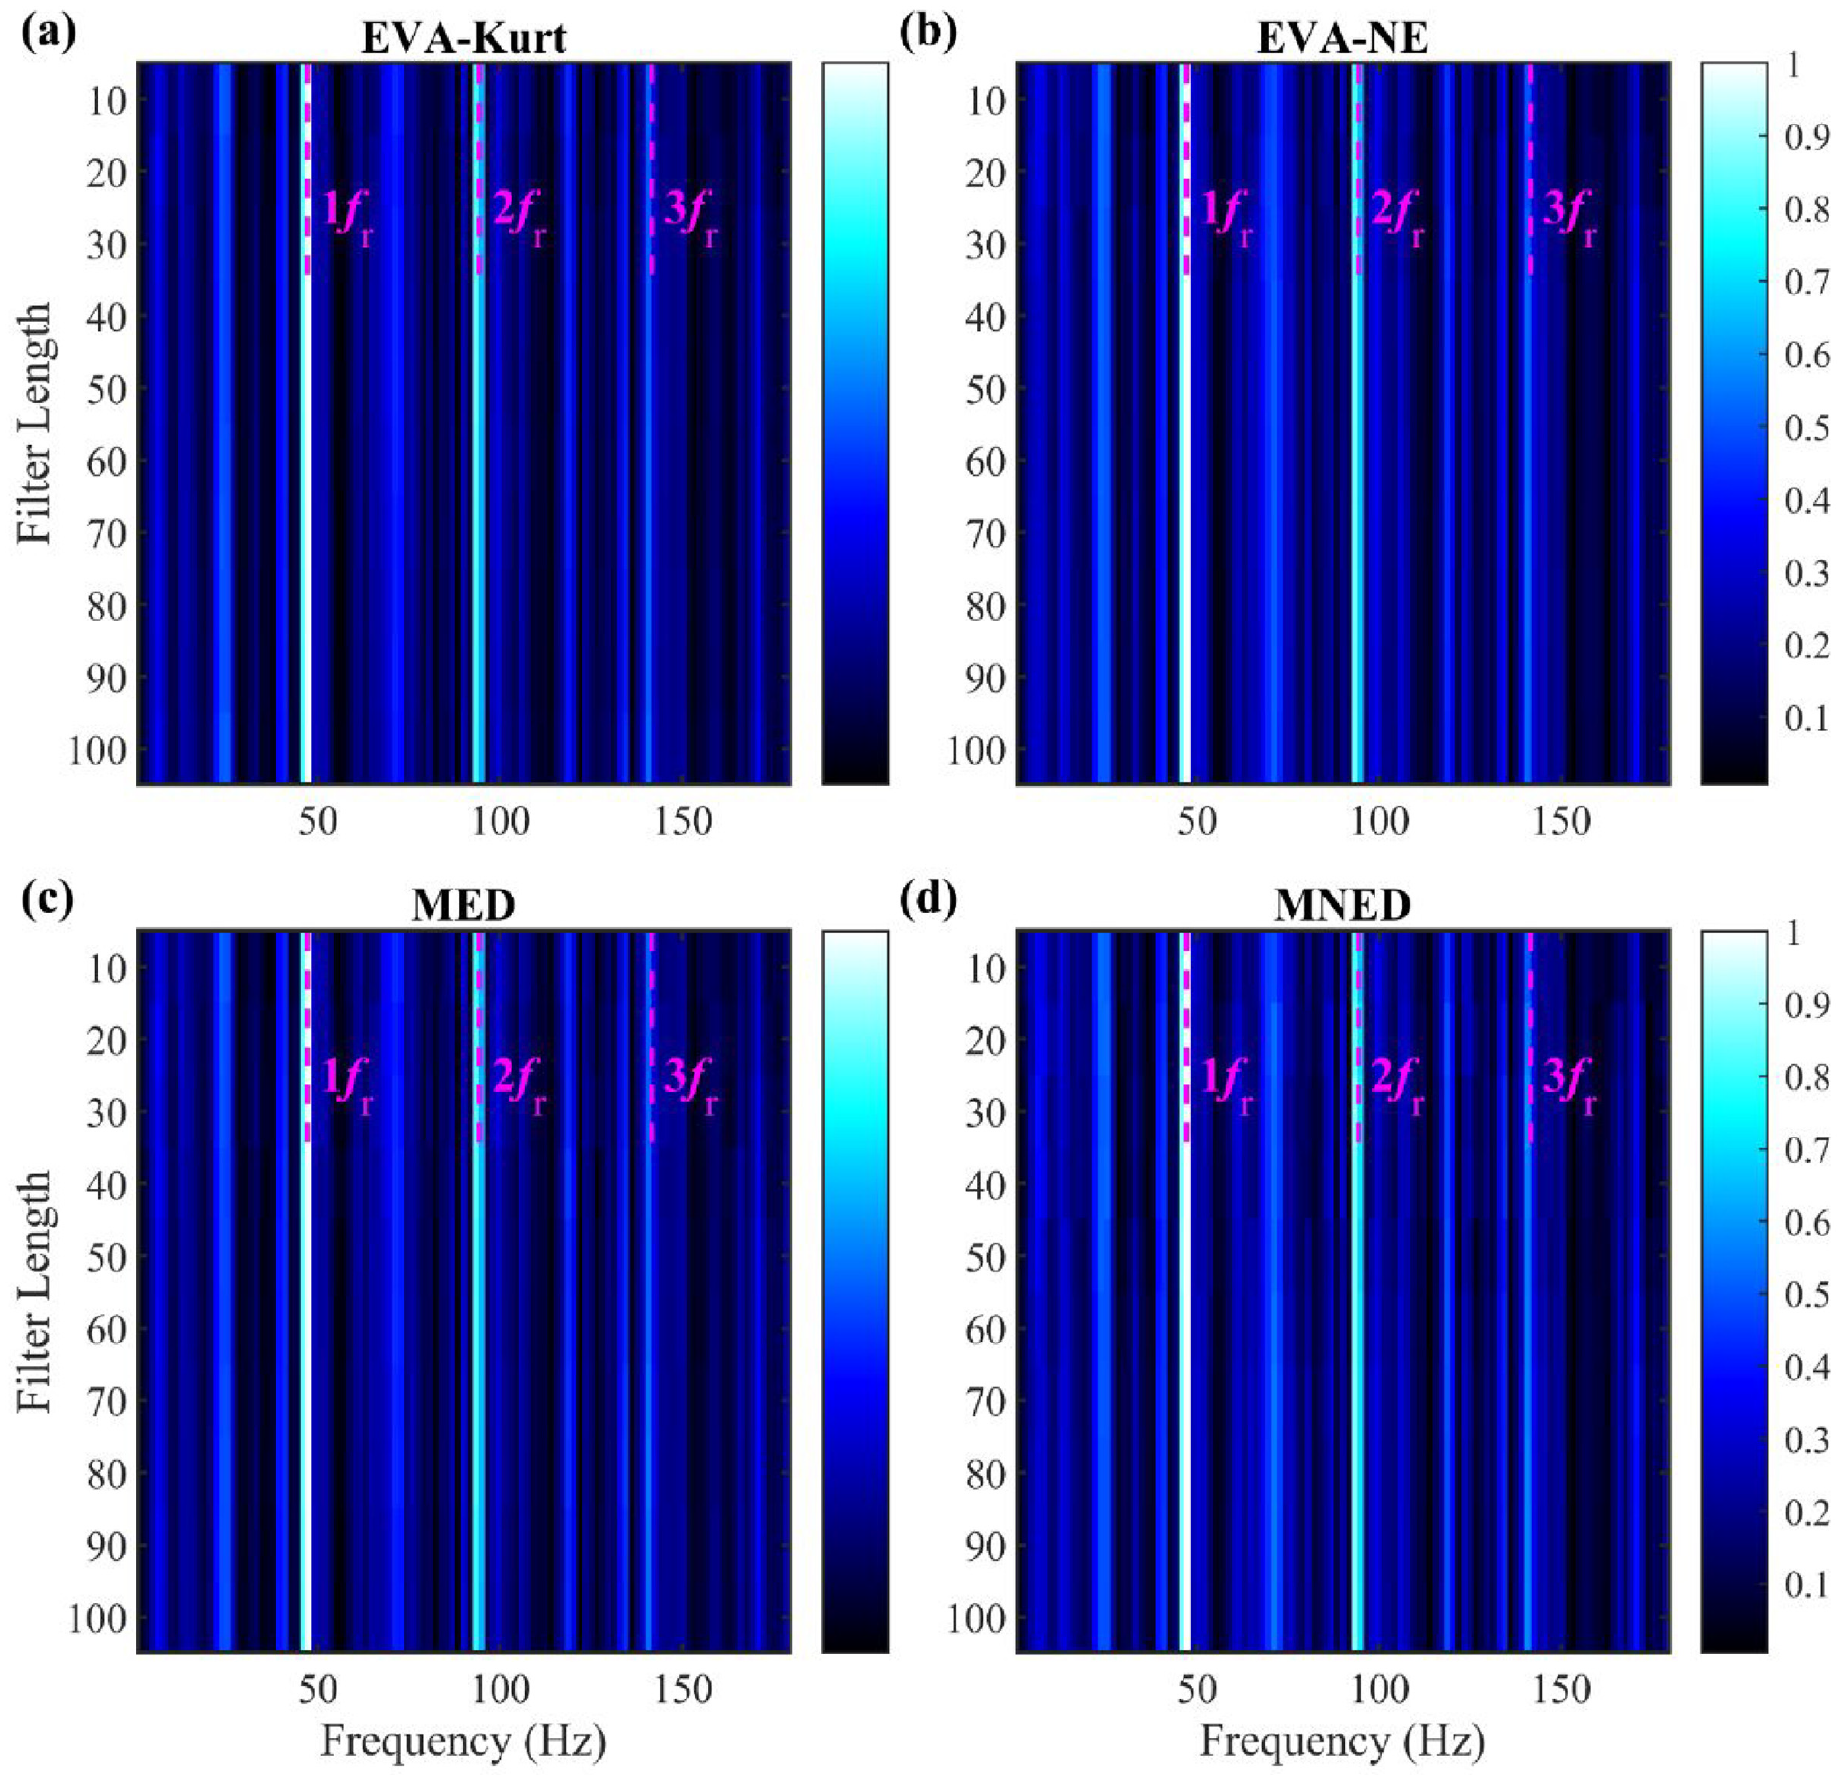
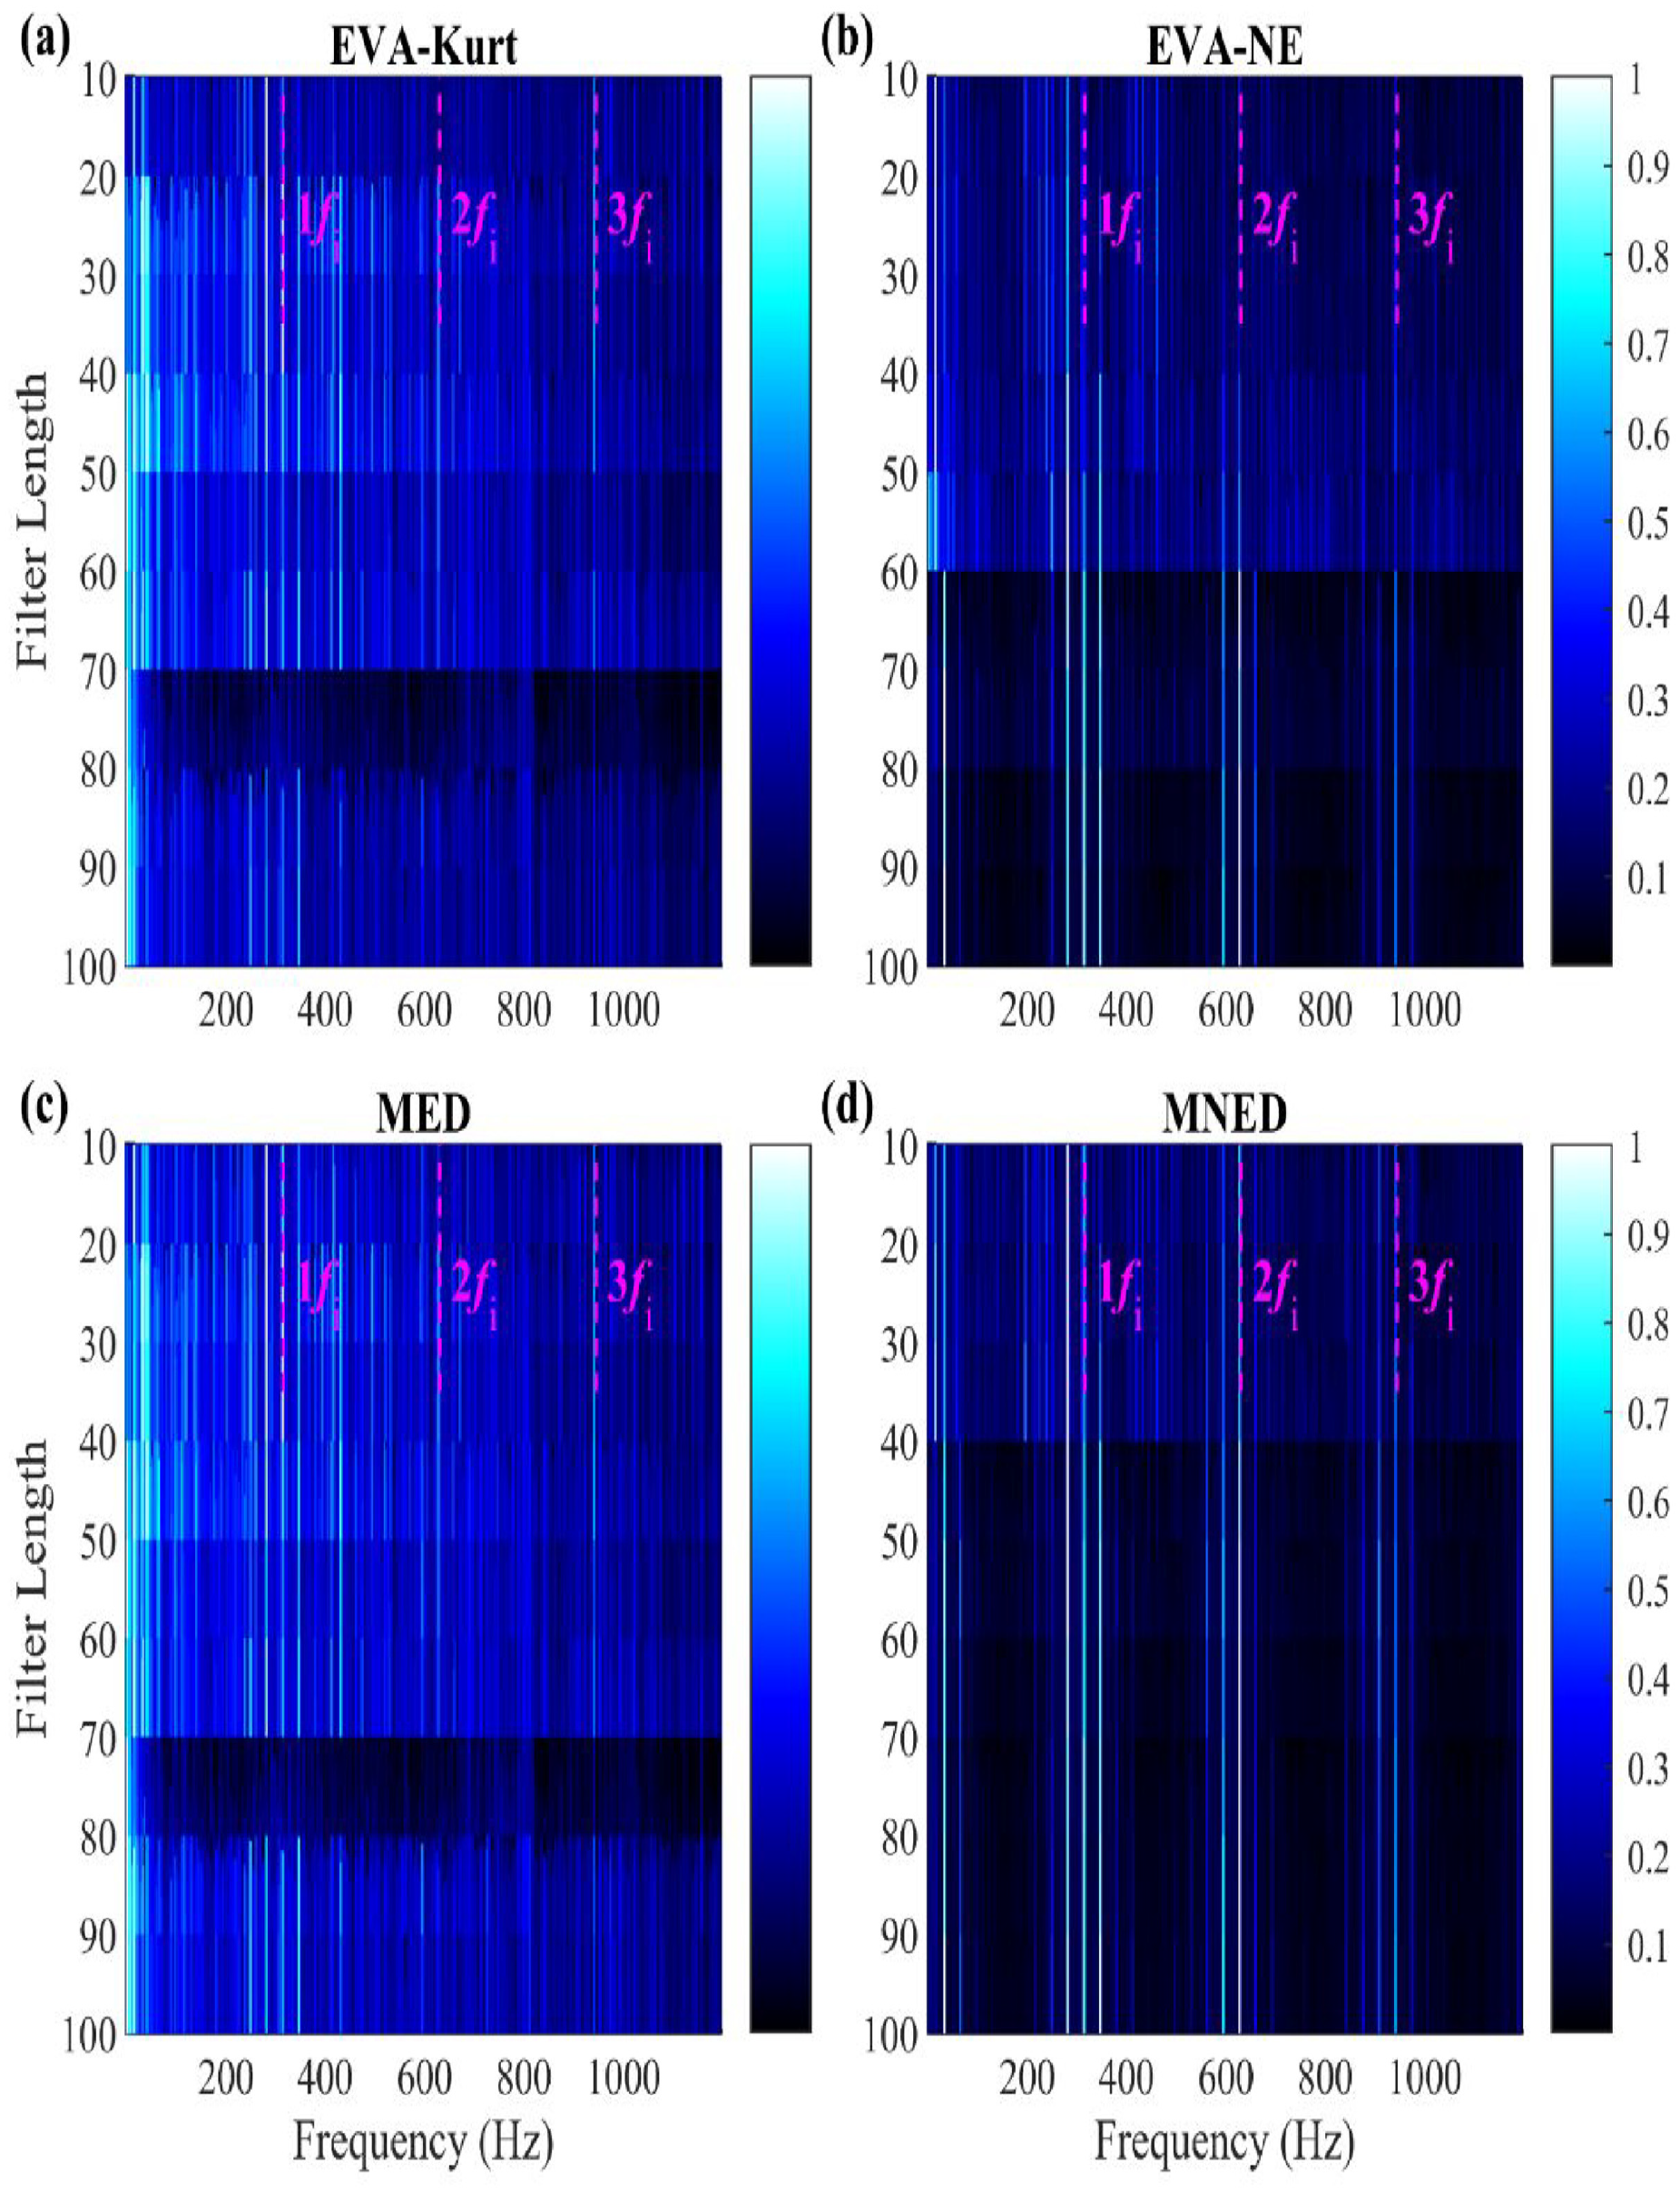
Figure 6 compares the results of the four BD methods in a colour map. The length of the filter ranges from 10 to 50. Each colour map is generated by overlaying the envelope spectra obtained from the corresponding BD method. The horizontal axis indicates the frequency, while the vertical axis represents the filter length. This visualization method facilitates clear observation and analysis of the performance variations of the BD method across different filter lengths. The amplitudes of the filtered waveforms have been normalized between −1 and 1 for comparison. It can be found that for the simulation case, as the filter becomes longer, the characteristic spectral lines in the NE-guided (EVA-NE and MNED) colormaps gradually become less dominant. The obtained envelope spectra of MNED contain less noise components than EVA-NE. MNED has more stable performance under different filter lengths than that of EVA-NE. The two kurtosis-guided BD methods (EVA-Kurt and MED) fail to identify the fault frequency at various filter lengths due to random external shocks and strong noise.
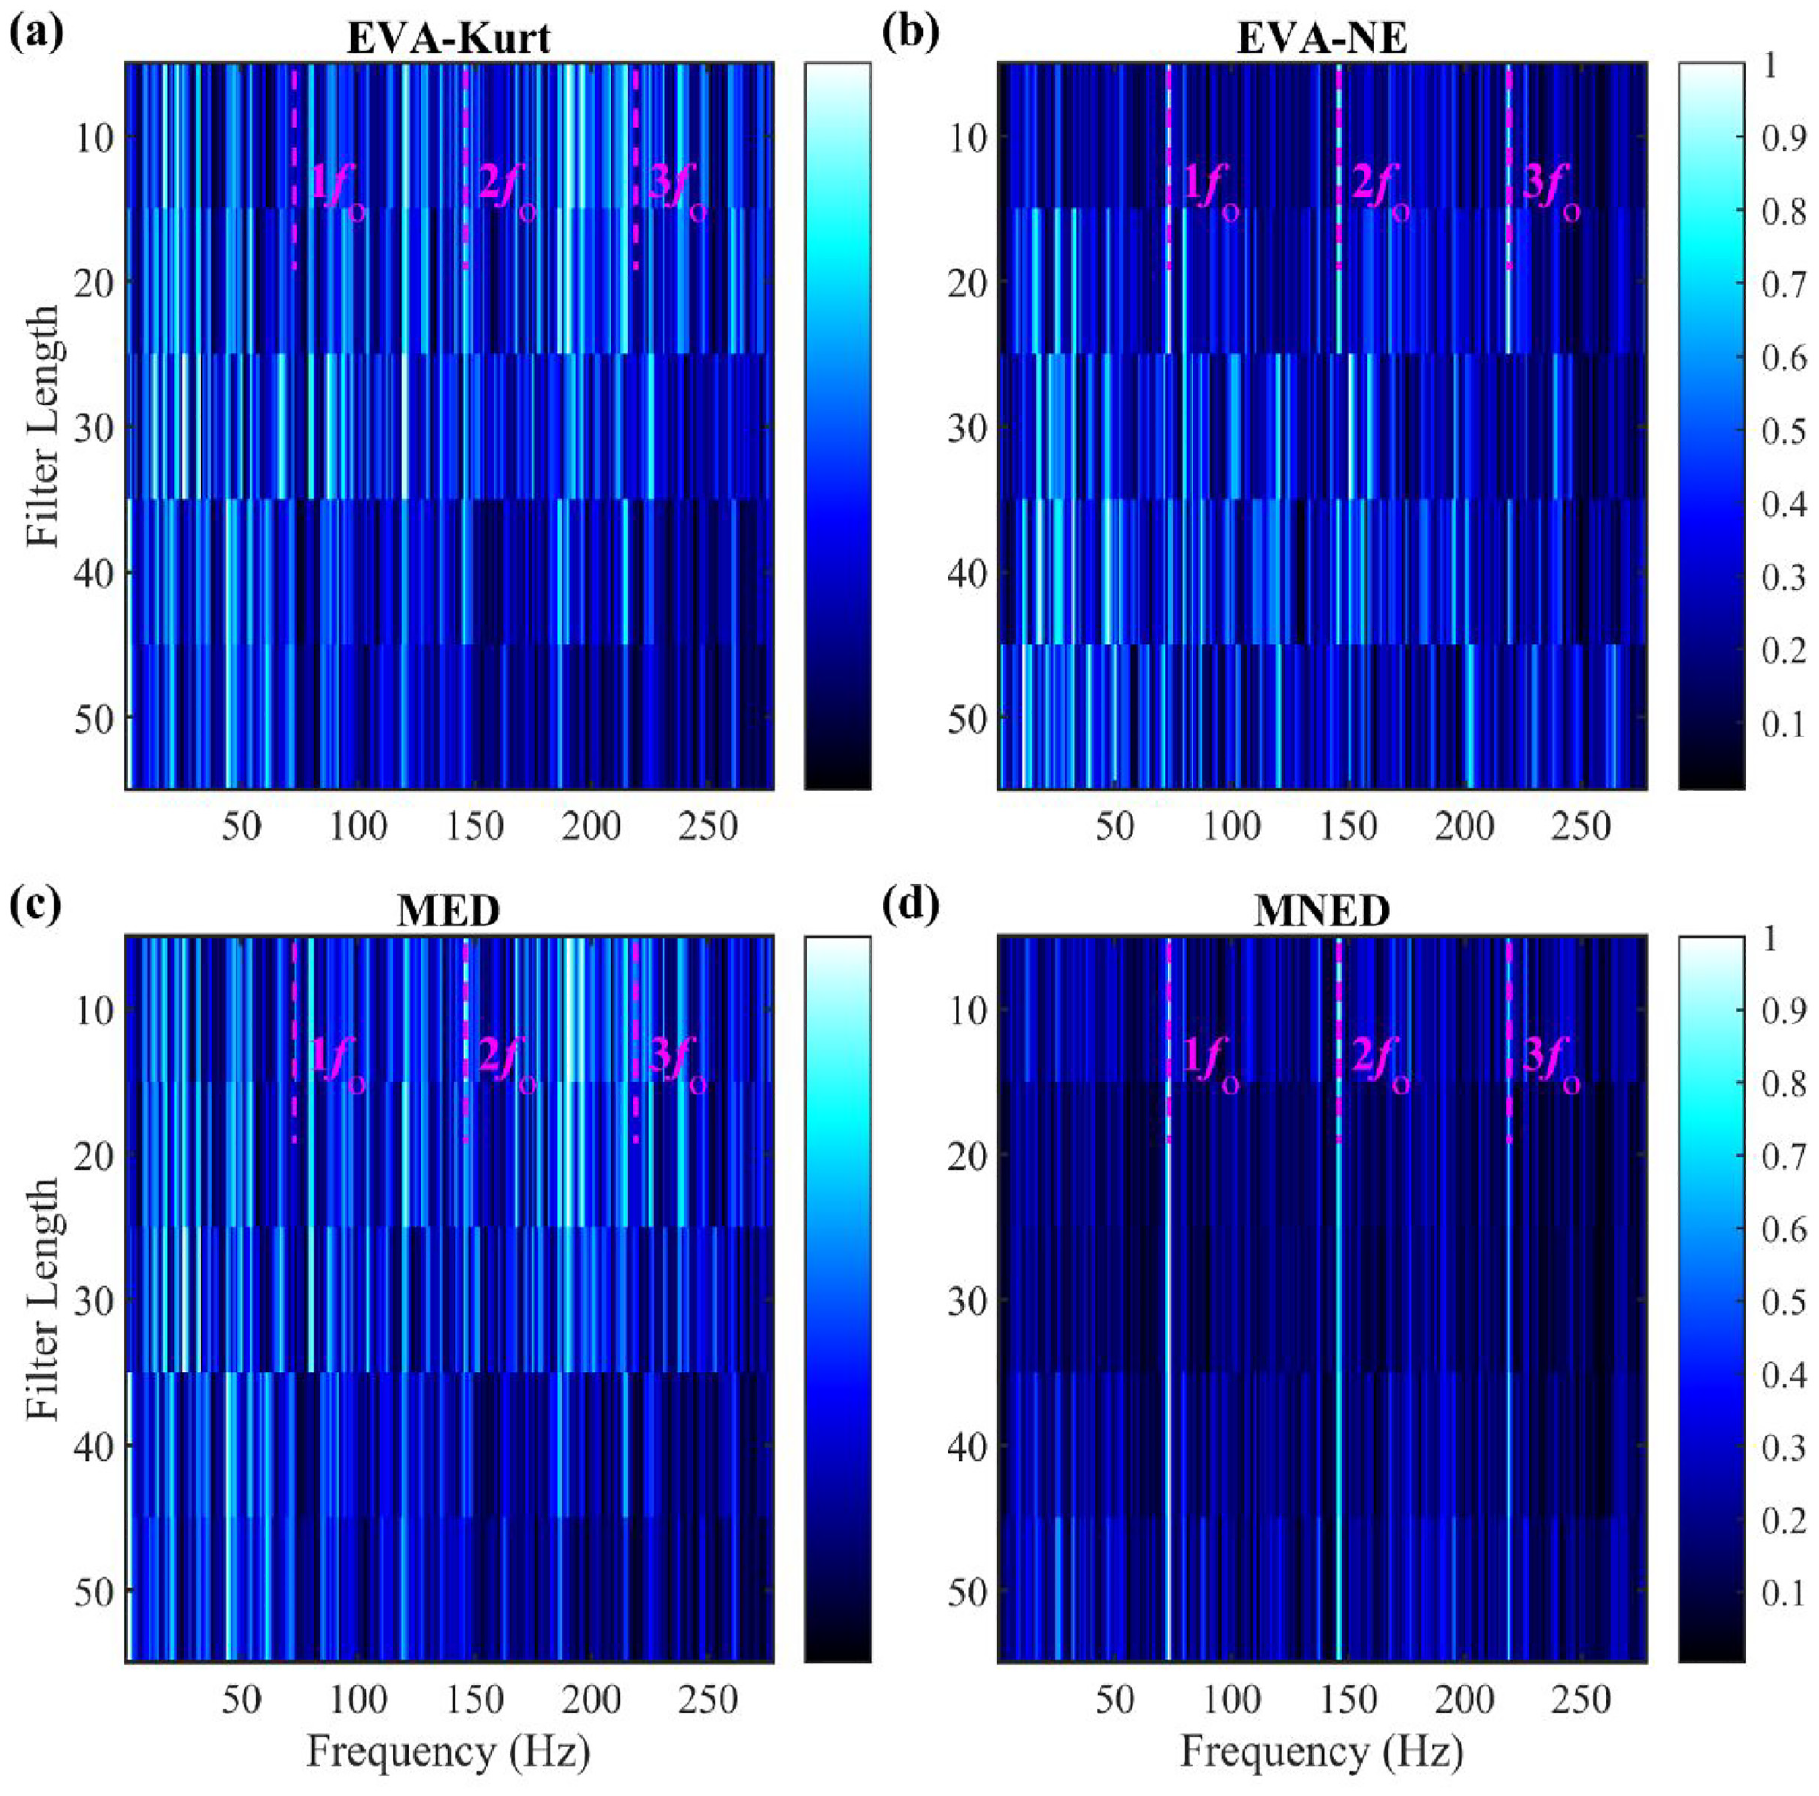
Trending of the normalized envelope spectra with filter length for the simulation case: (a) EVA-Kurt, (b) EVA-NE, (c) MED and (d) MNED.
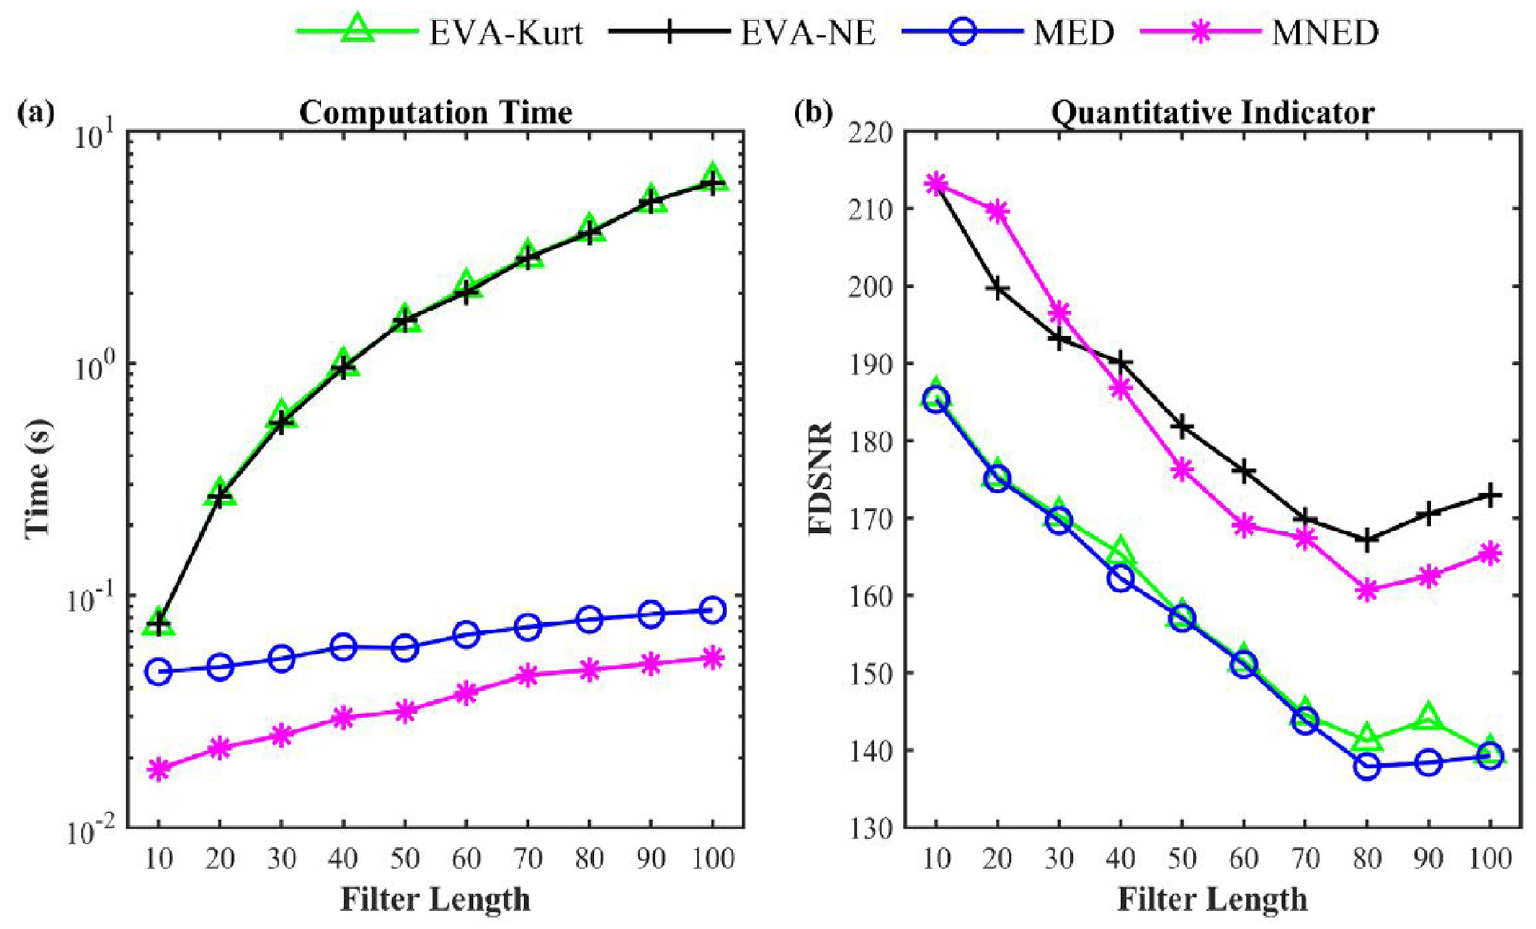
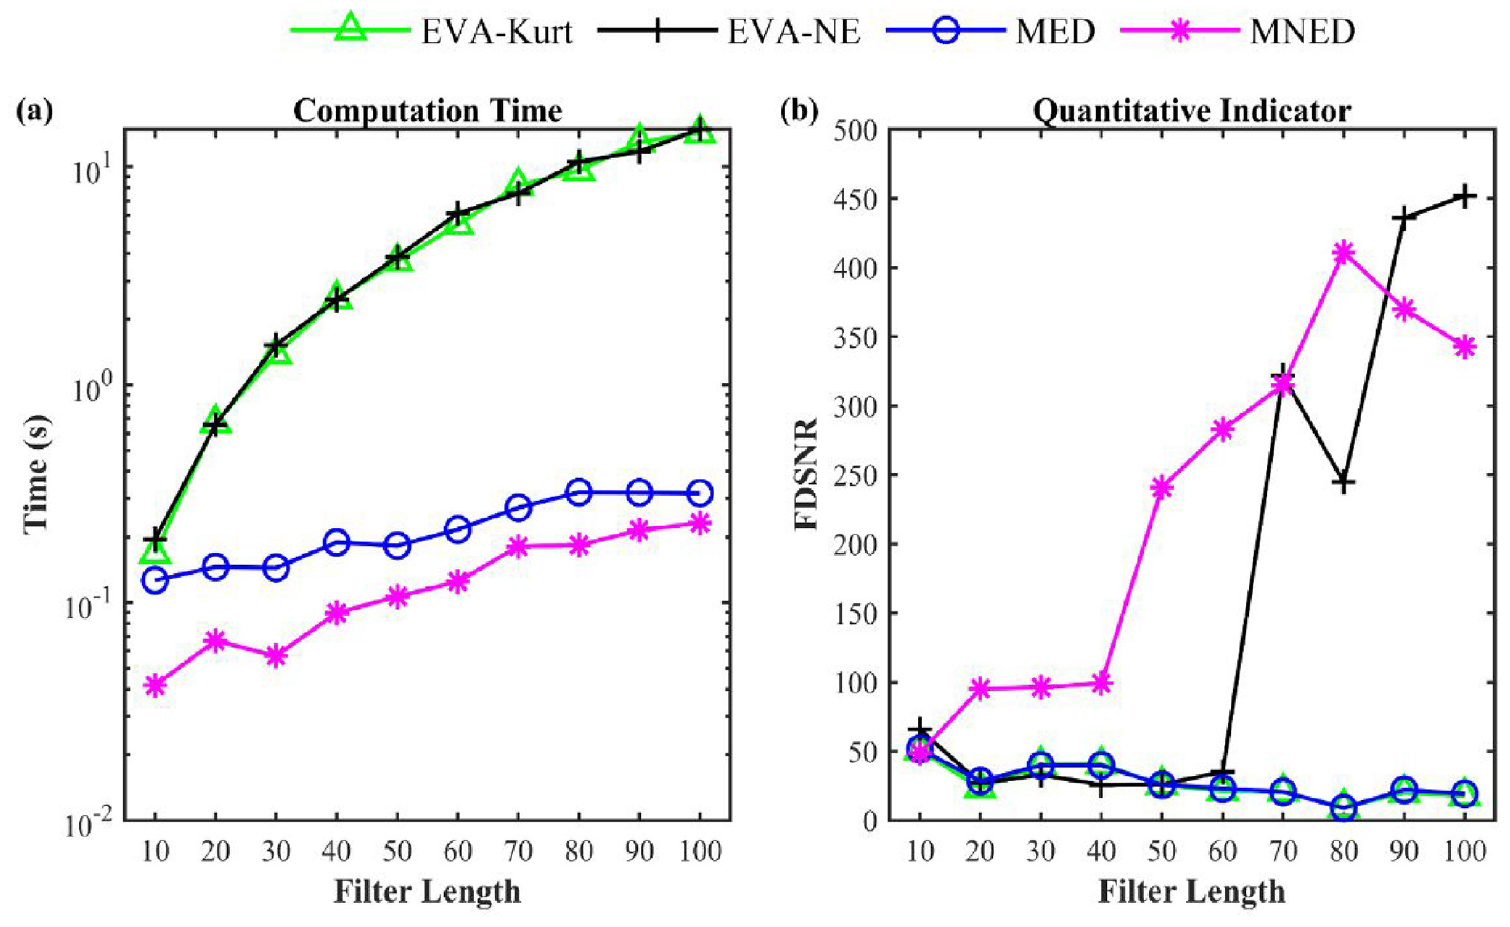
To evaluate computational efficiency, the computation time of each method was counted. The computer processor and memory size are R5 5600H and 16 GB, respectively. The operating environment is MATLAB R2022a, developed by MathWorks. As shown in Figure 7(a), when the filter length varies from 10 to 50, the time-consuming varies greatly depending on the optimization technology. The computation time of BD methods based on EVA (EVA-Kurt and EVA-NE) is greater than that of BD methods based on OFM (MED and MNED). This is because longer filters result in high-dimensional matrices, increasing computational time of EVA. Note that the vertical coordinates are logarithmic to clearly show differences (the same below). In addition, the frequency-domain signal-to-noise ratio (FDSNR) is applied to evaluate the performance of four methods in repetitive transient enhancement. Inspired by the concept of signal-to-noise ratio, FDSNR considers fault-related components such as characteristic frequencies and their harmonics in the frequency domain as useful components, and fault-independent components as noise. FDSNR has been shown to accurately quantify the bearing fault information in a signal.10,44,45 It is defined as
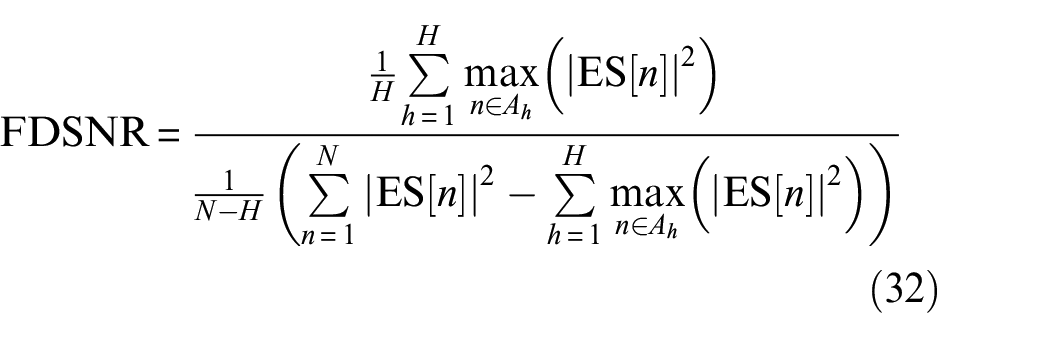
where N is the number of total discrete spectral frequencies, ES[n] represents the magnitude at the nth discrete frequency in the envelope spectrum, H is the order of the fault characteristic frequency involved and Ah denotes a series of discrete frequencies around the hth order characteristic frequency. In this paper, H is set to 3, considering the first three-order fault characteristic frequencies. The tolerance band is the three spectral lines around fault characteristic frequency.
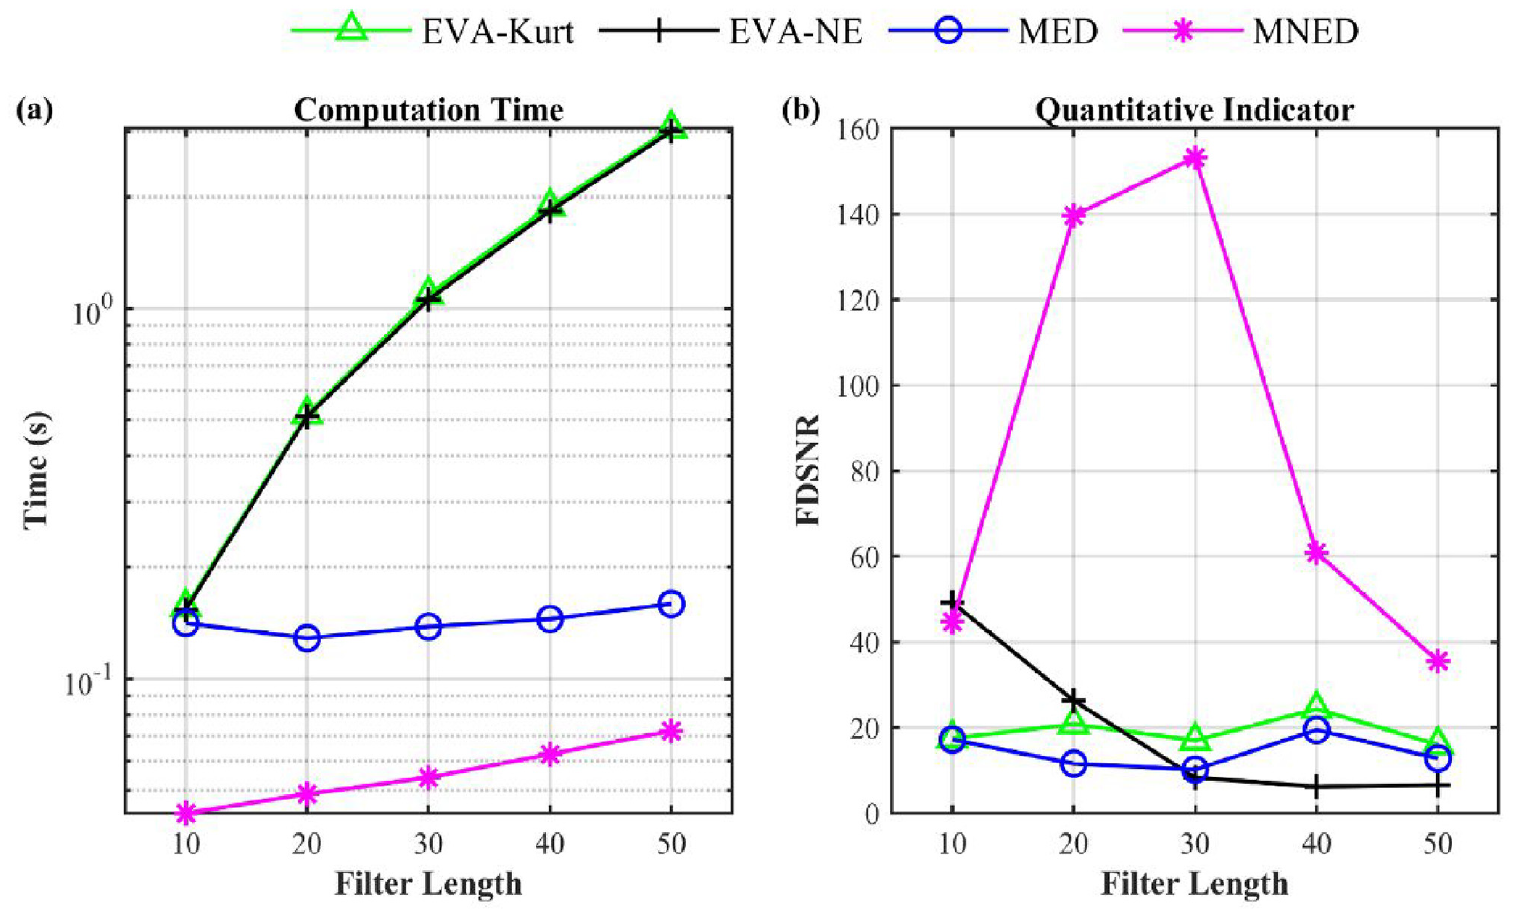
(a) Computation time and (b) quantitative indicators of different BD methods under varying filter lengths for the simulation case.
Figure 7(b) displays the resulting FDSNR evolution with filter length from 10 to 50 for the simulation case. For each filter length, MNED exhibits the largest FDSNR values and the best performance among the four BD methods.
Experimental results
In this section, two experimental data from railway wheelset bearings are utilized to verify the effectiveness and superiority of MNED in repetitive transient enhancement. The fault types are roller fault and inner ring fault, respectively. The filtering results obtained with MED, EVA-KT and EVA-NE are also presented for comparison. The maximum number of iterations is set to 50.
Case 1: Axle bearing roller fault
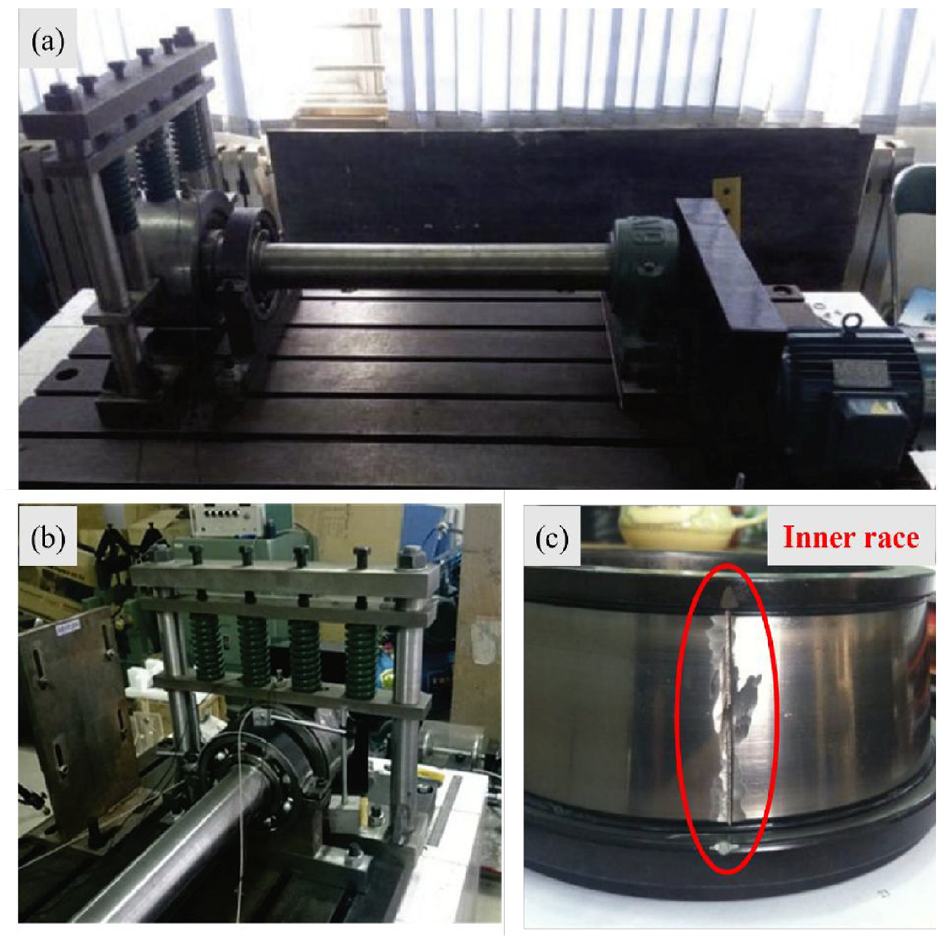
The faulty bearing data for case 1 is collected from a railway passenger wheelset bearing test bench. As displayed in Figure 8(a), the test bench consists of a base frame, a loading device, a control system and a wheelset supported by two bearings. A healthy bearing and a damaged bearing are mounted at each end of the wheelset. As shown in Figure 8(e), a localized fault of 0.2 mm deep and 0.6 mm wide was artificially implanted on the roller surface of test bearing. The signal includes 8192 sampling points and is acquired by the accelerometer mounted above test axle box. The sampling frequency is 12,800 Hz. The theoretical roller fault characteristic frequency fr is 47.19 Hz.
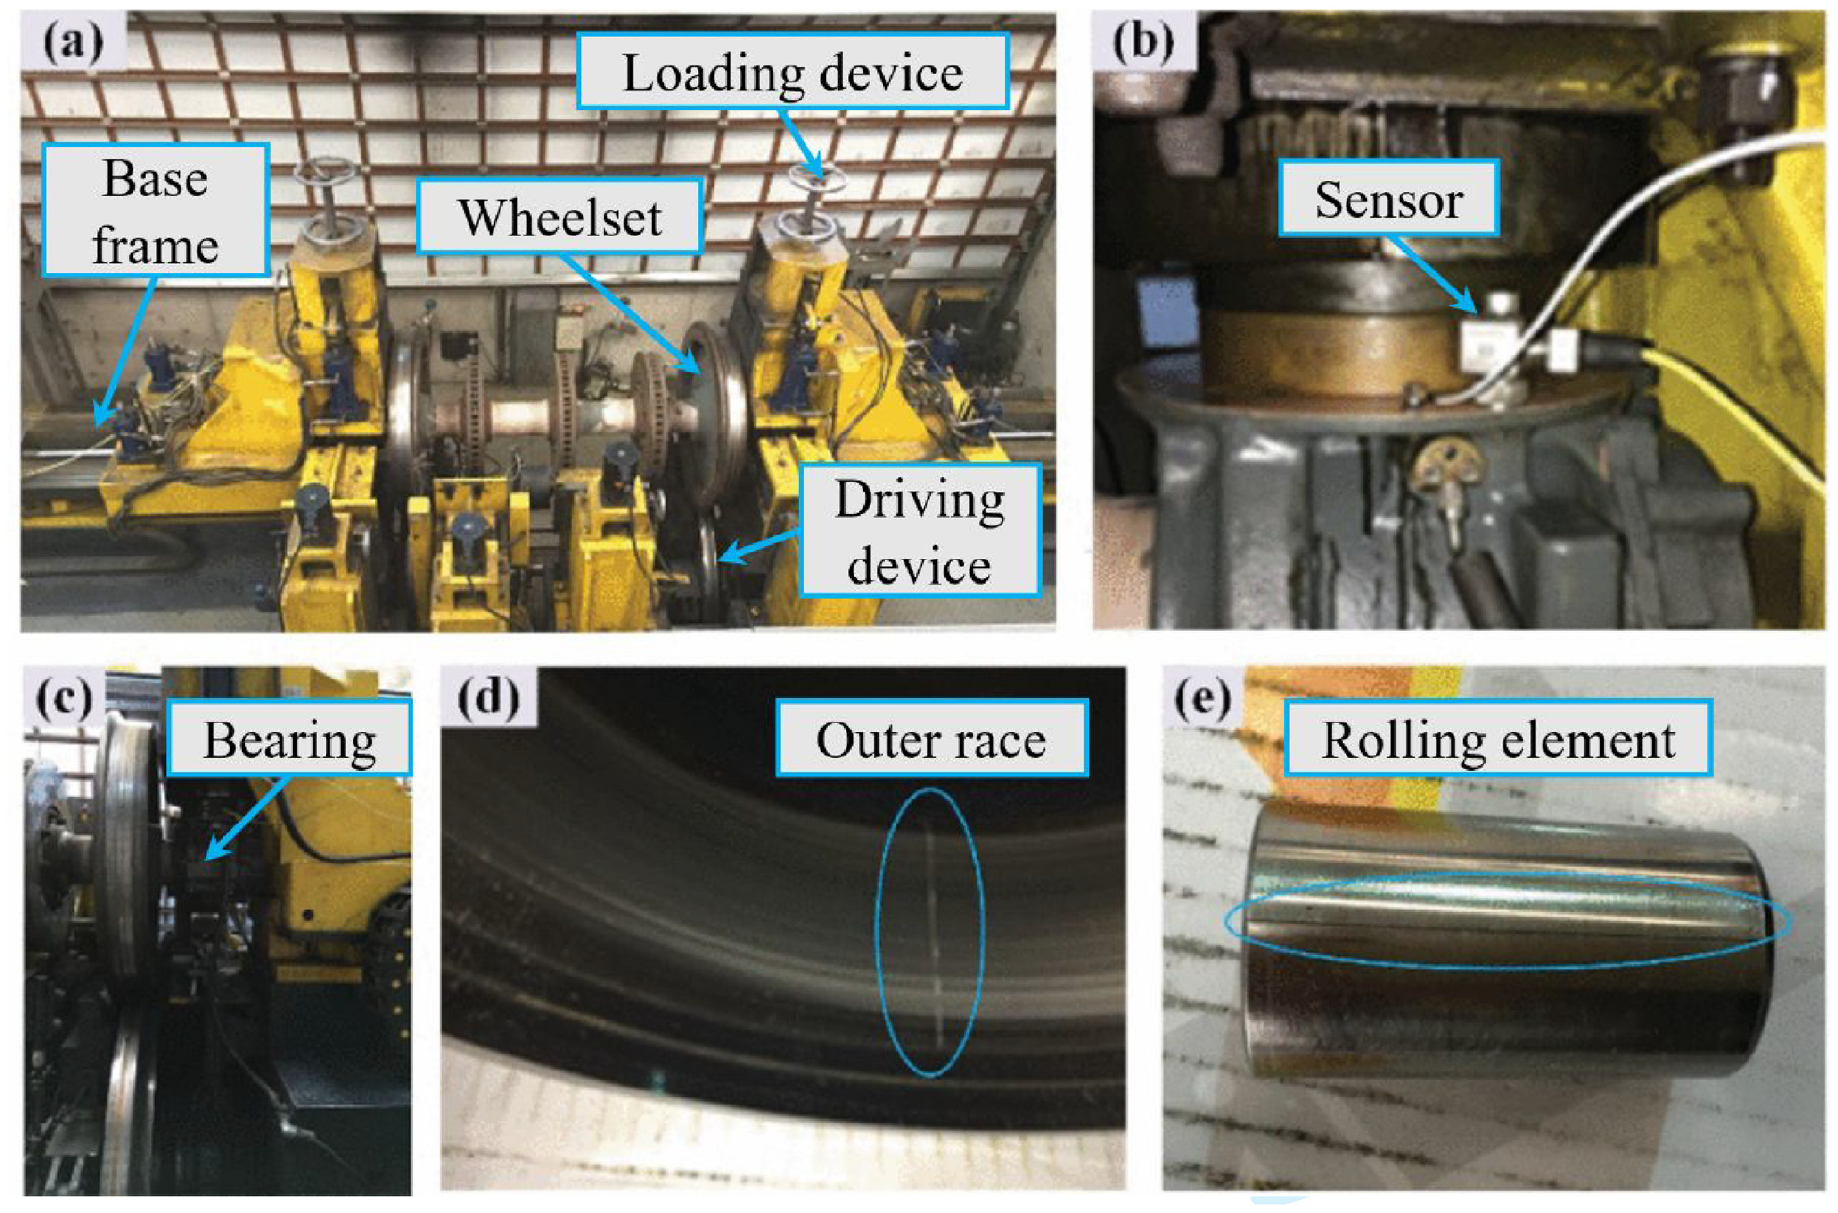
Test bench and faulty bearing parts: (a) railway axle bearing test rig, (b) accelerometer location, (c) drive system, (d) localized outer race fault and (e) localized roller fault. 39
Figure 9 presents the collected roller fault signal and its envelope spectrum, in which there is no obvious local peak at the harmonics of fr. Figure 10 shows the deconvolution results of the three existing methods and MNED when the filter length is 50. The amplitudes of the filtered signals and envelope spectra have been normalized between −1 and 1 for comparison (same below). Compared with Figure 9, the filtered waveform exhibits a clear impulsiveness and the harmonics of fr can be found in the envelope spectra.
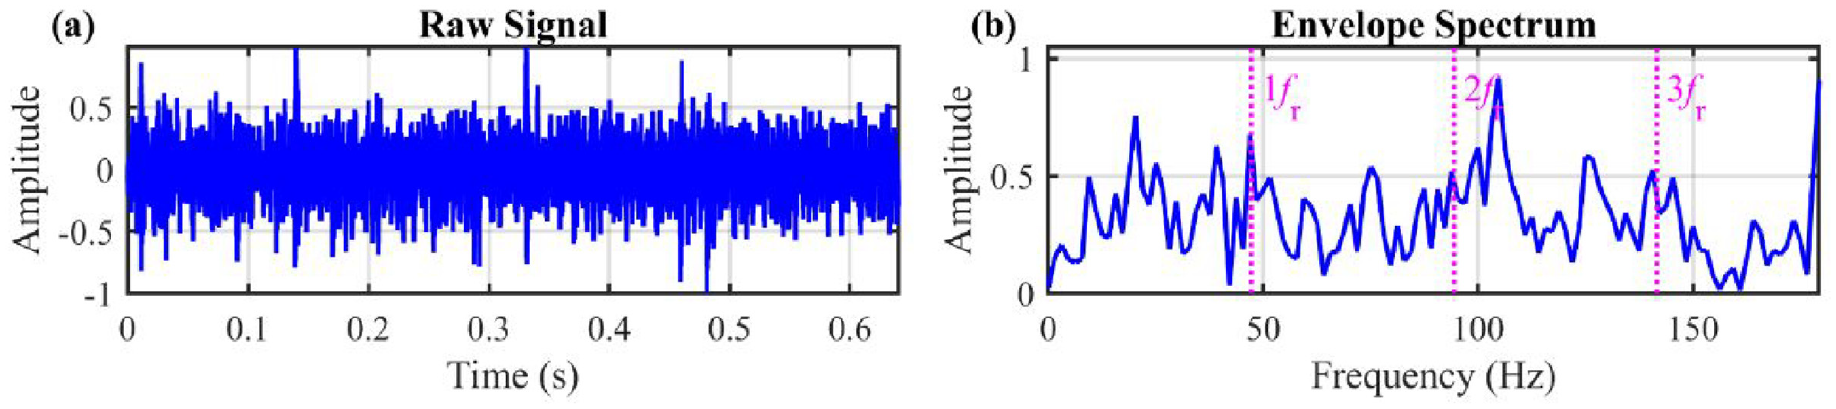
(a) Waveform and (b) envelope spectrum for experimental case 1.
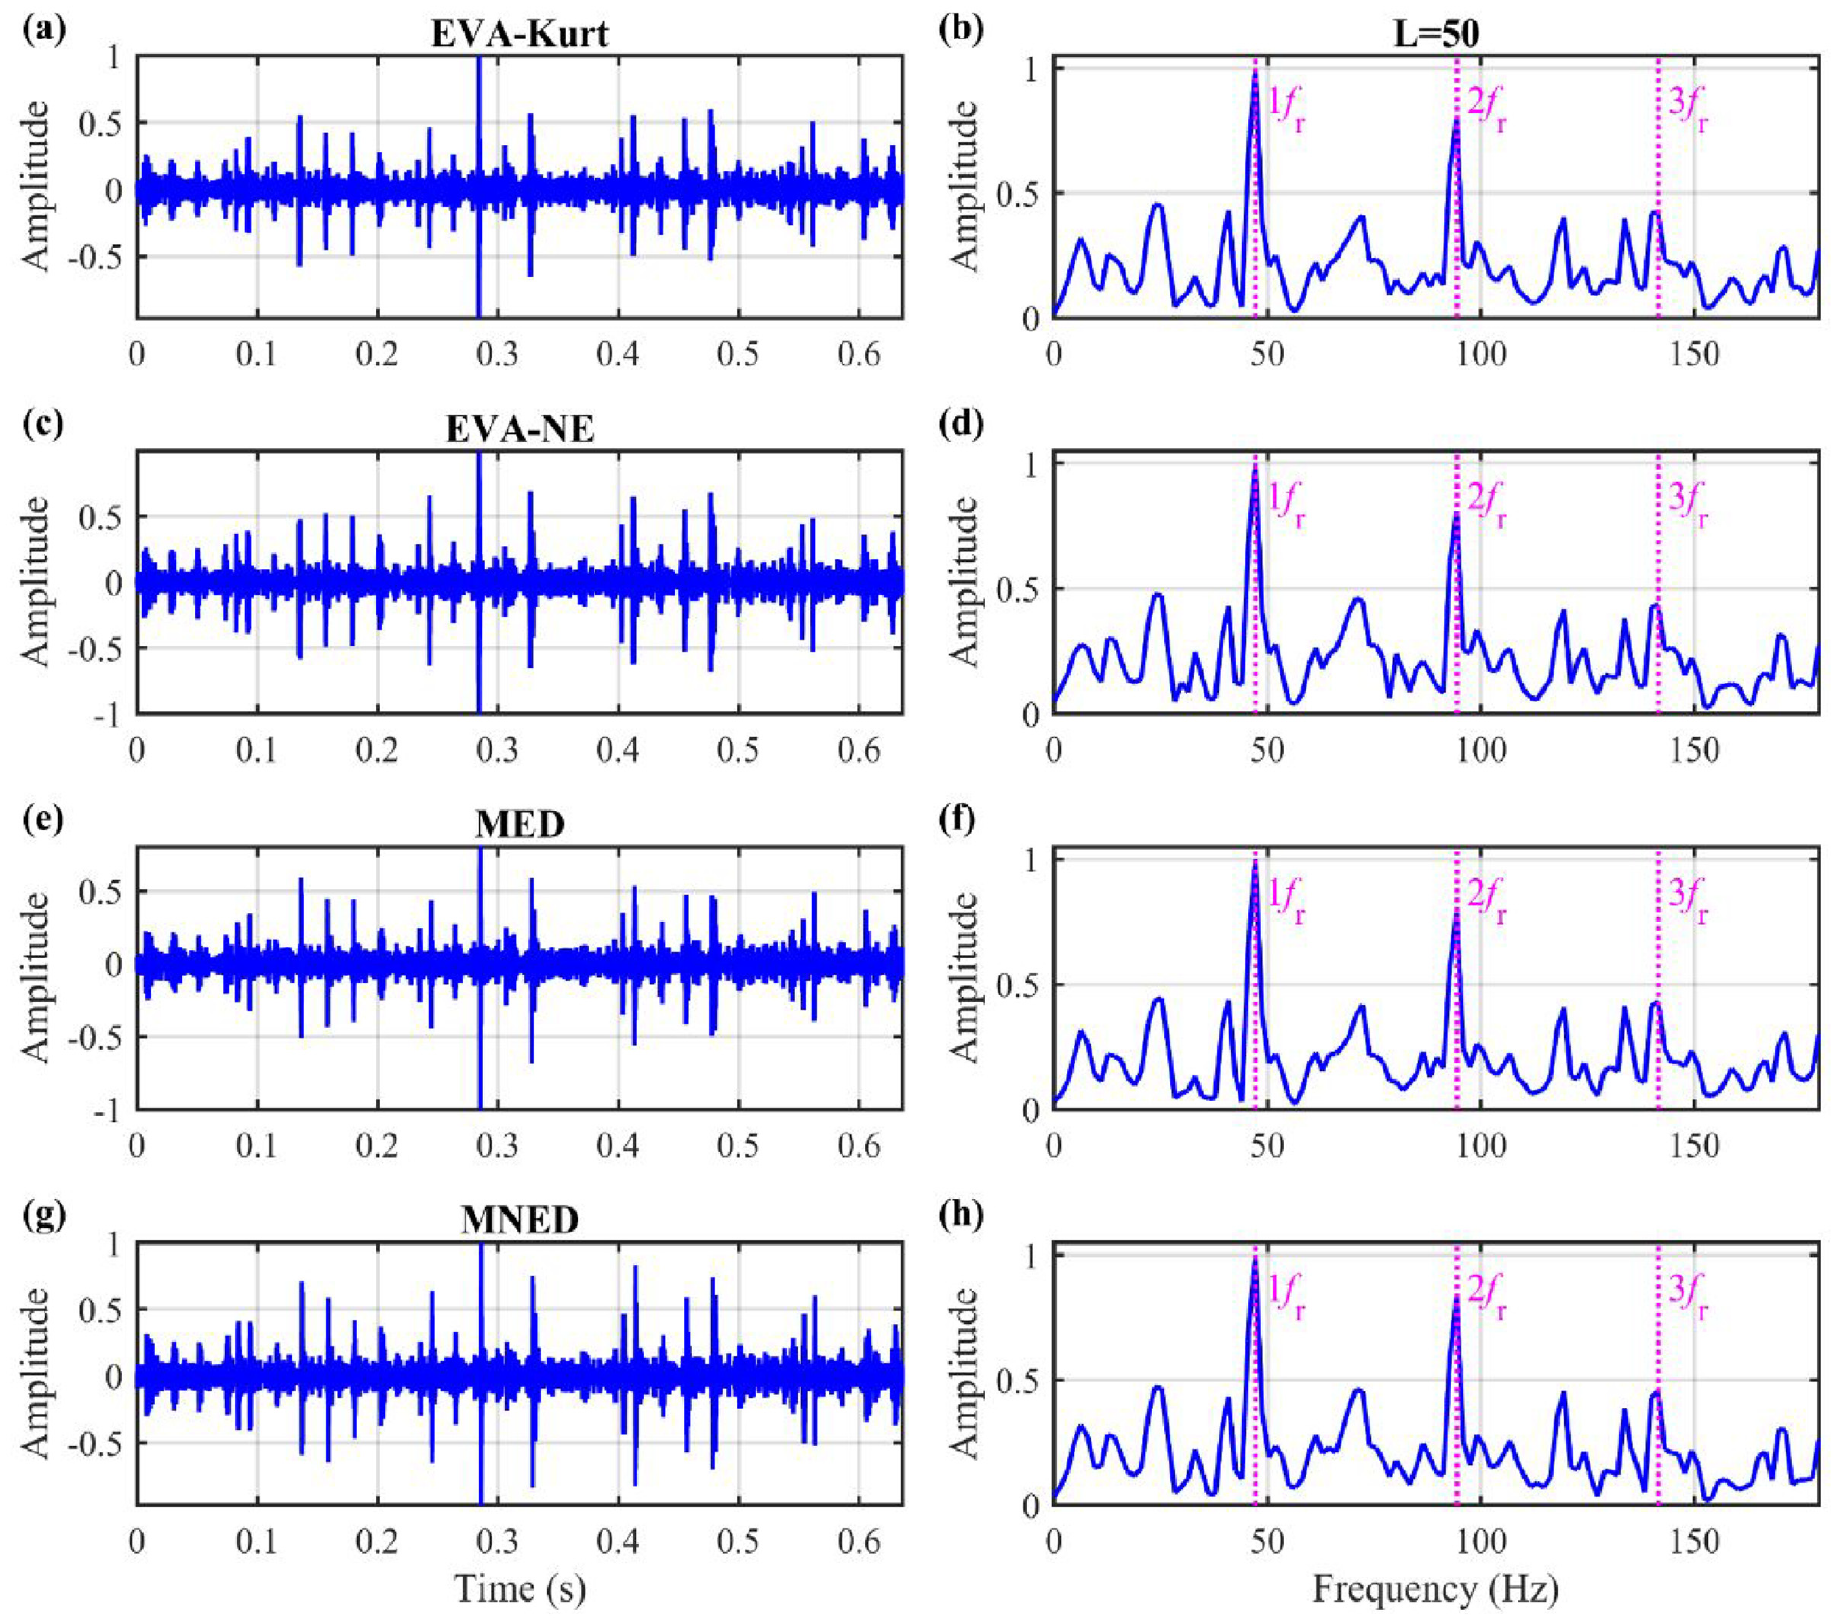
Filtered signals (L = 50) and their envelope spectra for experimental case 1: (a) and (b) EVA-Kurt, (c) and (d) EVA-NE, (e) and (f) MED and (g) and (h) MNED.
Figure 11 displays the obtained envelope spectra for different filter lengths in more detail. It can be found that all four BD methods can highlight fr and its harmonics, that is, detect the roller fault. However, the efficiencies of the four methods showed significant differences for varying filter lengths. As illustrated in Figure 12(a), the computation time of the two BD methods based on EVA increases linearly with the filter length. In contrast, the computation time of the two OFM methods does not seem to be very sensitive to the filter length. And the computation time of MNED is shorter than that of MED for each of filter lengths involved. As shown in Figure 12(b), the FDSNR values obtained by the NE-guided methods are slightly larger than that obtained by the kurtosis-guided methods. In short, compared to the other three methods, MNED can achieve equally good results in less time for case 1.
Trending of the normalized envelope spectra with filter length for experimental case 1: (a) EVA-Kurt, (b) EVA-NE, (c) MED and (d) MNED.
(a) Computation time and (b) quantitative indicators of different BD methods under varying filter lengths for experimental case 1.
To demonstrate the resistance of MNED to external shock interference, a random shock is added to the original signal. It is marked by the green dashed line with a scaled amplitude, as shown in Figure 13(a). The actual amplitude is 1.7 times the maximum amplitude of the original signal. The simulated shock function is the same as that in the previous section. Figure 13(b) is the envelope spectrum, in which the fault frequency fr and its harmonics are not dominant.
(a) Waveform and (b) envelope spectrum for experimental case 1 with random shocks.
Figure 14 compares the deconvolution results of the four methods when the filter is 50. As shown in Figure 14(a) and (e), the waveforms obtained by MED and EVA-Kurt are dominated by a single high-amplitude impulse. The single impulse closely matches the added shock. From Figure 14(b) and (f), the envelope spectra derived by the kurtosis-guided methods fail to reveal fr clearly. This illustrates that the kurtosis-guided methods are perturbed by random shocks.
Filtered signals (L = 50) and their envelope spectra for experimental case 1 with random shocks added: (a) and (b) EVA-Kurt, (c) and (d) EVA-NE, (e) and (f) MED and (g) and (h) MNED.
Figure 15 shows the processing results of different filter lengths, for further illustration. As shown in Figure 15(b) and (d), the fr and 2fr are clearly visible in envelope spectra obtained by the EVA-NE and MNED methods. However, EVA-Kurt and MED perform poorly with longer length filters, as shown in Figure 15(a) and (c), where 2fr is the dominant frequency component.
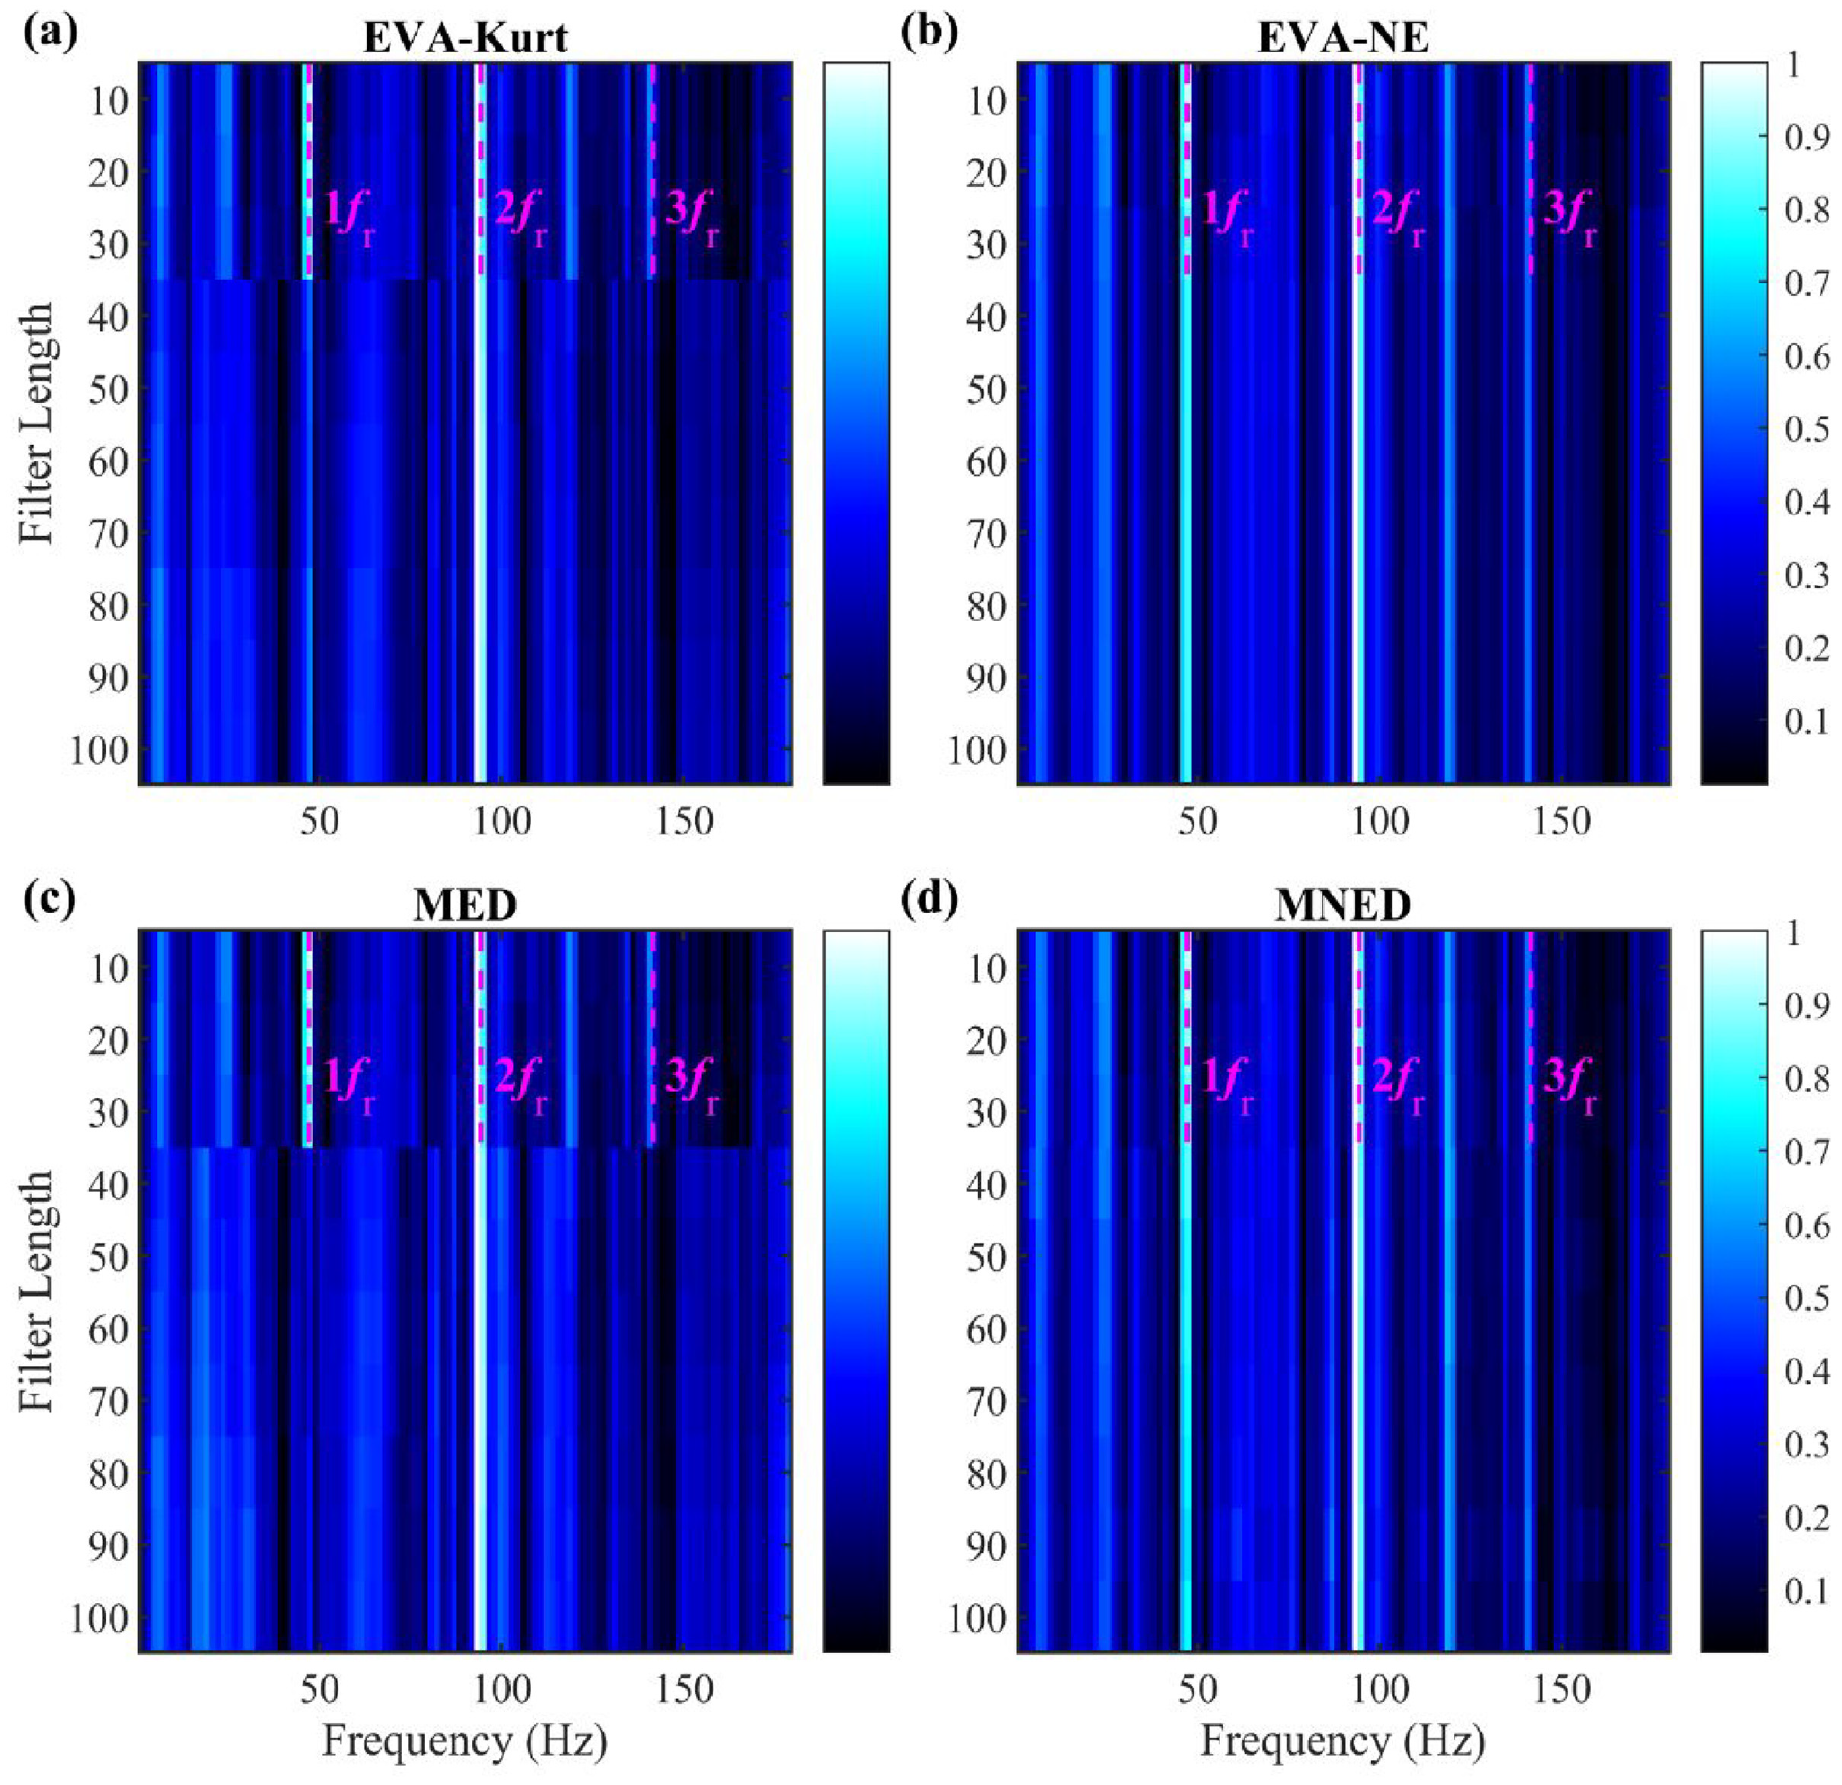
Trending of the normalized envelope spectra with filter length for experimental case 1 with random shocks added: (a) EVA-Kurt, (b) EVA-NE, (c) MED and (d) MNED.
More precisely, Figure 16 compares the time spent and FDSNR on each filtering as a complement to the colormap. The calculation time consumed by various methods in Figure 16(a) is similar to that in Figure 12. The calculation time for BD methods based on EVA is much greater than that of BD methods based on OFM. The longer the filter, the greater the difference. The performance of the kurtosis-guided methods becomes worse when the filter length varies from 30 to 40. As shown in Figure 16(b), the FDSNR of MED falls off a cliff, from about 110 to 50. In contrast, the two NE-guided methods maintain relatively high values (greater than 110), successfully indicating the roller fault.
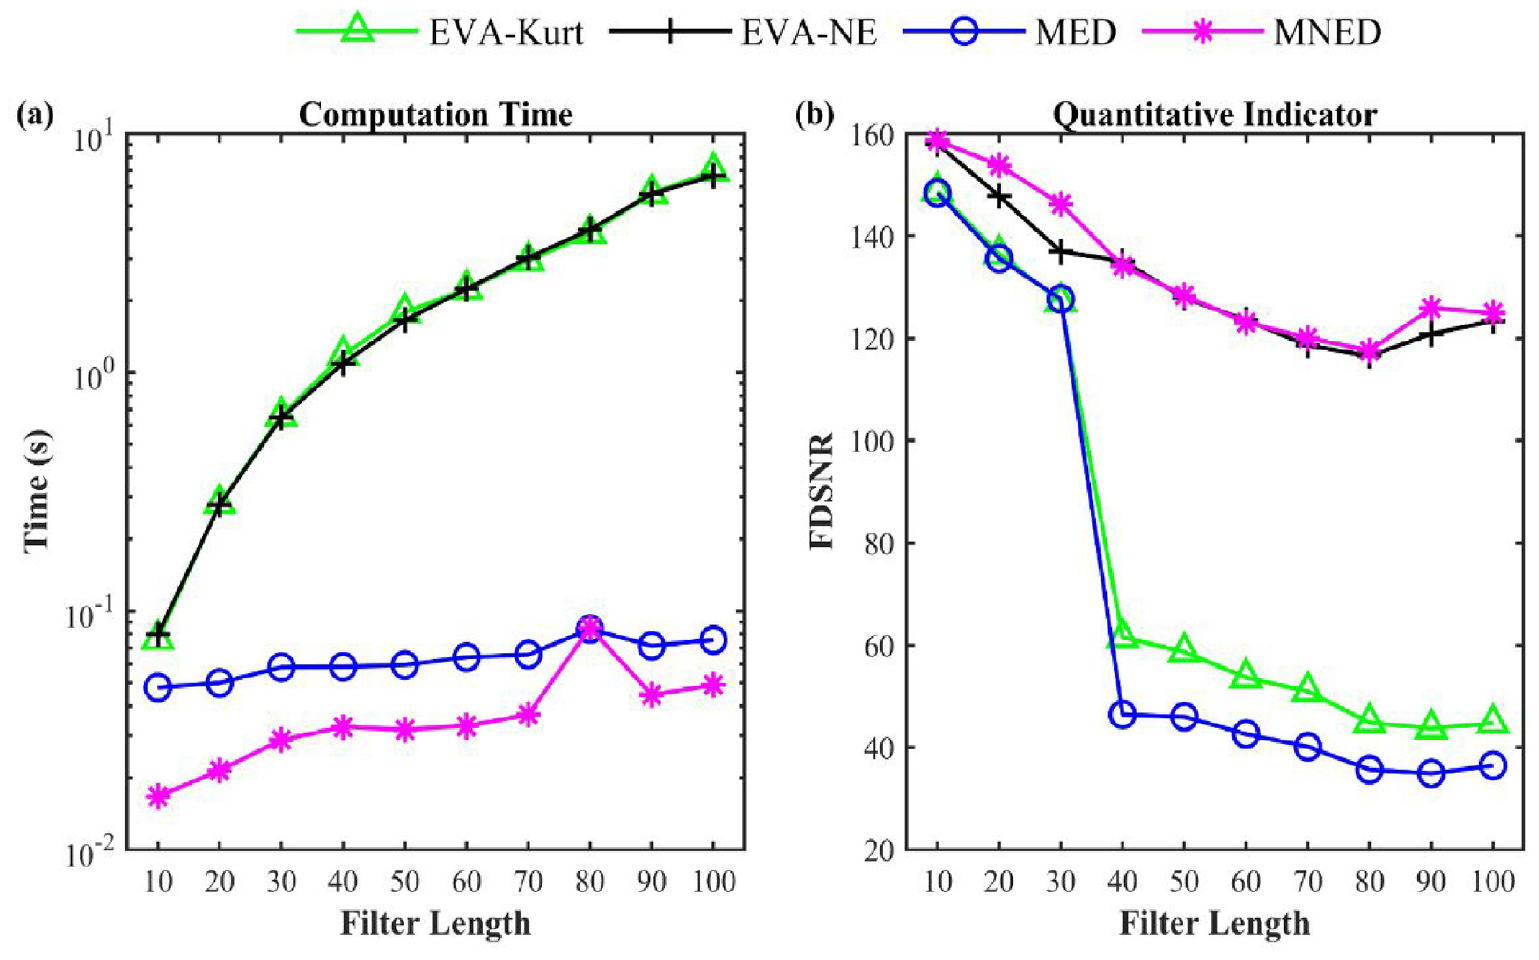
(a) Computation time and (b) quantitative indicators of different BD methods under varying filter lengths for experimental case 1 with random shocks added.
To facilitate further quantitative analysis, the percentage of time saved by MNED, denoted as
Average percentage of computation time saved by MNED for experimental case 1.
Case 2: Axle bearing inner race fault
The data for experimental case 2 were collected from a high-speed train bogie test rig, 46 as shown in Figure 18. The acceleration sensor is mounted vertically on the top surface of the bearing shell to collect vibration signals with a sampling frequency of 5 kHz. The sampling time is 5 s. The rotational speed of the bearing is 1950 rpm, which corresponds to a high-speed train speed of 320 km/h. Figure 18 also shows the details of the inner race fault, which was implanted by electro-discharge machining. The radio of roller diameter to pitch diameter is 0.14. The number of rollers is 17, and the contact angle is 0.245 rad. The theoretical inner race fault characteristic frequency fi is 314.92 Hz.
High-speed train bogie test rig: (a) test bench, (b) loading cell and accelerometer and (c) inner race localized fault.
Figure 19 plots the original signal and its envelope spectrum of case 2, in which only the magnitude of 2fi appears as local spikes in its surrounding frequency bands, while other harmonics of fi are almost invisible due to noise interference.
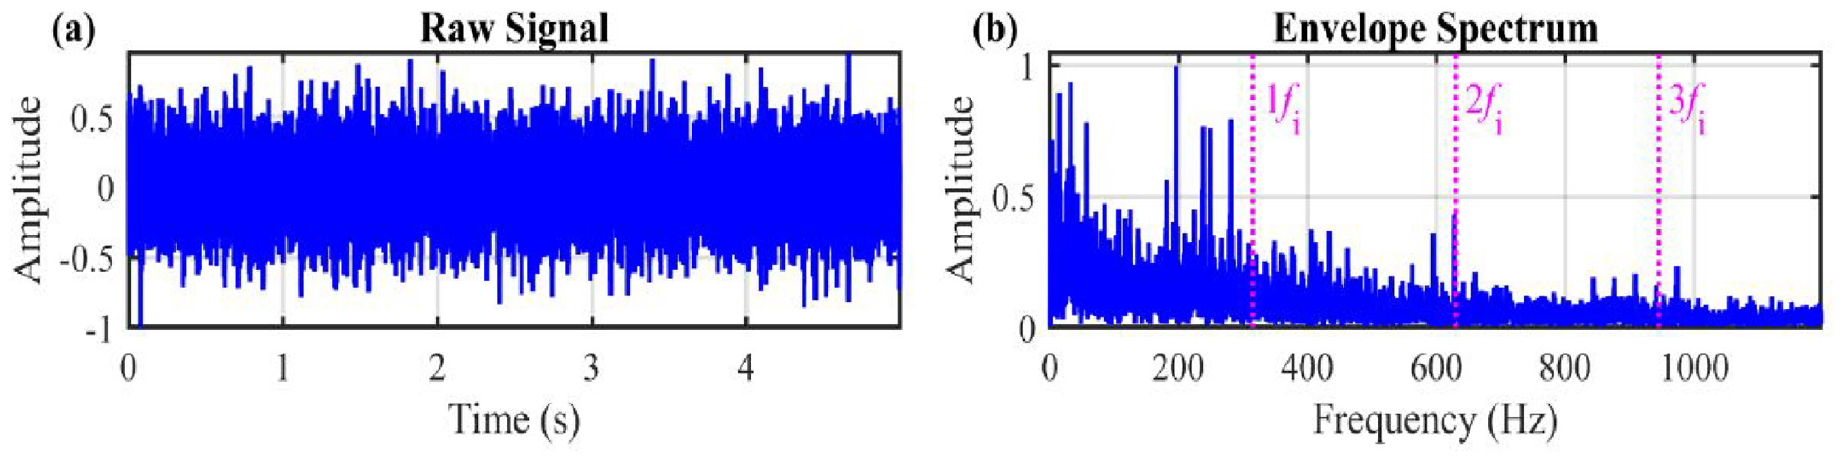
(a) Raw signal and (b) its envelope spectrum for experimental case 2.
The results for a filter length of 50 are plotted in Figure 20. The 1–1.4 s of the filtered signals is intercepted for display. Compared with the original waveform in Figure 19(a), the impulsiveness of the waveforms obtained by the four methods is enhanced to varying degrees. The envelope spectra not only contain prominent harmonics of fi, but also have noticeable sidebands separated by the rotation frequency around the harmonics of each order, which is the sign of inner race fault.
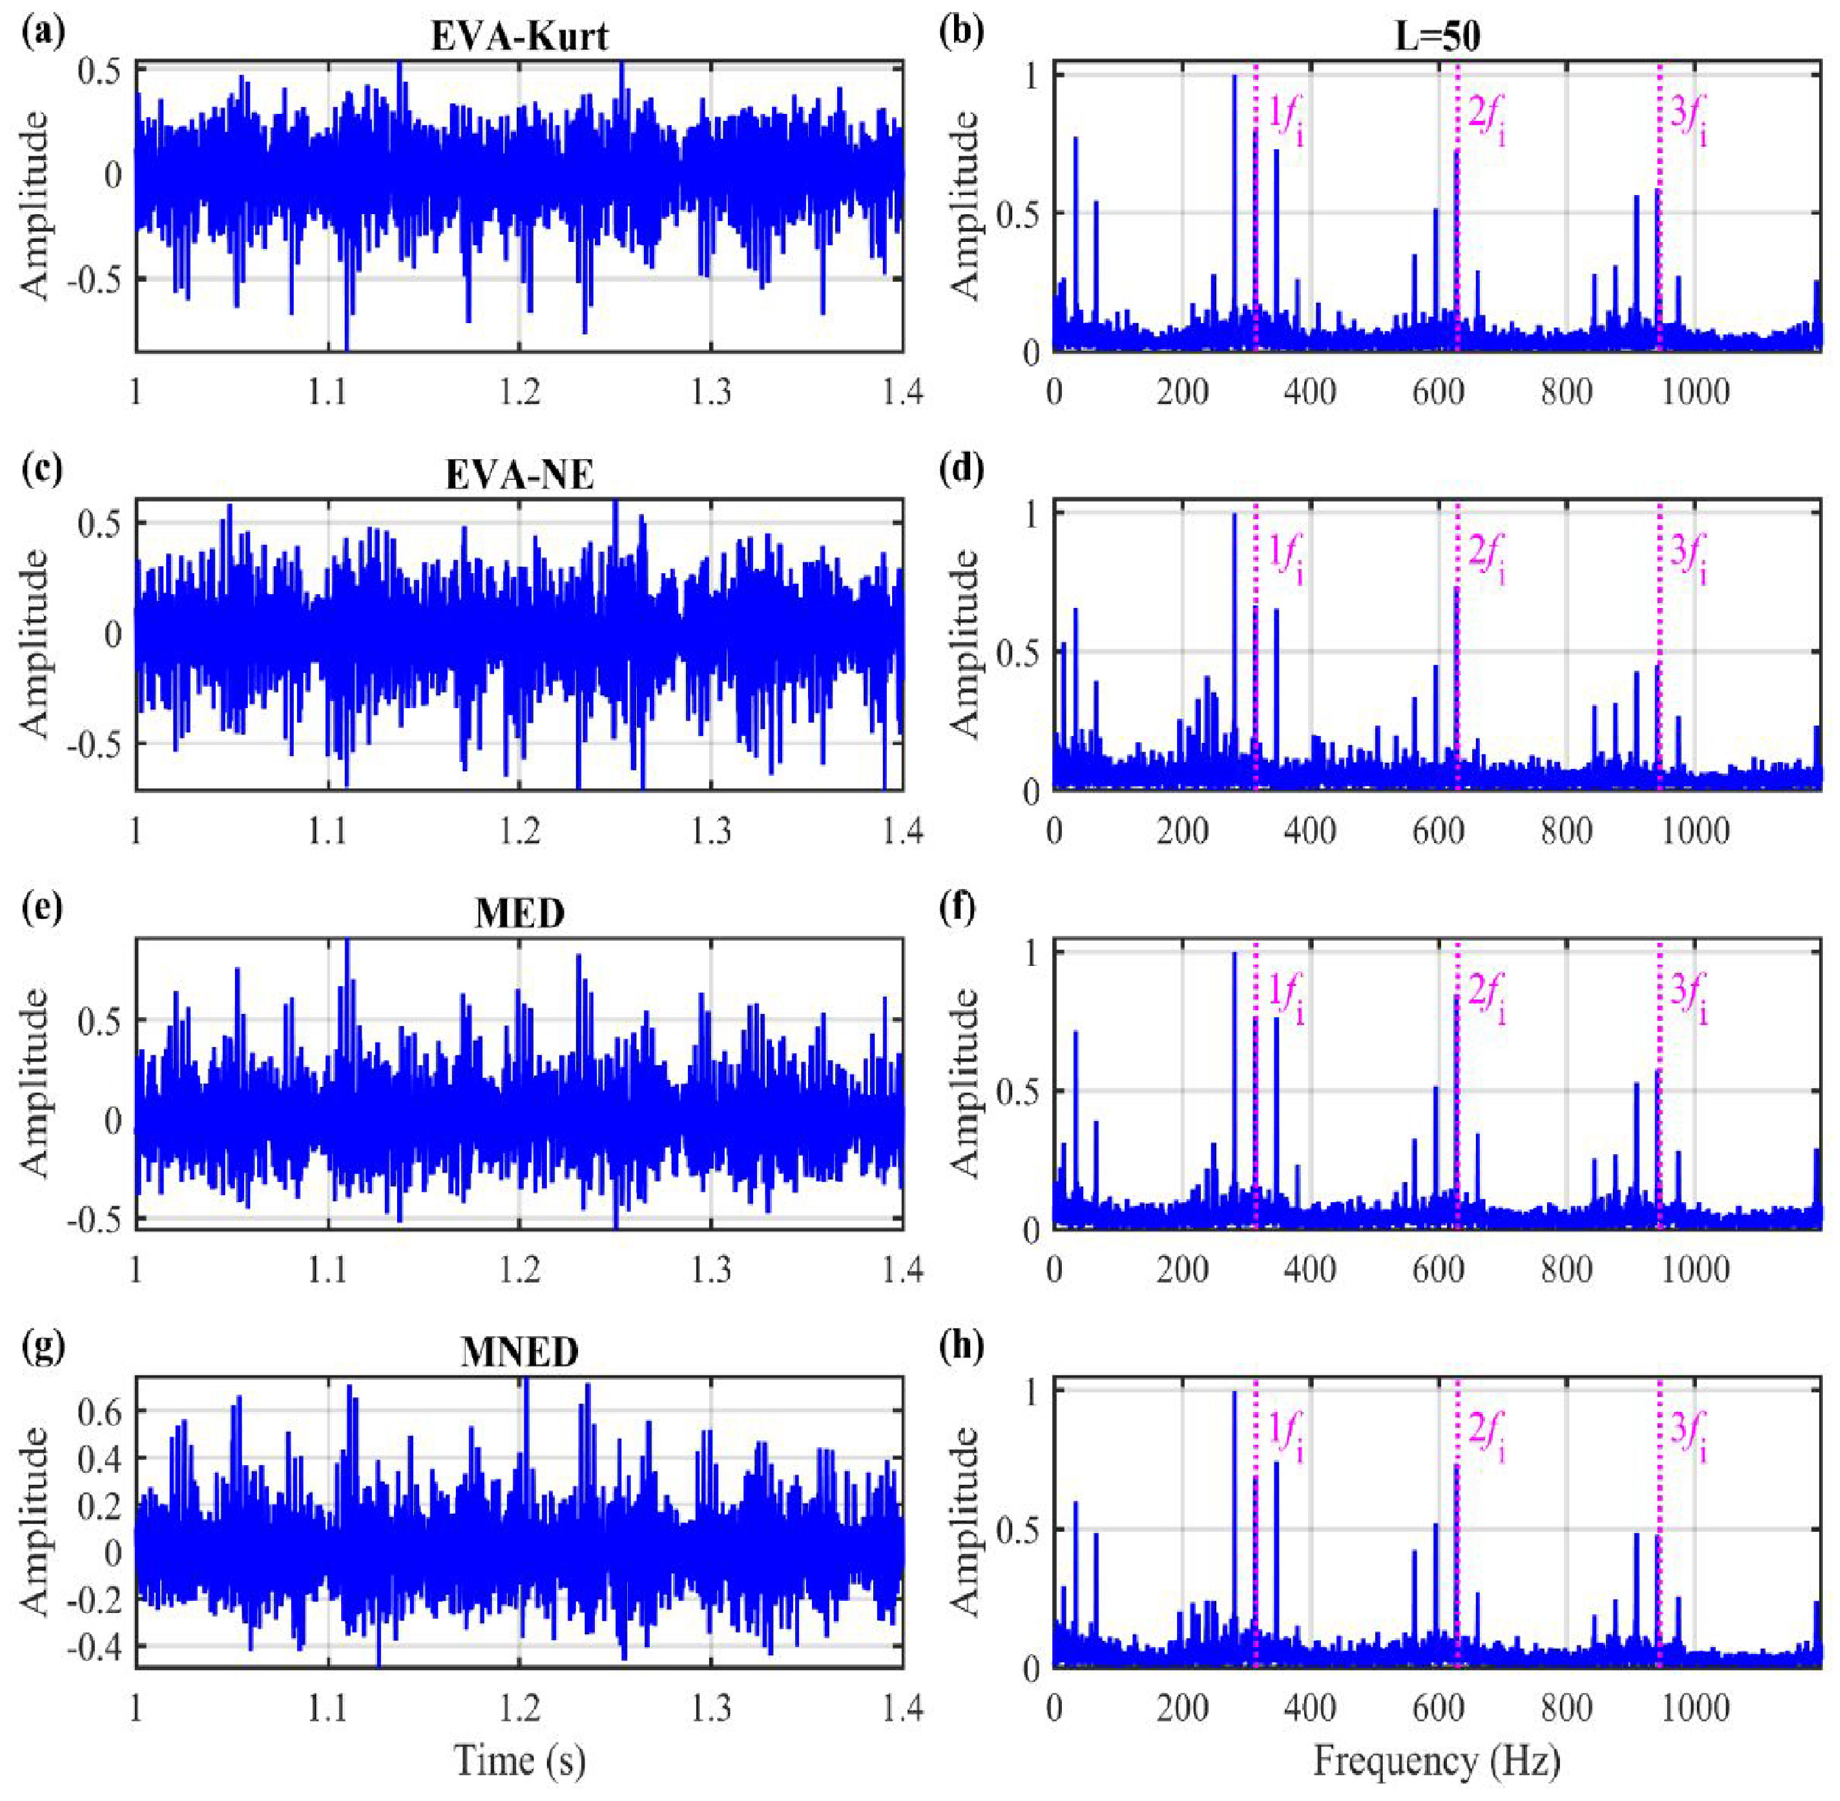
Filtered signals (L = 50) and their envelope spectra for experimental case 2: (a) and (b) EVA-Kurt, (c) and (d) EVA-NE, (e) and (f) MED and (g) and (h) MNED.
To illustrate the effect of filter length on deconvolution performance, Figure 21 presents the filtering results for filter lengths ranging from 10 to 100. Figure 22 compares the computation time and FDSNR of the four methods.
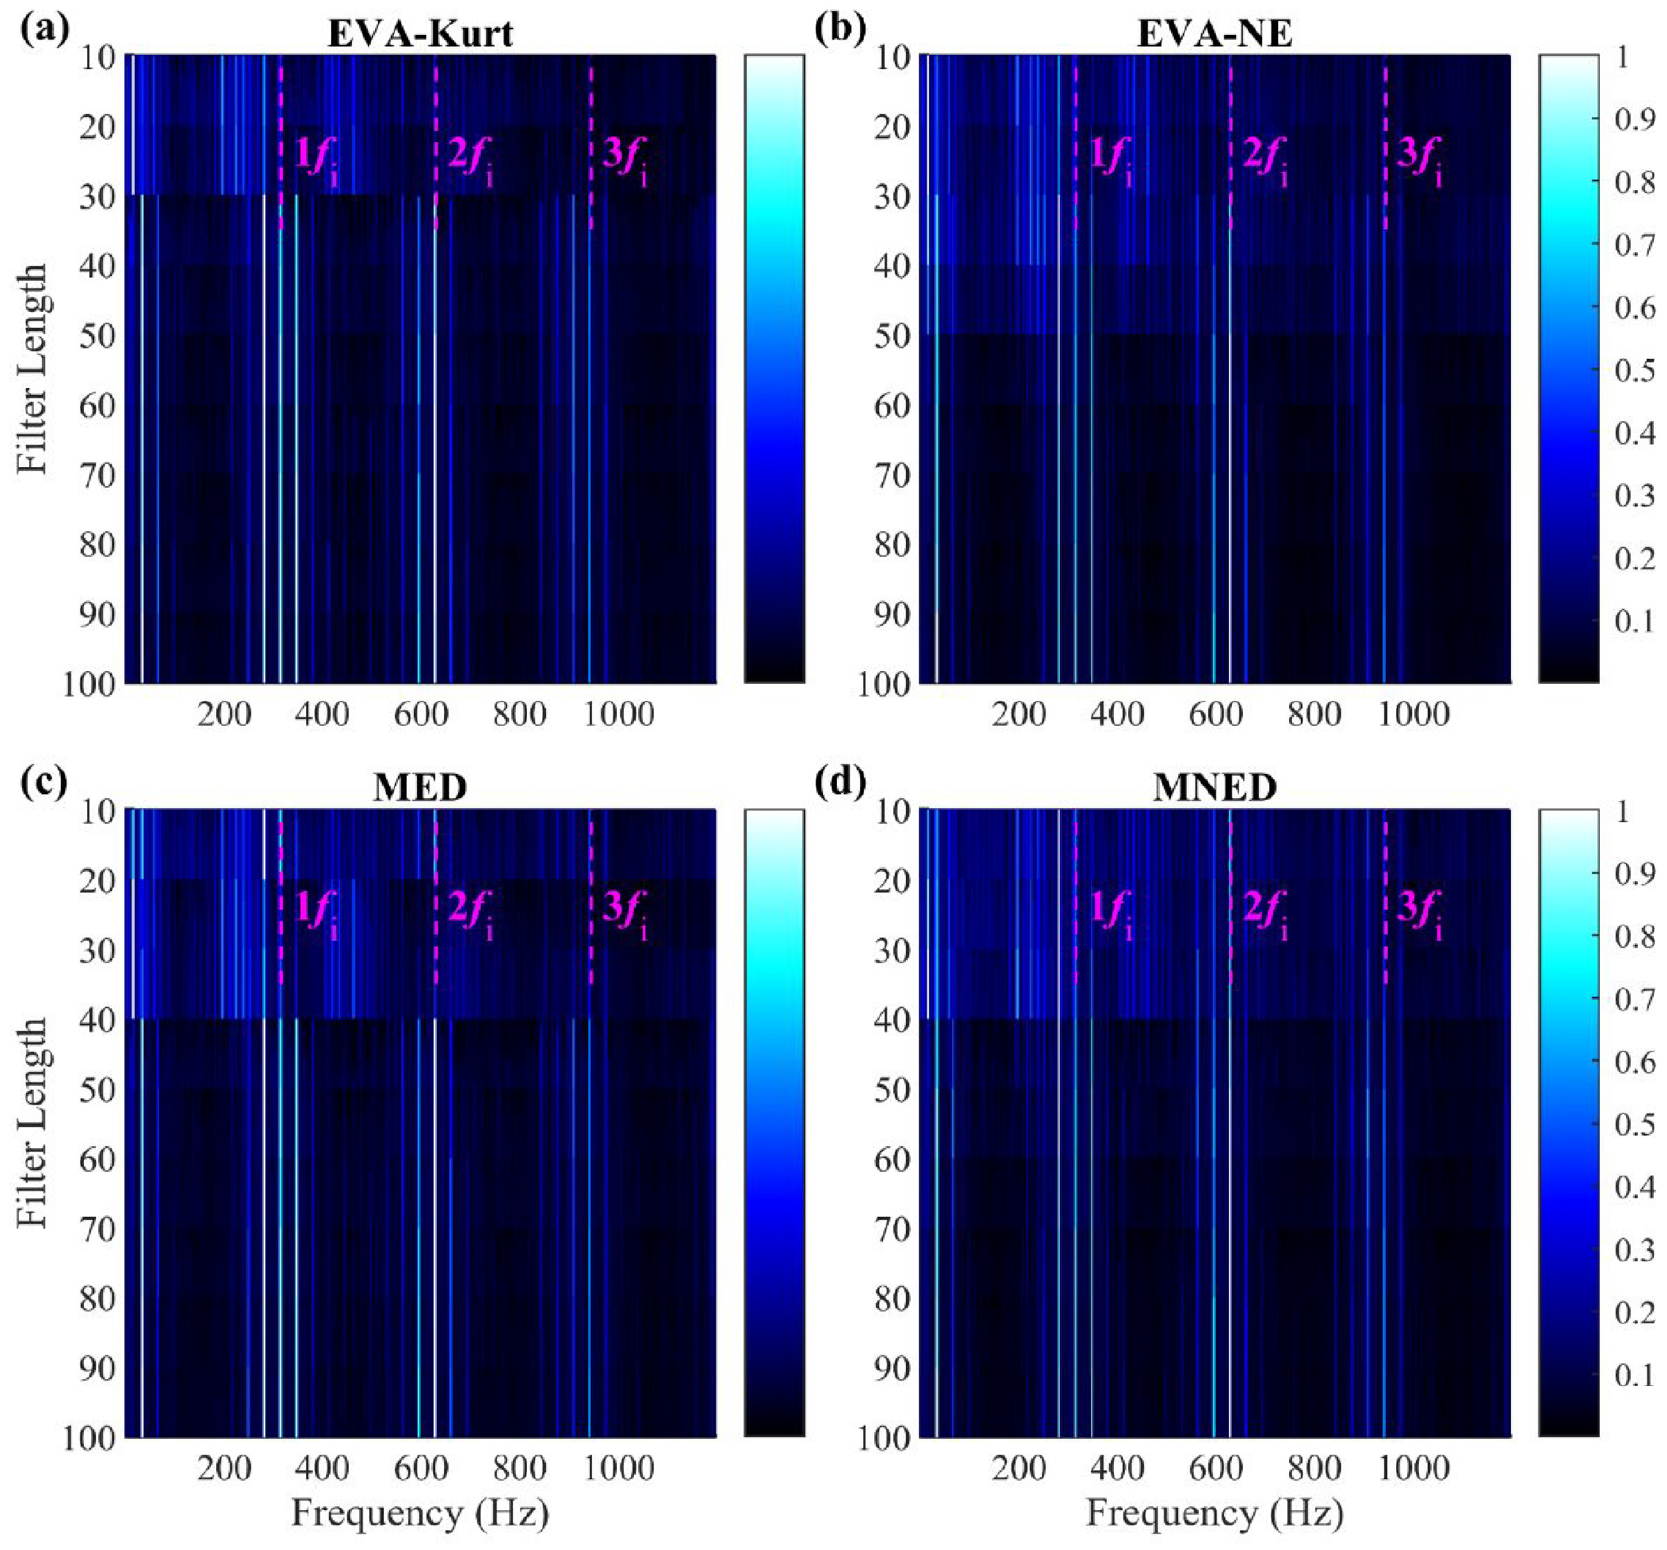
Trending of the normalized envelope spectra with filter length for experimental case 2: (a) EVA-Kurt, (b) EVA-NE, (c) MED and (d) MNED.
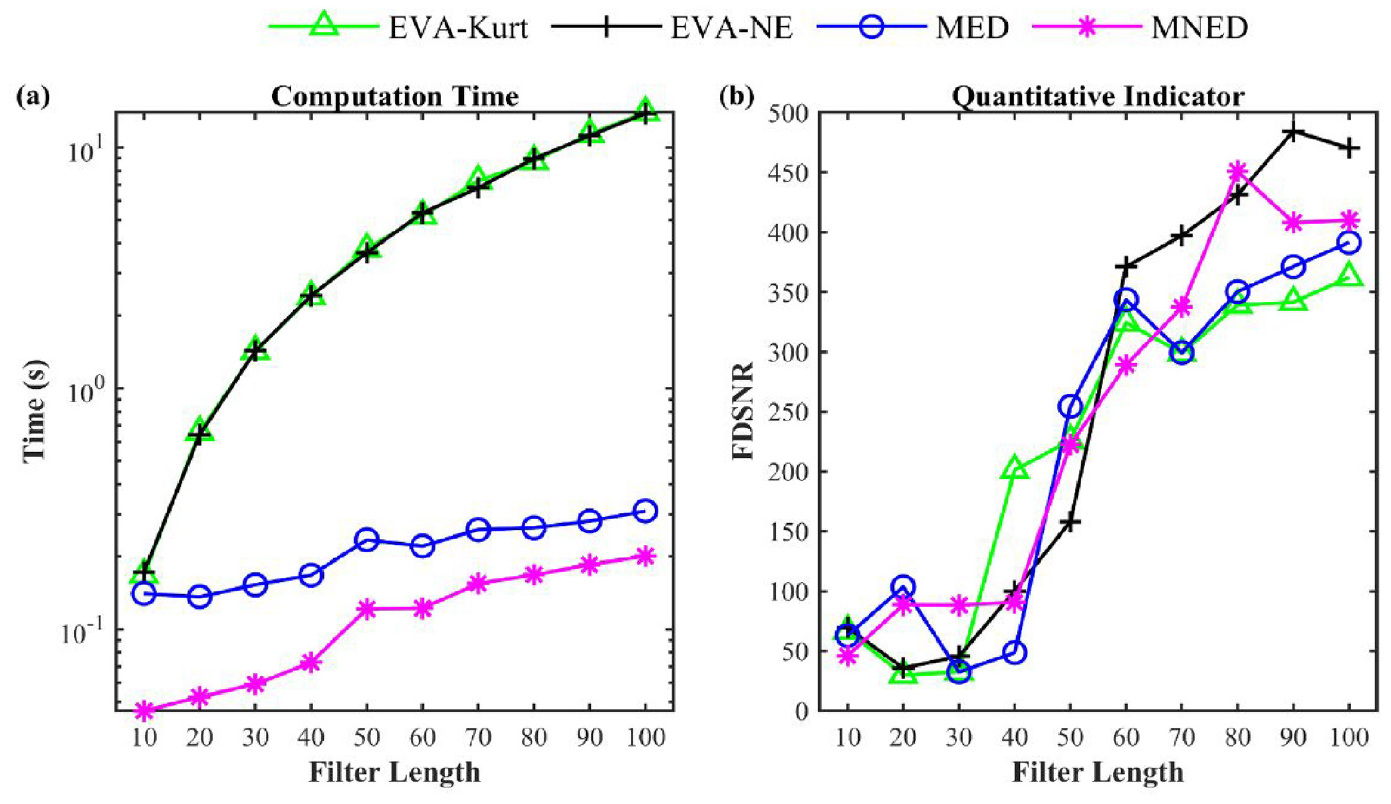
(a) Computation time and (b) quantitative indicators of different BD methods under varying filter lengths for experimental case 2.
From Figure 21, the harmonics of fi and their sidebands are distinct in all four envelope spectra, which provides strong evidence for the presence of inner race fault. The longer the filter length, the clearer the spectral lines, which is different from the simulation case. As presented in Figure 22(b), the FDSNR values of the four methods are roughly equivalent. The resulting FDSNR value of the four methods all increases with the filter length, which may be caused by the complexity of the measured signal. From Figure 22(a), the calculation time shows a similar trend to the simulated case as well as case 1. The EVA technology takes considerably more time when the filter length becomes longer. MNED takes the shortest time among the four methods.
To further demonstrate the insensitivity of MNED to random shocks, a set of simulated disturbance shocks are added to the original signal of experimental case 1. Figure 23 plots its waveform and envelope spectrum. The four added random shocks are indicated by the green dashed line with a scaled amplitude. The actual amplitude is 1.5 times the maximum amplitude of the original signal.
(a) Waveform and (b) envelope spectrum for experimental case 2 with random shocks.
Figure 24 plots the filtering results for L = 50. It is worth acknowledging that, compared to the original envelope spectrum in Figure 23(b), all four methods yield envelope spectra with higher amplitudes at fi harmonics. Among them, with distinct fault characteristic frequencies and low amplitude noise components, the envelope obtained by MNED is more in line with expectation. From Figure 24(a), (c) and (e), the top four impulses in amplitude coincide roughly with the green dashed lines. This indicates that all three existing methods enhance the additional shock to a greater or lesser extent. In the corresponding envelope spectra, the fault-independent noise components account for a large proportion. In contrast, from Figure 24(g) and (h), MNED appropriately enhances fault-related cyclic impulses, leading to ideal diagnostic results.
Filtered signals (L = 50) and their envelope spectra for experimental case 2 with random shocks added: (a) and (b) EVA-Kurt, (c) and (d) EVA-NE, (e) and (f) MED and (g) and (h) MNED.
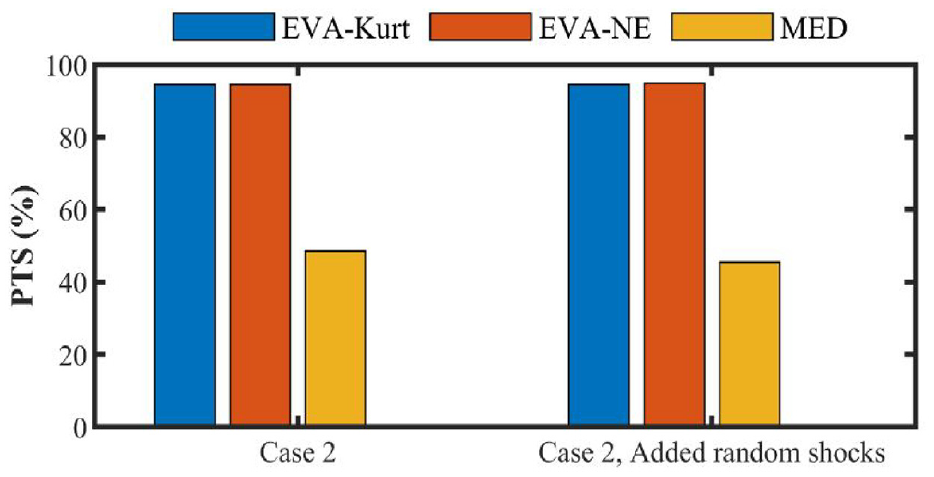
Figure 25 illustrates the filtering results of four BD methods in varying filter lengths. As shown in Figure 25(b) and (d), the fi and its harmonics, as well as the sidebands spaced at rotational frequencies dominate. The two NE-guided methods yielded acceptable results. However, comparing to Figure 21, it is difficult to identify the inner race fault of the test bearing from Figure 25(a) and (c). Figure 26 quantitatively compares the calculation time and performance of the four methods. From Figure 26, when the filter length increases from 10 to 100, the FDSNR values of MED and EVA-Kurt are always relatively small. It is further illustrated that the performance of kurtosis-guided BD methods degrades significantly after adding random shocks. It can be seen from Figure 26(b) that EVA-NE appears to be equivalent to MNED when using long filters (greater than 70). However, as shown in Figure 26(a), the time cost of EVA-NE is much higher than that of MNED. Figure 27 illustrates the percentage of time saved by MNED in case 2. The obtained results exhibit a high degree of similarity to those presented in Figure 17. MNED demonstrates a remarkable time-saving advantage, surpassing 90% compared to EVA-Kurt and EVA-NE. This significant difference can be attributed to the increasing complexity of the EVA algorithm as the filter length extends, leading to a higher average time consumption.
Trending of the normalized envelope spectra with filter length for experimental case 2 with random shock: (a) EVA-Kurt, (b) EVA-NE, (c) MED and (d) MNED.
(a) Computation time and (b) quantitative indicators of different BD methods under varying filter lengths for experimental case 2 with random shocks added.
Average percentage of computation time saved by MNED for experimental case 2.
Conclusions
BD shows favourable performance in repetitive transient enhancement, but still suffers from some issues. One is the excessive sensitivity of kurtosis-guided BD methods to random shocks, and the other is the high computational cost of EVA-aided BD methods. To tackle these issues, a novel BD method maximizing NE through OFM is proposed, called MNED. Its effectiveness is verified by a simulated case and two experimental cases. The following conclusions can be drawn:
(1) The BD method taking NE as the optimization metric and OFM as the solution technique is practicable and justifiable. MNED can efficiently enhance repetitive transients induced by rolling bearing faults.
(2) MNED offers higher computational efficiency than the three existing methods MED, EVA-Kurt and EVA-NE. Compared with BD methods based on EVA, BD methods based on OFM are more cost-effective and have better convergence.
(3) Among the four BD methods involved, MNED has excellent performance in repetitive transient enhancement. The NE-guided BD methods deliver better resistance to random shocks than the kurtosis-guided BD methods.
In the future, the proposed method can be considered for more applications, such as gearboxes or more complex rotating machinery. Since the selection of filter length is still an open issue, adaptive selection algorithms are also worth investigating.
Footnotes
Declaration of conflicting interests
The author(s) declared no potential conflicts of interest with respect to the research, authorship and/or publication of this article.
Funding
The author(s) disclosed receipt of the following financial support for the research, authorship and/or publication of this article: This work was supported by the National Natural Science Foundation of China (Grant No. 52275133), the open project of State Key Laboratory of Traction Power, Southwest Jiaotong University, China (Grant No. TPL2210) and the China Scholarship Council (Grant No. 202108360086).