
Abstract
Central to structural health monitoring (SHM) is data modeling, manipulation, and interpretation on the basis of a sophisticated SHM system. Despite continuous evolution of SHM technology, the precise modeling and forecasting of SHM measurements under various uncertainties to extract structural condition-relevant knowledge remains a challenge. Aiming to resolve this problem, a novel application of a fully probabilistic and high-precision data modeling method was proposed in the context of an improved Sparse Bayesian Learning (iSBL) scheme. The proposed iSBL data modeling framework features the following merits. It can remove the need to specify the number of terms in the data-fitting function, and automatize sparsity of the Bayesian model based on the features of SHM monitoring data, which will enhance the generalization ability and then improve the data prediction accuracy. Embedded in a Bayesian framework which exhibits built-in protection against over-fitting problems, the proposed iSBL scheme has high robustness to data noise, especially for data forecasting. The model is verified to be effective on SHM vibration field monitoring data collected from a real-world large-scale cable-stayed bridge. The recorded acceleration data with two different vibration patterns, that is, stationary ambient vibration data and non-stationary decay vibration data, are investigated, returning accurate probabilistic predictions in both the time and frequency domains.
Keywords
Introduction
Large-scale bridges are crucial parts of the infrastructure system. While, due to the increased traffic load, the aging of materials, and extreme events such as earthquakes, typhoons, etc., the deterioration of in-service bridges will inevitably occur. Owing to the remarkable development in sensing, signal processing, data transmission, data analysis, and computing techniques in recent years, structural health monitoring (SHM) systems continue to advance at a remarkable pace to maintain reliable and safe operations for bridges.1–4 By permanently mounting multiple types of sensors on bridges, the SHM system can obtain many kinds of structural response data, for example, strains, accelerations, displacements, etc. Typical dynamic behaviors of bridges, that is, structural acceleration responses, are responsible for the safe and reliable operation of bridge systems. The dynamic performance is determined by the characteristics of the bridge structure and the external load, for example, vehicle load and wind load. SHM measurements modeling includes data regression and forecasting techniques. The bridge dynamic behavior forecasting is critical and attractive for researchers, especially in the field of damage detection and structural vibration control. Forecasting techniques can be adopted effectively to predict the structural acceleration response. Through the data modeling techniques, the possible behavior pattern of the structure in the future can be obtained, and the damage can be predicted. Accordingly, maintenance and reinforcement measures can be suggested.
In the civil engineering realm, however, it is challenging to carry out data modeling, and especially to forecast future structural responses considering various uncertainties, including the uncertainty of the structure system, the uncertainty of the monitoring data, etc. Knowledge of future actions (e.g., loads or environmental parameters) and system behaviors (e.g., corrosion, settlement) would be helpful for response forecasting. Various forecasting methods have been exploited and applied in response analysis for civil structures, for example, time series methods, statistical methods, gray predictions, etc. Moller and Reuter 5 presented a new fuzzy time series strategy for predicting structural responses considering data uncertainties. Prakash et al. 6 proposed a statistical framework to forecast the long-term behavior of a dam structure by using limited SHM data exhibiting non-stationarity. A new gray prediction model called the background value optimization nonlinear gray prediction model is proposed to predict landslide displacement. 7 In terms of whether or not the need for structural model information, forecasting methods can be divided into two kinds: the model-based method and the model-free method. (1) In the context of the model-based method, a structural mechanical model is generally required to derive future damage state or failure probability. 5 (2) The model-free procedure does not need a mechanical model for forecasting future structural responses. It can predict structural behaviors on the basis of a sequence of measured response data through various algorithms, including autoregressive moving average model,8–10 Bayesian dynamic linear model,11–15 and Gaussian Process (GP),14–17 etc. As one type of model-free methods, eigen-perturbation-based algorithms were also developed. Bhowmik et al.18–20 and Tripura et al. 21 successively proposed multiple eigen-perturbation-based algorithms, including recursive singular spectrum analysis, recursive canonical correlation analysis, and recursive principal component analysis. Both numerical and experimental case studies were undertaken for validating the effectiveness of these eigen-perturbation-based methods. These kinds of methods require the transformation of the structural model into a computational model, which can handle uncertain input data. In addition, due to their excellent nonlinear data modeling ability, machine learning-based models have also been proven to be a decent alternative for structural response forecasting, such as Bayesian methods, SVM (support vector machine),22–25 Artificial Neural Network,26–31 Recurrent Neural Network,32–36 and the long-short term memory network.37–40 Machine learning-based model is capable of extracting effective features based on a great many SHM data. In addition, SHM data are generally nonlinear, and the machine learning-based method can approximate the complex nonlinear problems. According to the training of historical monitoring data, an intelligent data forecasting model can be constructed through the deep learning method, which can be used to predict the future structural behavior and to generate the decision-making basis for the practical engineering problems. However, this method has high requirements on data, and a huge amount of effective data is needed. In addition, the algorithm training process is tedious and time-consuming, and the machine learning-based model may cause the overfitting problem, which will reduce the forecasting accuracy. In this situation, wavelet transform is generally adopted to carry out noise reduction work, and then the machine learning-based method can extract the nonlinear characteristics of time series more effectively.
However, there exists a main drawback in the current structural time series response modeling approaches. The robustness of the forecasting method needs to be improved. The high robustness can enable forecasting algorithms to adapt to structural responses under different loads and structural responses in different patterns, which can improve the forecasting accuracy of the algorithm. Thus, the robustness of the forecasting method is particularly important. As a kind of process-specific Bayesian forecasting model, the Sparse Bayesian Learning (SBL) scheme has been increasingly viewed as a highly promising modeling technique in the fields of statistics and time series analysis. The family of SBL-based methods witnessed various applications, including system identification in applied mechanics41,42 and damage detection in civil engineering.43,44 However, Bayesian time series analysis enabled by the SBL scheme has not been much explored in the field of civil engineering for structural response forecasting.
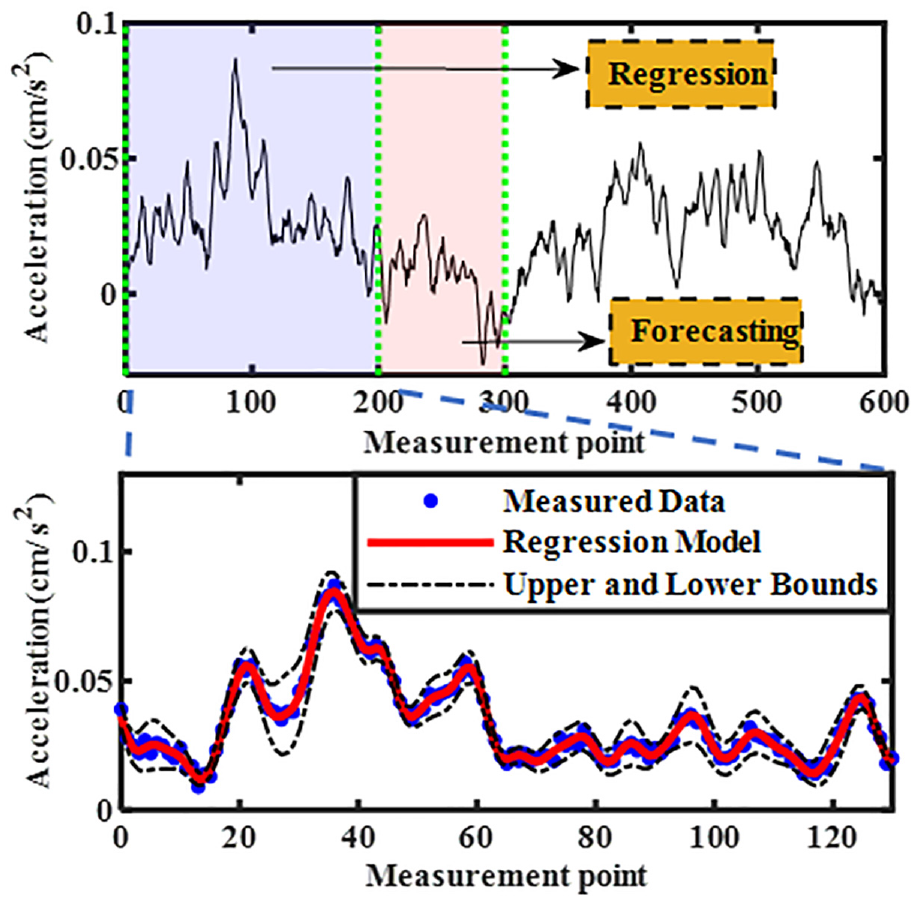
In this study, an improved SBL (iSBL) forecasting model is proposed to enhance the generalization ability of the model and to improve the robustness of the prediction model due to its unique sparse characteristics, which can expand the application scope from the data regression analysis to the data forecasting analysis, as shown in Figure 1. This study mainly focuses on the data modeling for SHM field data with the motivation to obtain high-precision data regression and forecasting results through the proposed iSBL framework. Regression analysis can reduce data uncertainties, signal noise, and environmental interference to obtain more accurate structural response data, while the forecasting analysis can accurately predict the future trend of the structural response or the future structural behaviors based on the previous historical monitoring data. And a further early warning can be carried out to avoid the occurrence of catastrophic accidents. Based on the results of regression and forecasting analysis, damage detection, reliability assessment, fatigue analysis, or remaining life estimation can be further conducted.
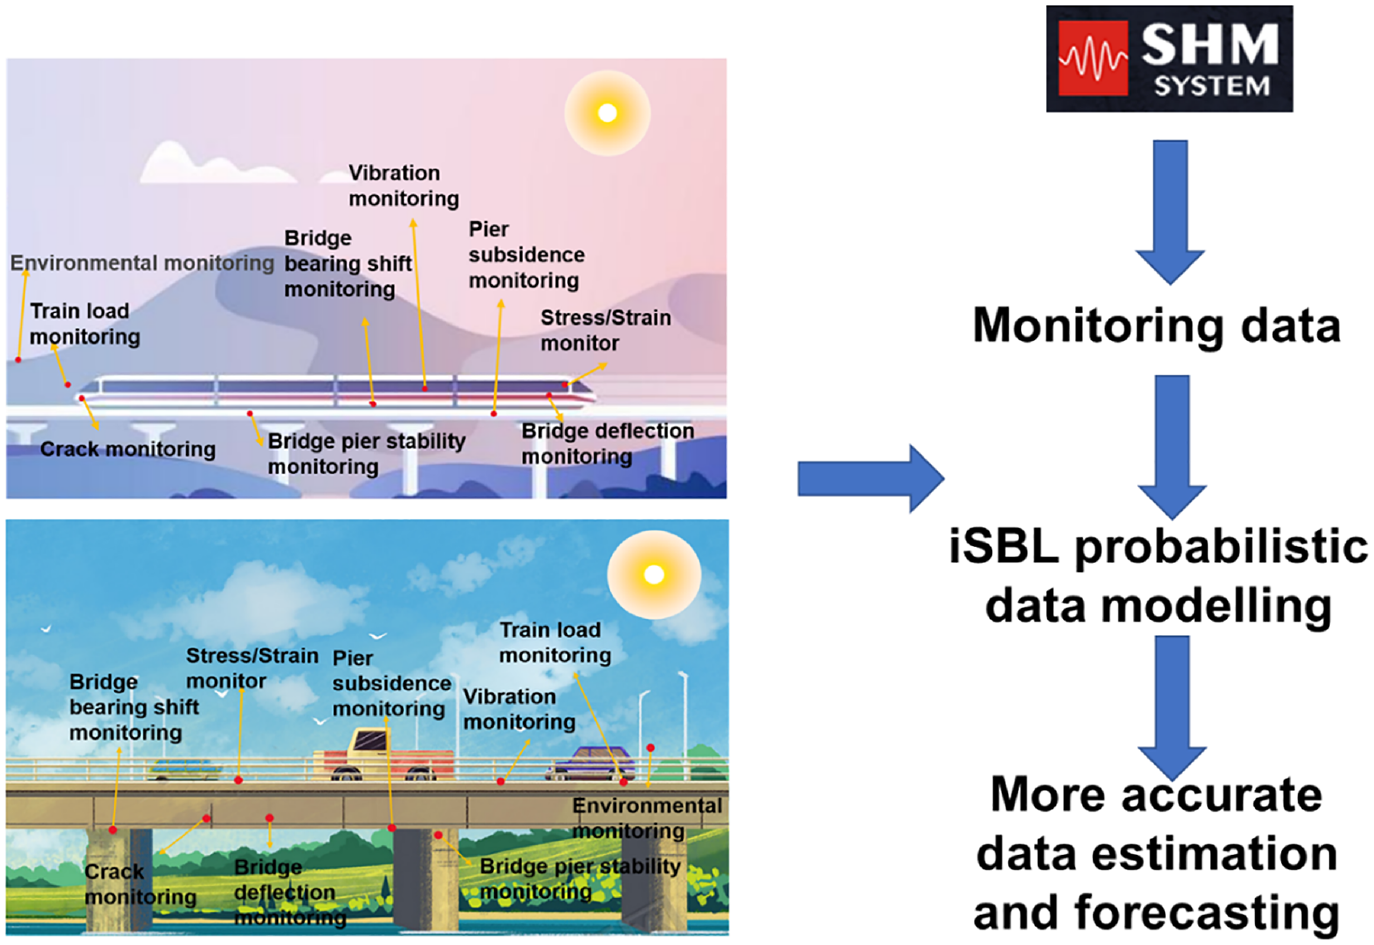
iSBL probabilistic data modeling of SHM monitoring data.
The main contributions of this study can be summarized as follows. Firstly, to the best of our knowledge, it is the initial attempt to realize structural response regression and forecasting with uncertain data in civil SHM applications by using the improved SBL scheme. Secondly, by constructing the iSBL model and conducting the inference of the weight vector, the sparsity features of the SHM data can be captured for accurate data forecasting. Thirdly, the modal frequencies information is investigated based on the forecasting data to verify the better prediction performance of the proposed method in the frequency domain. The proposed method is validated on an SHM benchmark structure (a long-span cable-stayed bridge) with recordings of acceleration measurements in different vibration patterns and damage states.
The rest of the study is organized as follows. The second section “Theory of the iSBL scheme for SHM data regression and forecasting” begins by laying out the theoretical dimensions of the proposed methodology. In this section, we circumstantially present the iSBL framework, as well as the Kernel function for data feature modeling. The third section introduces the case study structure in this article, that is, an SHM Benchmark structure—Tianjin Yonghe Bridge, as well as the SHM system and field data. The fourth section “iSBL regression performance for SHM data” and the fifth section “iSBL forecasting performance for SHM data” elaborate on the experimental validation results of the proposed method, focusing on two key themes: regression and forecasting performance with respect to different vibration patterns and bridge states. The final section concludes the current work and the outlook of future directions.
Theory of the iSBL scheme for SHM data regression and forecasting
This study proposes an improved SBL algorithm for SHM data regression and forecasting analysis. Specifically, the out-of-sample algorithm is introduced for refinement to expand the application scope for the predictive analysis of SHM data. The proposed iSBL framework firstly introduces the general Kernel-based machine learning methods and puts forward the general SBL scheme. The second part introduces the formula derivation process of the improved SBL for SHM data regression and forecasting. The detailed theoretical derivation and computational procedure are provided in the sections “Kernel method in the SBL framework” and “An improved SBL scheme for data modelling”.
Kernel method in the SBL framework
Kernel method is the abbreviation of Kernel-based machine learning method. And it is an important branch of pattern recognition research. 45 Since the Kernel method is based on the statistical learning theory and the Kernel method theory, it has become a method that has the ability to quantify uncertainty and solve nonlinear pattern recognition problems.
In the general linear regression method, a training sample set

where
Compared with the general linear regression method, the Kernel method based on the Bayesian framework can not only solve the ill-posed problem but also can quantify and incorporate various uncertainties. Besides, it is also suitable for nonlinear problems. In the field of SHM, the basic idea of the Kernel method enabled by Bayesian theory to quantify uncertainty is described as follows: due to uncertainties of the structural model and measured data, the Kernel method should not only seek a single optimal solution but describe all possible models that can effectively represent observed data and prior information. When dealing with nonlinear problems, the Kernel method can be regarded as an infinite-dimensional learning model.
Among the Kernel methods, SVM is firstly proposed by Boser, 46 which had become one of the 10 most influential data mining algorithms selected by the 2006 IEEE International Conference on Data Mining due to its excellent recognition performance and strong generalization ability. 47 With the development of SVM, Tipping 48 proposed the SBL (also known as Relevance Vector Machine) based on SVM. Unlike the principle of structural risk minimization of SVM, the SBL framework adopts Bayesian inference for the parameter estimation, which makes the SBL have the ability of sparse expression and stronger robustness.
In the SBL framework, Equation (1) can be rewritten as follows:

In Equation (2),

where
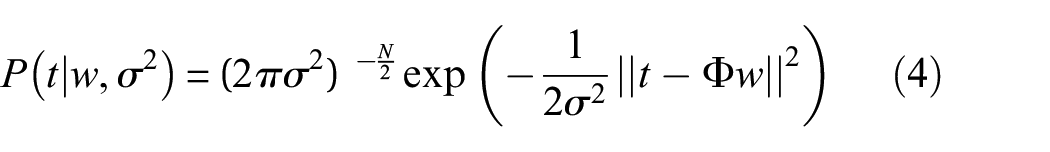
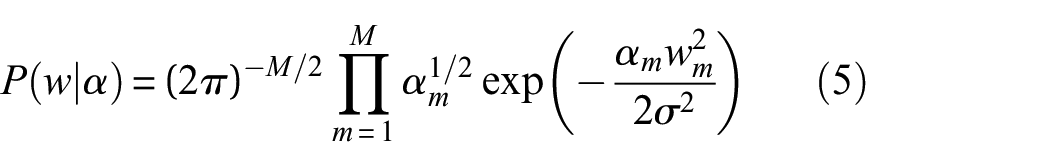
where
If
where
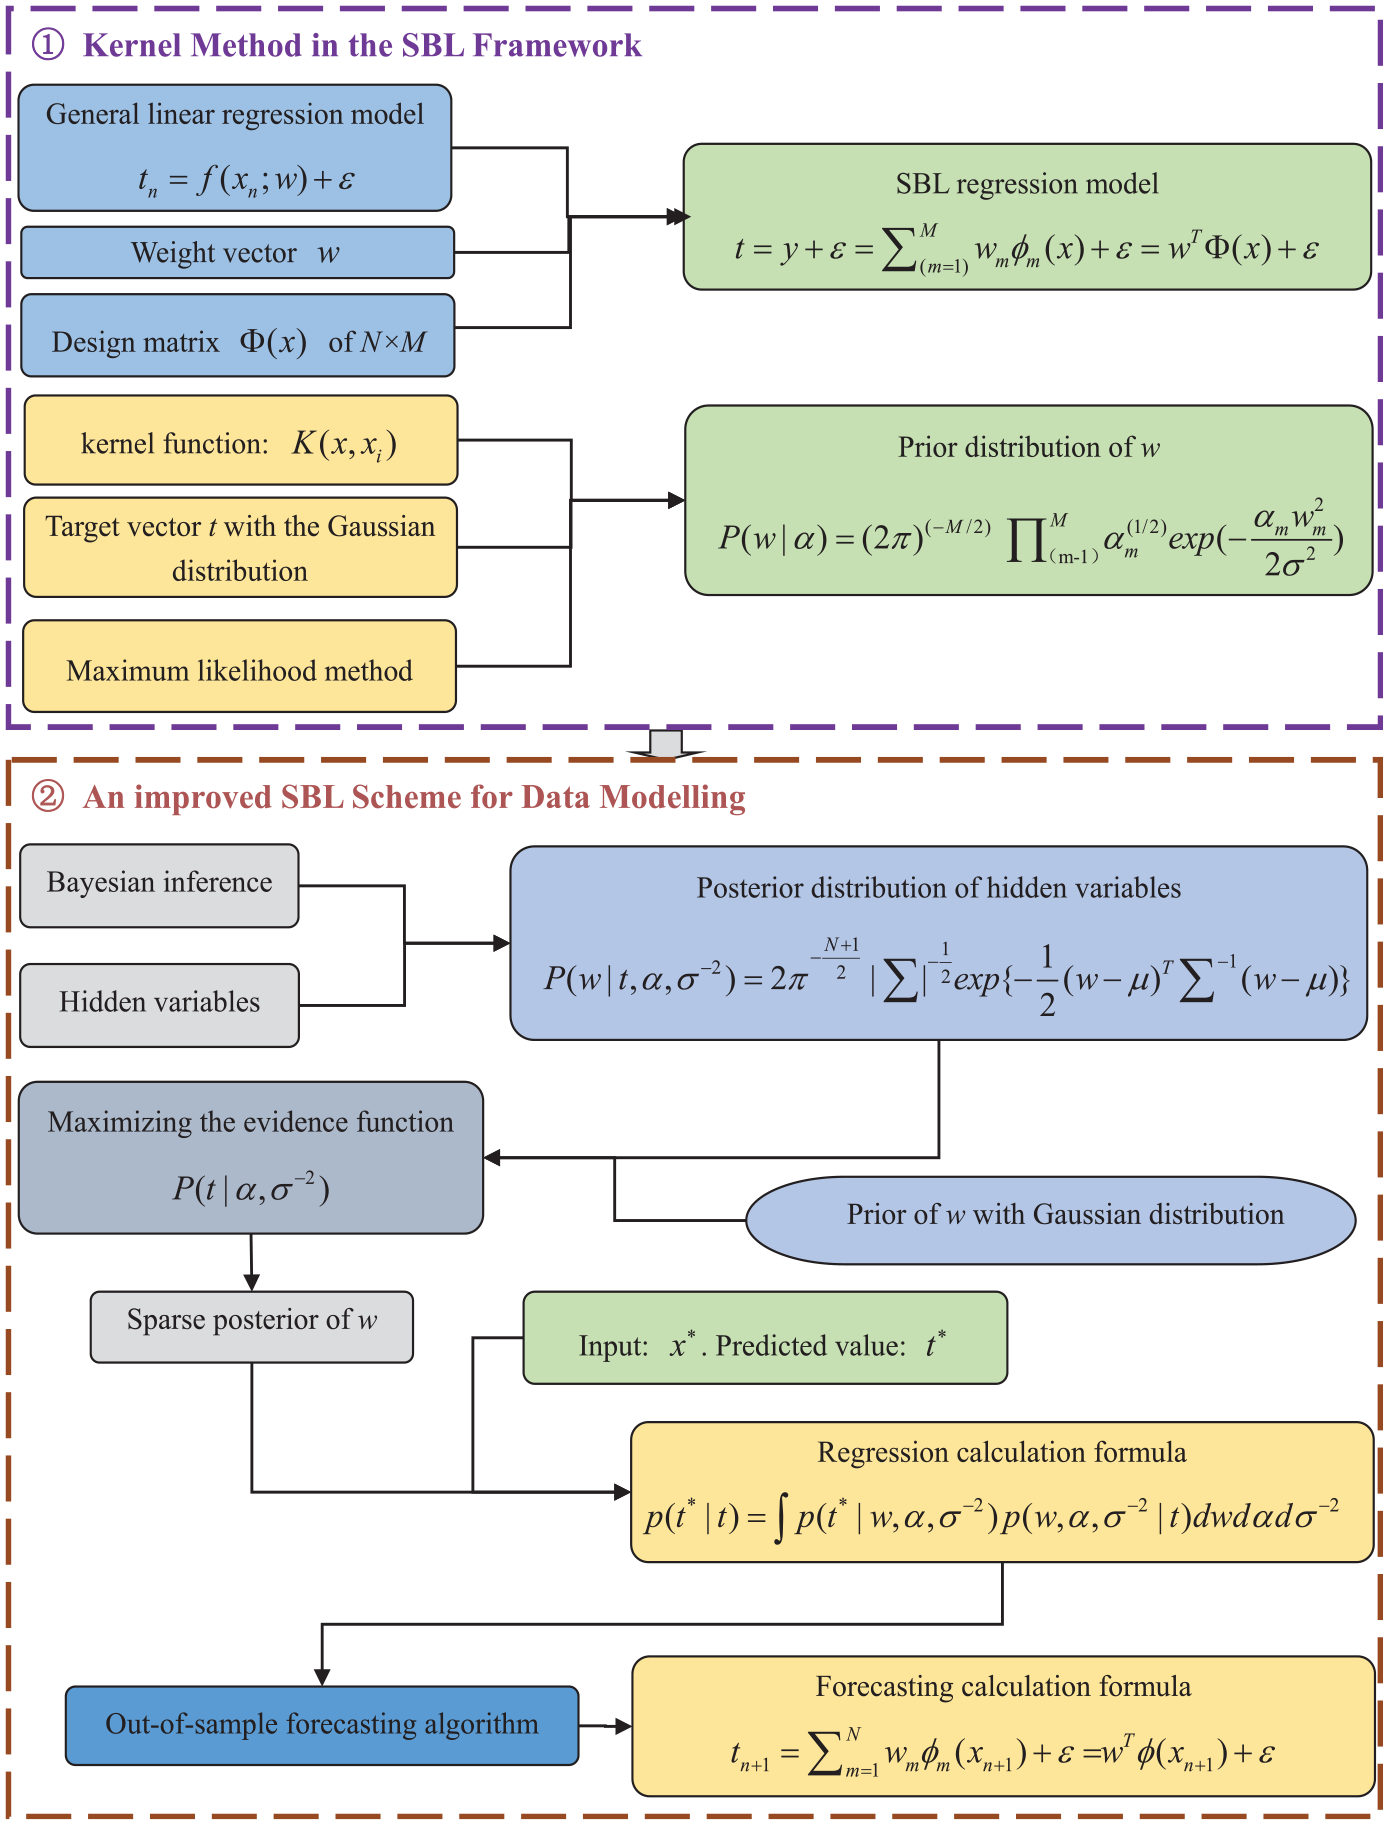
Flowchart for the theoretical framework of iSBL scheme.
An improved SBL scheme for data modeling
In order to improve the data modeling accuracy, and to expand the application scope for data forecasting, an improved SBL framework is proposed in this study by integrating an out-of-sample forecasting algorithm. In the proposed iSBL framework, the hidden variables
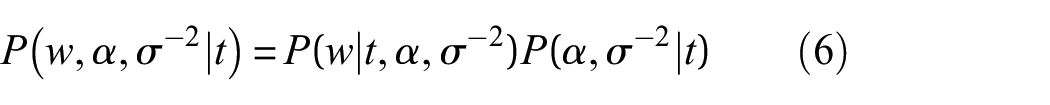
Further, Equation (6) can be rewritten as:
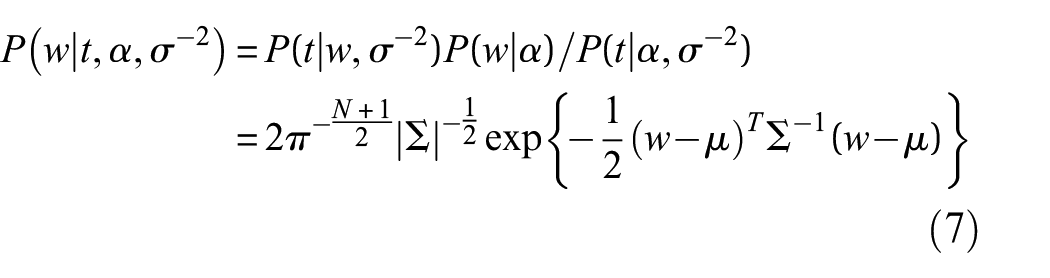
In Equation (7), the posterior for w obeys Gaussian distribution, that is,

where
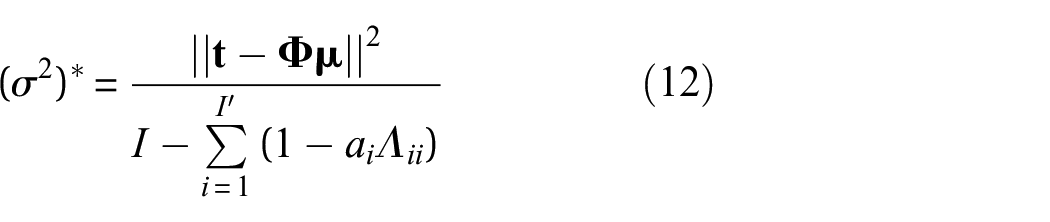
A most-probable estimate
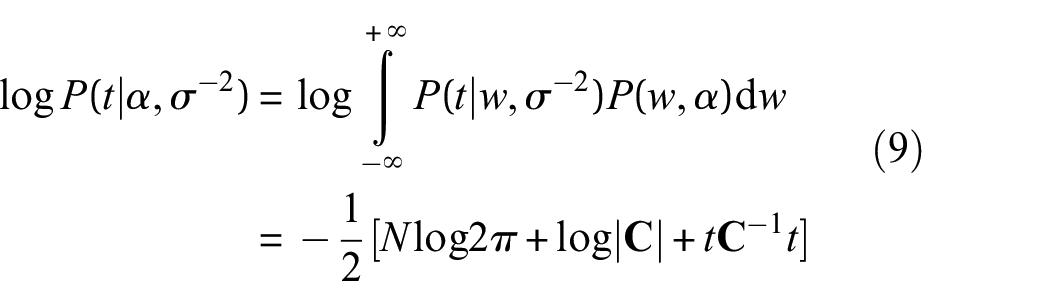
with

Then, a most-probable estimate
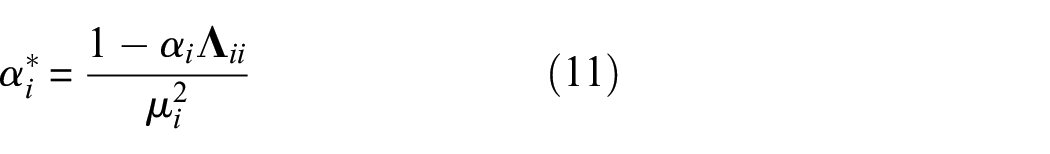
where
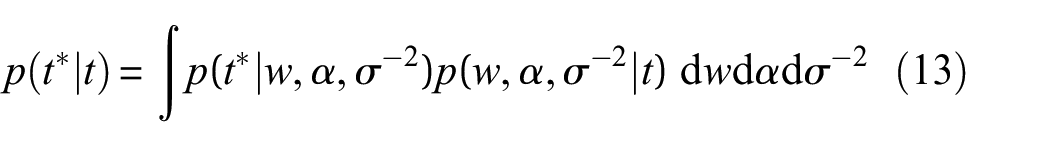
After the parameters of the regression model are determined as aforementioned, for any given new input
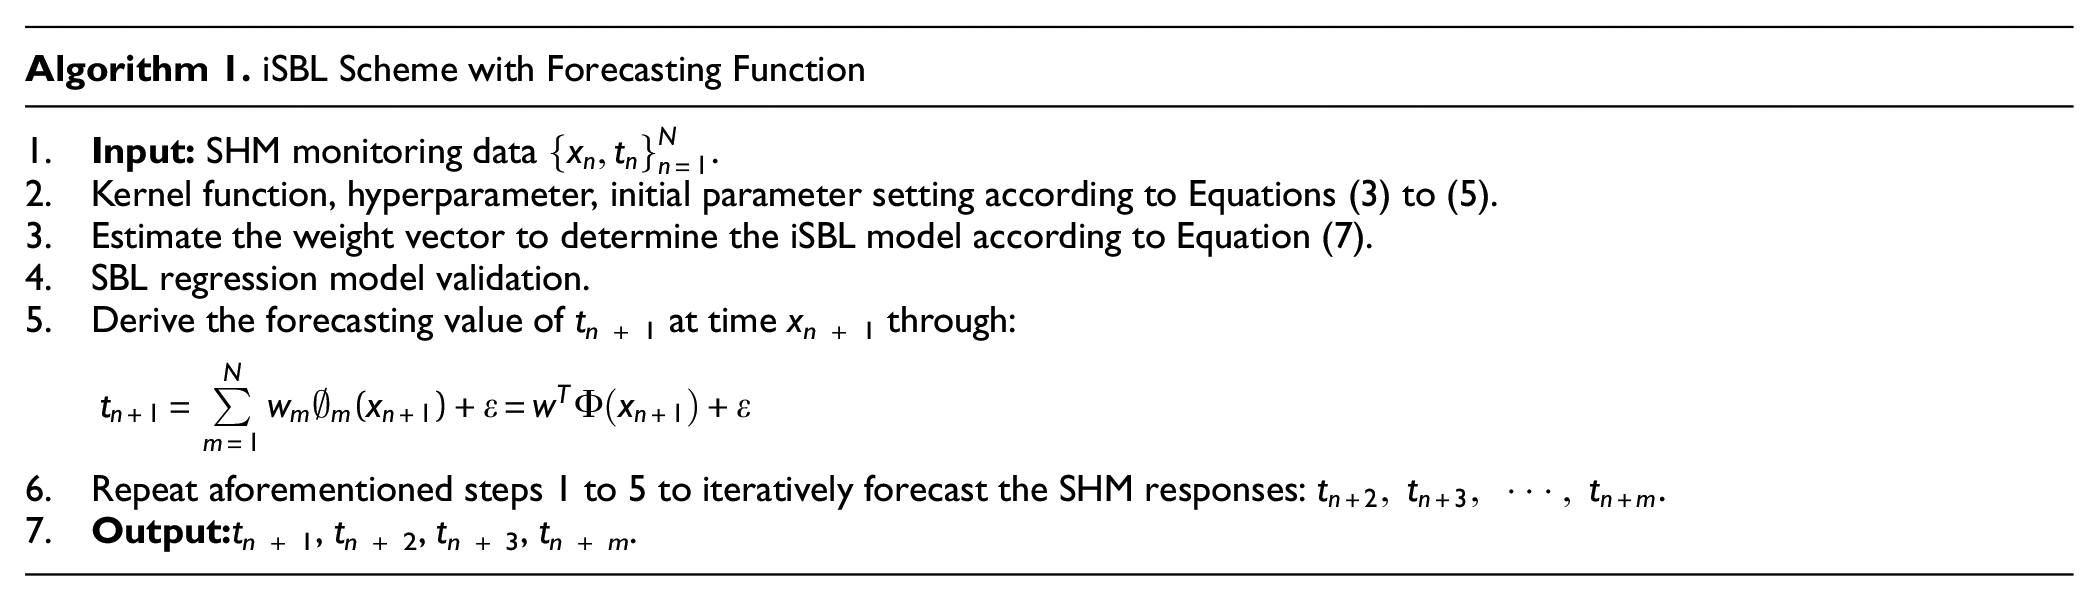
The out-of-sample forecasting algorithm is introduced in the proposed improved iSBL framework. The forecasting of the target vector is based on the SBL regression model of the training set. To be specific, when the future development of a target vector needs to be predicted, the implicit features of the training data can be found through the regression model, and then the out-of-sample forecasting can be conducted based on the regression model. The general steps for the iSBL forecasting algorithm are as follows: (i) Determine the input vector and target vector according to the prediction target; (ii) Establish regression model; (iii) Test regression model; (iv) Calculate the forecasting value and evaluate the forecasting error. The iSBL modeling approach for SHM time series forecasting is detailed in Algorithm 1.
Case study bridge with the SHM system
SHM benchmark structure—Tianjin Yonghe Bridge
One of the SHM benchmark structures, Tianjin Yonghe Bridge shown in Figure 3, is used as the case study structure in this article. Tianjin Yonghe Bridge is a prestressed concrete cable-stayed bridge with a main span of 260 m, double towers, double cable planes, and a continuous floating system. The main girder is 510 m long, the span arrangement is 25.15 m +99.85m + 260 m + 99.85 m + 25.15 m, and the cross section is a typical P–K section. The height of the tower is 55.5 m, and the inclined leg section of the tower is a steel-framed concrete hollow column. The main pier has a caisson foundation, the foundation of other piers is a kind of pipe-pile foundation, and the side piers are equipped with 100 tensile supports. The cables of the whole bridge are arranged in a fan shape, with a total of 176 cables.
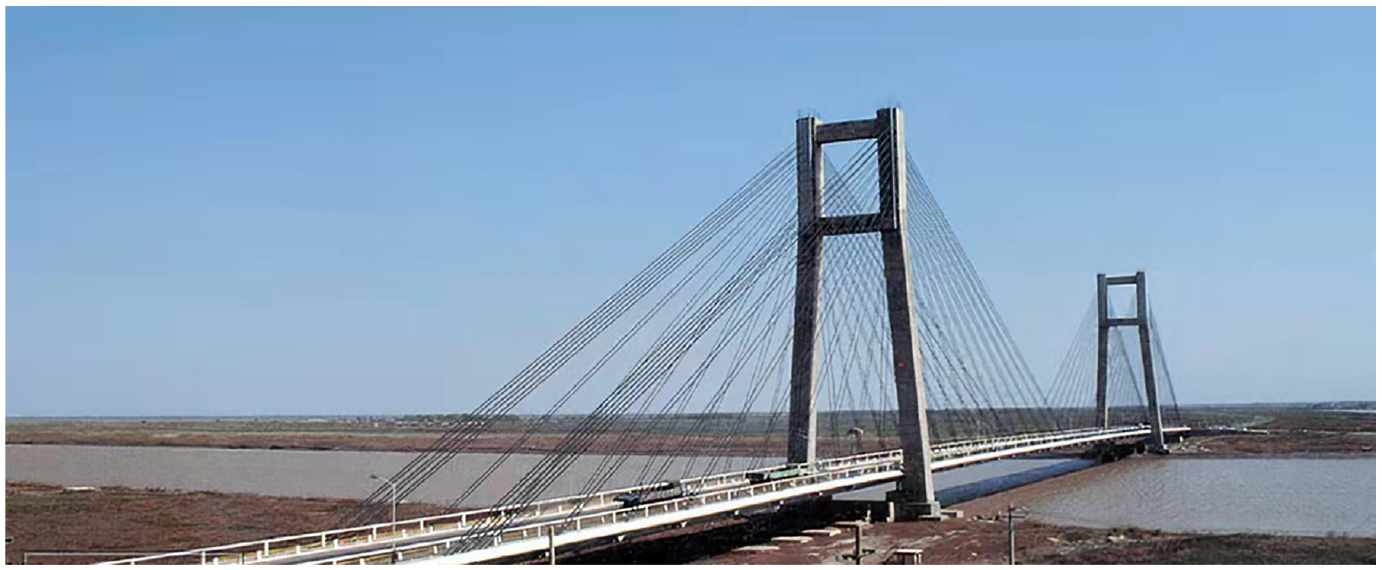
Overall view of Tianjin Yonghe Bridge.
Tianjin Yonghe Bridge was completed and opened to traffic in December 1987. After 19 years of operation, Tianjin Yonghe Bridge was found to have some cracks with a maximum width of 2 cm in the closure segment of the main span, severe corrosion of some stay cables, and other damages. In responding to these damages, the first attempt for repair and reinforcement was carried out from July 2006 to February 2007. Specific reinforcement measures included replacement and reinforcement of the closure segment, cable replacement of the entire bridge, and deck refurbishment. Besides, the second repair was carried out from December 2008 to May 2009.
SHM system and SHM field data
The SHM system was designed and installed during the first repair. This SHM system 51 mainly includes the environmental monitoring subsystem, the cable force monitoring subsystem, the deformation monitoring subsystem, the structural dynamic response monitoring subsystem, the main girder stress monitoring subsystem, the traffic load monitoring subsystem, and the data processing, acquisition, and structural analysis subsystems.
The source of the vibration data studied in this study is recorded by the structural dynamic response monitoring subsystem. The dynamic response monitoring adopts capacitive acceleration sensors. The full-bridge has seven test sections and a total of 14 single-axis acceleration sensors. Figure 4 shows the acceleration sensor layout for Tianjin Yonghe Bridge. The time period of the vibration data analyzed in this study is between the first maintenance and the second maintenance. The data during this period include health data, damage data, and transition state data. Specifically, the data on January 17, 2008 is in the health state, the data on July 31, 2008 is in the damage state, and the damage is considered gradually developed from January 17, 2008 to July 31, 2008. Figure 5 shows the vibration data of sensors with No. 1, No. 7, and No. 13 in health state (January 17, 2008), transition state (May 18, 2008), and damage state (July 31, 2008).
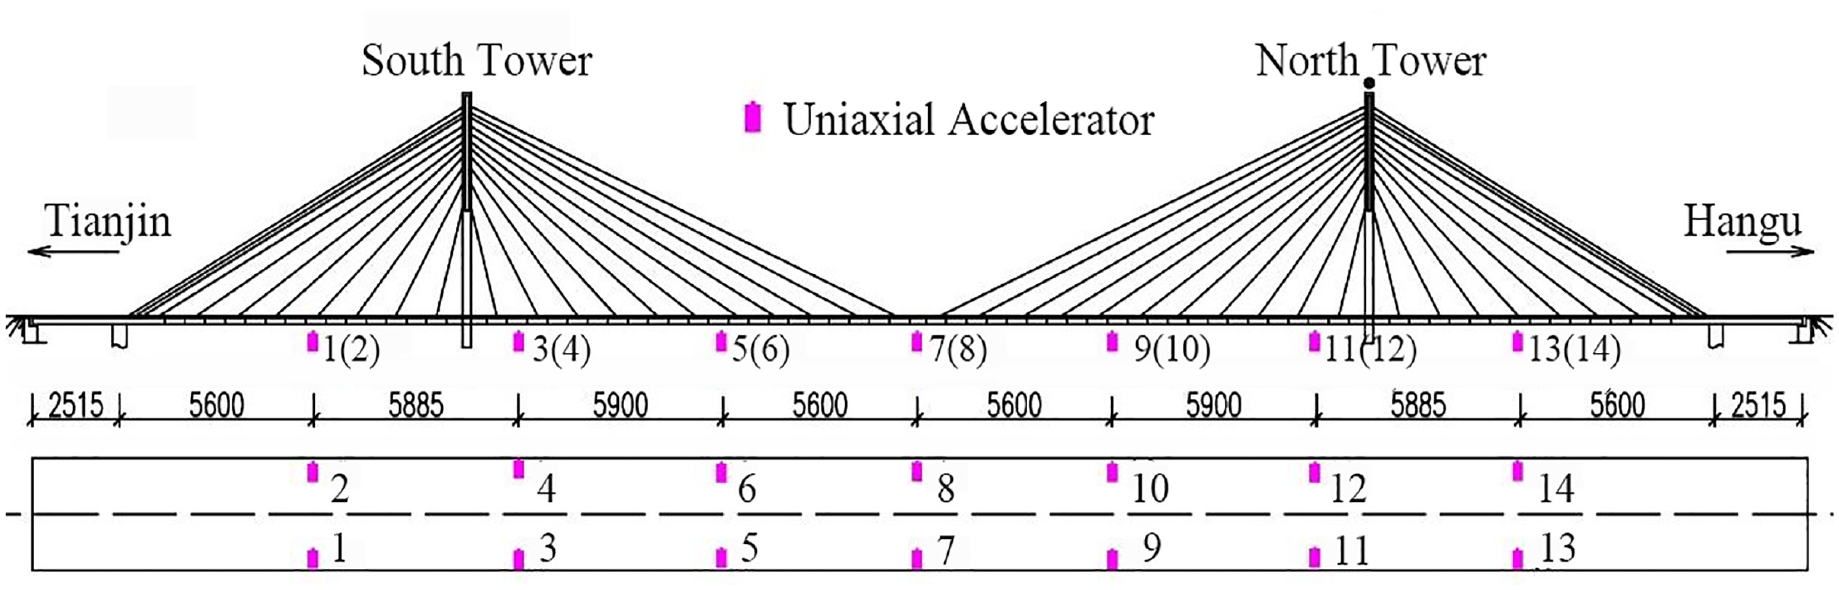
Acceleration sensor layout for Tianjin Yonghe Bridge.
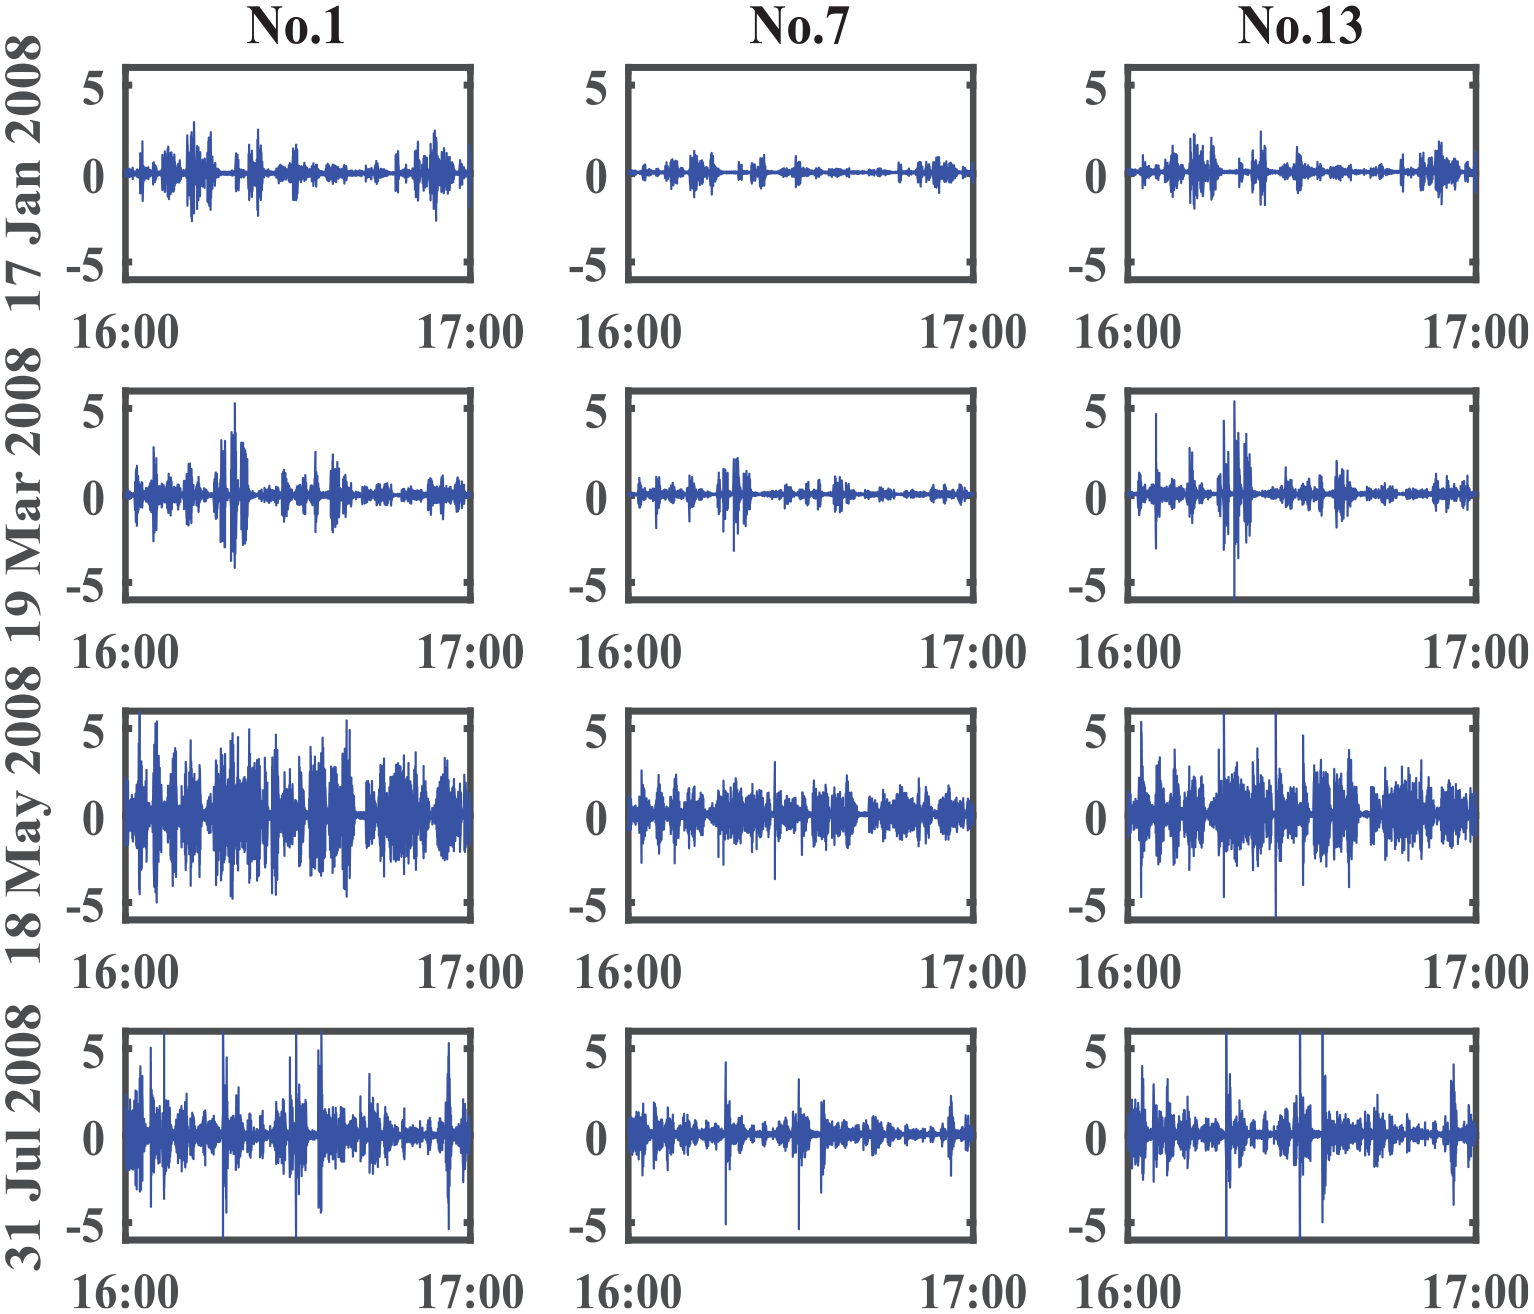
Measured vibration data in health state, transition state, and damage state.
iSBL regression performance for SHM data
The performance of the proposed iSBL framework for regression analysis will be validated based on the SHM field data from Tianjin Yonghe Bridge. The test of the iSBL regression model mainly focuses on the degree of fitness. The higher the degree of fitness, the better the regression model. To explore the iSBL regression performance of vibration data under different data characteristics, the SHM vibration measurements used in this study are divided into the health data and damage data from the perspective of bridge performance states. The vibration data are divided into stationary ambient vibration data and non-stationary decay vibration data from the perspective of the amplitude of vibration data. Therefore, the following four types of vibration data with different patterns are used for regression analysis in this section: (1) stationary ambient vibration data in the health state; (2) non-stationary decay vibration data in the health state; (3) stationary ambient vibration data in the damage state; (4) non-stationary decay vibration data in the damage state.
ISBL regression models for SHM vibration measurements
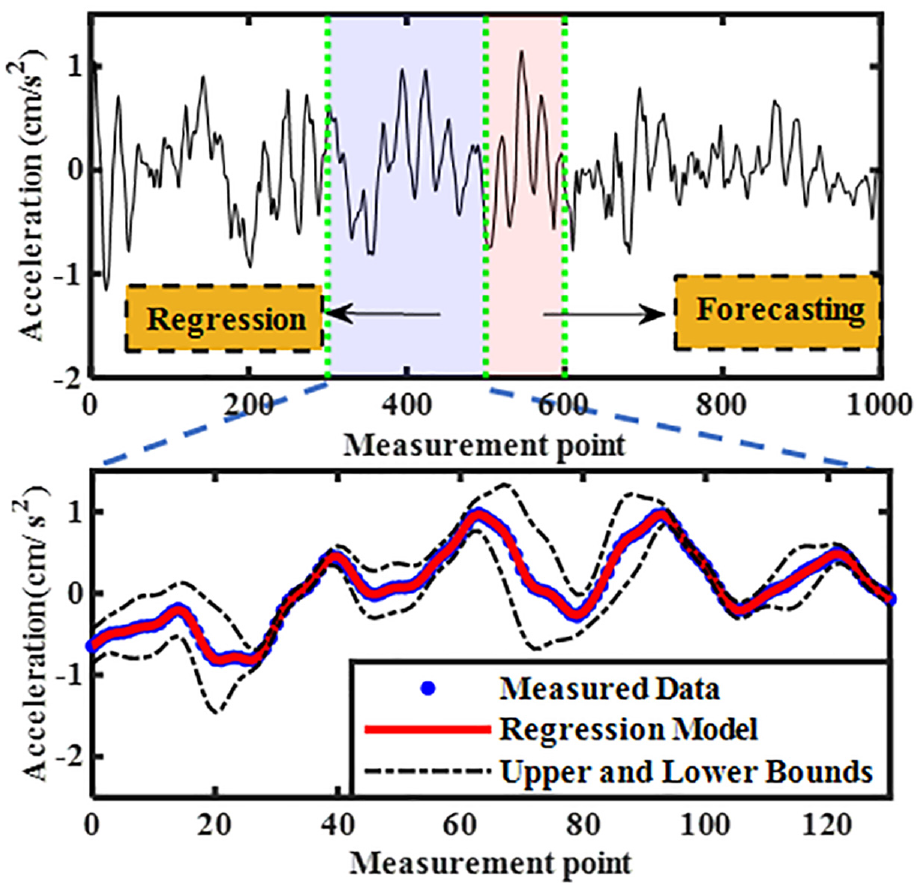
Both stationary ambient vibration data and non-stationary decay vibration data in the health state from the No. 1 acceleration sensor during 2:00 a.m. and 3:00 a.m. on January 17, 2008 were employed for the iSBL regression analysis. The constructed iSBL regression models for the stationary and non-stationary SHM data are given in Figures 6 and 7, respectively.
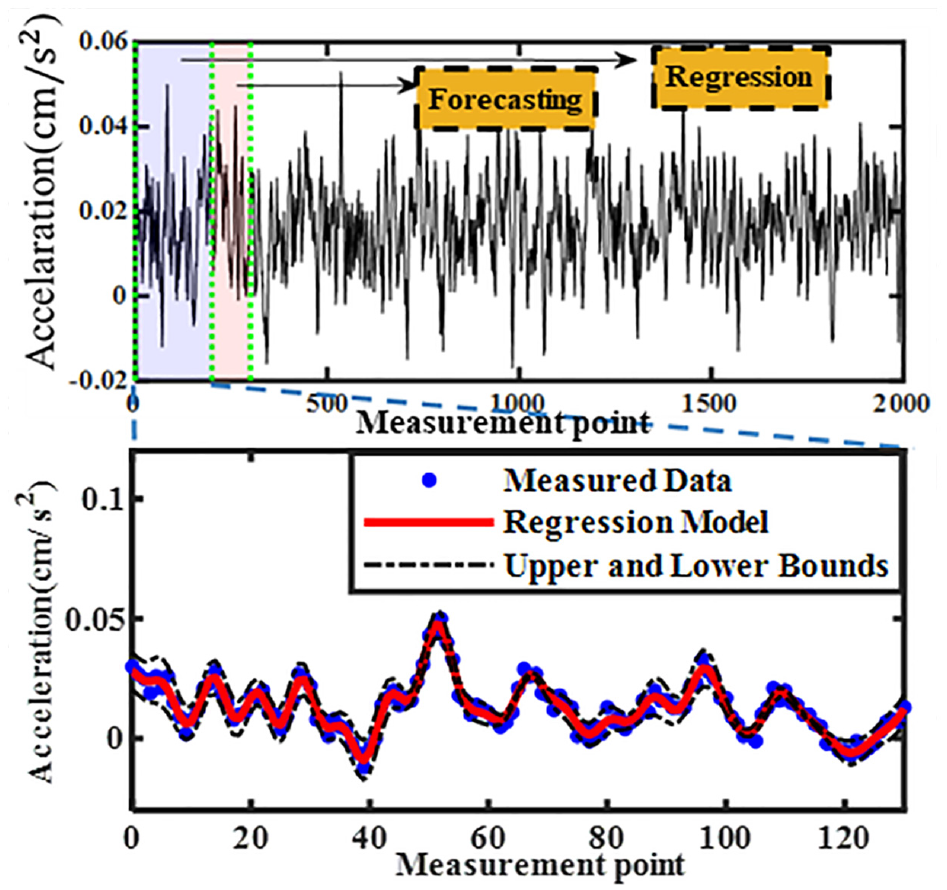
iSBL regression model for stationary SHM data (health state).
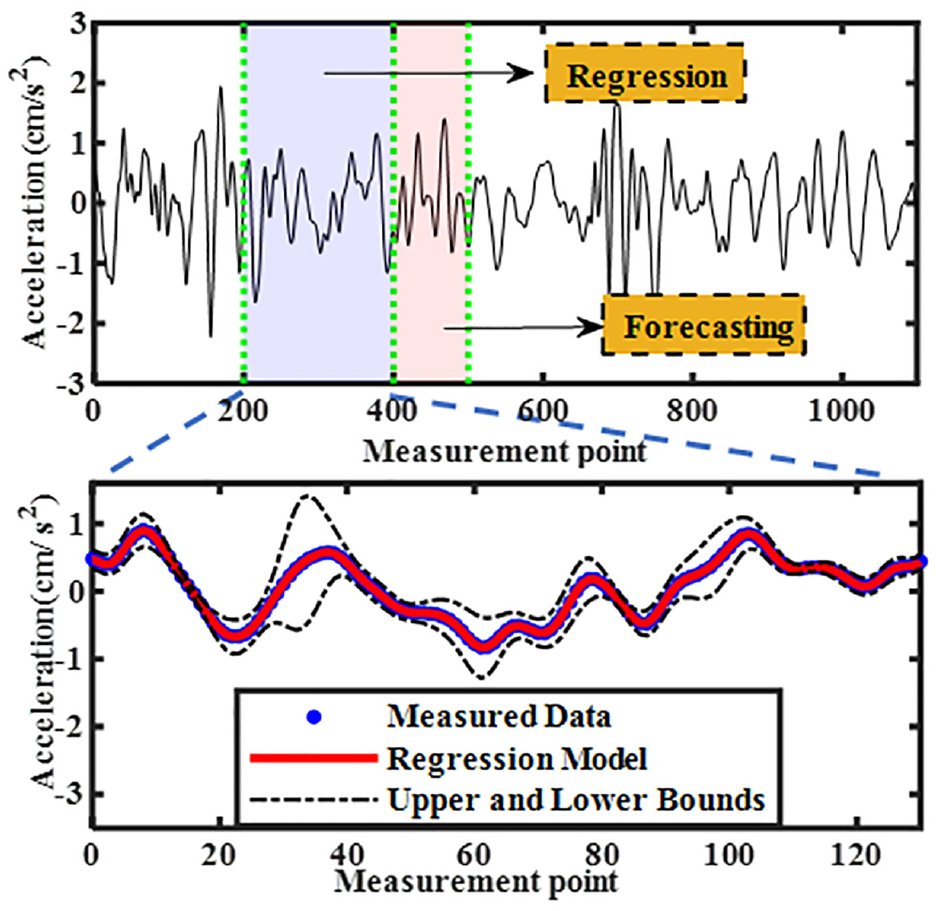
iSBL regression model for non-stationary SHM data (health state).
In order to further verify the robustness of the iSBL algorithm for different performance states, SHM vibration data in the damage state from the No. 1 acceleration sensor on July 31, 2008 were employed for the iSBL regression analysis. The iSBL regression results for the stationary ambient data during 1:00 a.m. and 2:00 a.m. are shown in Figure 8, and the iSBL regression results for the non-stationary decay data during 4:00 a.m. and 5:00 a.m. are shown in Figure 9. According to the inspection record, there exist some cracks and the damage locations of these cracks are close to No. 1 acceleration sensor. Therefore, the monitoring data of the No. 1 acceleration sensor can better capture damage information and better represent damage state data. That is the reason why the No. 1 acceleration sensor is selected.
iSBL regression model for stationary SHM data (damage state).
iSBL regression model for non-stationary SHM data (damage state).
Comparative analysis of the iSBL regression performance
According to Figures 6 to 9, it can be concluded that, in terms of the fitting degree, the iSBL regression models of non-stationary decay vibration data basically pass through every measured data, but the iSBL regression models of ambient vibration data do not. Preliminary analysis of the reason for this phenomenon is described as the amplitude of the ambient vibration data is much smaller than that of the non-stationary decay vibration data, the signal-to-noise ratio in the ambient vibration data is smaller, and the regression models of ambient vibration data are more affected by noise. Also, the upper and lower bounds for the 95% confidence interval are provided in Figures 6 to 9. It can be found that the width of the confidence interval of stationary data is relatively narrow, and the width of the confidence interval changes little over time. For non-stationary data, the width of confidence interval is wider, and the width of confidence interval varies significantly with time. This phenomenon applies to both health state and damage state data. The reason for this phenomenon is that signal noises are basically unchanged for stationary data, so the width of the confidence interval changes little. For non-stationary data, signal noises change with time, generating a varying confidence interval. Therefore, this phenomenon is consistent with the actual characteristics and features for SHM monitoring data. To further analyze the iSBL fitting degree in these two data types (ambient and non-stationary decay vibration data), the deviation values between the iSBL regression model and measured vibration data are also calculated, as shown in Figure 10.
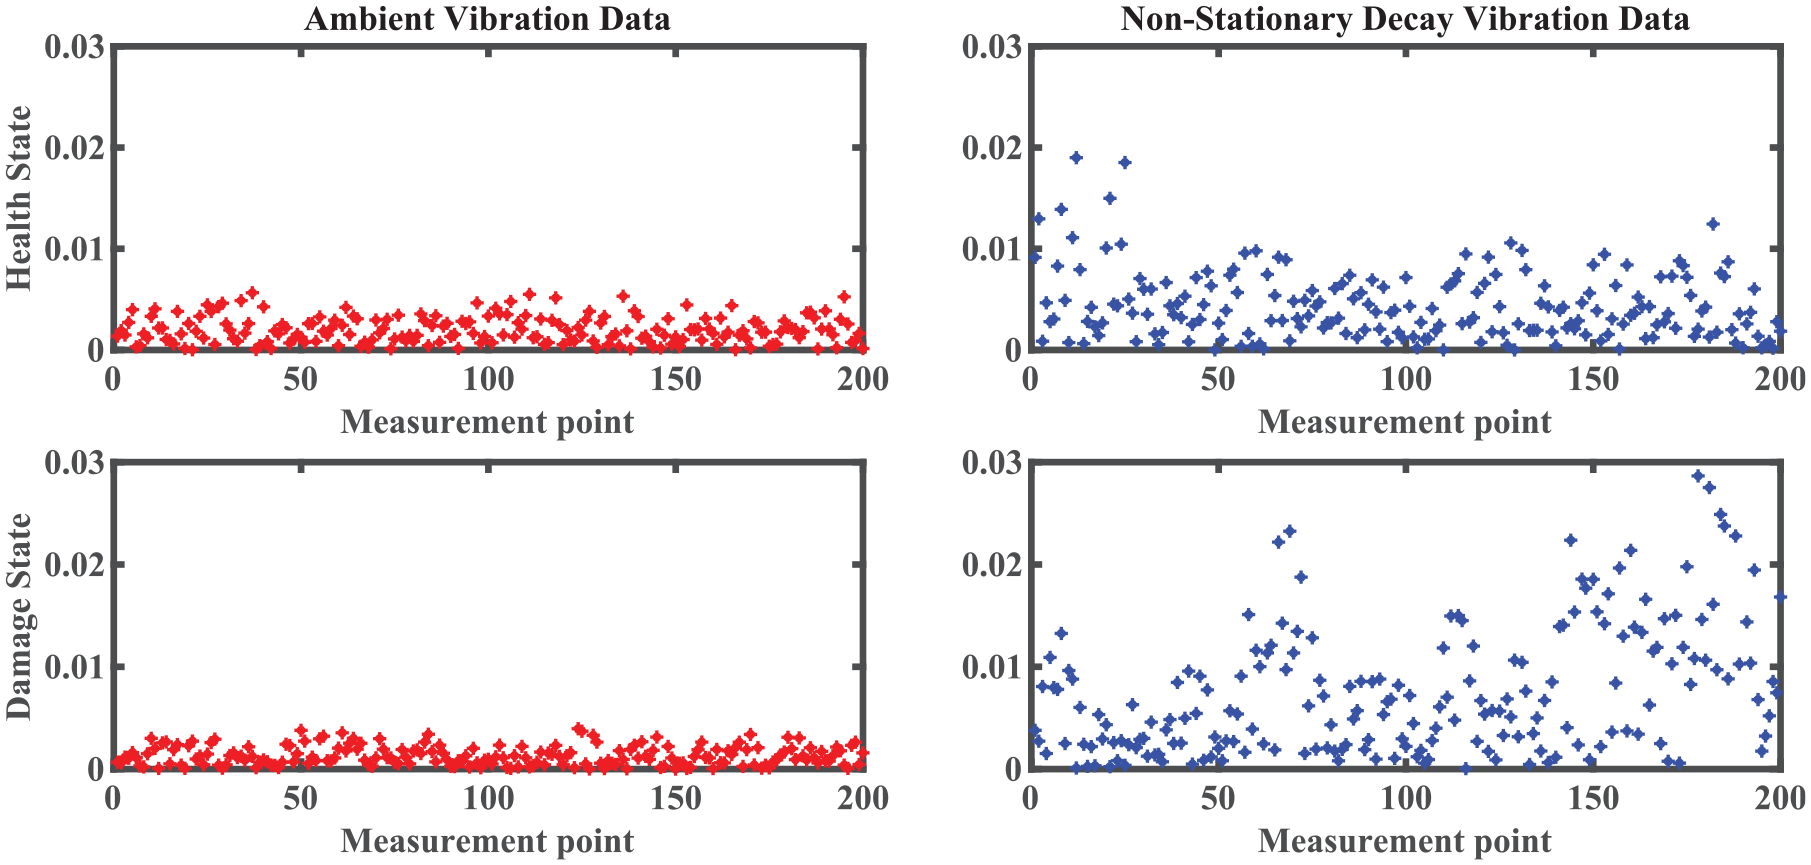
Deviation between the predictions of iSBL regression model, and measured vibration data.
According to Figure 10, the deviations of ambient vibration data are smaller than that of non-stationary decay vibration data. Actually, the deviation in Figure 10 reflects the signal noise level. For non-stationary data, the signal noise changes over time with the heteroscedastic feature, so the resulting errors change over time. The corresponding deviations for the non-stationary cases in Figure 10 are non-stationary. This phenomenon is also similar to confidence interval evaluation results, shown in Figures 6 to 9. For non-stationary data, the width of confidence interval varies significantly with time. Therefore, this phenomenon is consistent with the actual data characteristics and features for the non-stationary data. To sum up, the iSBL regressions perform well in the fitting degree of the four data types mentioned in this article, and the regression models are almost identical with the measured vibration data. This result can reflect the superiority of the iSBL model based on the Kernel method in dealing with nonlinear problems, and can accurately model the structural response data under different vibration modes.
iSBL forecasting performance for SHM data
In the SHM field, the vibration-based damage identification method is generally considered to be a promising method. Thus, the forecasting of vibration data is of great significance for structural health assessment and management decision-making. Similarly, in order to explore the iSBL forecasting performance of vibration data under different data characteristics, the aforementioned four types of vibration data are used for forecasting performance analysis in this section.
iSBL forecasting models for SHM vibration measurements
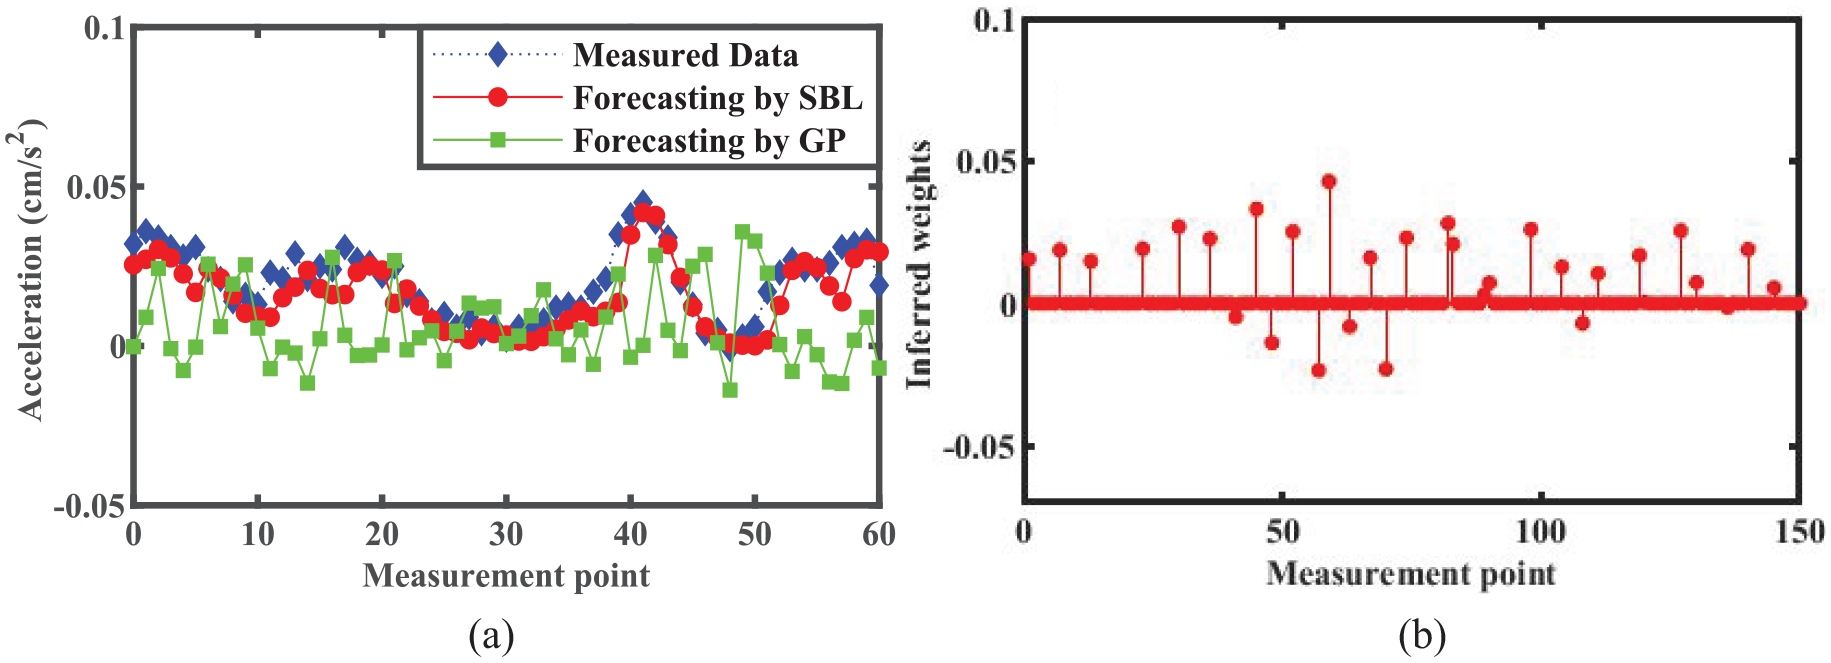
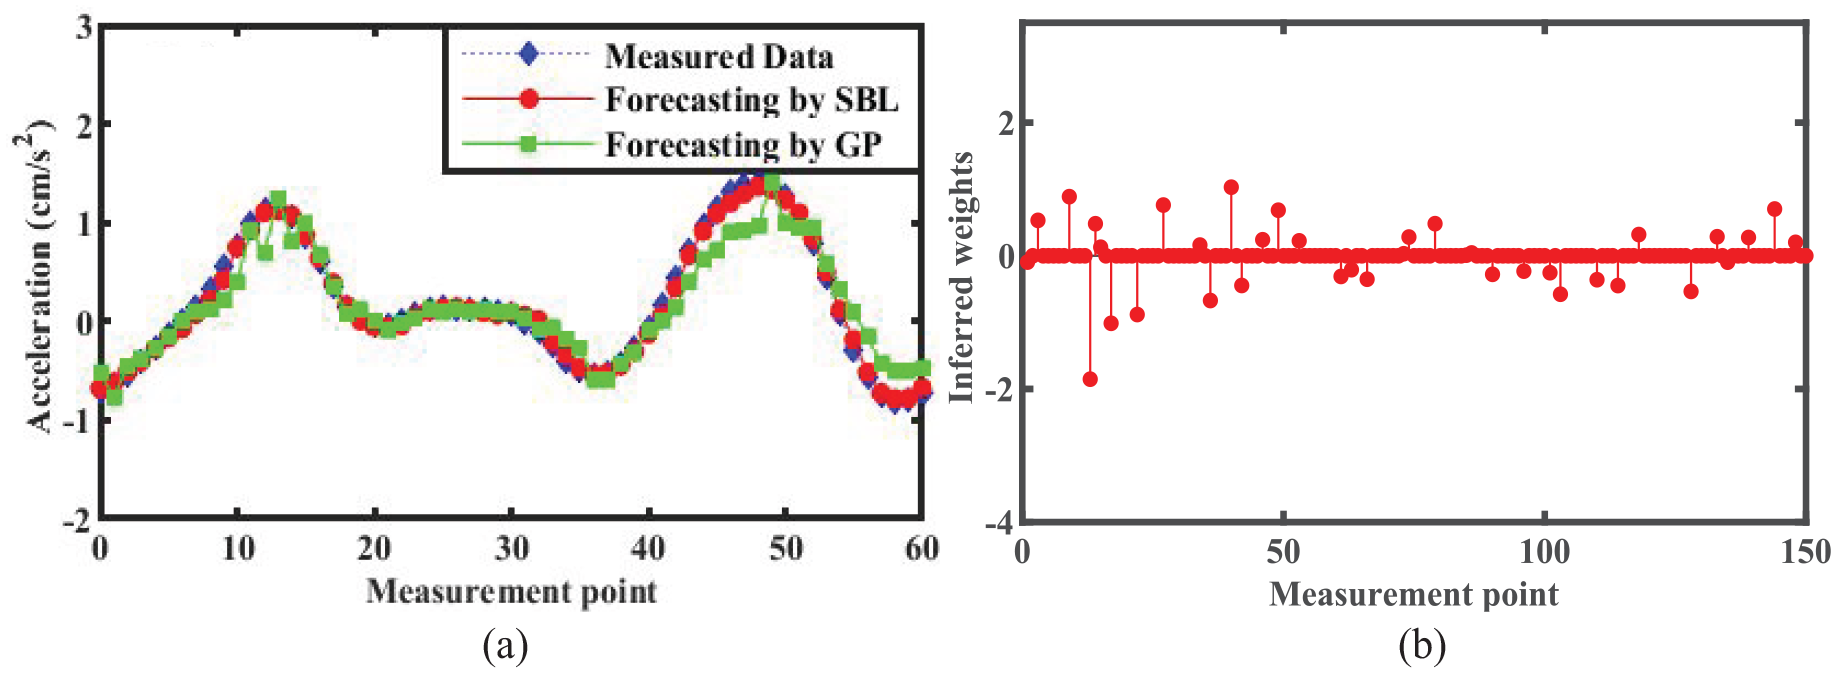
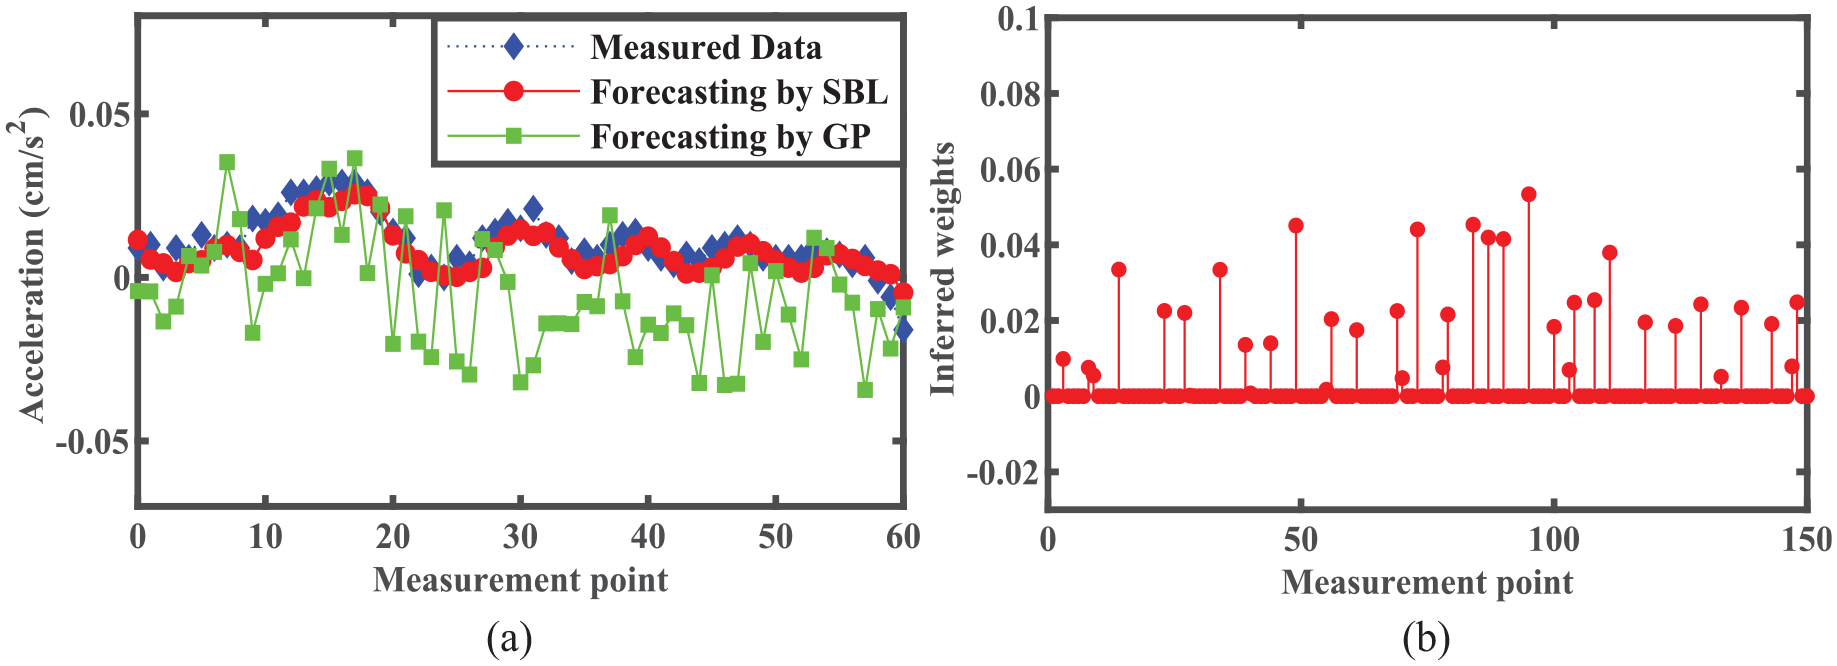
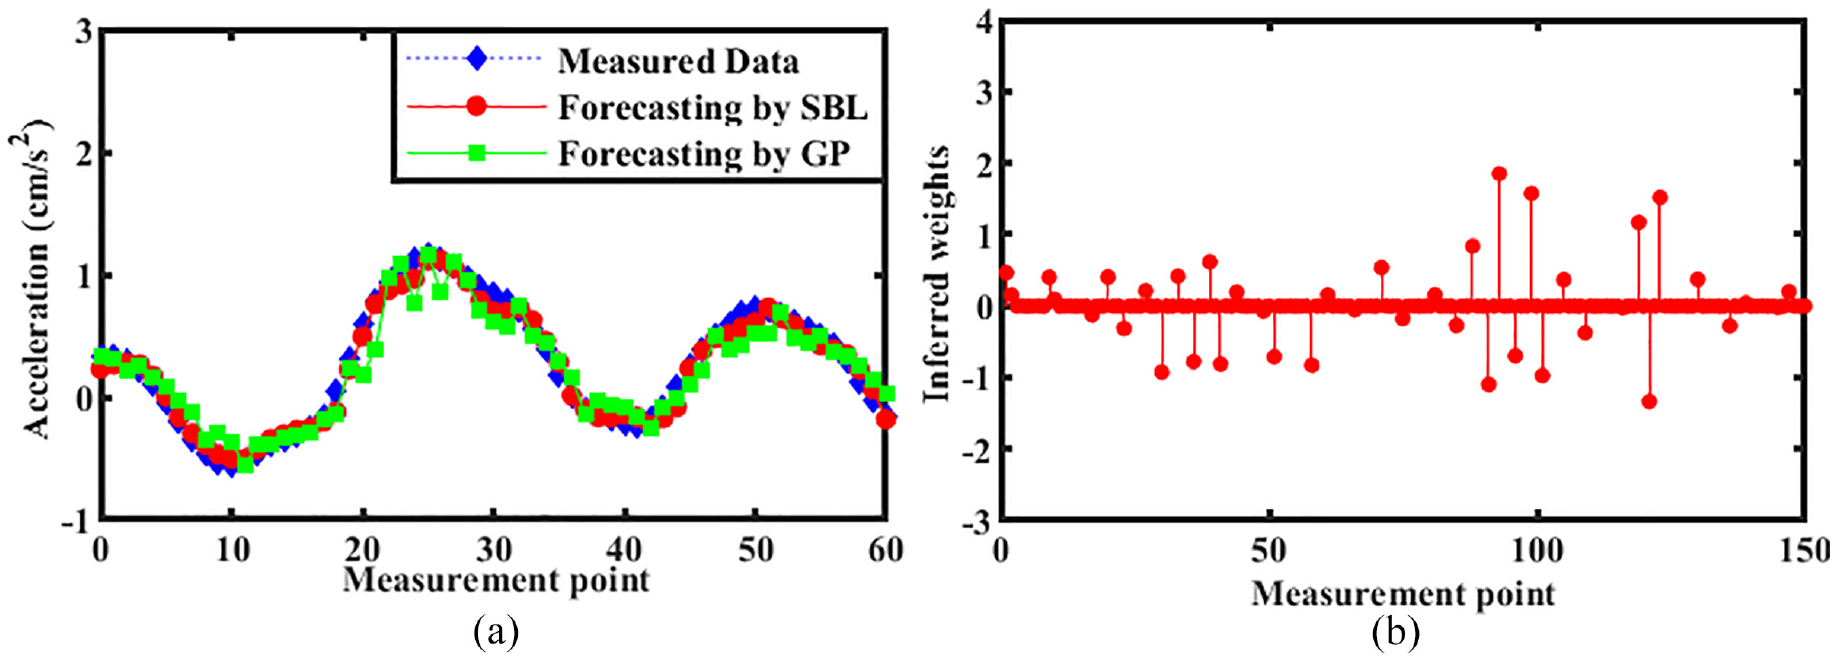
For each of these four types of vibration data, 300 data points are intercepted in this section when evaluating the iSBL forecasting performance. Among 300 data, the first 200 data are used as the training set to forecast the rest of the vibration data by means of the one-step-ahead forecasting method. Specifically, stationary and non-stationary vibration data in the health state from the No. 1 acceleration sensor on January 17, 2008 were used and investigated to demonstrate the iSBL forecasting performance. The comparison with GP results is conducted, as shown in Figures 11 and 12. For the GP model, the Radial Basis Function Kernel is selected as the Kernel function. The likelihood function is Gaussian likelihood. The prior is GP, and the corresponding hyperparameters are its mean and covariance function. Similarly, stationary and non-stationary SHM data in the damage state on July 31, 2008 are investigated and the results are show in Figures 13 and 14, respectively. Root mean square error (RMSE) is used as a quantitative index for forecasting performance, as shown in Figure 15. The smaller the RMSE, the higher the forecasting accuracy. In addition, the inferred weights
(a) Forecasting results and (b) inferred weights for stationary data (health state).
(a) Forecasting results and (b) inferred weights for non-stationary data (health state).
(a) Forecasting results and (b) inferred weights for stationary data (damage state).
(a) Forecasting results and (b) inferred weights for non-stationary data (damage state).
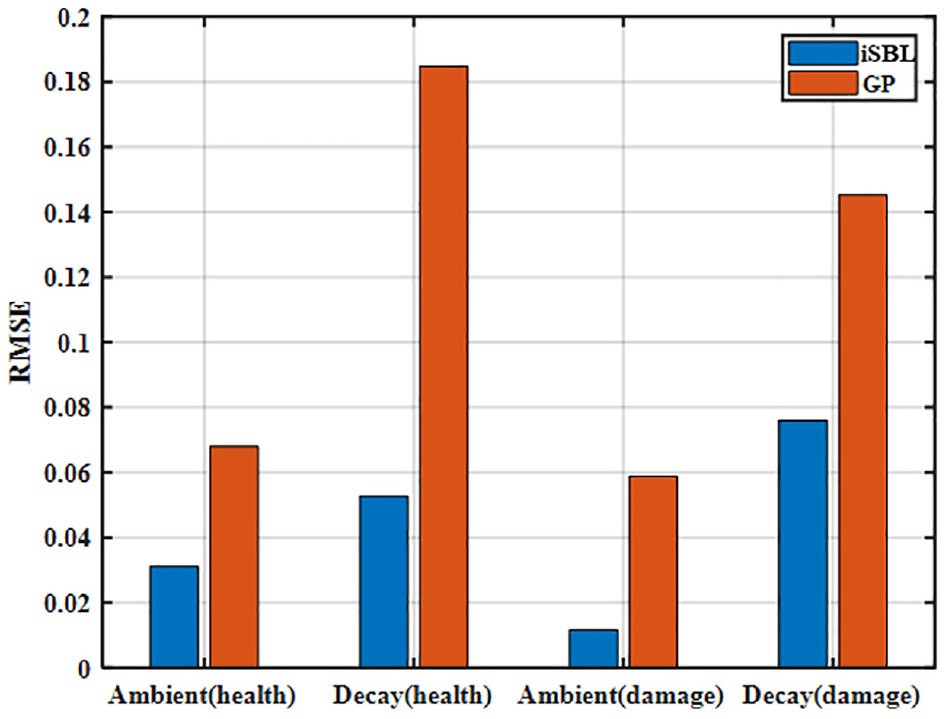
RMSE of the iSBL and GP forecasting results.
Comparative analysis of the iSBL forecasting performance
According to Figures 11(a), 12(a), 13(a), and 14(a), the iSBL forecasting performance is more consistent with the measured data than GP under the four vibration data types, especially for the non-stationary decay vibration data. Figure 15 shows the RMSE of the iSBL and GP forecasting methods under four vibration data types. According to the RMSE values, it can also be found that the iSBL is better than GP in terms of forecasting performance.
The strong generalization of the iSBL forecasting models can also be verified according to the sparsity of the weight vectors: the numbers of non-zero inferred weights are 43, 52, 44, and 51 for the aforementioned four forecasting models, and the sparsity rates are top to 78.5%, 74%, 78%, and 74.5%, respectively. Actually, the sparsity is related to SHM data features. SHM data has the sparse characteristics in a certain dimension space. That is, they are sparse under some certain Kernel functions. For instance, the structural acceleration data used in this study have few non-zero terms in the time domain. However, after the conversion to the frequency domain, it will be found that most of the data in the frequency domain is zero or small values close to zero except in the areas near the structure’s resonance frequencies. Thus, these response data have sparse characteristics in the frequency domain. According to calculation results, the sparsity rates in stationary data (78.5% and 78%) are slightly higher compared to those in non-stationary data (74% and 74.5%). The reason may be that these two types of data have significantly different data characteristics. Compared with stationary data, non-stationary decay vibration signals are more complex and thus require more basis points of the Kernel functions to fully describe the data feature, which will generate a lower sparse rate. Not only the robustness and accuracy of the prediction of unknown vibration data are improved due to the high sparsity rate but also the running time of the algorithm is shortened. To sum up, the iSBL forecasting method has high accuracy for predicting the four types of data mentioned in this article, and the forecasting data are generally consistent with the measured vibration data. This result reflects the superiority of the iSBL in SHM data forecasting due to its strong generalization, and the method can accurately forecast the structural vibration data under different vibration patterns.
Frequency domain analysis of forecasting data
The high forecasting accuracy has been shown in the time domain for the iSBL framework, but the accuracy of the frequency domain information of the forecasting data needs to be further verified. Therefore, frequency domain analysis based on the predicted data was conducted in this section to further verify the high accuracy of the algorithm characteristic in the frequency domain. In the vibration-based damage identification methods, the modal parameters of the structure, especially the modal frequency of the structure, are generally required. In this section, the modal frequency identification of the structure will be carried out based on the forecasting data calculated through the iSBL method.
In this section, Power Spectrum Density (PSD) and Natural Excitation Technique (NExT) methods are used to identify modal frequencies from non-stationary decay vibration data and ambient vibration data, respectively. The NExT technique can be implemented in MATLAB. Given that the cross-correlation function and the cross-spectral density function form a Fourier transform pair, the cross-spectral density is computed directly from the data, and then the cross-correlation function can be evaluated through inverse Fourier transform. The vibration data required for PSD and NExT modal frequency identification are recorded by the No. 1 accelerometer from 2:00 a.m. to 3:00 a.m. on January 17, 2008. Taking PSD for instance, Figure 16 shows the forecasting value of the non-stationary decay vibration data. Figure 17 shows the modal frequency identification results of PSD using forecasting vibration data for non-stationary decay. Similarly, Figure 18 shows the modal frequency identification results of NExT using forecasting vibration data under the ambient excitation.
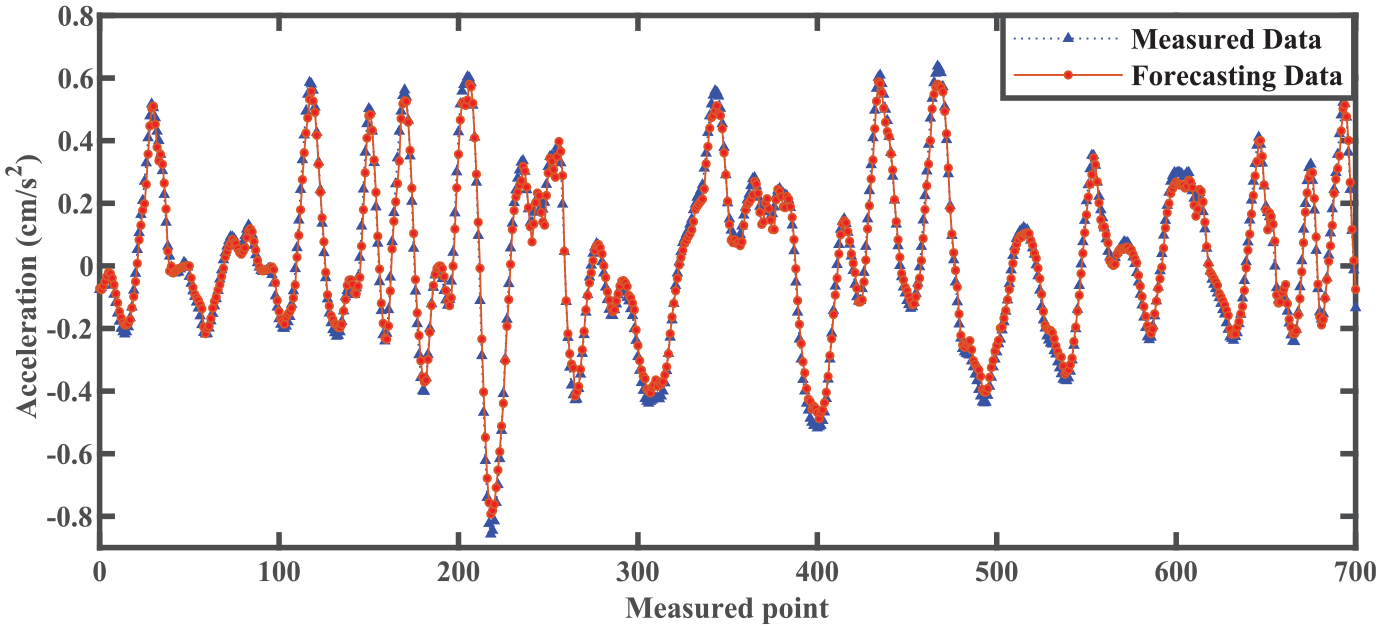
Forecasting of non-stationary decay vibration data by iSBL.
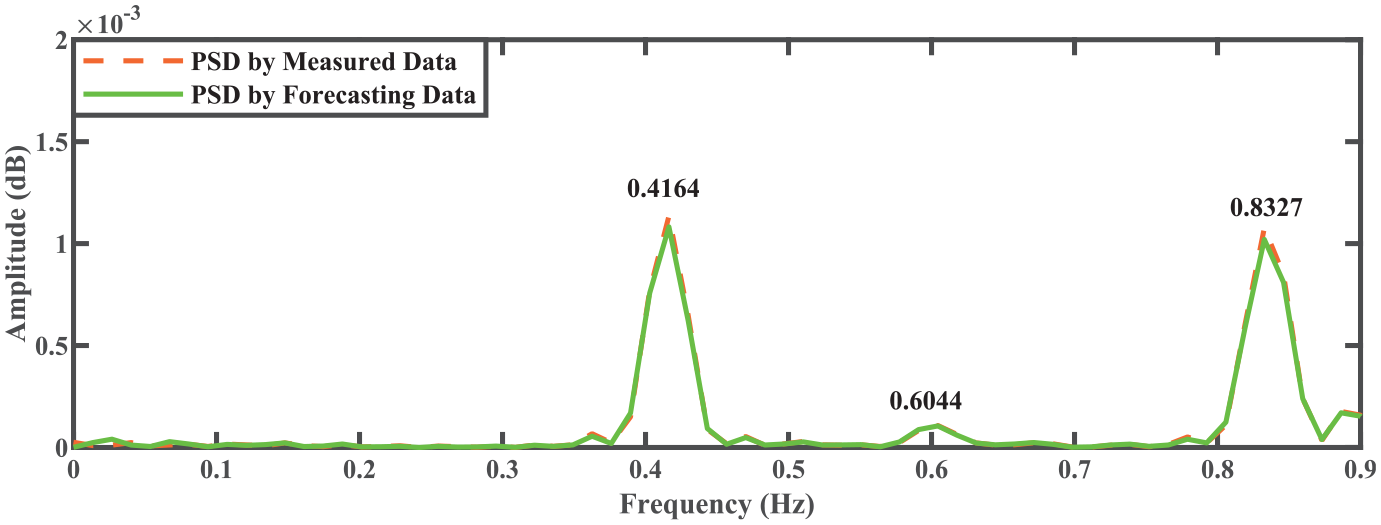
PSD result based on forecasting decay data.
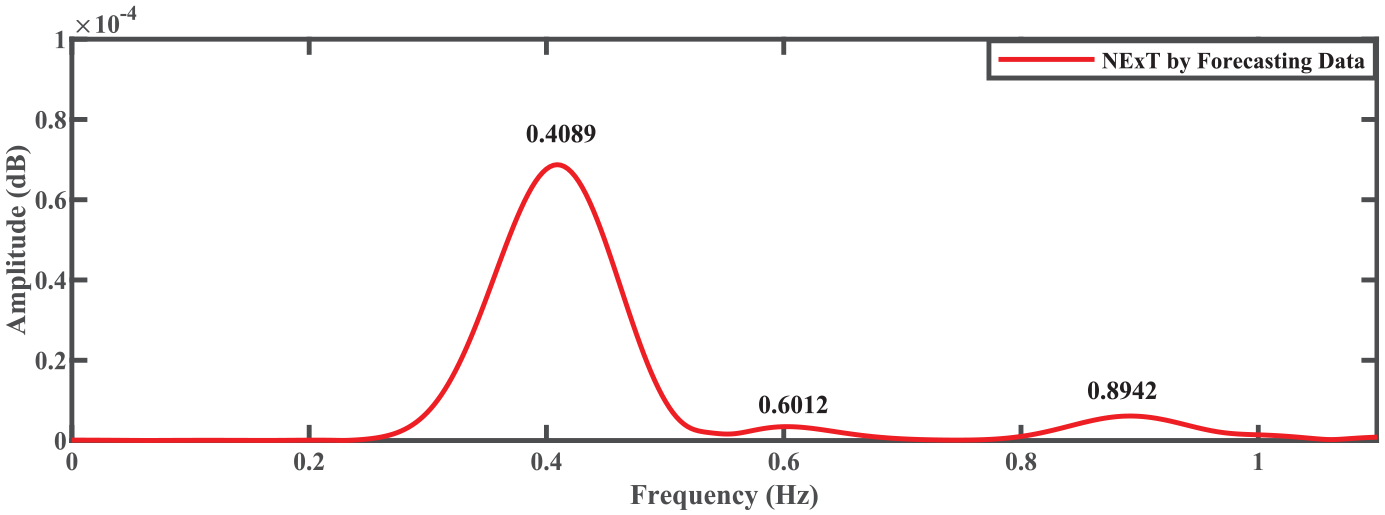
NExT result based on forecasting ambient data.
Compared with the modal frequency identification results of Benchmark Structure—Tianjin Yonghe Bridge (first-order resonance frequency: 0.415 Hz, second-order resonance frequency: 0.5859 Hz, third-order resonance frequency: 0.9033 Hz), the modal frequency identification results in Figures 17 and 18 show that the maximum error reaches to 7% for the third-order identification results of PSD, and the remaining errors are all less than 5%. Therefore, it can be concluded that the accuracy of the iSBL forecasting vibration data is sufficient for modal frequency identification. In time domain, according to Figure 15, the mean RMSEs for both health and damage states are smaller than 0.06. In frequency domain, the modal frequency information can be obtained based on the forecasting vibration data, and the modal frequency identification result is consistent with the benchmark result. In summary, the iSBL method can return accurate forecasting results in both the time and frequency domains. Thus, the proposed iSBL can be used for damage identification. Firstly, the structural response can be predicted with high precision according to the existing monitoring data through the proposed iSBL framework, and the resonance frequency can be derived based on the forecasting results. Further, it can be inferred whether or not damage has occurred through the change of the resonance frequency. Thus, the iSBL forecasting method has the potential to identify the structural damage on the basis of the structural dynamic characteristic change.
Conclusions
The first attempt at predicting the SHM data using the proposed iSBL method with strong generalization capability has been presented in this study. In order to validate the performance of the proposed method, a complete solution to an SHM vibration data modeling for a real-world large-scale cable-stayed bridge is provided. The effectiveness of the iSBL algorithm is demonstrated by highlighting the smaller prediction error in time domain and better frequency-domain information. Some interesting conclusions specific to the problem solved above are as follows:
The proposed iSBL framework incorporates the out-of-sample algorithm to expand the application scope for the predictive analysis of SHM monitoring data in this study. It is observed that the data of two different vibration patterns, that is, stationary ambient vibration data and non-stationary decay vibration data, are satisfactorily predicted. Compared with GP forecasting, the accuracy of the proposed iSBL method is higher in both regression and forecasting aspects.
The iSBL model proposed in this study turned out to be sparse in the weight vector evaluation results, indicating that the proposed Bayesian approach tends to improve model generalization ability for the SHM vibration datasets, which is especially important for the improvement of data forecasting accuracy. An important problem within the SHM field is to make an accurate and robust prediction of future data using historical SHM data. In this context, the proposed iSBL method can be of high value because of its modal sparsity.
In time domain, the iSBL is suitable for the forecasting of both ambient vibration data and non-stationary decay vibration data, compared with GP method. In frequency domain, the proposed method correctly identified structural modal frequencies and provided better forecasted data for the two types of vibration patterns, which indicates the iSBL forecasting results contain accurate and high-fidelity structural frequency information.
As for future works, the authors intend to automate the proposed methodology by including an adaptive Kernel function to preselect the parameters of the iSBL model based on the properties of SHM data.
Footnotes
Acknowledgements
The authors wish to express their gratitude to staff and students in the Structural Engineering Laboratory for their extensive assistance.
Declaration of conflicting interests
The author(s) declared no potential conflicts of interest with respect to the research, authorship, and/or publication of this article.
Funding
The author(s) disclosed receipt of the following financial support for the research, authorship, and/or publication of this article: The authors wish to acknowledge the supports from the National Key R&D Program of China (Grant Nos. 2019YFB2102702 and 2019YFE0118500), China Postdoctoral Science Foundation (2019M652006), National Natural Science Foundation of China (Grant Nos. 52078478, 51708545, and 52008258), Shenzhen Science and Technology Program (Grant No. KQTD20180412181337494), and Shenzhen Key Laboratory of Structure Safety and Health Monitoring of Marine Infrastructures (In preparation, Grant No. ZDSYS2020 1020162400001).