
Abstract
Localization of fatigue cracks imposes immense significance to ensure the health of the engineering structures and prevent further catastrophic accidents. The nonlinear ultrasonic waves, especially the nonlinear Lamb waves, have been increasingly studied and employed for identifying micro-damages that are usually invisible to traditional linear ultrasonic waves. However, it remains a challenge to locate the fatigue cracks using nonlinear Lamb waves owing to the enormous difficulties in decoding location information from acoustic nonlinearity. Motivated by this, this work presents a data-driven method for precise location of fatigue crack using nonlinear Lamb waves. A 1D-Attention-convolutional neural network is developed to correlate the fatigue crack location with the wavelet coefficients at the second harmonic frequency of Lamb wave signals. The introduction of the Attention layer enables the models to pay more attention to the desired nonlinear features which dominates locating the fatigue crack. In particular, a convenient dataset creation scheme guided by the relative value label is proposed to generate sufficient data commonly required for deep learning approach. In addition, a lightweight single-excite-multiple-receive signal acquisition method is adopted instead of full-matrix capture method used in the traditional research, which highly improves detection efficiency. Numerical simulation and experimental validation manifest that the trained network can be used to establish the complex mapping between the nonlinear ultrasonic signals and the fatigue crack location features, so as to locate barely visible fatigue cracks. Our work provides a promising and practical way to facilitate nonlinear Lamb waves to accurately locate fatigue cracks in large-scale plate-like structures.
Keywords
Introduction
Structural health monitoring (SHM) technology is critical to warrant the structural integrity of mechanical components and the safe operation of aging engineering structures. Ultrasonic waves, particularly Lamb waves, have attracted intensive attention, which can meet the requirement for performing inspection and evaluation of various plate-like structures in an active manner. The Lamb wave-based SHM technology relies on the interaction between elastic waves and damage in the large-scale plate or shell-like-engineering structures such as pressure vessels, aircraft skins, and so forth for damage localization by analyzing scattered, transmitted, or diffracted waves.1–3
Traditional damage localization methods based on Lamb waves generally need to establish the damage index (DI) representing the changes of the state of the structure. 4 In general, the DI should be designed to be sensitive to damage signatures, and the accuracy of damage localization depends on the validity of the DI. However, the underlying but non-negligible influences including temperature variations, changing boundary conditions, etc. can be sufficient to mask the damage-related features in signals and further weaken decision-making. 5
To solve the above problems, researchers take advantage of the deep-learning-based approach with its ability of feature mining and logical judgment in the high-dimensional space to analyze the Lamb wave signals.6–10 Generally speaking, the deep-learning-based approach deals with two kinds of problems: classification and regression. The key issue is how to convert the damage localization problem into the abovementioned problems. If the damage localization problem is transformed into a classification problem, the detection region is generally divided into multiple grids, and a neural network is utilized to judge whether each grid has damage. Su et al. 11 took the Lamb wave spectrum and the damage degree as the input and output of convolutional neural network (CNN), respectively, and established a damage identification model based on dense grids. Liu and Zhang 12 transformed the problem of crack damage localization into an image classification problem with the CNN model. Sbarufatti et al. 13 took the DI of different detection paths as the input of the network to make regression predictions of the crack midpoint coordinate value and crack length. It is found that the damage localization accuracy is related to the subdivision degree of the grid. However, with the reduction of the grid area, the demand for data volume increases exponentially.
Different from the classification problem, the regression damage localization problem takes the specific coordinate value of the damage as the output of the neural network. Wu et al. 8 converted the Lamb wave signals into two-dimensional time-frequency images based on continuous wavelet transform (CWT), then introduced the CNN model to locate the crack in the composites. Zhang et al. 14 proposed a kind of time-varying DI feature that preserves temporal information, and one-dimensional (1D)-CNN was utilized to find the mapping between the time-varying DI and the damage position.
In addition to the reasonable transformation of the damage localization problem, sufficient data acquisition is another core issue in the deep-learning-based approach. The cost of data acquisition is high and even prohibitive. The simplest way of data acquisition in the experiment is to introduce the mass block. The mass block is bonded onto the surface of the plate-like structure to change the local acoustic impendence in a similar way to that of damage to cause the reflection of Lamb waves.11,14,15 By moving the mass block, the experimental data of the damage at different positions can be obtained. Another typical way is to introduce the finite element (FE) simulation method. It is relatively simple to establish the FE models based on experimental conditions. A large amount of simulation data can be achieved as long as the damage position in different FE models is changed constantly.12,13,16 Compared with the experimental method, the data obtained by the FE simulation method are ideal, but it is low-cost and available for analysis. In the conventional method, a large number of FE models should be established, in which the absolute position of the damage changes as required. Nevertheless, with the increment of the detection area and the improvement of localization accuracy, the number of FE models that need to be established presents exponential growth, and the time cost of calculation increases accordingly. For example, Sbarufatti et al. 13 established 6192 models, a global simulation time of 10 days on two parallel machines was required for calculation. Similarly, Ijjeh et al. mentioned that the computation of the dataset (consisting of 475 cases) took about 3 months. 16 Therefore, the traditional method for FE model establishment is feasible but somewhat inefficient.
Traditional linear features of Lamb waves are only suitable for the detection and location of macroscopic damage, but not for the small-scale damage. Recent studies have illustrated that the material performance degradation is closely related to the nonlinear features of the ultrasonic waves, thus providing a feasible technology for small-scale damage detection. 17 Nowadays, the research specimens of the existing nonlinear ultrasonic theory are blocky, stripy, and rod-like structures. The research contents mostly focus on the identification or qualitative characterization (most approaches are capable only of inferring the existence of damage) of small-scale damages such as fatigue, corrosion, and thermal damage.18–21 The researches on local micro-damage localization using nonlinear guided waves have attracted extensive attention. Lu et al. 22 determined the time-of-flight (ToF) of the crack-scattered waves by analyzing the correlation of the wavelet energy spectrum, and then the ellipse localization algorithm is applied for crack localization. In order to solve the problem that ToF is unwieldy to determine, Wang et al. 23 replaced ToF with the relative distance value of the detection point and the actuator–sensor pair. Zhou et al. 24 combined nonlinear features with probabilistic imaging to localize dual fatigue cracks in plate-like structures. Similarly, Su et al. 25 proposed a hybrid approach for characterizing fatigue damage, in which two types of damage indices based on the linear and the nonlinear features of Lamb waves are constructed. On the basis of 25, Hong et al. 26 fused linear features with nonlinear features to realize the localization and evaluation of damages with different degrees from crack initiation to macroscopic damage formation.
Prevailing researches on fatigue crack localization mostly focus on extracting and calibrating the second harmonics-related nonlinear features. Nevertheless, the inherent features of Lamb waves, such as weak harmonic feature, the dispersive and the multimode natures, greatly increase the difficulty of signal analysis. The deep-learning-based approaches have performed well in the research of damage localization using linear features of Lamb waves. To this end, this study attempts to introduce the deep-learning-based approach to analyze the nonlinear features of Lamb waves, which may emerge as a feasible method for closed fatigue crack localization in large-scale plate-like structures.
In this work, micro-damage in the large-scale plate-like structure represented by the barely invisible closed fatigue crack is taken as the research object, and a nonlinearity-aware deep learning framework is proposed to establish the mapping relationship between the nonlinear ultrasonic guided waves and the micro-damage location. In this deep learning framework, a lightweight deployment scheme is proposed, including the lightweight dataset creation guided by the concept of relative value and the signal acquisition with the way of single-excite-multiple-receive. This research paves a promising and practical way to promote nonlinear ultrasonic techniques for micro-damage localization.
Methodology
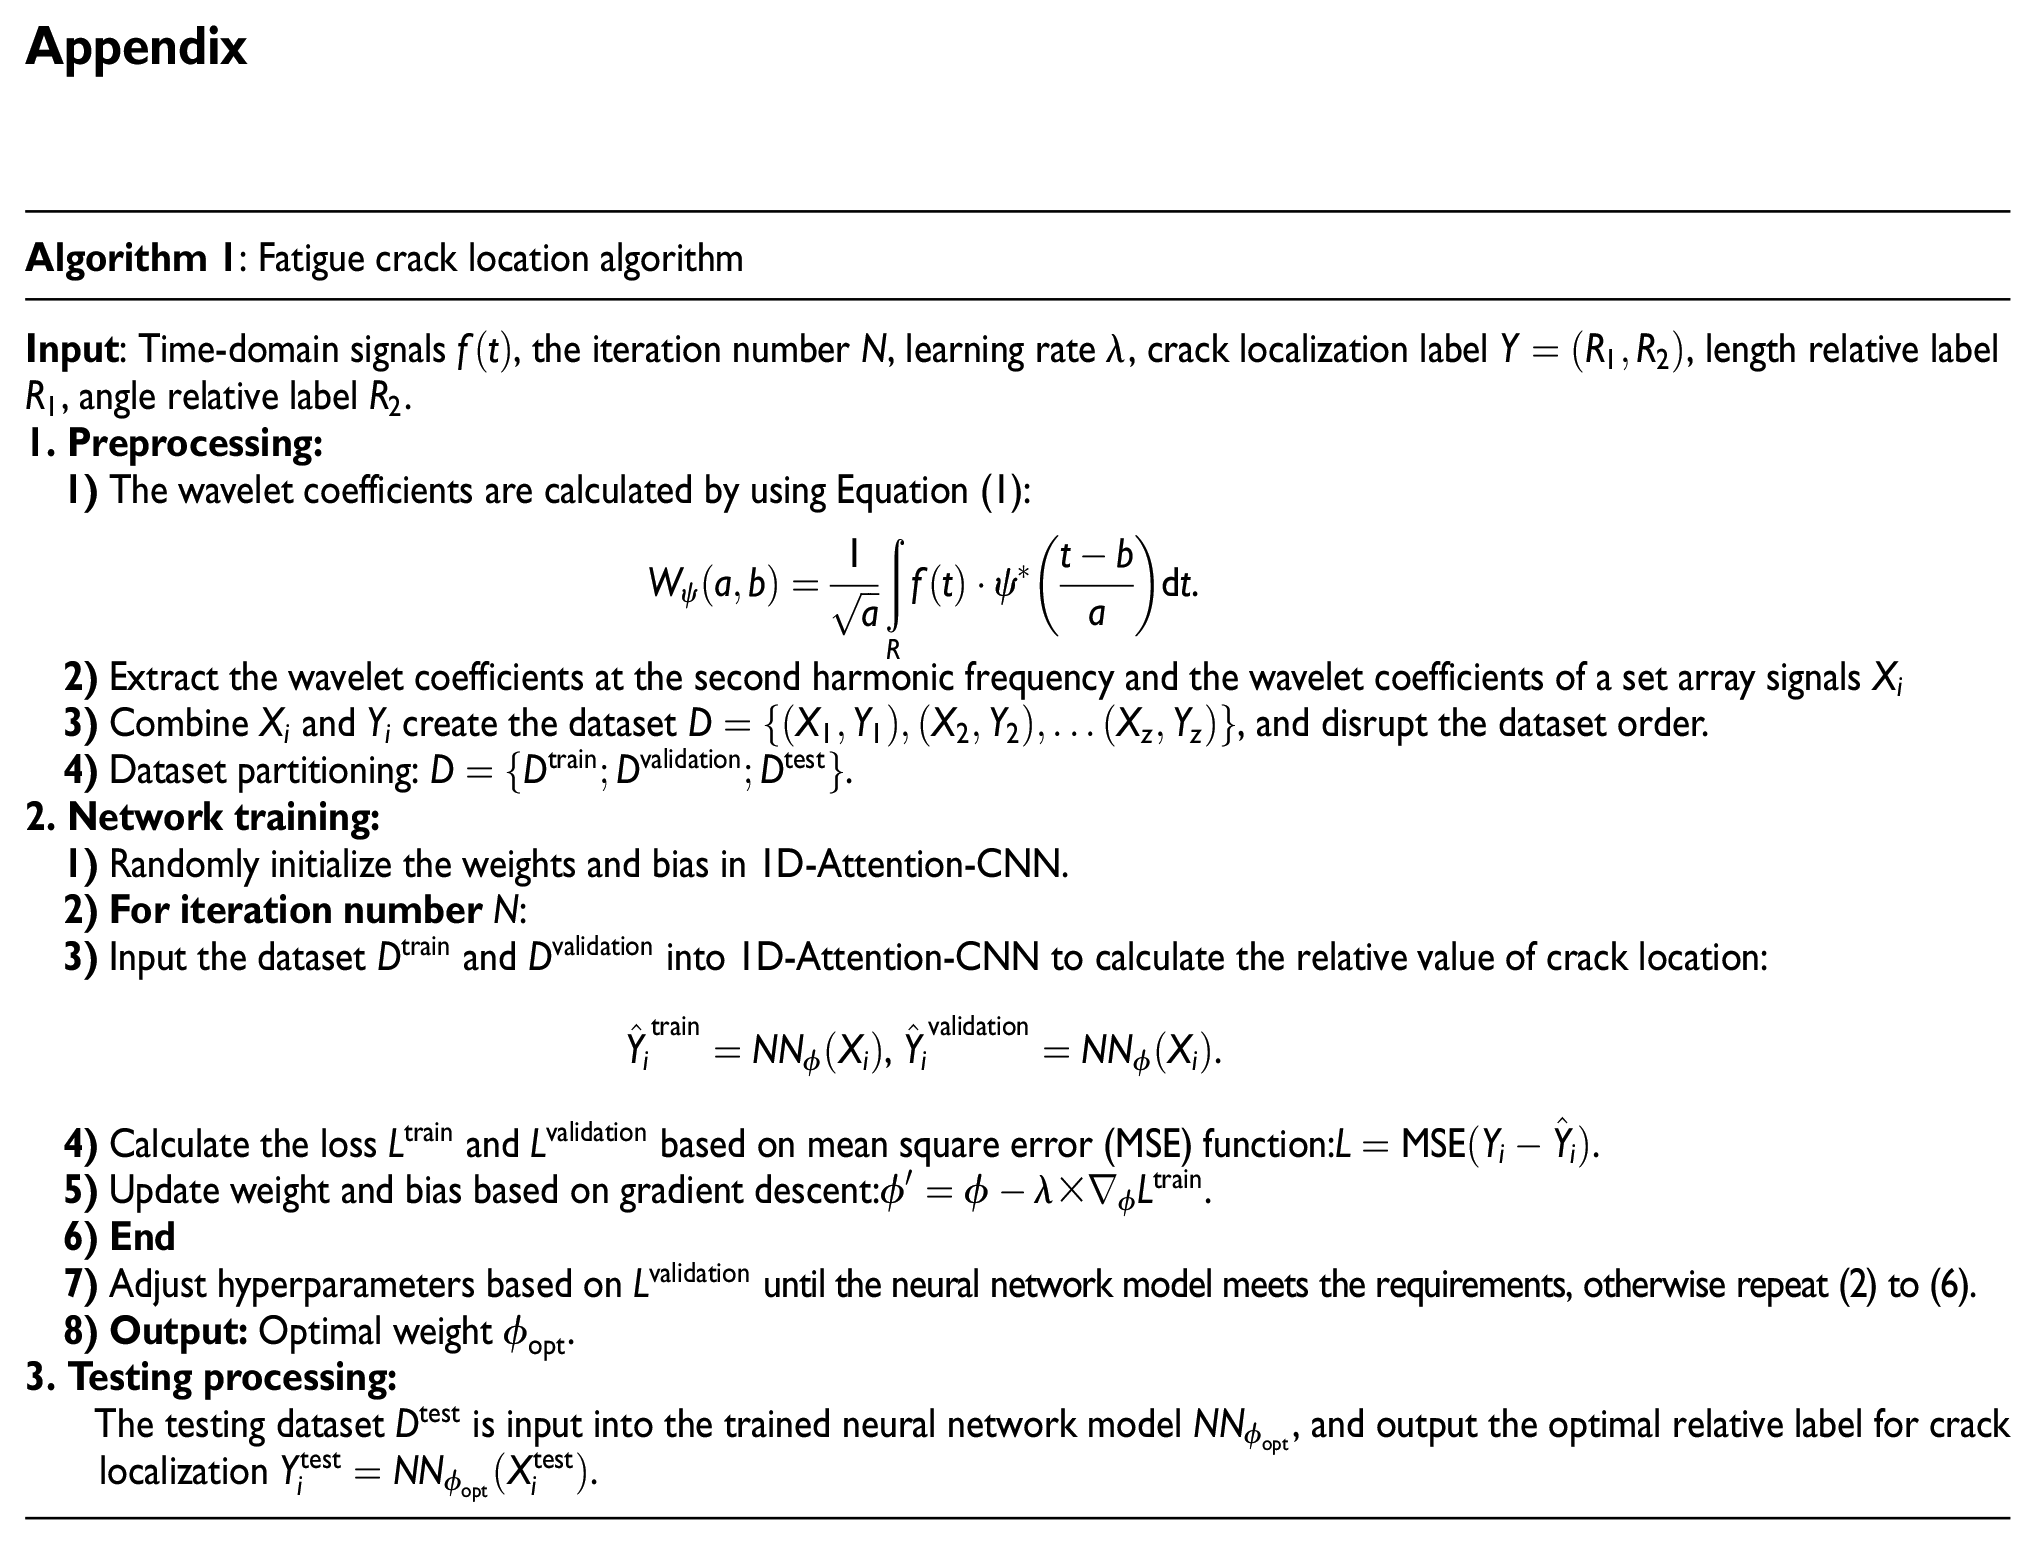
The proposed method includes four steps: (1) data collection; (2) nonlinear feature extraction and dataset preparation; (3) 1D-Attention-CNN model construction and training; and (4) model validation. The schematic representation of the proposed method is recapitulated in Figure 1, and the pseudo-code is provided in the Appendix.
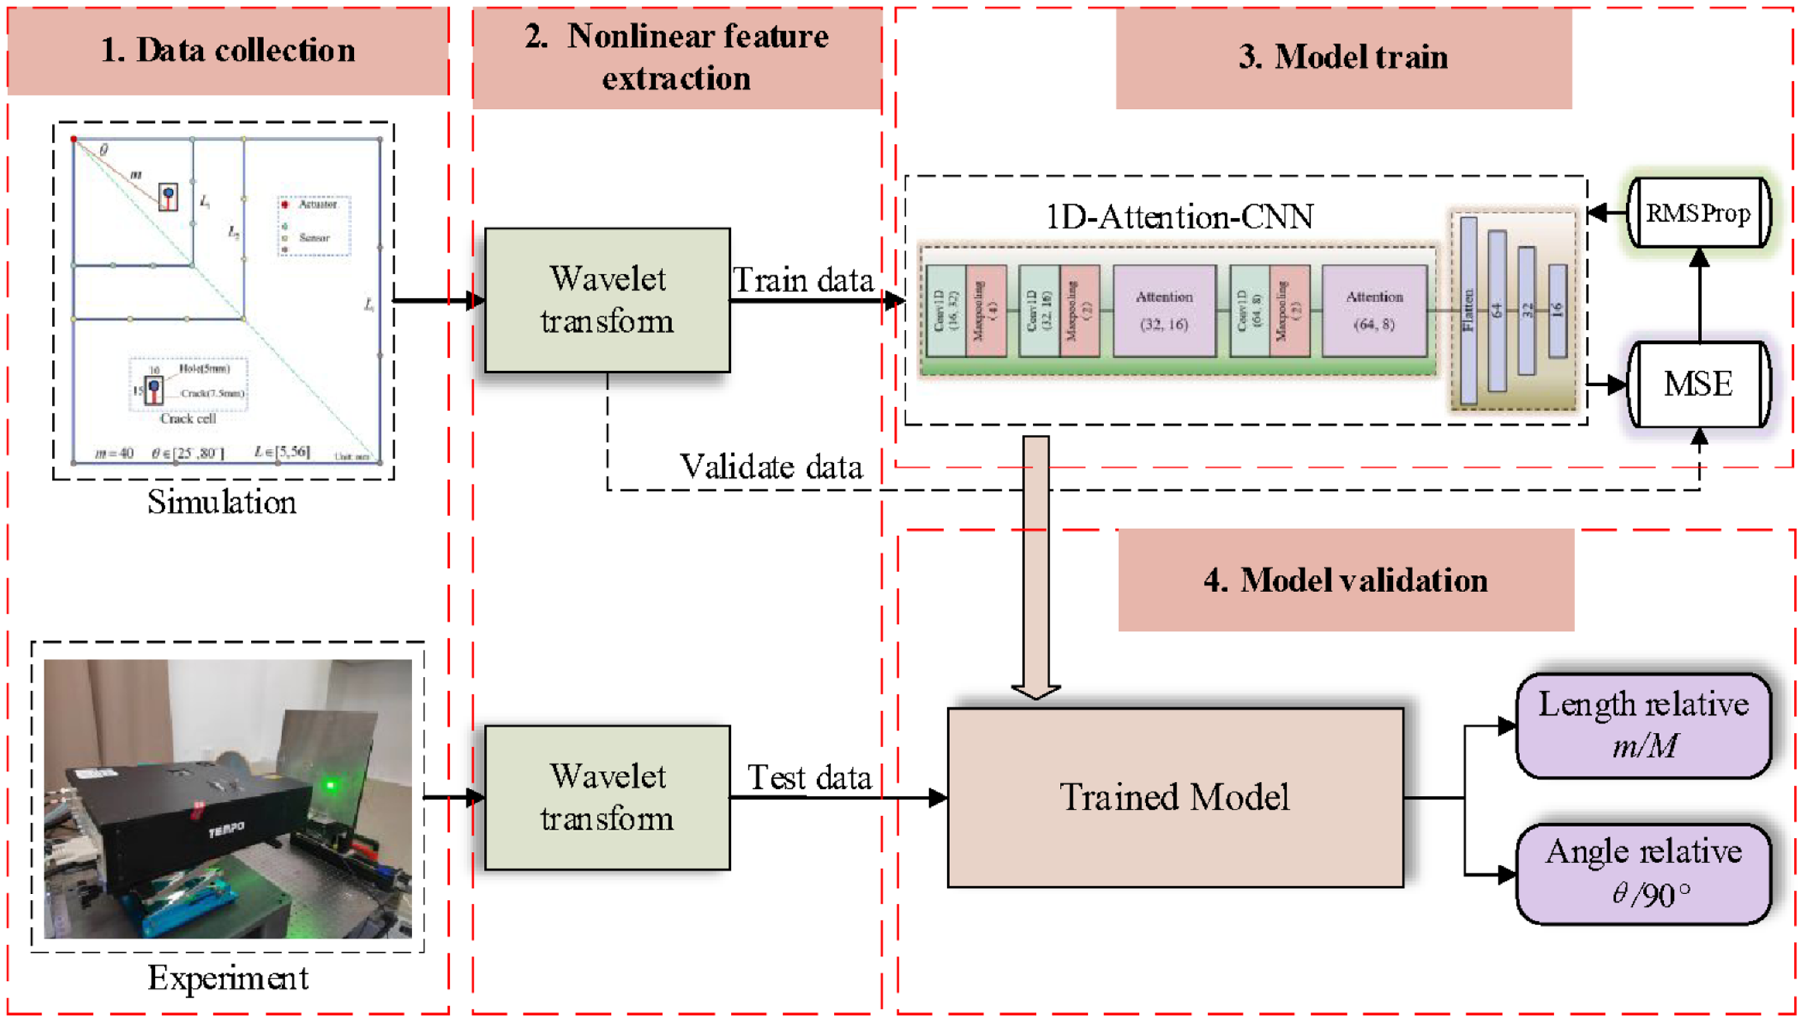
Complete fatigue crack localization procedures for the proposed framework.
Data source
FE simulation
Machining fatigue crack in the plate-like structures is difficult and time-consuming, so it is impractical to meet the requirements of a large amount of data for neural network model training through experiments. FE simulation method can characterize the physical features of the interaction between cracks and Lamb waves effectively, which avoids the complexity of theoretical analysis and the tediousness of experimental measurement. Therefore, the FE simulation method using ABAQUS is adopted to obtain sufficient data in this work. The considered aluminum plate (density: 2.75 × 10³ kg/m3, Young’s modulus:
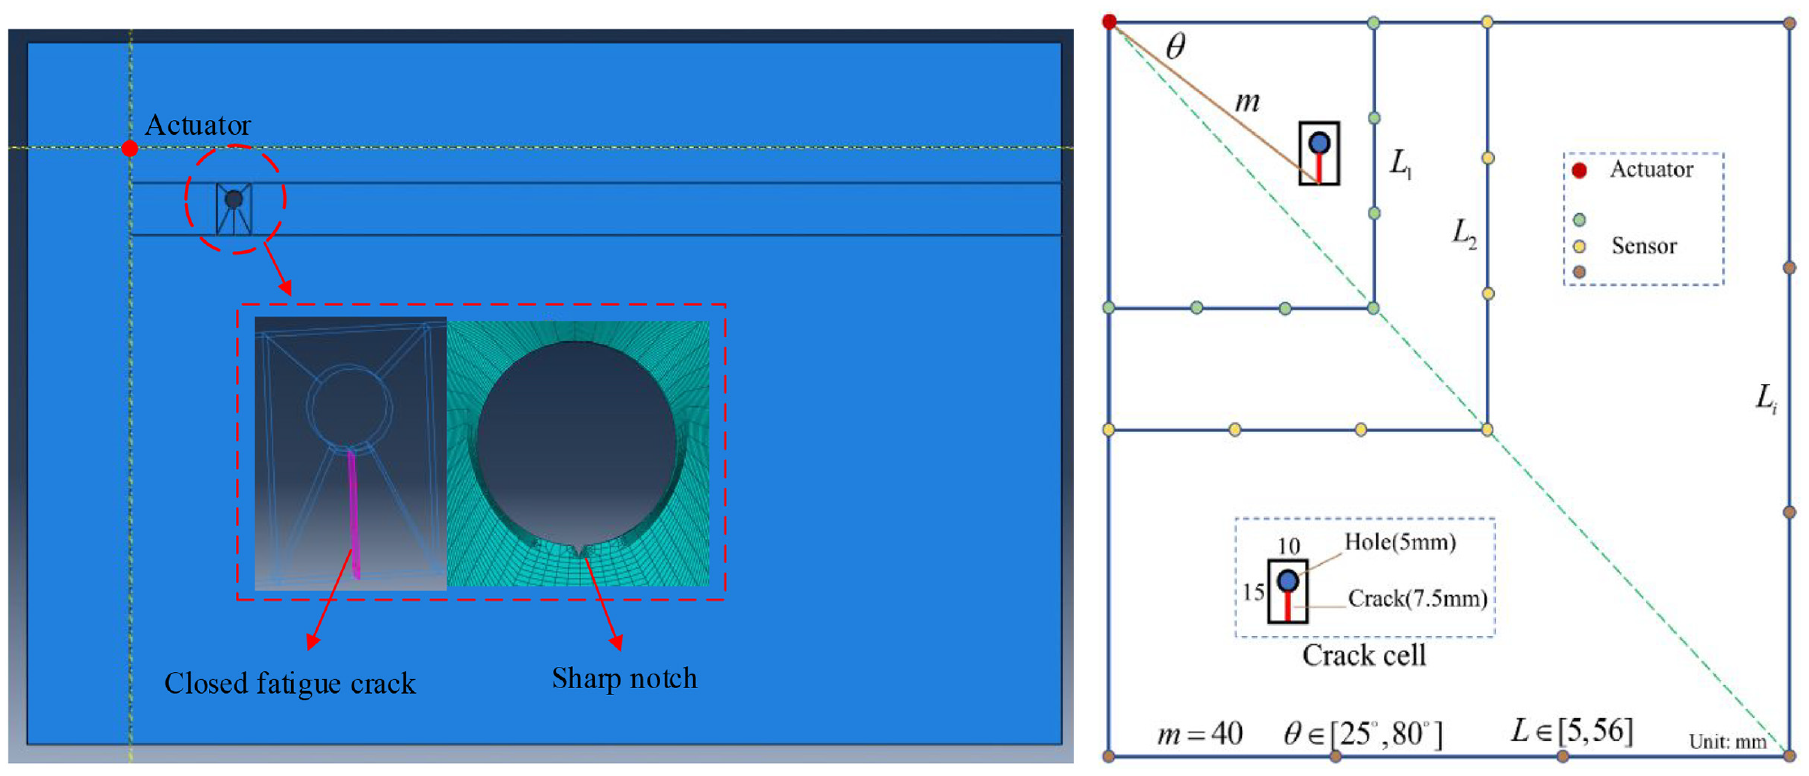
FE simulation and schematic diagram of adjacent FE simulation model.
Considering factors including model calculation accuracy and efficiency, the FE model uses eight-node brick elements (C3D8R), each sized at 1 mm in the in-plane dimensions, to mesh the aluminum plate. A time step of 2 ns was used to ensure the accuracy of the second harmonic generation. A 10-cycle Hanning-windowed sinusoidal tone burst with a central frequency of 280 kHz and amplitude of 1 × 10⁻⁶ mm is excited by applying a pair of symmetric displacements on two selected FE nodes, which are symmetrically positioned on the upper and lower surfaces of the plate. The selection of center frequency of excitation signal is an important issue in nonlinear ultrasonic research. The center frequency of the excitation signal is determined by the results of the frequency-tuning experiment, and the experimental method is referred to the research of Victor Giurgiutiu.
29
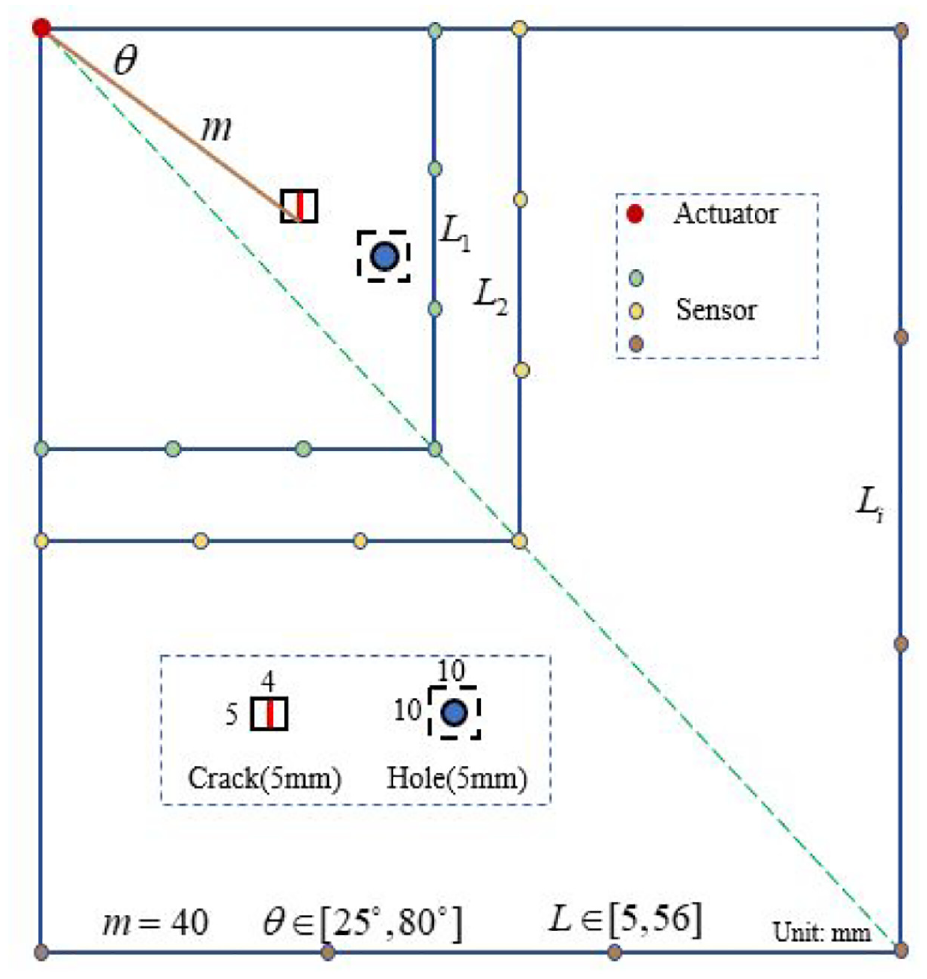
In addition, the inherent multimodal and dispersion characteristic of guided waves require the selection of excitation signals with low center frequency, and the frequency response curve of the lead zirconate titanate (PZT) wafer used in the experiment has a peak near 280 kHz. Only one actuator with a fixed position is adopted as the signal excitation source instead of the traditional sequential excitation method used in the full-matrix capture. The full-matrix capture method requires all sensors to be used for signal excitation and signal reception in turn. For example, when the sensor array consisting of N transducers is used for the experiment, the traditional signal acquisition method needs N times of signal excitation and N × (N − 1) times of signal acquisition. Compared with it, the lightweight signal acquisition proposed in this work only needs one time of signal excitation and (N − 1) times of signal acquisition, which highly improves detection efficiency. The detection efficiency is improved by N times with the method proposed in this work. For the convenience of the subsequent dataset making, the polar coordinate system, instead of the cartesian coordinate system, is introduced to establish the FE model. The actuator position is set as the coordinate origin, and the polar coordinate of the crack cell is assumed as
Experimental setup
An aluminum plate (6061-T6, 350 × 350 × 2 mm3) is prepared as the testing specimen as shown in Figure 3(a). To introduce the fatigue crack, a rivet hole with a diameter of 5 mm and a sharp notch at the edge of the hole are machined. After that, the specimen undergoes a high-cycle fatigue test using Instron® 8803 Floor Model Fatigue Testing Systems, subject to a sinusoidal tensile load from 2 to 20 kN at 2 Hz. With about 140,000 cycles, a barely visible fatigue crack is produced, as shown in Figure 3(b), measuring about 4 mm in length originating from the notch tip.
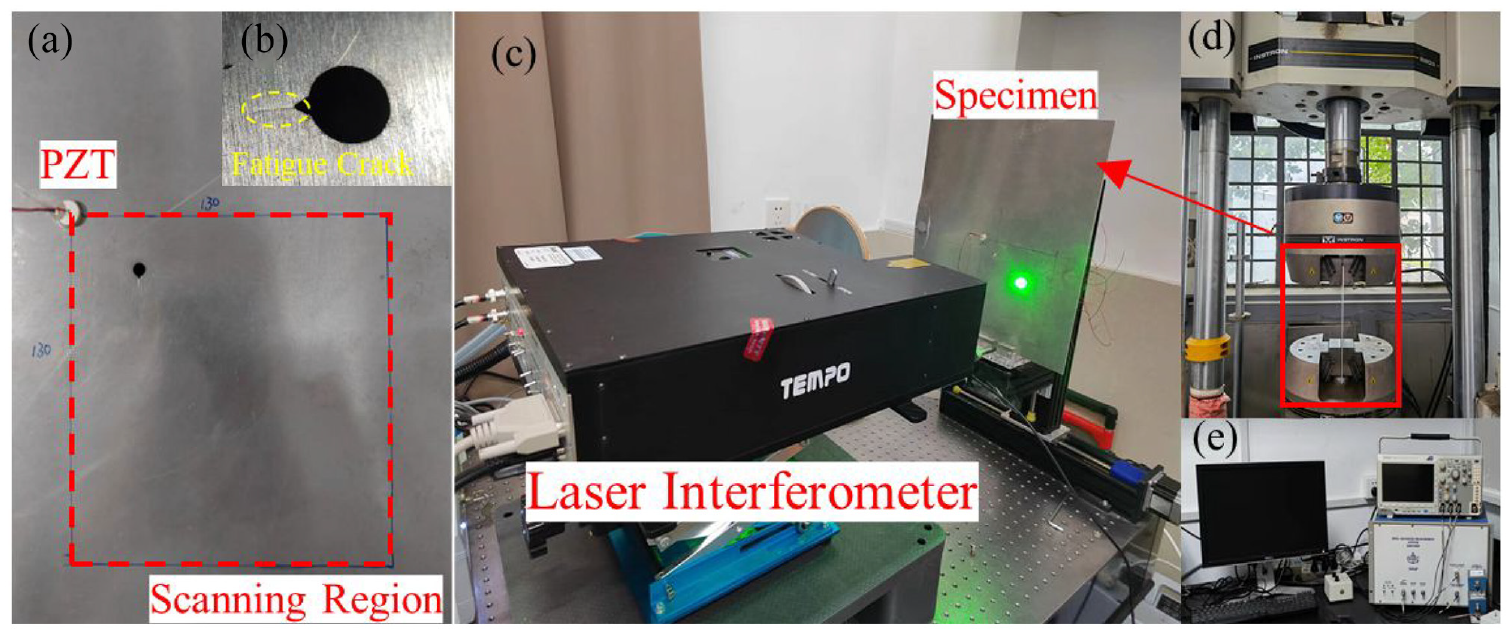
(a) An aluminum plate specimen with one lead zirconate titanate (PZT) bonded for experimental validation; (b) a barely visible fatigue crack of 4 mm produced near the rivet hole; (c) laser interferometer scanning system; (d) the specimen undergoing fatigue testing; and (e) RITEC RAM-5000 SNAP high power ultrasonic measurement system.
In terms of the signal generation system, only one PZT piezoelectric ceramics wafer, 10 mm in diameter and 3 mm in thickness each, is bonded onto the aluminum plate. And the PZT wafer only acts as the actuator, a 10-cycle Hanning-windowed sinusoidal tone burst with the central frequency of 280 kHz is fed into the PZT wafer as the probing signal with the RITEC® RAM-5000 SNAP high power ultrasonic measurement system. The PZT wafer is taken as the coordinate origin, the polar coordinate value of the fatigue crack tip is about (40, 40°). Since the fatigue crack is barely invisible, there is a certain deviation in the crack tip position.
As far as the signal acquisition system, TEMPO-2D Laser Interferometer (Bossa Nova Technologies, USA) is utilized to scan the specimen surface and obtain the out-of-plane displacement signals. Similar to the FE model, the PZT wafer is set as the polar coordinate origin, and the scan region is 130 × 130 mm2. The response signals are acquired at a sampling rate of 5 MHz with 256-time averaging.
Data preprocessing
Nonlinear feature extraction
The time-frequency analysis of the response Lamb wave signals is performed by the CWT method, and the wavelet coefficients at the second harmonic frequency are calculated for neural network model training. The CWT of a signal
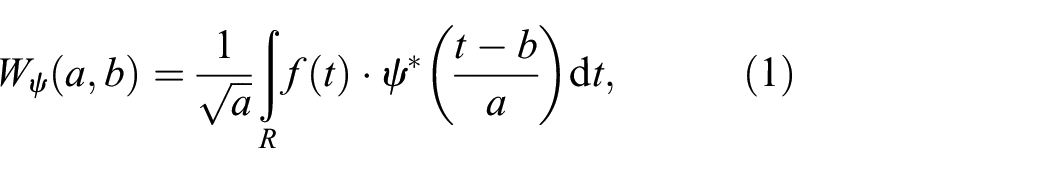
where
As a matter of common knowledge, the waveform of the wavelet basis function should be similar to the analyzed signals. The Morlet wavelet is analogous to the excitation signal and contains more oscillations than other wavelets. It is employed in this research for nonlinear feature extraction.
Dataset creation
The guarantee of the excellent generalization ability of a neural network model is the richness and diversity of the dataset. Different from the traditional method that builds the FE models in the cartesian coordinate system, this work establishes the FE model in the polar coordinate system (the detailed introduction of the FE model is described in Section “FE simulation”).
On this basis, the introduction of the concept of the relative value label brings a new approach for dataset making. Instead of the application of the absolute value label in prevailing research, a relative value label, which consists of relative angle value label and relative length value label, is proposed in this study. The relative value label refers to the relative location of the damage in the sensor array. Assuming that the actuator is the origin of the coordinates and the polar coordinate of the crack cell is
Reduce the number of FE models greatly.
Improve the versatility of the FE models and can be used for the detection of the same category of plate-like structures.
Provide a solution for damage localization research of large-area plate-like structures.
As described in Section “FE simulation,” 12 FE models are constructed based on the change of the crack cell’s polar angle θ. In each FE model, instead of specifying the fixed-position sensors, the out-of-plane displacement data of all nodes on the FE model external surface (a total of 63,435 nodes) are recorded. Any number and position of nodes can be defined as sensors based on the requirements of dataset creation, and then the out-of-plane displacement signals of any kind of sensor array can be obtained in a single FE model. For the convenience of following data processing, in a single FE model, the off-plane displacement signal of the node where the sensor is located is obtained under a square array with 8, 12, 16, and 20 transducers distributed at equidistance. On the premise that the sensors are all within the range of the plate, the sensor spacing L is added as much as possible to increase the amount of data. In this study, L is increased from 5 to 56 mm (1 mm step), that is, the original time-domain Lamb wave signal dataset with 52 sensor spacings in four types of array networks is constructed. A total of 2496 cases are constructed. On this basis, the wavelet coefficients at the second harmonic frequency of the time-domain signals are calculated by CWT, then the nonlinear feature dataset can be achieved.
In order to improve the convergence rate of the neural network model, the dataset should be standardized and converted into dimensionless numbers, which are in accord with the standard normal distribution. In addition, due to the strong data fitting ability of the neural network, if samples with the same arrangement pattern appear in a batch repeatedly, the neural network could extract this pattern as an important feature, which makes the model overfit and have weak generalization ability. Therefore, it is necessary to shuffle the order of the dataset. The noise effect is introduced by superimposing the original Lamb wave signals with artificial white Gaussian noise to further enhance the model generalization. The signal-to-noise ratio (SNR) of the signals is tuned to 10 dB. Finally, 90% of the total samples are used for training, 10% for testing, and 20% of the training set are used for validation.
1D-Attention-CNN approach
A deep-learning-based approach for fatigue crack localization in plate-like structures is proposed in this section, which introduces an Attention layer based on the 1D-CNN for key feature extraction to improve the crack localization accuracy.
Attention layer
Due to the limitation of the network structure, the convolutional layer assigns the same weight to each feature, resulting in no focused features during model training, which is not conducive to the improvement of model prediction performance. To solve it, many researchers integrated the attention mechanism into the convolutional module, and it proved that the attention mechanism has great potential to improve network performance. Jaderberg et al. 31 proposed the spatial transformer network module, which enabled the network to transform the feature map in space and improve the accuracy of the network by determining the spatial information of features. Hu et al. 32 proposed a new architecture module called the Squeeze Excitation (SE) module to improve the performance of the network by explicitly modeling the interdependence between the channels of the convolutional features. On this basis, Li et al. 33 combined SE with ResNet and proposed the Selective Kernel module, which enabled the network to select different receptive fields dynamically based on different scales of the feature map, and further extended the research on the mechanism of attention. Similarly, Fu et al. 34 explored the relationship between spatial and channel in the input feature map and proposed DANet, which mainly is composed of global spatial attention and channel attention. In this work, the Attention layer, consisting of two parts: the channel attention module and the spatial attention module, enables the model to learn the “what” and “where” in the channel and spatial dimensions. 35 The attention module is added to the hidden layer, the probability weights can be allocated to the features input from the hidden layer to pay attention to the important hidden layer features, so that the model can focus on important features, suppress secondary features, and enhance the representational power.
The channel attention module processes the input features with average-pooling and max-pooling, respectively, to compress features in the channel dimension. On this basis, the pooling layer output features are adopted as the input of the fully connected (FC) layer. After that, the channel attention module weight coefficients can be obtained by adding the two FC layers’ output feathers and normalizing them to (0, 1) with Sigmoid activation function. The channel attention module is shown in Figure 4.
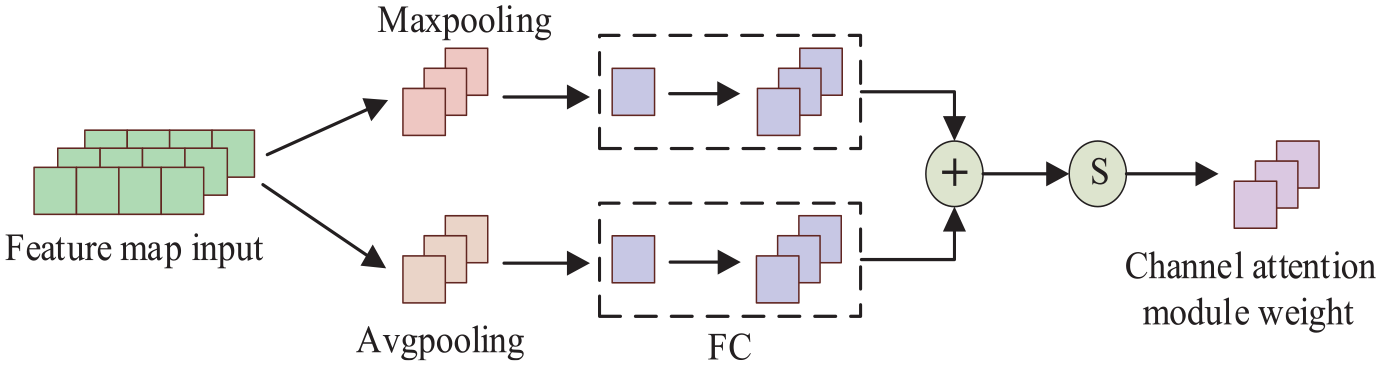
Channel attention module.
The spatial attention module processes the channel attention module output features with average-pooling and max-pooling in the spatial dimension. After concatenation, convolution, and normalization operations, the spatial attention module weight coefficients are achieved. Furthermore, the Attention layer output feature map can be obtained by multiplying the weight coefficients of the spatial attention module and channel attention module. The spatial attention module is illustrated in Figure 5, and the overall operation process of the attention module is shown in Figure 6.
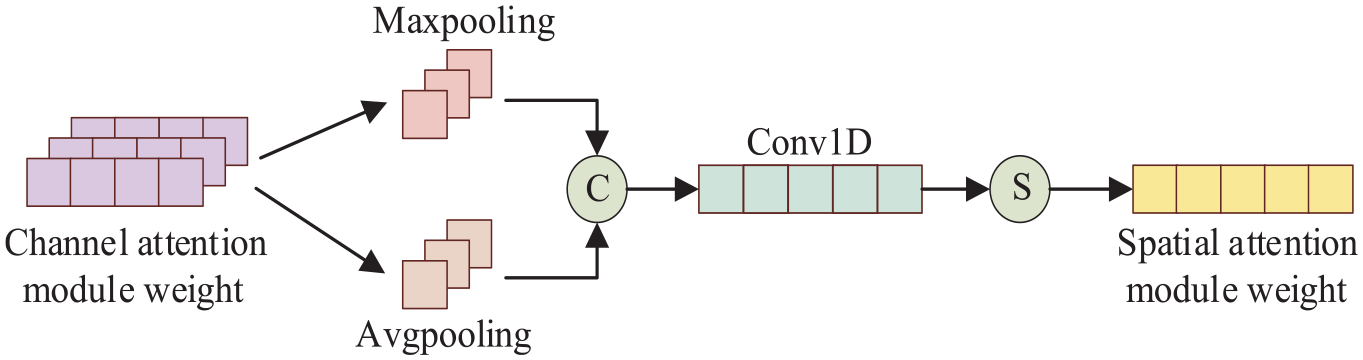
Spatial attention module.
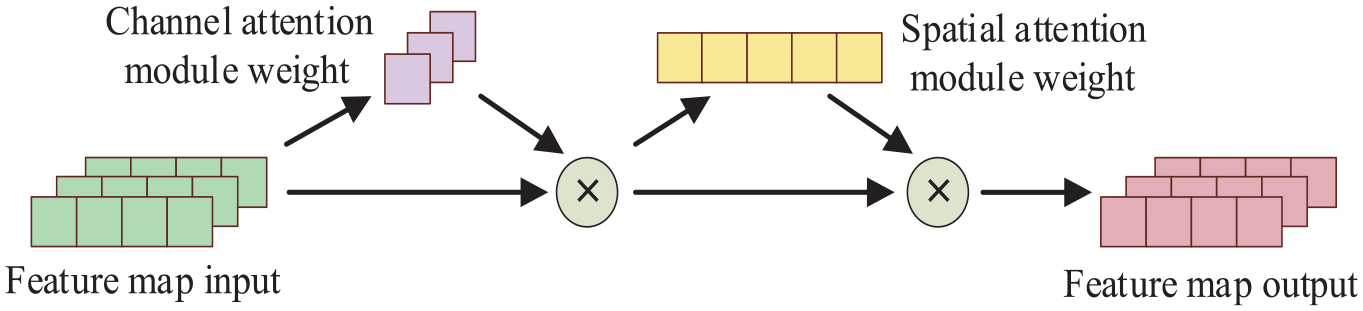
Attention module.
Model architecture
The proposed 1D-Attention-CNN architecture for feature extraction is shown in Figure 7, which is mainly composed of input layer, 1D-convolution layer, pooling layer, Attention layer, FC layer, and output layer. The input layer data, consisting of the wavelet coefficients at the second harmonic frequency, becomes the input features of the Attention layer after twice convolution and pooling calculation. The connection of the feature map between channel dimension and spatial dimension is established for important features’ preliminary extraction. Based on it, the insensitive features are further extracted by using convolutional layers, pooling layers, and Attention layers. The FC layer maps the extracted hidden layer features to the sample label space, that is, the neural network model obtains the mapping relationship between relative angle value, the relative length value, and hidden layer features, which is used for fatigue crack localization.
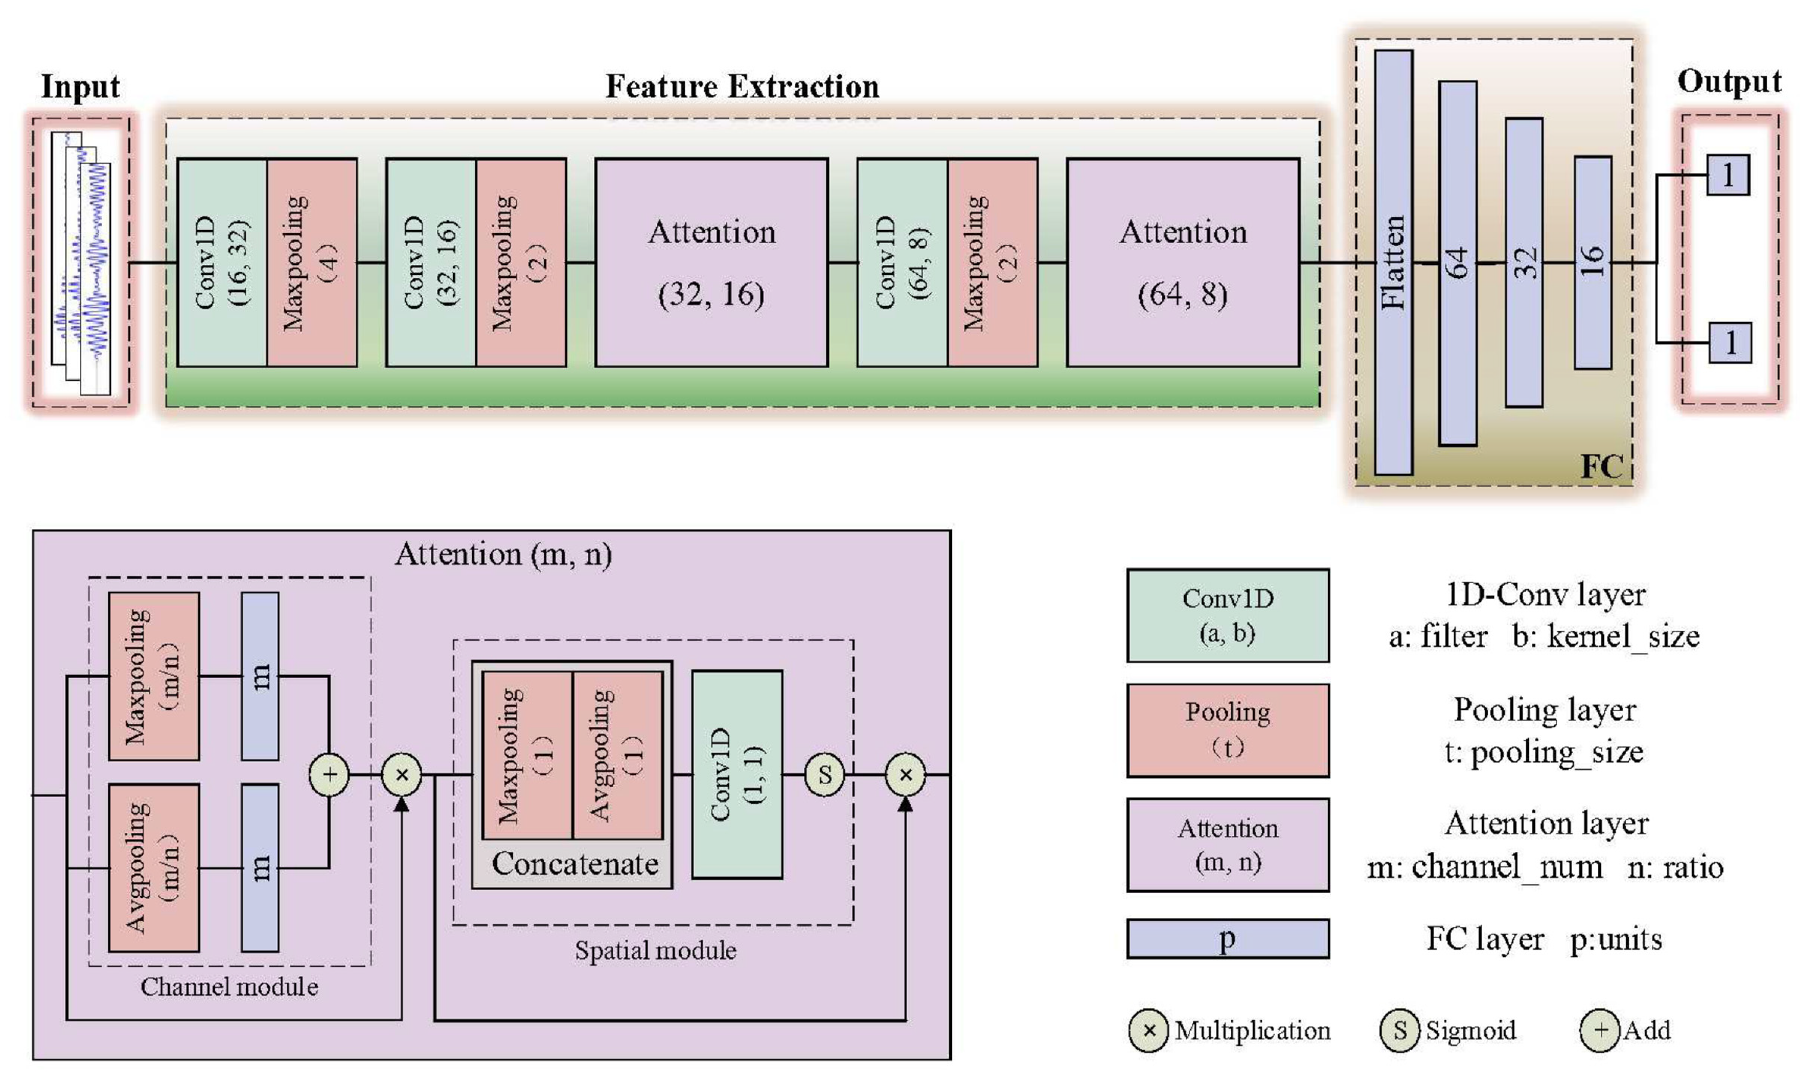
1D-Attention-CNN model architecture for fatigue crack localization.
In addition, the rectified linear unit activation function is introduced between the 1D-convolution layer and the pooling layer for nonlinear feature mapping. The RMSProp optimizer 36 with an initial learning rate of 0.001 is chosen for model training, the loss function is set as mean square error (MSE), the batch size is equal to 32, and the iterations number is 100.
During the process of neural network implementation and training, in terms of software, the 1D-Attention-CNN is established with the Keras 2.6.0 API in Windows 10. In terms of hardware, NVIDIA GeForce GTX 1650 GPU is used for model training. Furthermore, the neural network training speed is improved by the CUDA-10.1 computing platform and the GPU acceleration library of CuDNN-8.0.5.
Result and discussion
The fatigue crack localization results under three conditions are discussed in this section, including the different numbers of sensors, different neural network architectures, and different input types of signal features. In addition, a new type of FE simulation model is established, which is further demonstrated that the proposed method locates the fatigue cracks based on the nonlinear features, instead of the linear features produced by the rivet hole. The prediction accuracy of 1D-Attention-CNN is also evaluated experimentally to show the generalization ability of the proposed model.
Three evaluation indices consisting of angle deviation
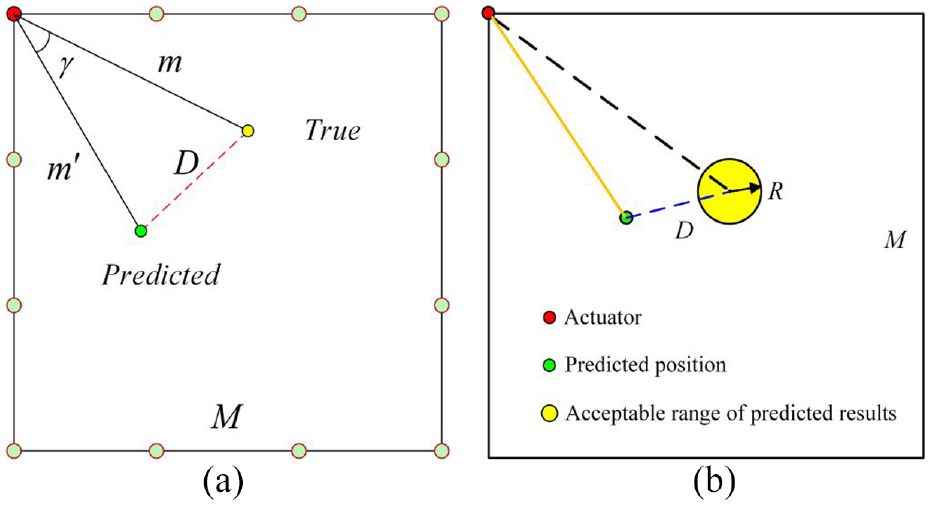
Schematic diagram of (a) fatigue crack localization result; and (b) acceptable range of predicted results.
Comparison of different numbers of sensors
The dataset, consisting of nonlinear features, is collected from the square array with 8, 12, 16, and 20 sensors distributed at equidistance. Based on this, four 1D-Attention-CNN models are trained. The loss curves with 100 iterations of the model trained by the dataset collected from the 16 transducers are shown in Figure 9.
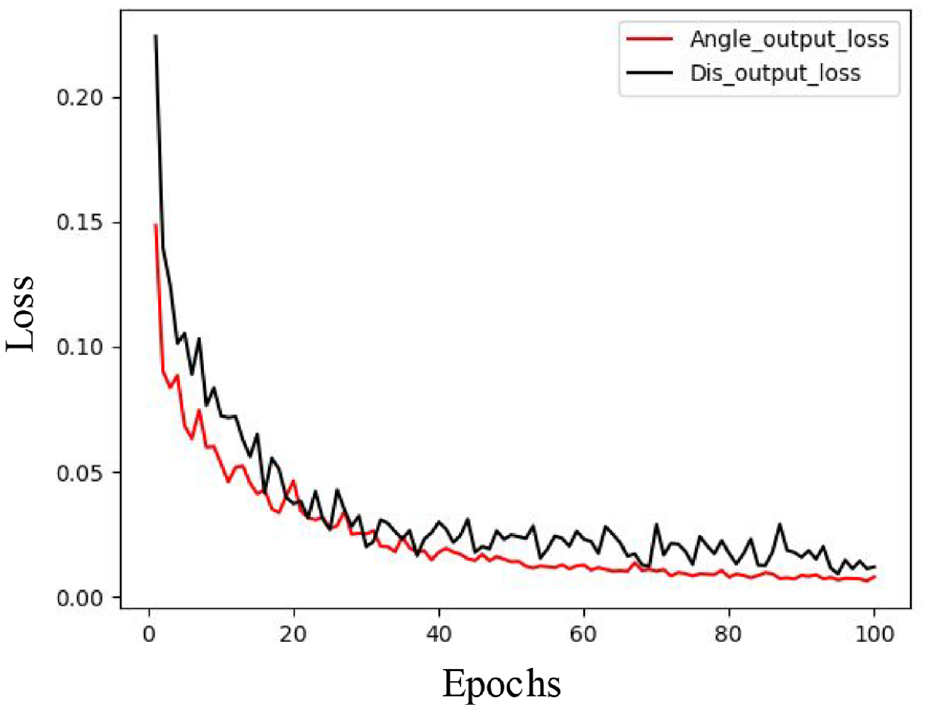
The loss curves with 100 iterations.
The regression results of angle and sensor spacing related to localization accuracy can be observed in Figure 10. The predictive values of the angle and sensor spacing are distributed on both sides of the diagonal line in order, which indicates a high degree of consistency between predictive values and actual values. It also can be seen from the angle prediction results (Figure 10(a), (c), (e) and (g)) that as the sensor number increases, the distribution of angle predictive values on both sides of the diagonal is more concentrated, that is, the deviation is smaller. Similarly, as shown in Figure 10(b), (d), (f), (h), the predictive values of the sensor spacing are closely distributed on both sides of the diagonal. However, with the increment of the sensor spacing, that is, the detection area expands, and the deviation between the predictive value and the true values increases, which may be correlated with the attenuation of the Lamb waves.
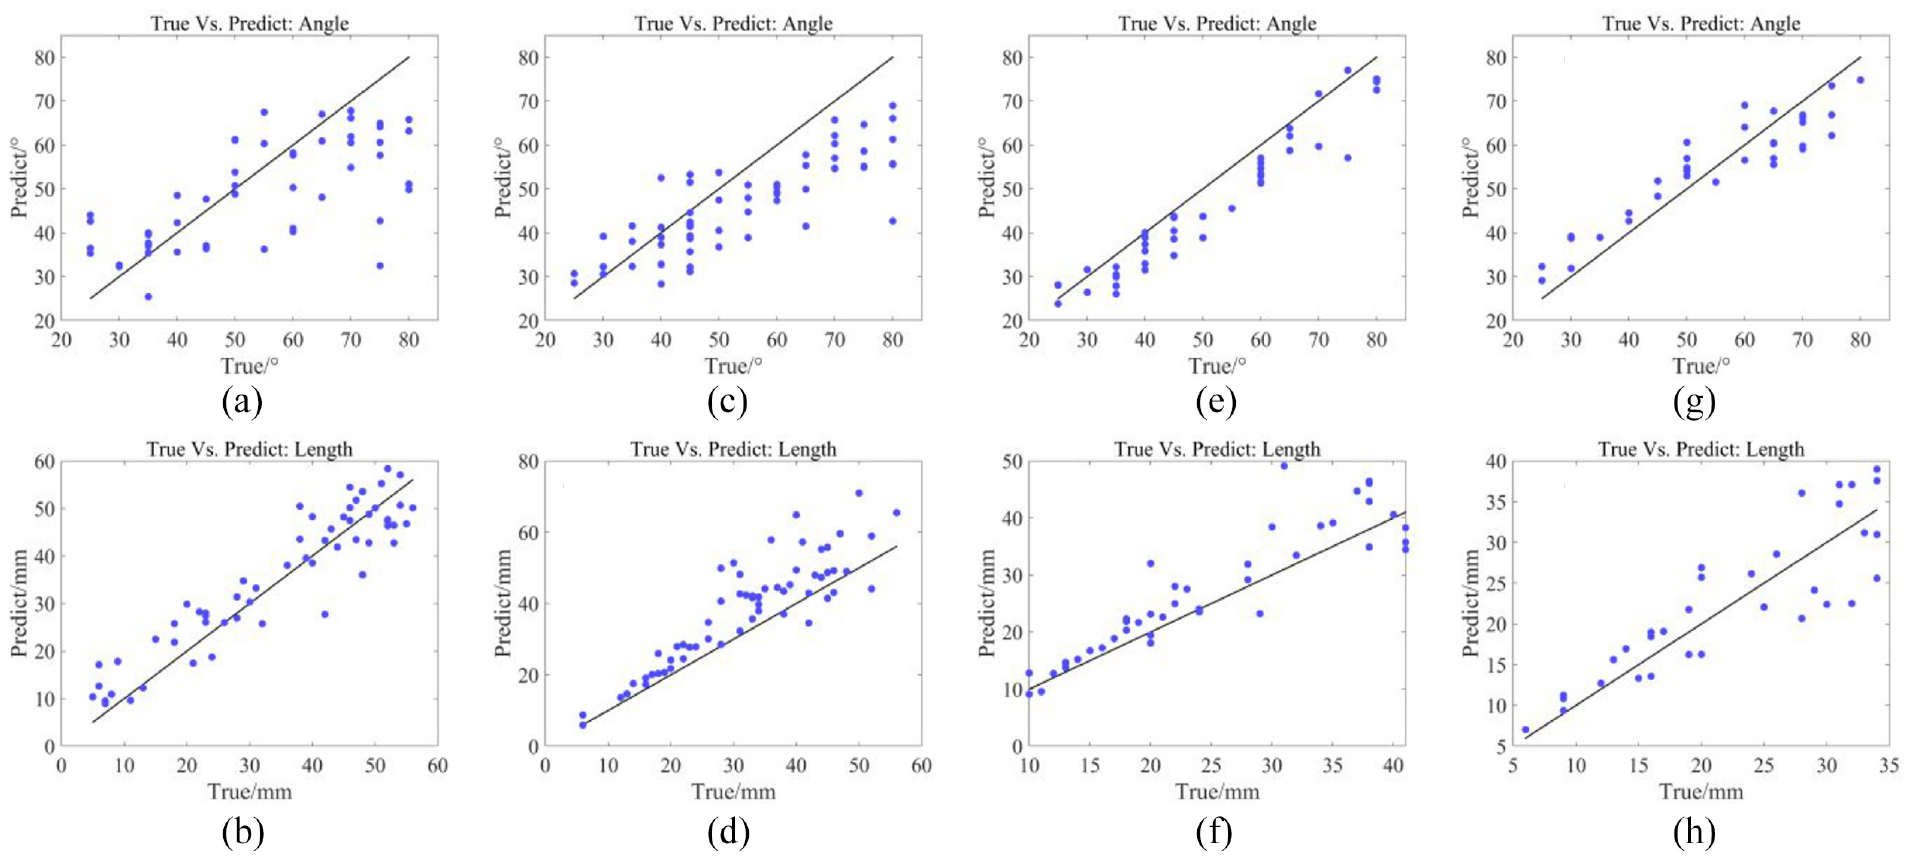
1D-Attention-CNN regression results of angle and sensor spacing (input: nonlinear features, (a), (b) sensor number = 8; (c), (d) sensor number = 12; (e), (f) sensor number = 16; and (g), (h) sensor number = 20).
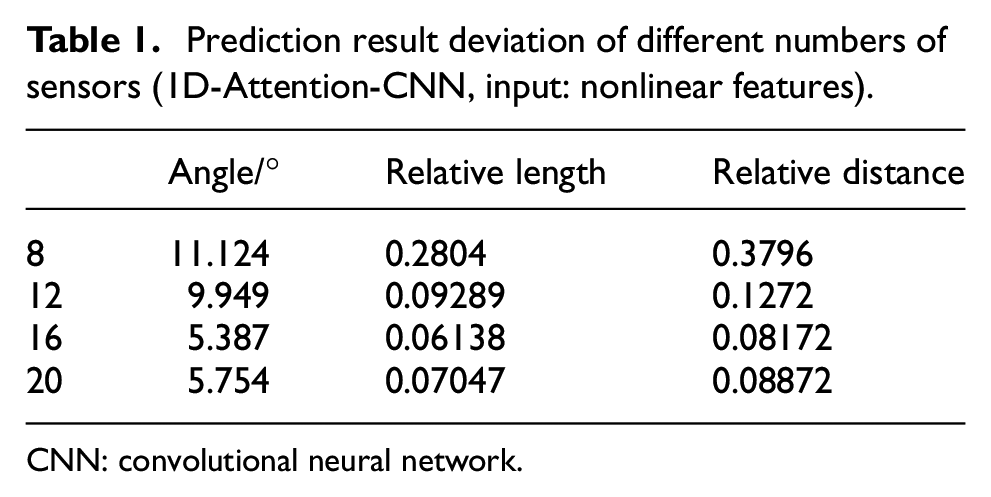
Compared with Figure 10, Table 1 is more intuitive, in which three evaluation indices for the evaluation of the predictive results with different numbers of sensors. From the numerical perspective, as the number of sensors increases, the prediction accuracy gradually improves, but the effectiveness of prediction is not proportional to the sensor number. Among the three evaluation indices, including angle deviation, relative length deviation, and relative distance deviation, relative distance deviation is the most critical, which manifests the fatigue crack localization accuracy directly. Considering the detection cost and localization accuracy, a square array with 16 transducers is selected for the following analysis.
Prediction result deviation of different numbers of sensors (1D-Attention-CNN, input: nonlinear features).
CNN: convolutional neural network.
In addition, the crack localization results with the four types of the sensor array in the case of
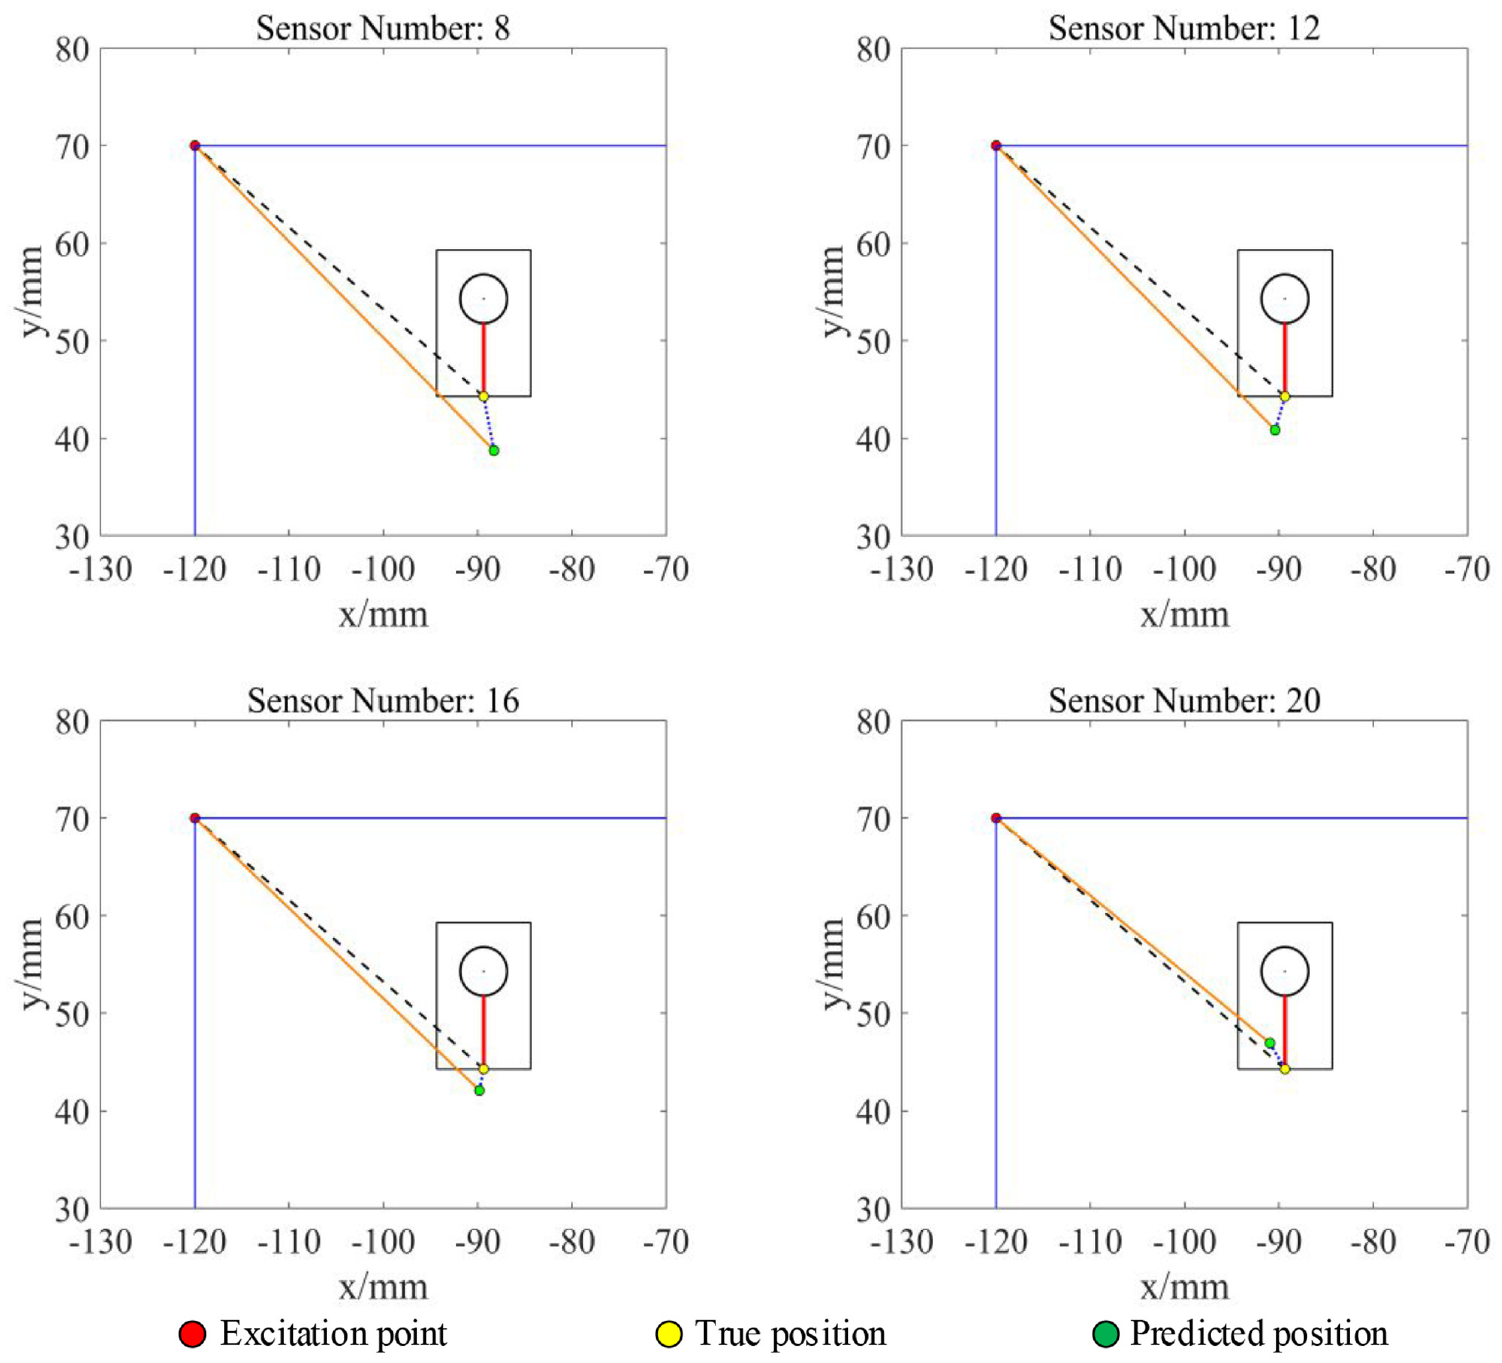
Schematic diagram of fatigue crack localization result with different numbers of sensors (
Comparison of different neural network architectures
In theory, with the introduction of the Attention layer, the feature extraction of the neural network can be further enhanced. Based on it, the accuracy of fatigue crack localization can be improved. To verify the above perspective, five neural network models, including artificial neural network (ANN), 1D-CNN, 1D-Separable-CNN, ResNet, and 1D-Attention-CNN, are trained with the same training dataset separately.
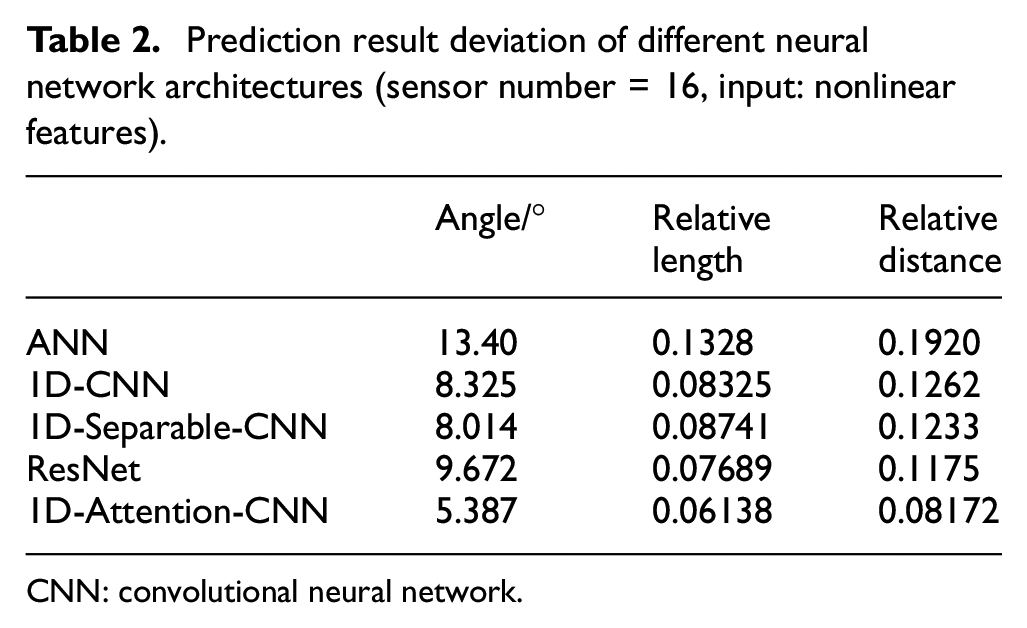
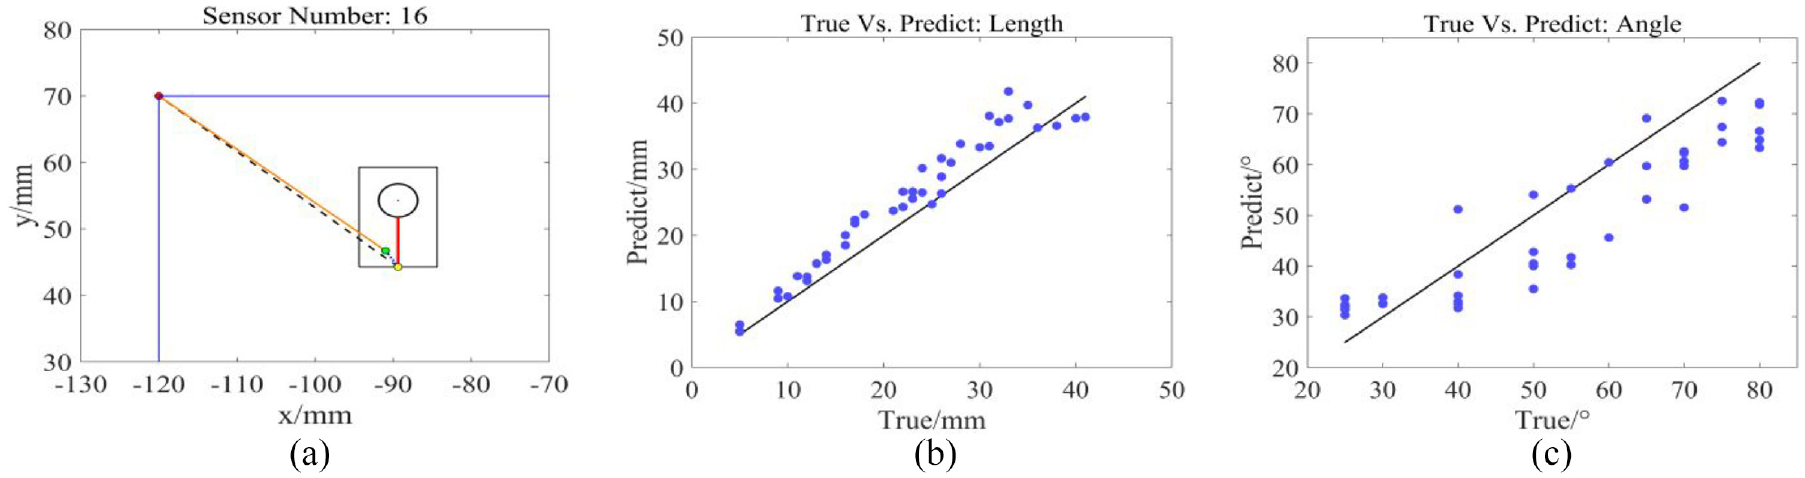
As shown in Table 2, the indices of the five models’ prediction results intuitively manifest that the performance of 1D-Attention-CNN is better than the other four models, and the prediction result of ANN is the worst. From the numerical results, the prediction results of 1D-CNN, 1D-Separable-CNN, and ResNet are similar, and the performance of 1D-Attention-CNN is improved by about 50% in terms of relative distance deviation, which determines fatigue crack localization accuracy directly. Therefore, the introduction of the Attention layer can enable the model to extract features effectively and improve the fatigue crack localization accuracy. As a typical example, the prediction results of 1D-CNN are shown in Figure 12. Compared with the 1D-CNN model, the prediction results of the 1D-Attention-CNN model, consisting of angle and sensor spacing, are concordant with the true values.
Prediction result deviation of different neural network architectures (sensor number = 16, input: nonlinear features).
CNN: convolutional neural network.
1D-CNN regression results of angle and sensor spacing (sensor number = 16, input: nonlinear features): (a) fatigue crack localization result, (b) prediction results of angle, and (c) prediction results of sensor spacing.
Evaluation of different input types of signal features
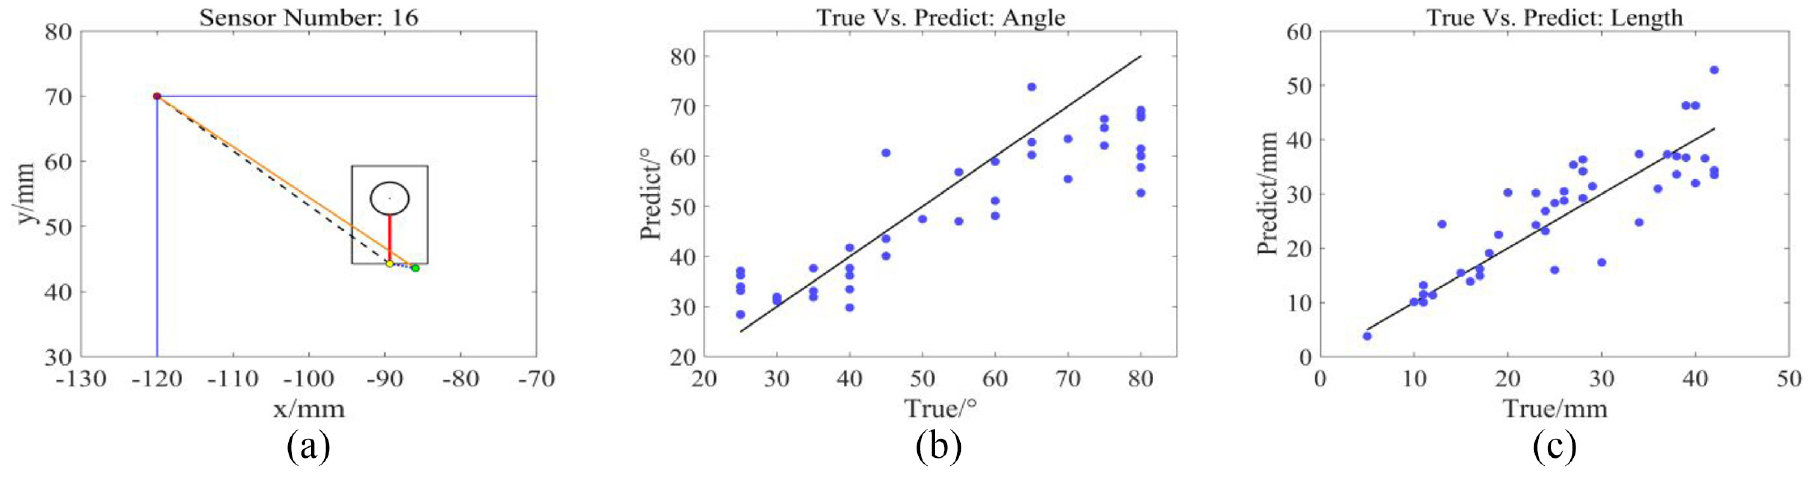
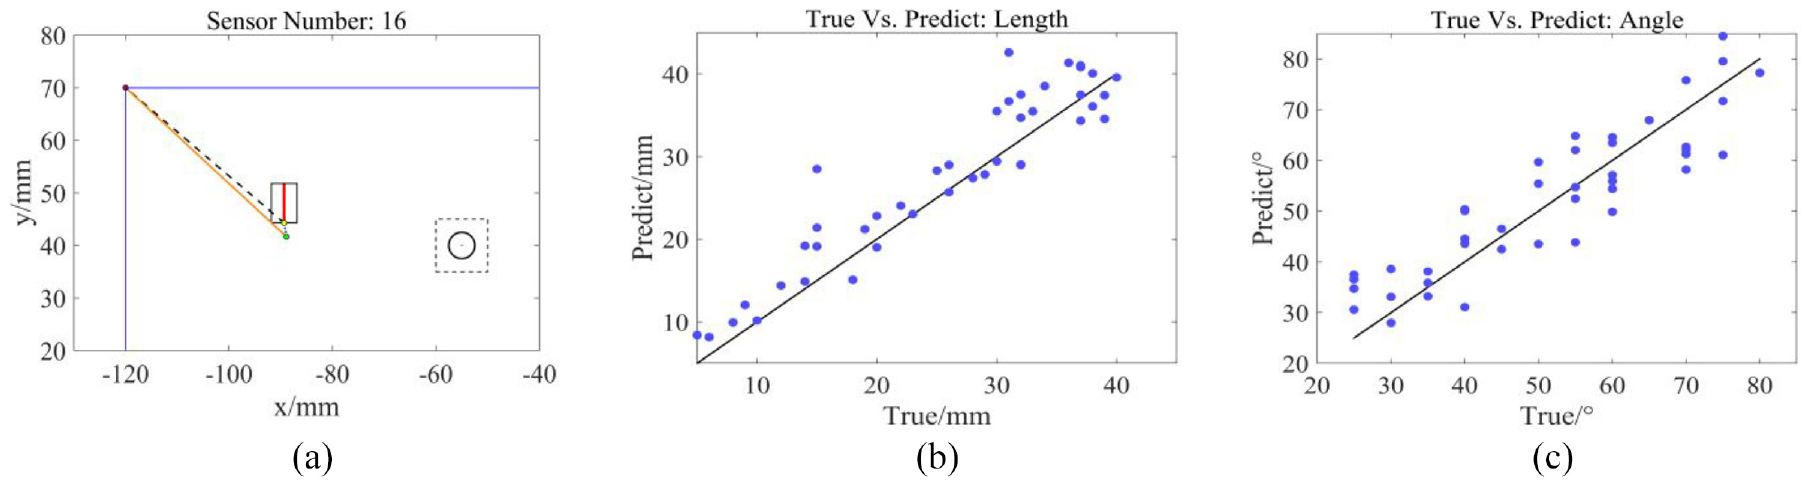
In addition to the data amount and model architecture, the signal feature is also an essential factor influencing the predictive performance. The CWT is used to calculate the wavelet coefficients at the second harmonic frequency of the original time-domain signals in this research, and the dataset based on such nonlinear features is used to train the neural network models. To verify the validity of the feature selection, the 1D-Attention-CNN model is trained using the original time-domain signals. As shown in Figure 13(b) and (c), the model trained by the original time-domain signals is also accurate in terms of sensor spacing prediction, but the angle prediction results are more scattered, which leads to the reduction of the fatigue crack localization accuracy (Table 3).
1D-Attention-CNN regression results of angle and sensor spacing (sensor number = 16; input: original time-domain signal): (a) fatigue crack localization result, (b) prediction results of sensor spacing, and (c) prediction results of angle.
Prediction result deviation with different input types of signal features (sensor number = 16; 1D-Attention-CNN).
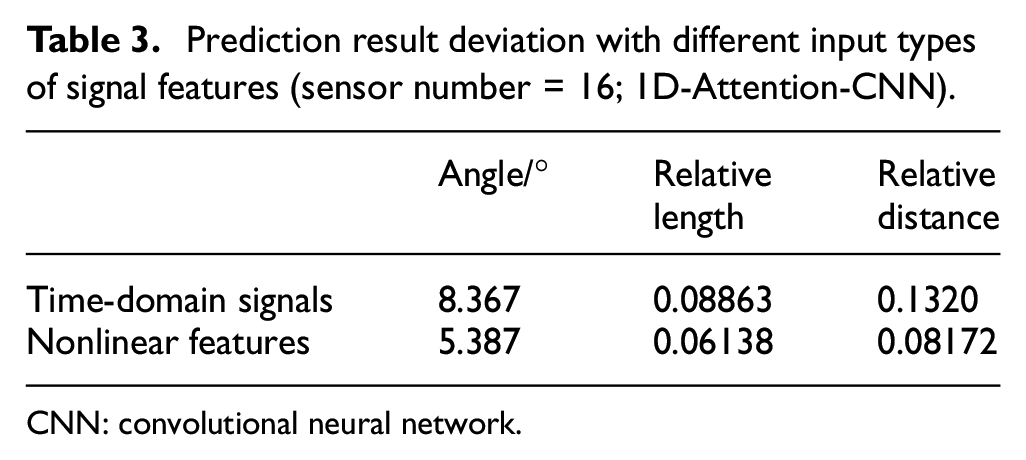
CNN: convolutional neural network.
On the other hand, as shown in Figure 13(a), the prediction results of the model trained by the time-domain signals are still near the tip of the fatigue crack. Theoretically, the second harmonic generated by the “slap effect” after the crack interacts with the elastic waves is an important nonlinear feature for crack localization, and the original time-domain signals also embrace these nonlinear features. 37 Therefore, it reveals that the 1D-Attention-CNN can extract nonlinear features partially, but not completely, from the original time-domain signals to locate the fatigue crack. Compared with the original time-domain signals, the dataset established in this research, consisting of the wavelet coefficients at the second harmonic frequency, reveals the nonlinear features of the Lamb wave signals more intuitively, which proves that the dataset based on the nonlinear features is more beneficial for fatigue crack localization.
Verification of the mapping involved with nonlinearity
The FE model, consisting of a rivet round hole and a through-thickness fatigue crack, is presented in Section “FE simulation.” Due to the existence of tensile load, fatigue crack is prone to occur, and it is adjacent to the hole. It is common knowledge that the rivet hole is the linear guided wave signal source. Compared with it, the nonlinear features generated by the fatigue crack are relatively weak. Therefore, a question is arising: whether the existence of the structure, in which the rivet hole is adjacent to the fatigue crack, is the causation of the good performance in fatigue crack localization. To refute this question, a new type of FE model, called the separate FE model, is established, in which the material properties, excitation signal, excitation point position, and other settings are the same, and only the crack cell setting is changed. The separate FE model is shown in Figure 14, the position of the rivet hole with a diameter of 5 mm is fixed, and the position of the 5-mm-long fatigue crack changes as required in the polar coordinate system. Similar to Figure 2, the polar coordinate of the crack tip is set as
Schematic diagram of separate FE simulation model.
For ease of comparison, only the 16-element square array data in the separate FE model are obtained, in which the sensor spacing L increases from 5 to 56 mm (1 mm step). The wavelet coefficients at the second harmonic frequency of the time-domain signals are created as the dataset, and 1D-Attention-CNN is used for model training and prediction. The prediction results with the separate FE simulation model in the case of
1D-Attention-CNN prediction results with separate FE simulation model: (a) crack localization results; (b) regression results of sensor spacing; and (c) regression results of angle.
Prediction result deviation with different FE models (sensor number = 16; 1D-Attention-CNN).
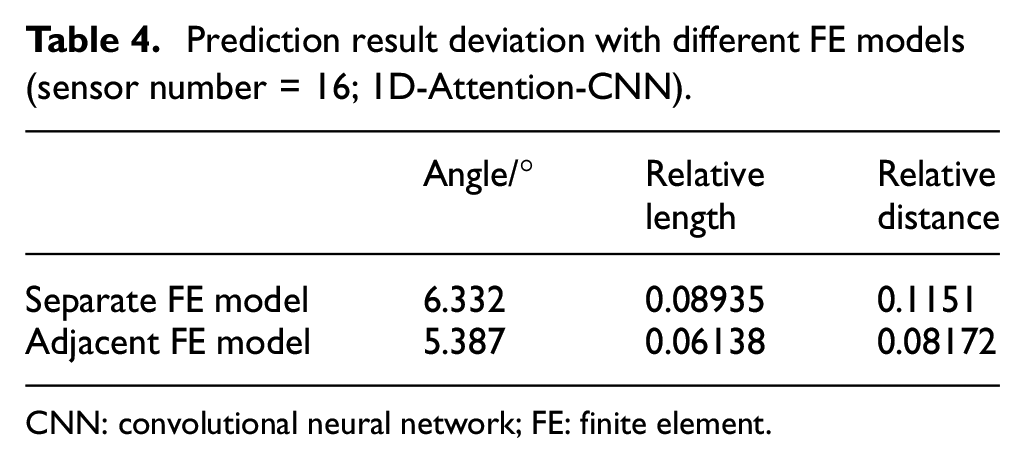
CNN: convolutional neural network; FE: finite element.
In terms of the separate FE simulation model, on one hand, the position of the rivet hole is fixed, which means that the linear signal features are constant, on the other hand, the position of the fatigue crack is constantly changing, that is, the nonlinear signal features are different. The prediction results reveal that the fatigue cracks with different locations can be determined accurately, thus the fatigue crack that can be located accurately has nothing to do with the adjacent hole and crack. Therefore, it is further demonstrated that the proposed method utilizes nonlinear signal features to locate fatigue cracks, instead of the linear features generated by the rivet hole.
Comparison of different propagation distances
The concept of relative value is introduced to deal with the closed fatigue crack tip localization in large plate-like structures. Based on the concept of relative value, the distance between the actuator and the crack tip is fixed, but in practice, the distance is unknown and varies. With different propagation distances, the attenuation of the guided wave has an effect on the signal features. The propagation distance is one of the main factors that affect the prediction accuracy of the neural network model. Therefore, it is necessary to discuss the prediction performance of the neural network model trained in this work when the propagation distance of guided waves is changed.
Two FE models, model-A and model-B, are established as shown in Figure 16, in which the relative angle value is the same, but the propagation distance is changed. The polar coordinates of the fatigue crack are set as
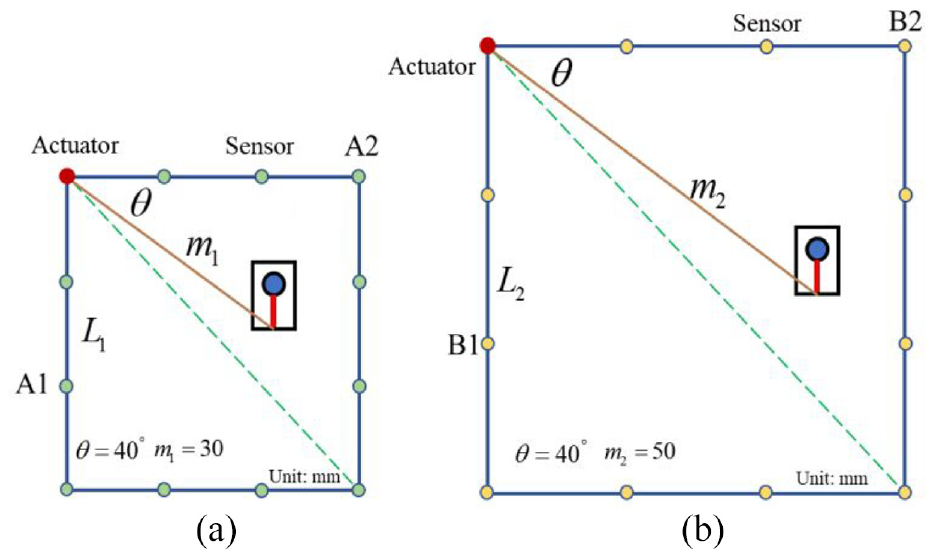
The schematic diagram of (a) model-A; and (b) model-B.
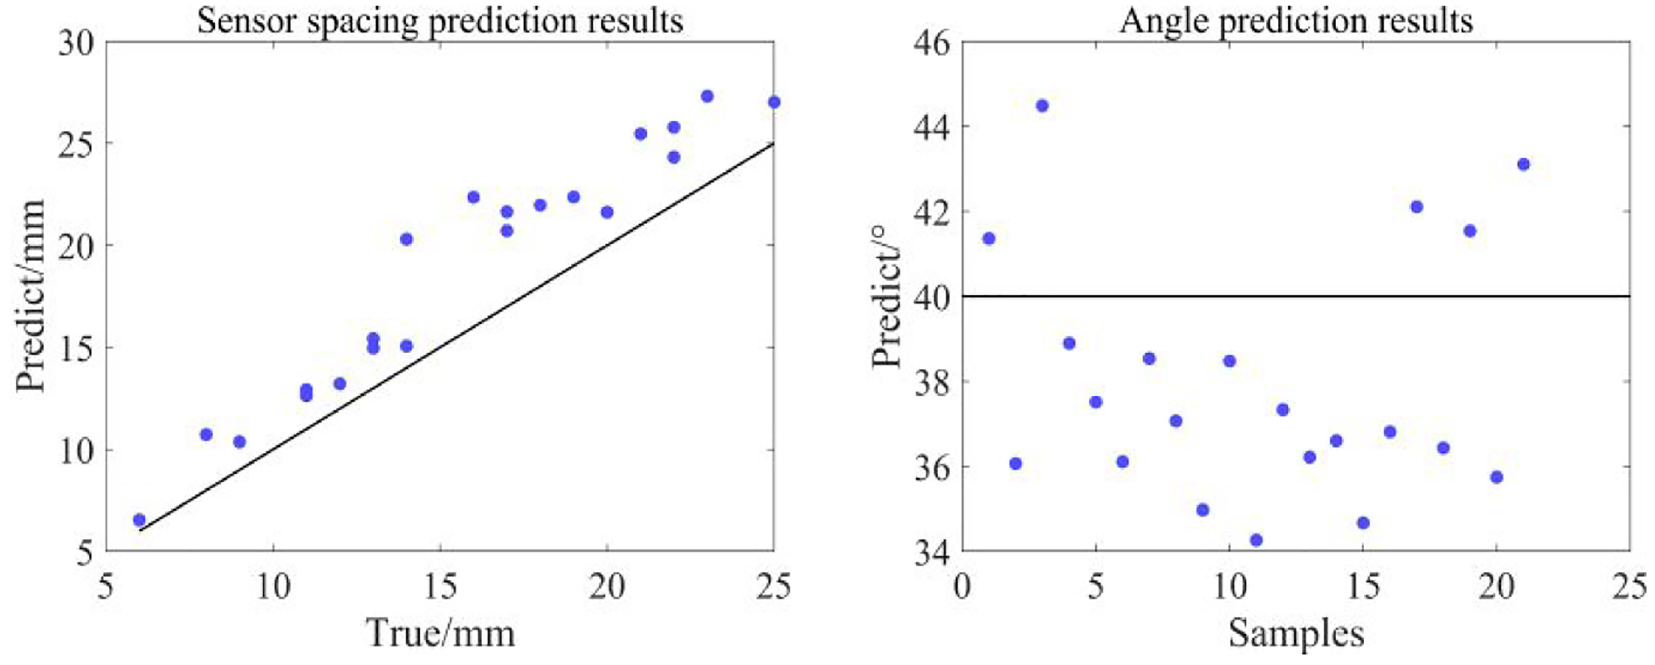
Prediction results of sensor spacing and angle when the polar coordinate of the crack is
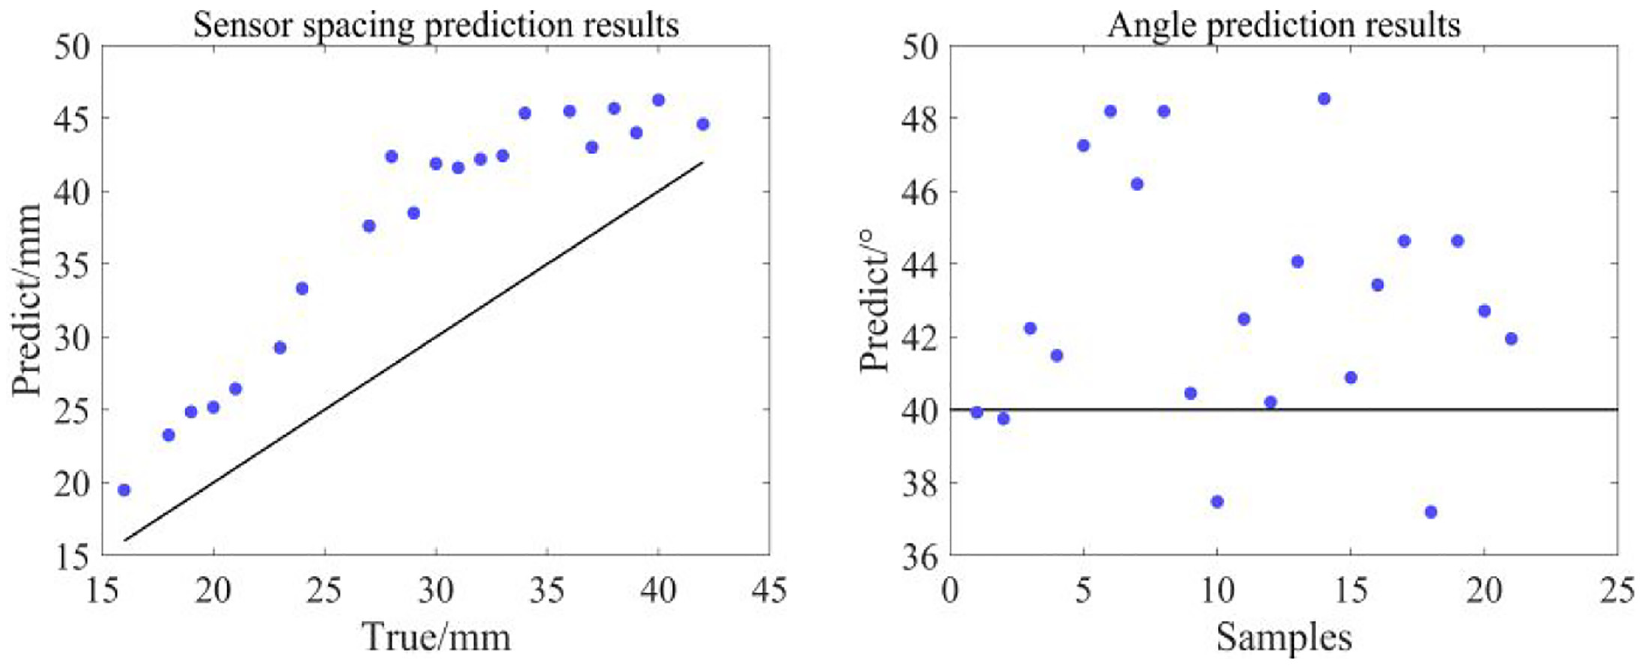
Prediction results of sensor spacing and angle when the polar coordinate of the crack is
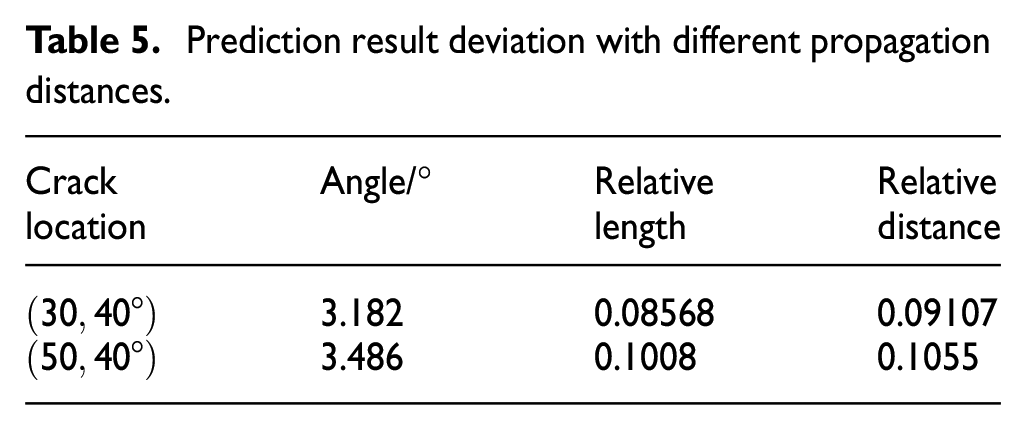
As shown in Figures 17 and 18, the prediction results of sensor spacing are distributed on both sides of the diagonal, and the predicted value of the angle fluctuates around the actual value of
Prediction result deviation with different propagation distances.
Validation using experimental data
To verify the feasibility and effectiveness of the proposed method, the experiment is carried out. The scanning region of the laser interferometer is 130 × 130 mm2, and the scanning step is set to 5 mm, the out-of-plane displacement signals of 729 points within the scanning region can be obtained. A 16-element square array is taken as a representative instantiation to evaluate the prediction accuracy and the generalization ability of the trained 1D-Attention-CNN with the nonlinear features. According to the requirements of the 16-element square array, five datasets that are selected with the sensor spacing L are 10, 15, 20, 25, and 30 mm, respectively. The experimental signals, after low-pass filtering, are processed with CWT for training set making. The prediction results of experimental data in the case of
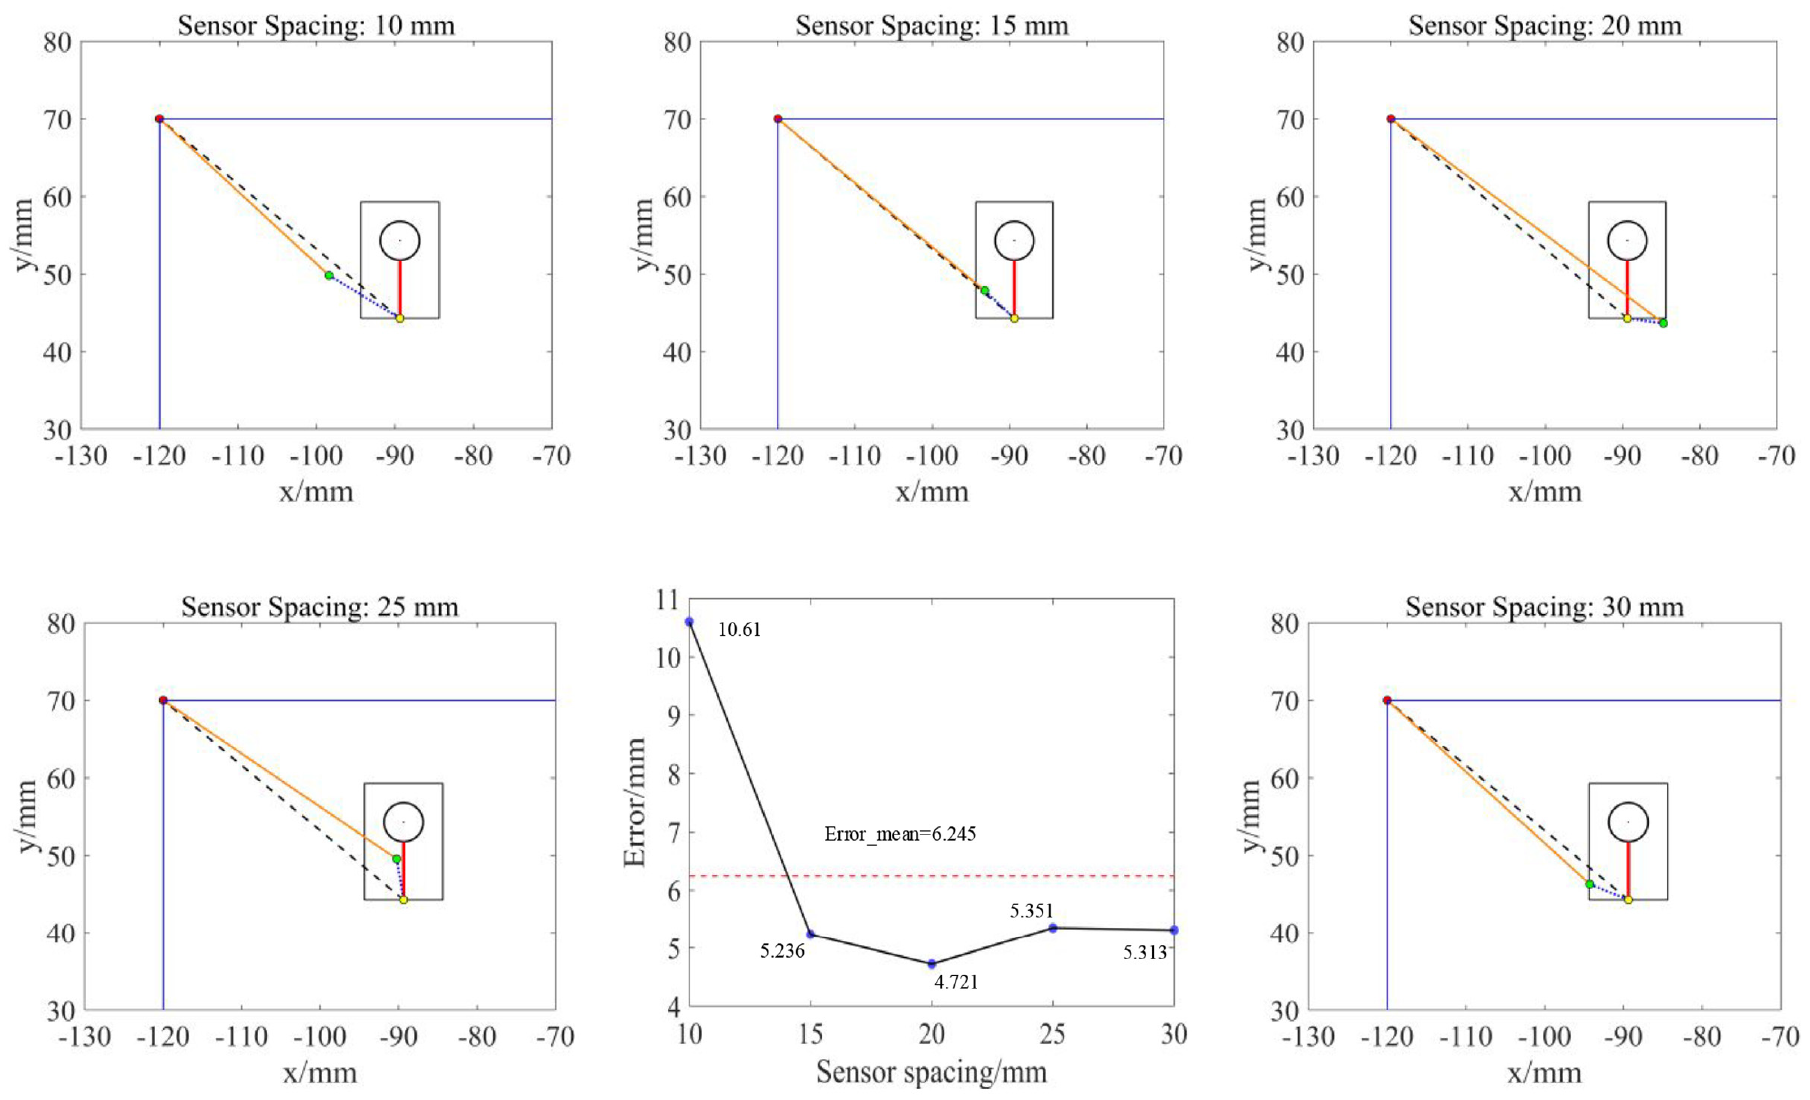
Prediction results of experimental data with five sensor spacings.
The average deviation between the predictive position and the true position with five sensor spacings is 6.245 mm. Among them, the prediction result is the worst when the sensor spacing is 10 mm, and the maximum positioning deviation reaches 10.61 mm. The phenomenon that the sensor spacing increases within a certain range and the prediction performance becomes better in this work can be explained by the First Fresnel Zone theory, which points out that as long as the First Fresnel Zone is not blocked, the propagation conditions in approximate free space can be obtained. In this work, the locations of the actuator and rivet hole are fixed, and the sensor spacing is constantly changing. Based on the First Fresnel Zone theory, the radius of the First Fresnel Zone increases with the increase of sensor spacing, that is, the area proportion of the rivet hole in the First Fresnel Zone decreases so the impact of the rivet hole on wave propagation is constantly reduced. Therefore, the prediction effect is improved with the increase of sensor spacing within a certain range. Of course, the measurement error and the deviation of the true position judgment of the crack caused by its invisibility are also important factors that impair the crack localization accuracy.
Conclusion
It is meaningful but also challenging to locate fatigue cracks in plate-like structures. A method of extracting nonlinear features of Lamb wave signals using deep-learning-based approach is proposed to locate fatigue cracks. Aiming at the significant problem of how to obtain sufficient data in the deep learning method, a method guided by the relative value label based on the FE models established in the polar coordinate system is proposed. Compared with the traditional method for dataset acquisition, where the models have fixed sensor arrays and changing damage positions, the proposed method in this work is time-consuming and of high efficiency. Furthermore, it is applicable to other similar damage localization research, whether linear damage source or nonlinear damage source. Based on the FE simulation dataset, the fatigue crack localization results with the different numbers of transducers, different neural network architectures, different input types of signal features, and different propagation distances are discussed. Furthermore, a new type of FE model, called the separate FE model, is established to prove that the fatigue crack that can be located accurately has nothing to do with the adjacent hole and crack. It is further demonstrated that the proposed method locates the fatigue cracks based on the nonlinear features, rather than the linear features produced by the rivet hole. Through experimental validation, under the conditions of five sensor spacings, the average deviation of the positioning results is 6.245 mm, and the maximum positioning deviation is 10.61 mm. The experimental results further confirm the feasibility and effectiveness of using a deep-learning-based approach with nonlinear Lamb waves for fatigue crack localization.
With the promising outcomes reported here, there are still some problematic issues and challenges remaining for future exploration, such as the interpretability of the deep learning method, the optimization of neural network architecture aiming at crack localization problem, and the multi-fatigue cracks localization based on the deep learning method.
Footnotes
Appendix
|
|
|---|
The testing dataset is input into the trained neural network model , and output the optimal relative label for crack localization . |
Declaration of conflicting interests
The author(s) declared no potential conflicts of interest with respect to the research, authorship, and/or publication of this article.
Funding
The author(s) disclosed receipt of the following financial support for the research, authorship, and/or publication of this article: This work was supported by the National Key Research and Development Plan of China (Grant No. 2021YFC3001802) and the National Natural Science Foundation of China (Grant Nos. U1930202, 12025403, and 12104155).