
Abstract
Planetary gearbox (PGB) usually work in harsh working conditions with low speed and heavy load, and they are prone to wear. Different from the local faults, the distributed faults such as tooth surface wear are often weak and difficult to detect in the early stage, and it is difficult to extract fault characteristic. This paper presents an early fault diagnosis method for the distributed tooth surface wear of PGB to solve this problem. The proposed multi-channel optimal maximum correlation kurtosis deconvolution (MCO_MCKD) algorithm is used to extract fault characteristic. In order to enhance the effect of fault characteristic extraction (FCE), the algorithm first uses the sliding window principle to segment the input signal to establishes multiple channels for maximum correlation kurtosis (max_CK) optimization based on all the short signals obtained. The finite impulse response (FIR) filter with the max_CK is selected to filter the input signal, in order to realize FCE. The influence of tooth wear is mainly reflected in the frequency-domain signal amplitude. In order to realize early fault diagnosis, the frequency-domain statistical indicator fault characteristic energy ratio (FCER) is proposed based on this characteristic. The health status of the equipment is monitored by calculating the FCER of the signal after FCE. Early fault diagnosis is realized based on the mutation of the FCER. The simulation results show that MCO_MCKD algorithm has strong robustness. The experimental results show this proposed method is effective and superior.
Keywords
Introduction
As an important power transmission device, Planetary gearbox (PGB) has been widely used in industrial production, engineering machinery, wind turbine, and transportation. 1 With the continuous meshing operation of gears, tooth surface wear is inevitable. This is a kind of gear fault with a slow development. It usually does not affect the normal operation and is not easy to detect in the initial stages. 2 However, with the continuous operation of the gear and the influence of lubrication, external forces and other factors, the wear can keep increasing. If it is not maintained properly, it can easily lead to failures and unnecessary breakdowns and downtimes. Therefore, detecting early warning signs of tooth surface wear fault is particularly important. This can help equipment maintenance personnel to carry out preventive maintenance of equipment, and it is of great significance to improve production efficiency and reduce costs.
Because the vibration signal can contain a large amount of equipment operation status information, vibration analysis has become the preferred method for fault diagnosis of PGB. 3 Gear fault diagnosis based on vibration signal is one of the most widely used methods, which has the best diagnosis effect and the most convenient signal acquisition. However, the vibration acceleration sensor measures the overall operation status information of the gearbox. The fault characteristic at the initial stage of tooth wear are weak and easy to be submerged in the noise information. The PGB usually has a serious modulation phenomenon, 4 which together makes it difficult to extract the fault characteristic of tooth wear in the PGB. Therefore, extracting fault-related information from vibration signals becomes the basis of fault diagnosis.
Blind deconvolution technology is a fault characteristic extraction (FCE) method that can recover periodic pulses related to fault information from the original vibration signal. 5 The finite impulse response (FIR) filter eliminates the influence of various external signals by maximizing a certain standard of the filtered signal. At present, the commonly used blind deconvolution algorithms mainly include maximum correlation kurtosis deconvolution (MCKD),6,7 minimum entropy deconvolution (MED),8–10 multipoint optimal minimum entropy deconvolution adjusted (MOMEDA),11–13 maximum second-order cyclostationary blind deconvolution (CYCBD),14–16 etc. Among them, MCKD realizes FCE by finding the optimal FIR filter when correlation kurtosis (CK) is the largest, which can eliminate or weaken the influence of the signal transmission path on the FCE. 5 It can extract the periodic components of interest as needed, and has strong adaptability and purpose in the case of strong noise background. 17 At present, MCKD and its improved algorithm have been widely used in the field of fault diagnosis.
Zhang et al. 18 used the variational modal decomposition (VMD) and grasshopper optimization algorithm (GOA) to optimize the parameter selection of MCKD, and obtained improved MCKD to extract the crack fault characteristics of the sun gear of the PGB. Liang et al. 19 proposed maximum average kurtosis deconvolution based on MCKD, which can effectively extract the fault characteristics of rolling bearing cracks and tooth surface pitting faults of parallel shaft gearbox. Lyu et al. 20 used the quantum genetic algorithm to optimize the parameter selection of MCKD, and successfully extracted the composite fault characteristics of the PGB. Hong et al. 21 used the advantages of entropy, root mean square (RMS), and spectrum to improve MCKD, obtained improved adaptive MCKD, and successfully extracted the composite fault characteristics of aeroengine rotor system. Zhang et al. 22 used the GOA to optimize MCKD, proposed adaptive MCKD, and combined VMD to extract the fault characteristics of the rolling bearing of wind turbines. Chen et al. 23 used periodic detection techniques (PDT) to adaptively identify repetitive pulse periods, and proposed PDT-assisted MCKD, MOMEDA, and CYCBD for bearing fault characteristic enhancement.
MCKD and its improved algorithm are mainly used to extract the characteristics of gear local faults. The fault types mainly include broken teeth, spalling, pitting, and so on. In this paper, MCKD is applied to the FCE of the distributed tooth surface wear (DTSW) of the PGB under strong noise background. Because the characteristics of local faults and distributed faults are different, in order to make MCKD suitable for the extraction of distributed fault characteristics, this paper will improve MCKD.
FCE is the basis of accurate fault diagnosis. After characteristic extraction, it usually needs other analysis methods to achieve the purpose of diagnosis. At present, the commonly used methods mainly include statistical indicators analysis method, 24 spectrum analysis method,7,25,26 and so on. Among them, the statistical indicators analysis method is widely used because of its simple and intuitive characteristics. Liu 27 used the proposed indicators Ies and Ikr to evaluate the wear fault state of sun gear tooth surface of the PGB. Shen 28 et al. obtained the dynamic response characteristics of gear wear through the dynamic modeling, and constructed four diagnostic indicators based on the meshing frequency (MF) sideband of vibration signals. These indicators are sensitive to the changes of tooth surface wear status of parallel shaft gears. Feng et al. 29 used RMSSA and ICS2 as the indicators for judging the similarity between the simulated signal and the experimental signal. At the same time, the change of the indicator can reflect the change of the fault degree to achieve the purpose of fault diagnosis. Zhang et al. 30 used the proposed enhanced MCKD to extract the characteristics of the composite fault of the wind turbine rolling bearing, and used the spectrum analysis method to diagnose the fault.
Tooth surface wear will lead to tooth profile distortion and increased backlash. However, the MF and its harmonics with tooth surface wear will increase significantly, and the meshing impact and modulation are weak and insignificant. 31 The meshing impact and modulation of local faults are usually obvious. Therefore, although the above indicators can effectively monitor and diagnose the local faults of gears, they are not suitable for the early fault diagnosis of DTSW in PGB. In this paper, statistical indicators suitable for distributed fault diagnosis will be proposed.
To sum up, in order to make up for the above research gaps, we propose an early diagnosis method of planetary gearbox DTSW fault on the basis of FCE and statistical indicators. The rest of this paper is organized as follows. MCKD will be described in Section ``Maximum correlation kurtosis deconvolution'' Section ``Multi-channel optimal maximum correlation kurtosis deconvolution'' and ``Frequency domain statistical indicators'' focus on the specific proposed process of multi-channel optimal maximum correlation kurtosis deconvolution (MCO_MCKD) and fault characteristic energy ratio (FCER), respectively. Section ``The fault diagnosis method'' mainly describes in detail the process of proposing of the early fault diagnosis method of the DTSW in PGB. In Section ``Robustness verification of MCO_MCKD,'' there are the acquisition of simulated signal and robustness analysis of MCO_MCKD. Section ``Experimental verification and discussion'' mainly carries out experimental verification on the FCE results and the proposed diagnosis methods. The last section is the conclusion.
The proposed early fault diagnosis method for PGB
In this paper, a novel method for diagnosing the early DTSW fault in PGB is proposed. The method first uses the proposed MCO_MCKD to extract fault characteristics, and then uses the proposed statistical indicator FCER to indicate fault. This section mainly describes MCKD, MCO_MCKD, FCER, and specific diagnosis methods.
Maximum correlation kurtosis deconvolution
MCKD is widely used in FCE and enhancement of mechanical equipment. CK can measure the correlation of signal before and after filtering, and can reflect the impact characteristics of fault. The theory believes that the fault vibration signal x(n) can be expressed as the following form6,7,15–20:

Where s(n) represents the original vibration signal, t(n) represents the transmission path function of vibration shock, n_s(n) represents the noise component, and the matrix form of x(n) can be written as x(n) = [x1, x2, …, xN − 1, xN].
MCKD finds an optimal FIR filter
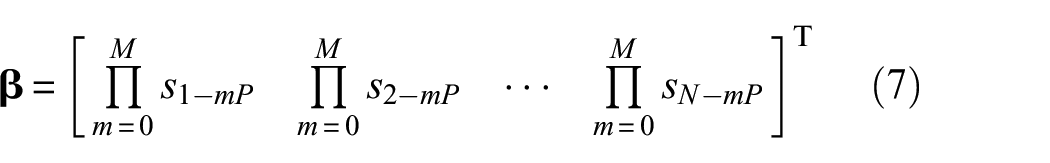
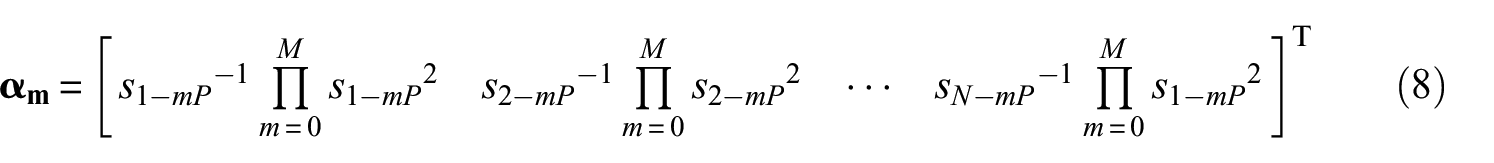
Where, N represents the number of data points, Pd represents the deconvolution period, M represents the number of time-shift periods, and

To find the optimal filter, let the first derivative of CK to the filter be 0, and the following equation can be obtained:
The filter iterative update method shown in the following equation can be obtained, and the filter changes with the change of M.
Where the matrix forms of
Where [·]T represents the transpose of the matrix, and Pd can be calculated according to the following equation:

Where fs represents the sampling frequency of the signal, fgear,f represents the fault characteristic frequency (FCF) of the gear, gear = s, p, r. The FCF can be calculated according to literature.32,33
When the local fault of gear occurs in the PGB, the meshing impact caused by the meshing of the faulty teeth is different from the healthy meshing impact. Therefore, if Pd is clear, the MCKD can effectively extract the fault characteristics. So, MCKD is widely used in the characteristic extraction of gear local faults. When the DTSW fault occurs in the PGB, all the teeth of the fault gear will have the same impact when they are meshing, and the impact phenomenon is not obvious. At this moment, the FCE results of MCKD is poor.
Multi-channel optimal maximum correlation kurtosis deconvolution
It can be found from Section ‘The proposed early fault diagnosis method for PGB’ that the traditional MCKD considers the filter with the largest CK as the best filter. The algorithm restores the signal by finding the optimal filter. For different signals, the determined optimal filter is different. It is found from the actual application effect of MCKD that the shorter the signal length is, the greater CK is. This conclusion will be proved in the experimental verification parts. Therefore, if the filter restored by the short signal is used to filter the long signal, the fault characteristic can be extracted better. The actual vibration signal of the PGB has strong non-stationarity, random, and modulation characteristics. Random interception of short signals will improve the contingency of filter restoration and affect the final FCE effect. In order to effectively extract the characteristics of DTSW fault in PGB, we propose MCO_MCKD based on the traditional MCKD.
In order to restore the optimal filter, MCO_MCKD firstly uses the sliding window principle commonly used in the field of data transmission34,35 to segment the input signal. At the same time, the filter optimization iteration calculation is carried out for the segmented signal, so as to establish multiple filter optimization channels. Finally, the inverse filter with the best filtering effect is selected to extract the fault characteristics of the original signal.
Signal segmentation based on sliding window principle
A schematic diagram of the sliding window principle is shown in Figure 1. In the figure, the window size is set as a, the single sliding distance of the window is set as b, and the signal in the window is the signal segment obtained after segmentation. When the last remaining signal length is less than b, the segmentation is stopped. Assuming that the total sliding times is J, J + 1 signals are finally obtained, and j represents the current sliding times.
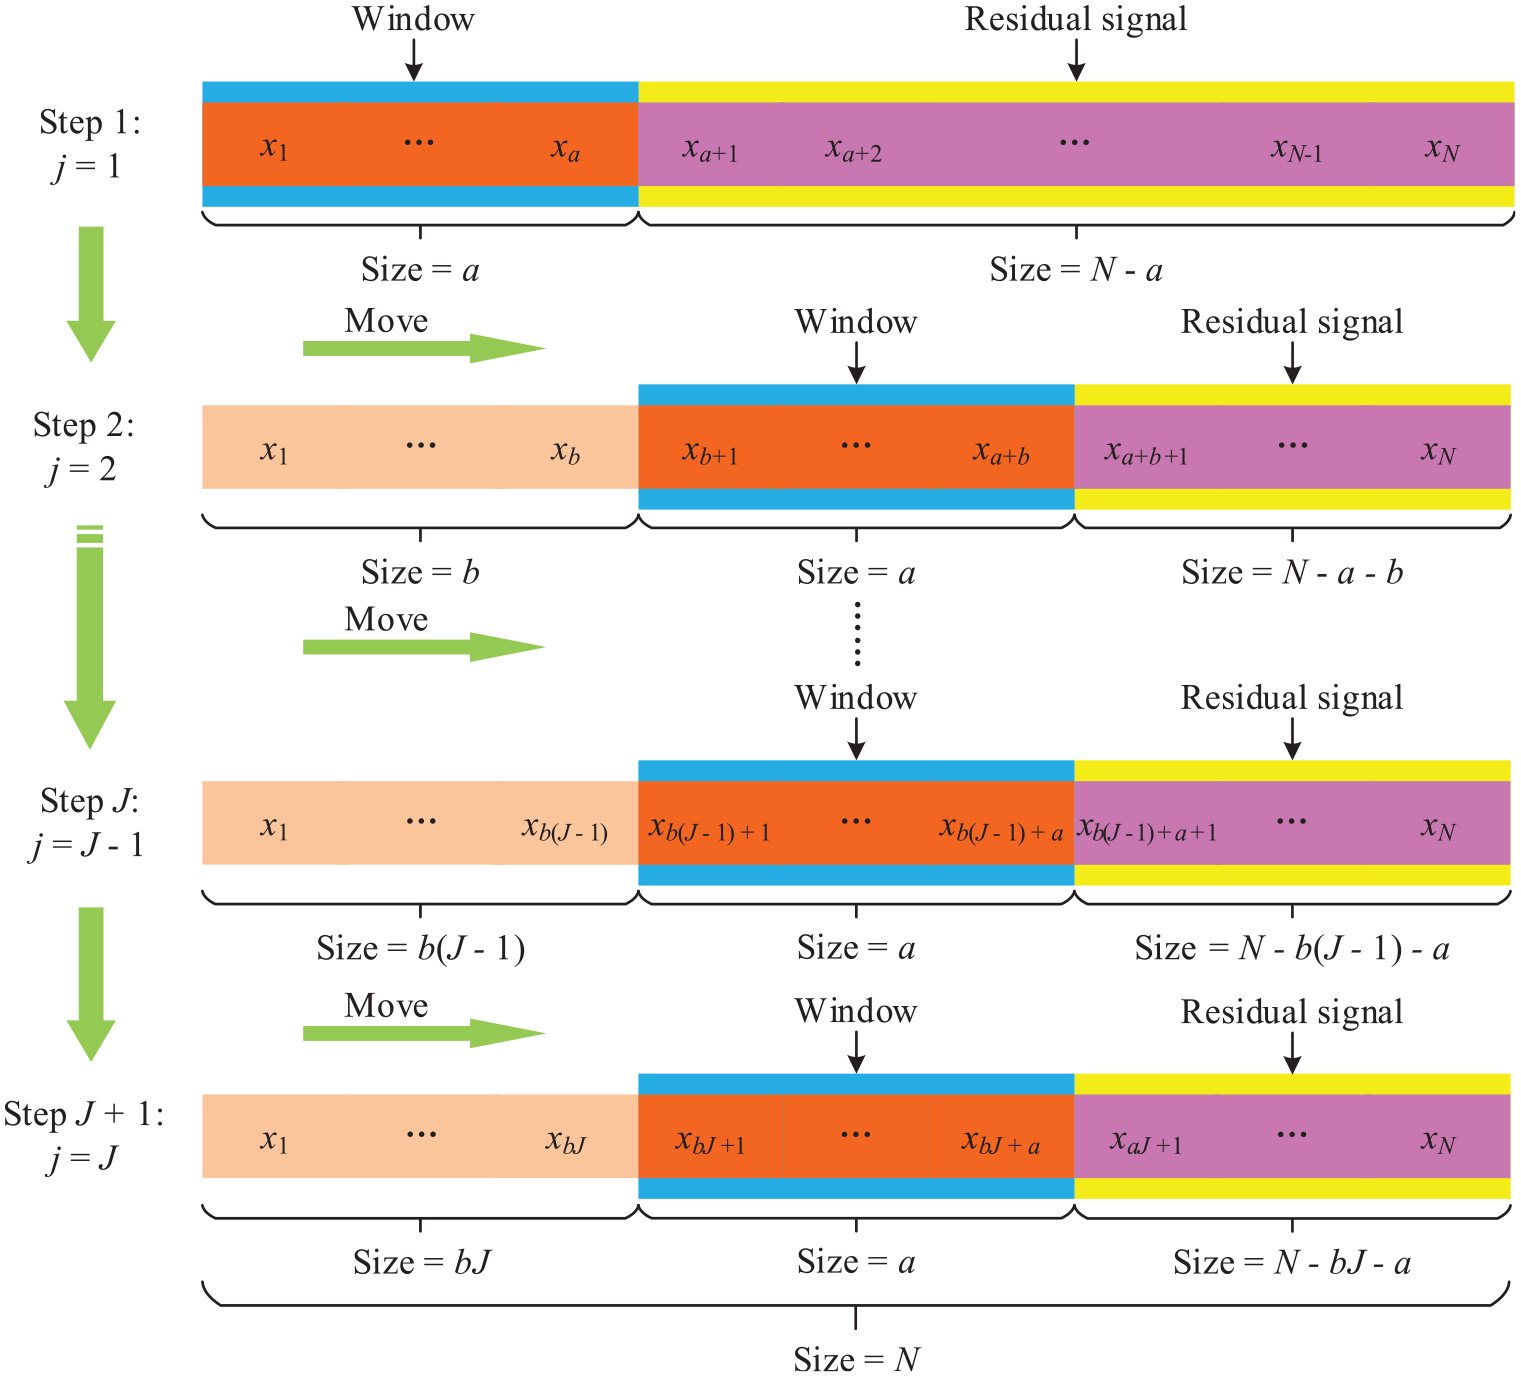
Schematic diagram of sliding window principle.
In order to fully extract the fault impulse, the value of a should not be lower than the number of sampling points PT generated when the fault gear completes a periodic change, that is, it needs to ensure that a ≥ PT. At the same time, in order to increase the choice space, a ≥ b is required in this paper.
In the process of signal segmentation, it is necessary to ensure that the distance of each window movement is the same, and that the first data point of the input signal is the starting point of the window in Step 1. The process of signal segmentation is shown in Figure 2, and the specific steps are as follows:
Step 1: Locate the starting point of the sliding window and let j = 1;
Step 2: Use the sliding window to segment the signal to obtain the j-th signal xd,j;
Step 3: Calculate the length of the j-th residual signal RLx,j;
Step 4: Judge whether RLx,j ≥ b is true. If it is true, slide the window by the distance b, let j = j + 1, return to the Step 2, and continue to segment the signal; if it is not true, go to Step 5;
Step 5: Output the signal after segmentation
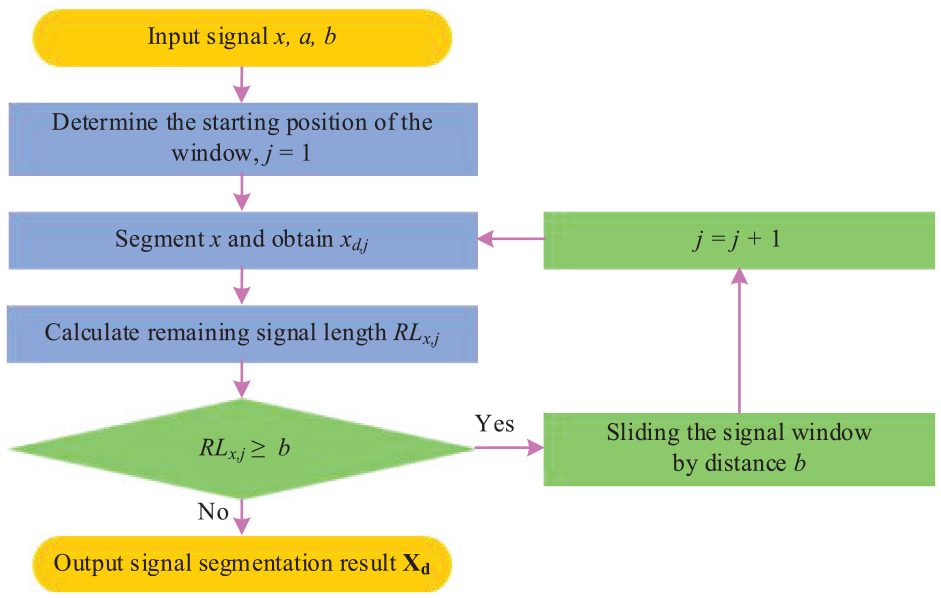
Flow chart of signal segmentation.
The original input signal can be segmented into several short signals after the above-mentioned segmentation steps. The short signal with length less than a after segmentation is called residual signal. The residual signal length is smaller than other signals. The shorter the signal length is, the easier it is to lose the frequency. The frequency-domain information is incomplete and distorted, so the residual signal will be discarded.
Multi-channel optimal maximum correlation kurtosis deconvolution
After the signal segmentation is completed, the multiple channels of filter optimization are also established. After multi-channel optimization, the FIR filter with the largest CK is selected. Then the original input signal is filtered to realize FCE. The algorithm to realize this process is called MCO_MCKD proposed in this paper. The specific process is shown in Figure 3, and the specific steps are described as follows:
Step 1: Input signal x, filter length L, iteration times I and M, calculate Pd according to Equation (9);
Step 2: The signals are segmented according to the sliding window principle to obtain j + 1 signals xd,1, xd,2, ⋯, xd, J , xd,J + 1 with the same length;
Step 3: Iteratively calculate the filter coefficients and CK of j + 1 signals respectively;
Step 4: Select the filter corresponding to the maximum CK (max_CK) in all channels as the final filter, and use it to filter x;
Step 5: Obtain the filtered signal and restore the original length of the signal.
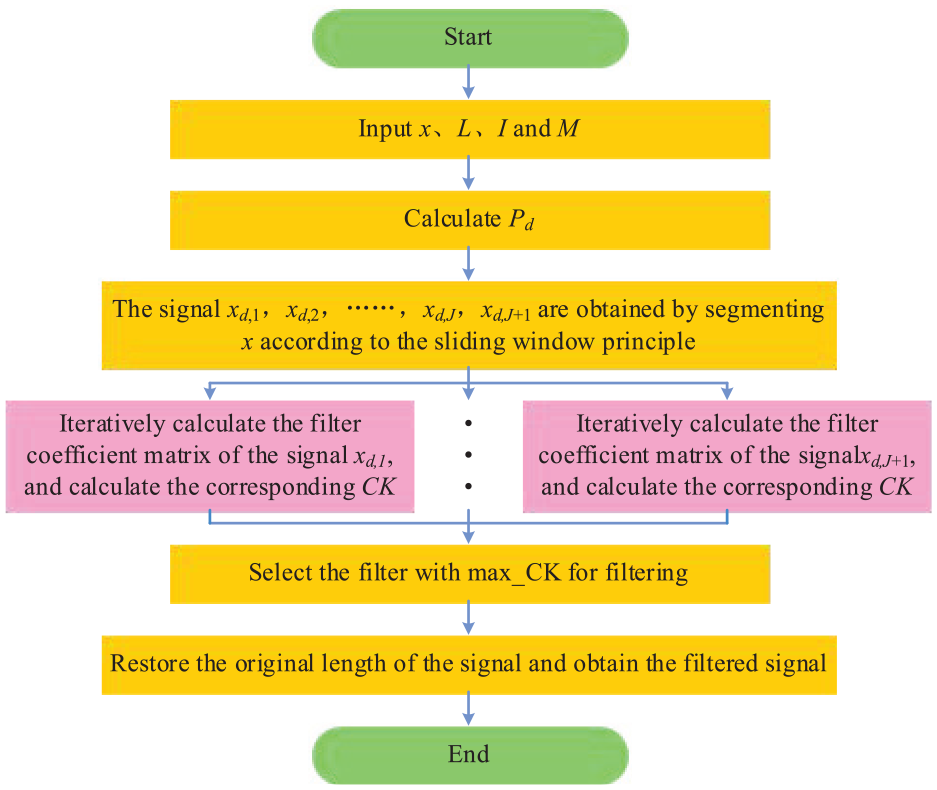
The calculation process of multi-channel optimal maximum correlation kurtosis deconvolution.
MCKD used in this paper is the same as the Ref. 7. The iterative process of CK is shown in Figure 4. The specific steps are described as follows:
Step 1: Resample the input signal, calculate the matrix
Step 2: Calculate the output signal y, matrices
Step 3: Update the filter coefficients and calculate CK at this moment;
Step 4: Judge whether i meets the requirements. If it is true, directly output the filter coefficient matrix and CK; If not, update the filter coefficient according to Equation (5), make i = i + 1, and return to Step 2 to continue calculation until the set value of I is met.
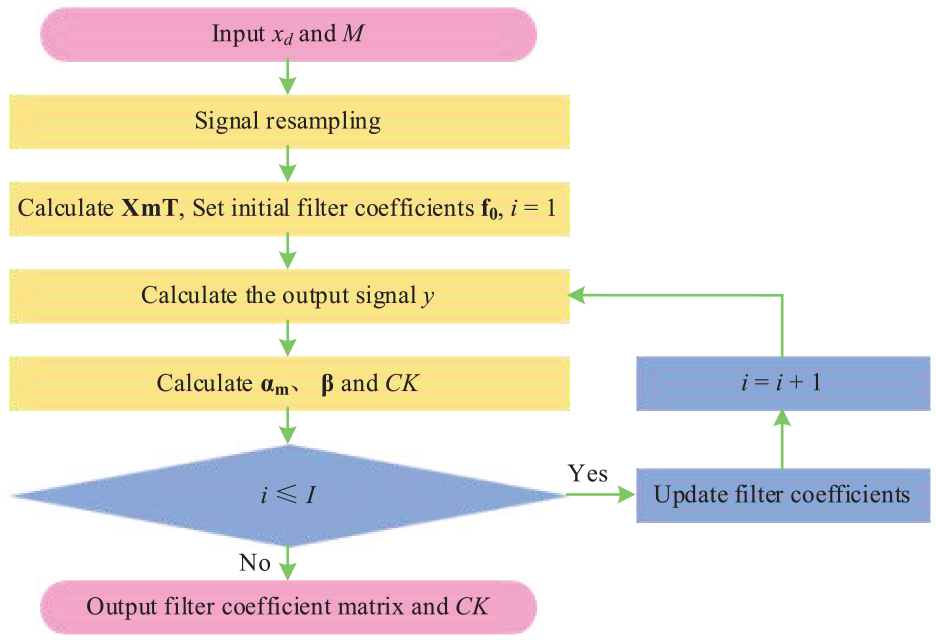
Iterative process of correlation kurtosis.
Frequency domain statistical indicators
Statistical methods are simple and intuitive, and are widely used in the field of fault diagnosis. The realization of early fault diagnosis needs to ensure that the statistical indicators are sensitive to the occurrence of faults. The frequency distribution of the original vibration signal is usually disordered, and the FCF is easy to be submerged in the noise. After FCE, the noise level is reduced and the FCF can be displayed significantly. In practical application, the time-domain signal usually only changes in amplitude, so it is highly accidental to be directly used in early fault diagnosis. The FCF in the frequency-domain is an important information for fault diagnosis, and the spectrum is an important basis for fault diagnosis.
According to the Ref. 28, for the DTSW fault, the impact phenomenon in the vibration signal is not obvious. For gears with tooth surface wear, the MF and its harmonic amplitude will increase significantly during operation. At the same time, it can be found that there is usually serious amplitude modulation (AM) and frequency modulation (FM) in the PGB.
Therefore, in order to make full use of the fault characteristic spectral lines in the envelope spectrum of the FCE results, we define frequency-domain statistical indicators which is the FCER in this paper. After FCE, the indicator can quantify the FCE results, thereby indicating whether the fault occurs. The fault characteristics frequency described in this paper include the MF, the FCF, and its harmonics, and the MF sidebands distributed at intervals of the FCF. The equation of FCER is as follows:
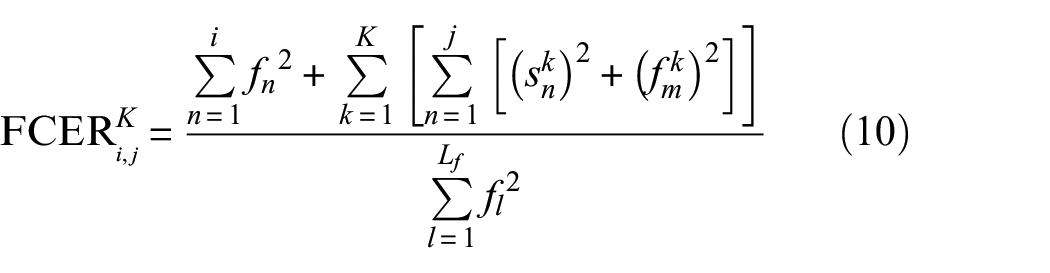
Where
The fault diagnosis method
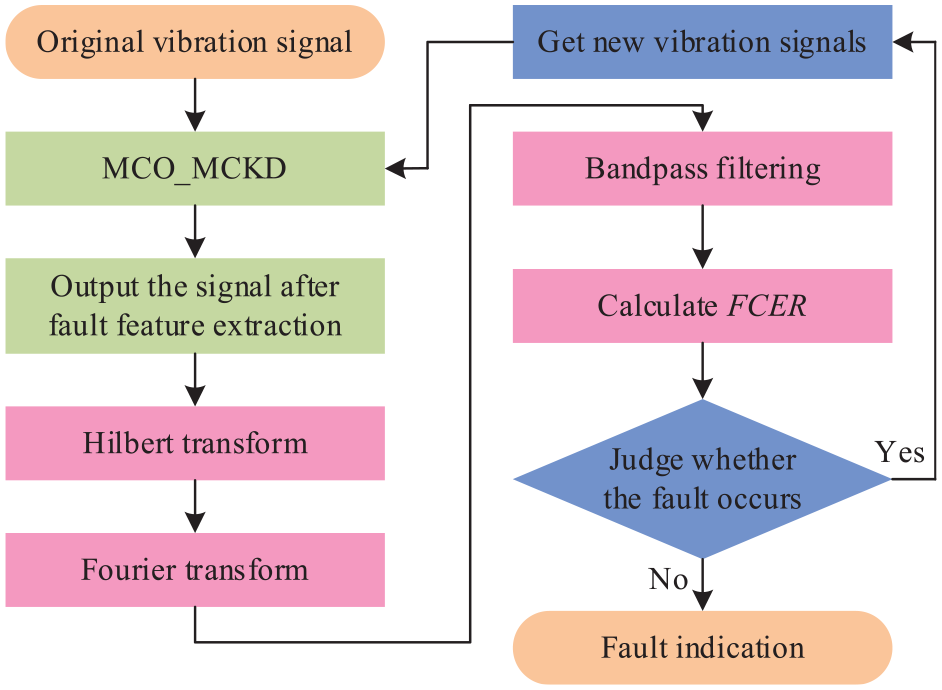
The DTSW fault in the early stage usually does not need to stop, and only needs to make a fault warning. MCO_MCKD can be used to extract the fault characteristic of DTSW in PGB under strong noise background. FCER can be used for early warning of DTSW fault. Figure 5 shows the process of early fault diagnosis method of DTSW in PGB based on MCO_MCKD and FCER. The details are as follows:
Step 1: Input the original vibration signal to MCO_MCKD to obtain the signal after FCE;
Step 2: The FCF attached to the MF sideband is demodulated by Hilbert transform;
Step 3: Fourier transform is used to transform the envelope demodulated signal into frequency-domain signal;
Step 4: The band-pass filtering method is used to filter the frequency-domain signal to obtain the required frequency part;
Step 5: Calculate FCER of the band-pass filtered signal;
Step 6: Determine whether an early fault has occurred. If it occurs, an early fault warning will be sent. If not, the vibration signal will be obtained again, and Steps 1–5 will continue to be repeated, so as to realize the early fault diagnosis of DTSW in PGB.
Specific process of proposing diagnosis method.
Robustness verification of MCO-MCKD
The simulation analysis can provide support and reference for the practical application of the algorithm. In this section, the robustness of MCO_MCKD algorithm will be verified using simulation signals.
Simulated vibration signals
The effects of FM and AM are considered. At the same time, the planet gear passing effect and the transmission attenuation of the vibration signal are also considered. In combination with literature,27,32,33 the synthetic vibration signal x(t) of the PGB can be expressed as follows:

Where the subscripts sp and rp represent respectively external meshing and internal meshing, ξ represents the transmission path attenuation coefficient, w(t) and n(t) represent respectively the planet gear passing effect function and noise, let P represents the power of noise in dBw. The noise signal generation method is the same as that in reference. 27
w(t) is calculated as follows 36 :

In Equation (11), ksp(t) and krp(t) respectively represent the vibration signals of external meshing and internal meshing, and the specific equations are as follows:
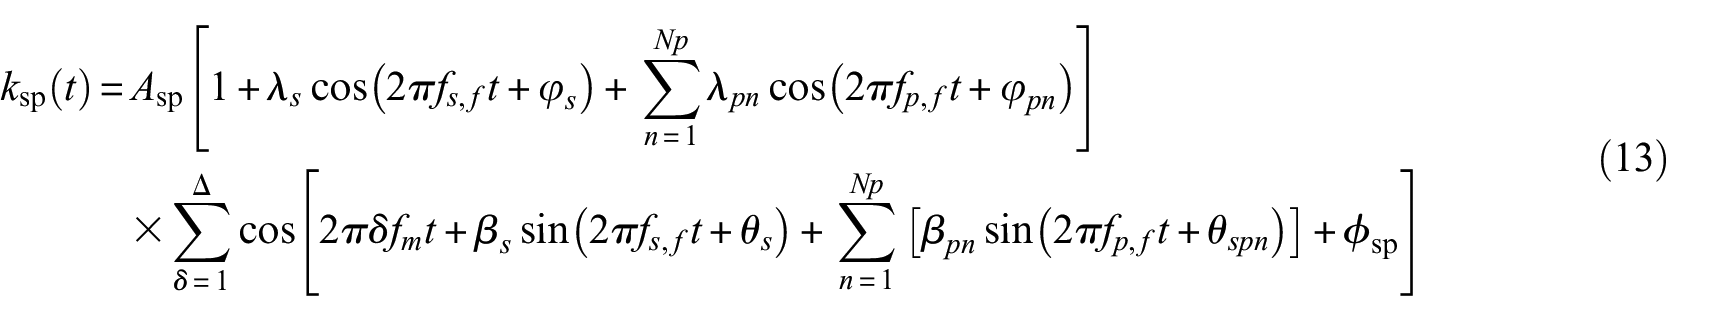
Where the subscripts spn and rpn represent respectively the n-th external meshing and internal meshing, the subscripts s, pn and r represent respectively the sun gear, the n-th planet gear, and the ring gear, Np represents the number of planet gears, and fc represents the rotating frequency of the planet carrier, θ, ϕ, and ϕ all represent the initial phase, λ and β represent respectively the AM index and FM index, δ represents the harmonics order, and A represents the amplitude.
The vibration signal generated by the external meshing is transmitted to the sensor through a longer path than the internal meshing, so the setting of ξ in this paper needs to meet the following conditions 27 :

According to the above analysis, the simulated vibration signal of the PGB with DTSW fault can be obtained. The proposed method is verified by taking the data of the planet gear with DTSW fault.
The PGB studied in this paper contains three planet gears, and it is assumed that all the planet gears have DTSW fault. If considering that the three planet gears have different degrees of distributed faults, Ft and wd are used to represent respectively the wear type and degree, and the DTSW fault of the planet gears can be divided into the following four types:
Ft = 1: The wd of the three planet gears are different from each other;
Ft = 2: The wd of one planet gear is greater than that of the other two planet gears, and the wd of the other two planet gears is the same;
Ft = 3: The wd of the two planet gears is the same and greater than that of the other one;
Ft = 4: The wd of the three planet gears is the same.
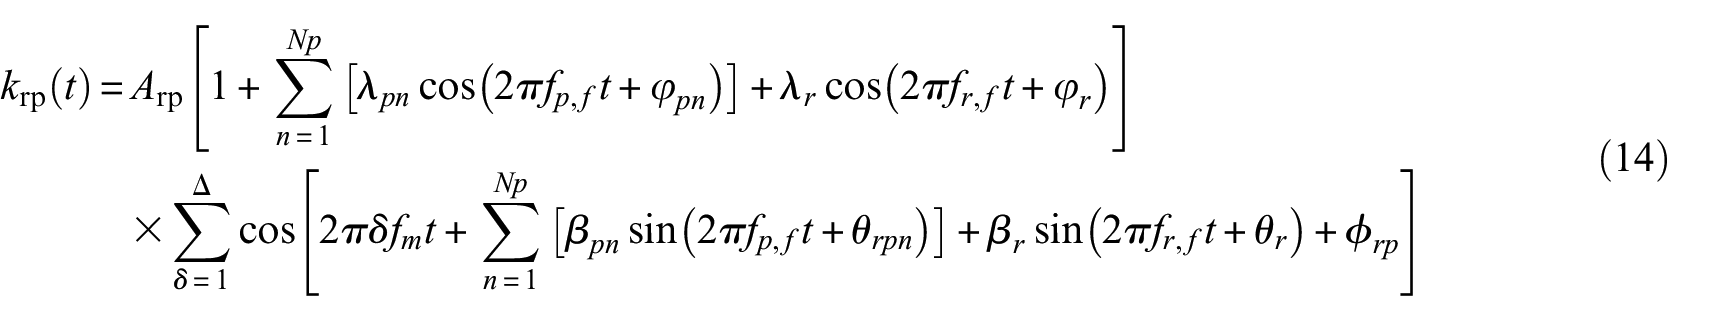
The difference of wd is directly reflected in the difference of fault pulse amplitude. By setting λpn in each pair of meshing to different values, the simulated vibration signals of the planet gears with different Ft and wd can be obtained. The setting of wd at different Ft is shown in the Table 1.
The setting of λpn with different Ft and wd.
The sampling frequency is set to 10 kHz, and P = 14. The time-domain diagram of the simulated vibration signal of the PGB is shown in Figure 6. It includes the time-domain diagram and envelope spectrum of each component of signal in the process of synthesizing the signal. The specific parameter settings of the simulated signal are shown in Table 2.
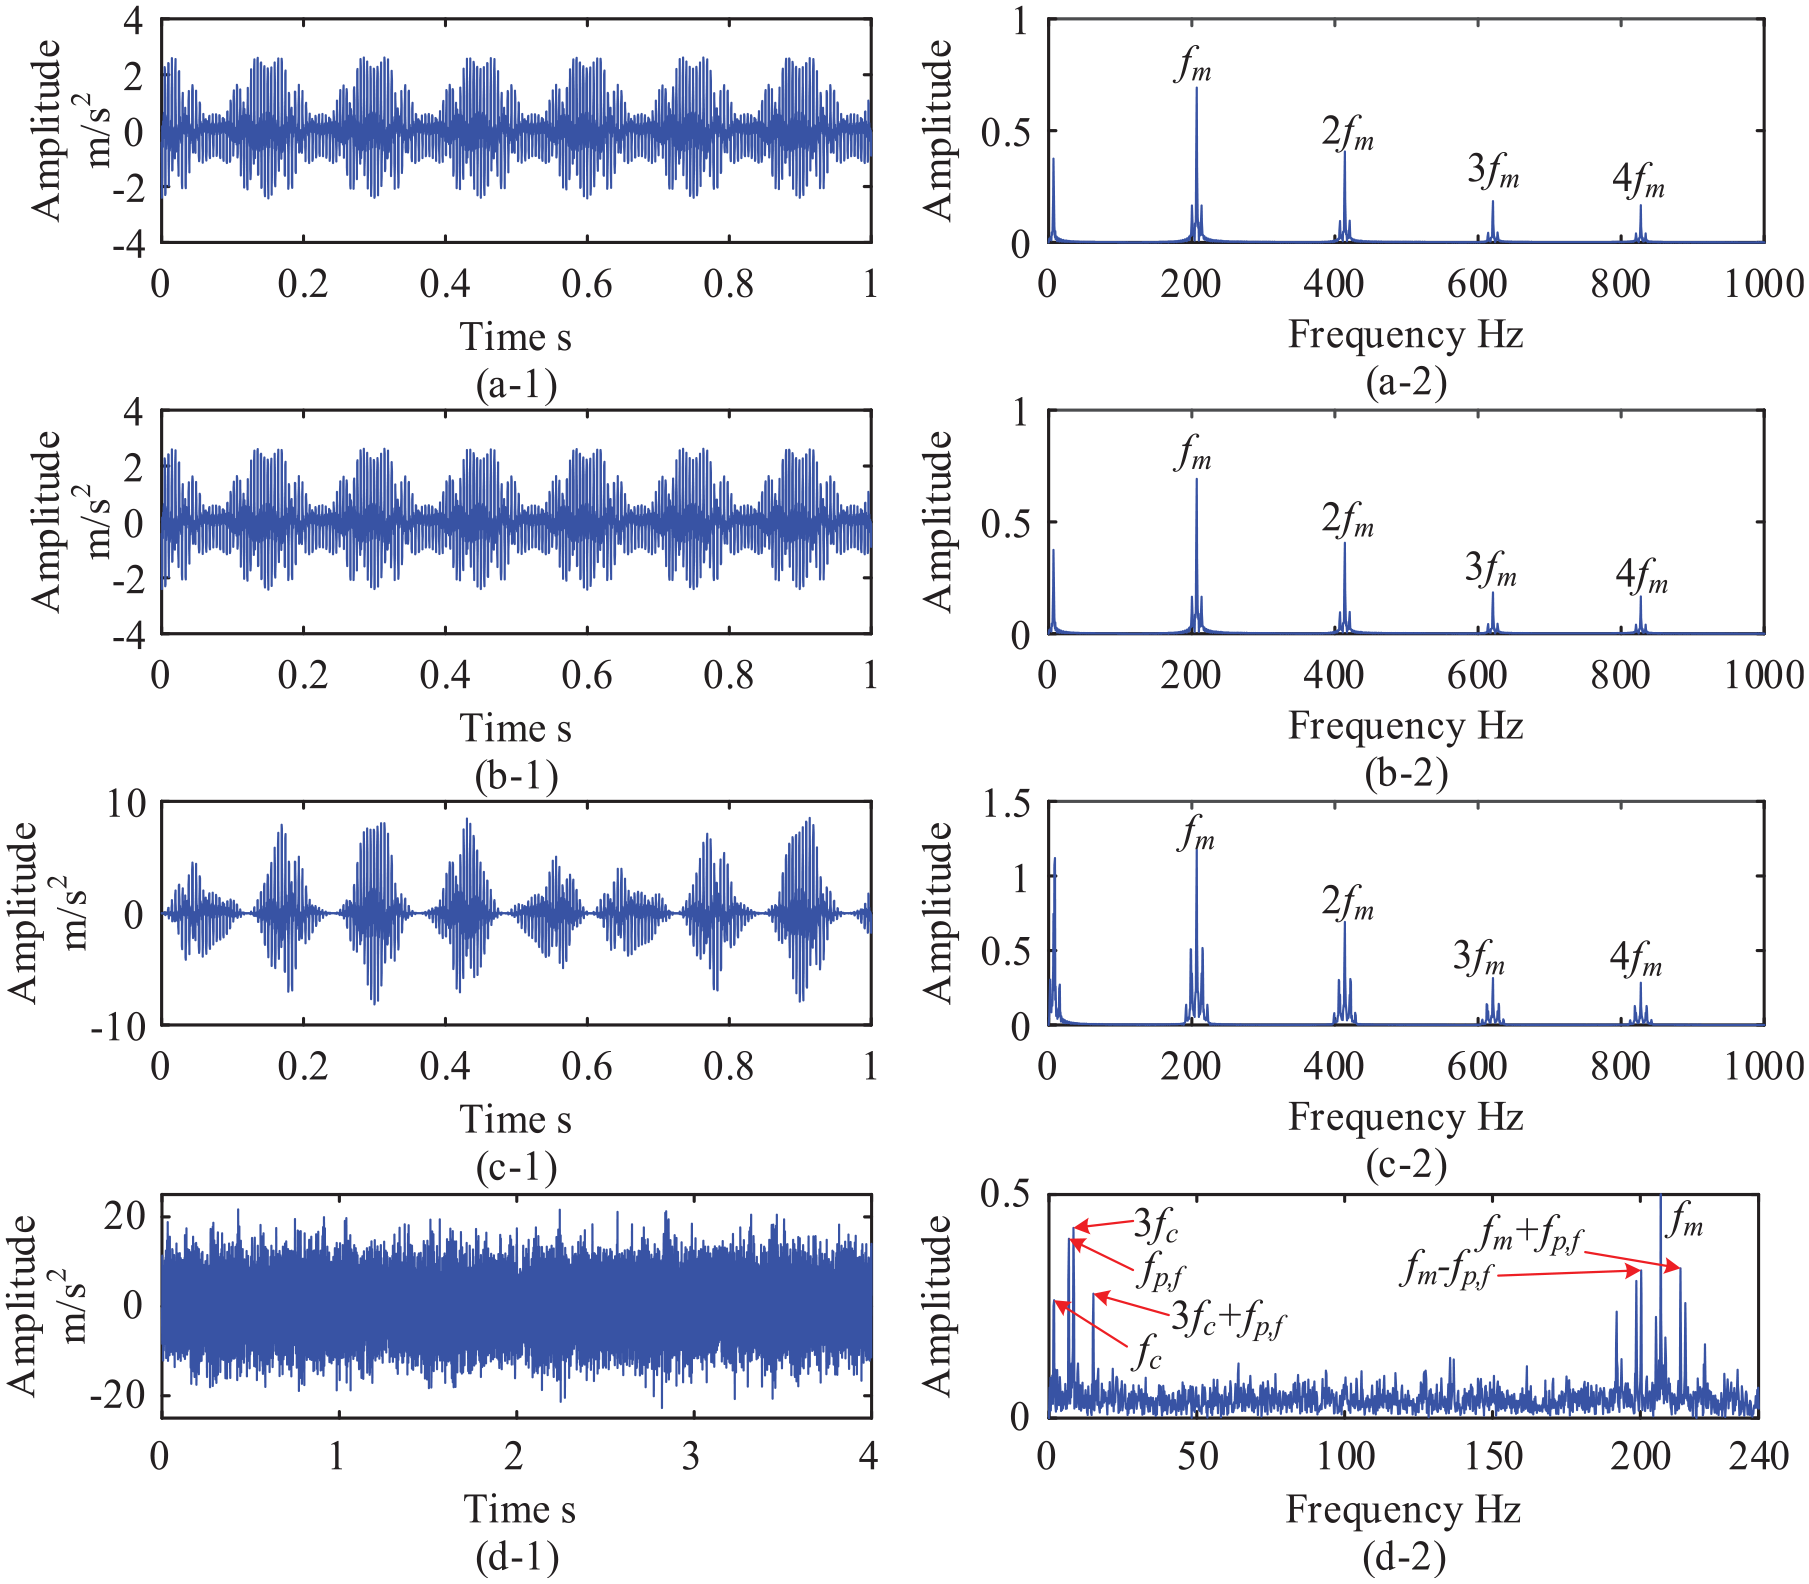
Time-domain diagram and envelope spectrum of simulated signal. (a-1) and (b-1) Are the respective time-domain diagrams of the simulated signals of external meshing and internal meshing; (c-1) is the time-domain diagram of the noise-free synthetic simulated signal; (d-1) are the respective time-domain diagrams of the synthetic simulated signals; (a-2), (b-2), (c-2), and (d-2) are the respective envelope spectrums corresponding to the left time-domain diagram.
Parameter setting of the Equations (13) and (14).
When the input rotating speed of the sun gear is 1200 rpm, the rotating speed of the planet carrier is 2.76 r/s. For a PGB with three planet gears, when the position of the sensor remains unchanged, about 8.28 planet gears pass directly under the sensor every second. Thereby, the planet gear passing effect is formed. From Figure 6(a-1), (b-1), and (c-1), it can be found that within 1 s, there are about eight planet gear passing effects. fp,f are clearly visible. The fm and its sideband of the PGB are also clearly visible.
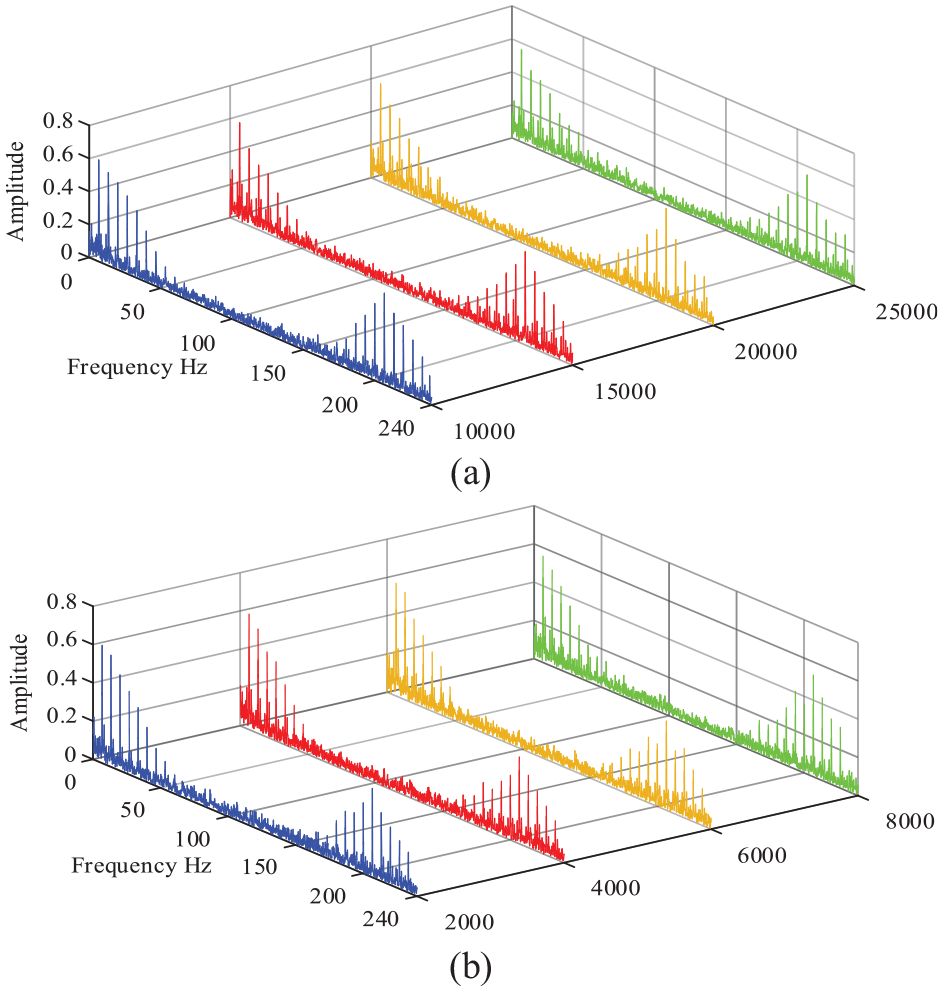
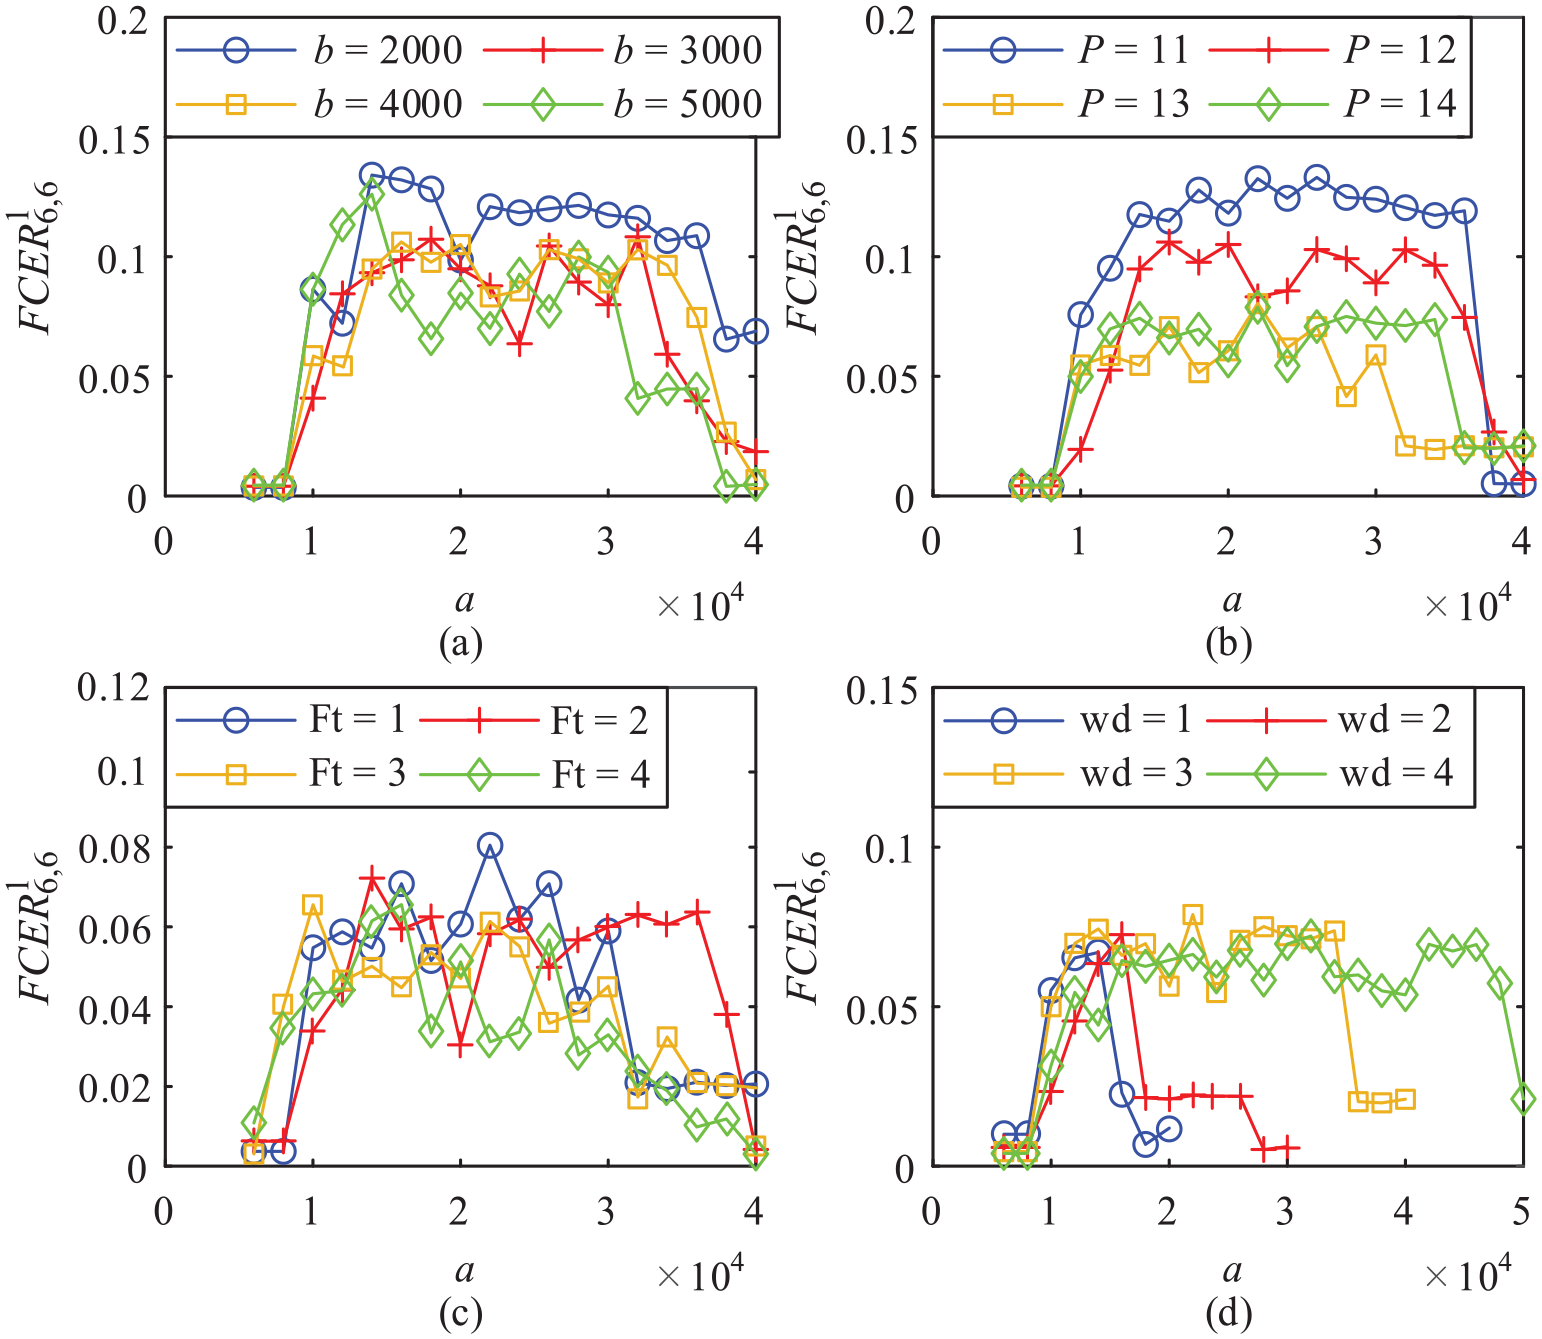
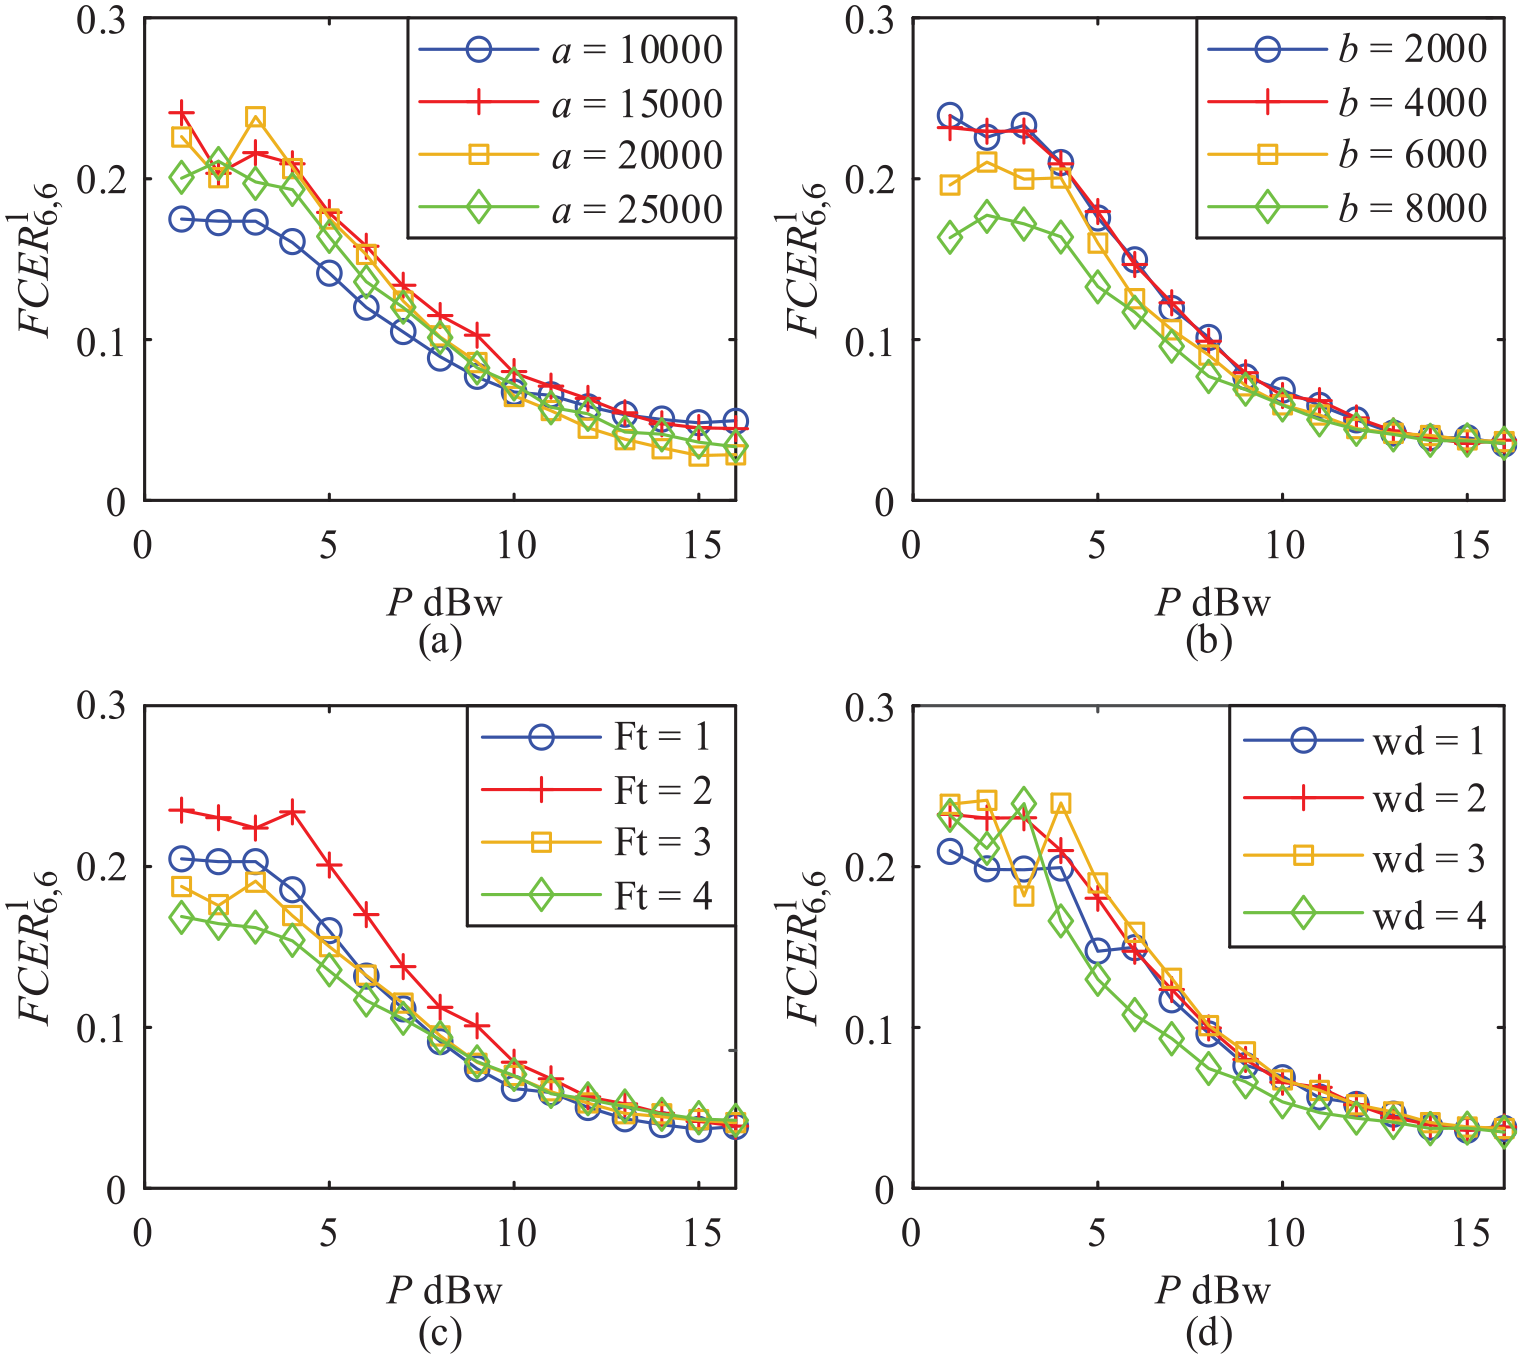
The effect of parameters a and b on MCO-MCKD
Compared with the traditional MCKD, MCO_MCKD using the sliding window principle for signal segmentation introduces two new parameters window size a and sliding distance b. Due to space limitations, this section mainly shows the research results when Ft = 4 and wd = 1. Figure 7(a) and (b) are the envelope spectrum of the FCE results when different a and b are taken, respectively. The values of a and b are shown as the abscissas in Figure 7(a) and (b) respectively, P = 14, the simulated signal duration is 4 s, and other parameter settings are shown in Table 2.
Fault characteristic extraction results with different window size and single sliding distance of the window. (a) Different window size and (b) different sliding distance.
It can be found from Figure 7 that when a and b take different values, MCO_MCKD has the better FCE results, and the FCF and its harmonics, MF and its sidebands can be clearly found.
It can be found from Equation (10) that FCER indicator can essentially measure the amplitude proportion of FCF and its harmonics, MF and its sideband in the envelope spectrum. Therefore, to more intuitively express the FCE results of MCO_MCKD, we use FCER as a measure indicator of the FCE effect. In the robustness verification, let i, j = 6, and K = 1. Due to space limitations, Figure 7 only shows a part of the FCE results with different a and b. The frequency range for band-pass filtering is 0–300 Hz. In order to research the performance of MCO_MCKD more reasonably and comprehensively, we make Figures 8 and 9 respectively. Figures 8 and 9 show the changes of FCER when a and b change respectively. The ordinates of all pictures are
Fault characteristic energy ratio curve with the change of window size. (a) Different sliding distance, (b) different power of noise, (c) different wear type, and (d) different wear degree.
Fault characteristic energy ratio curve with the change of sliding distance. (a) Different window size, (b) different power of noise, (c) different wear type, and (d) different wear degree.
It can be found from Figure 7 that under different b, P, Ft, and wd, each FCER curve has the same trend with the change of a, and FCER changes in the order of increasing, maintaining stability, and decreasing. In Figure 7(a), FCER decreases slightly with the increase of b. Since the increase of b will reduce the number of signals obtained by segmentation, the selection range of the optimal filter is reduced. In Figure 7(b), FCER in the stable stage decreases with the increase of P. The stronger the noise is, the worse the FCE results are. At the same time, it can be found that when a is too small or too large relative to the signal length, the FCE results of MCO_MCKD decreases significantly. This shows that the selection of a cannot be too large or too small, and it should be selected within the range of 25%–75% of the input signal length. When a is too small, the signal segmented by the window is too short. Although max_CK increases significantly, this is mainly caused by the reduction in the number of spectral lines. When a is too large, the number of spectral lines increases significantly, but this will reduce the number of segmented signals, which will still lead to poor FCE results.
It can be seen from Figure 9 that the curve shows a slight downward trend with the increase of b. When the input signal length is fixed, the number of signals obtained by segmentation decreases with the increase of b, which leads to the number of channels of MCO_MCKD being reduced when the filter is optimized. As shown in Figure 9(a), when a is 20,000 and 25,000, and b reaches 10,000, FCER remains unchanged due to the limitation of the number of signal segmentation. This also proves that a should not be selected too large, and b has less influence on the FCE results. Each curve in Figures 8 and 9 fluctuates due to the influence of random gaussian white noise. However, due to the large value density, it does not affect the overall trend of the curve or the above conclusion.
The effect of input signal noise strength onMCO-MCKD
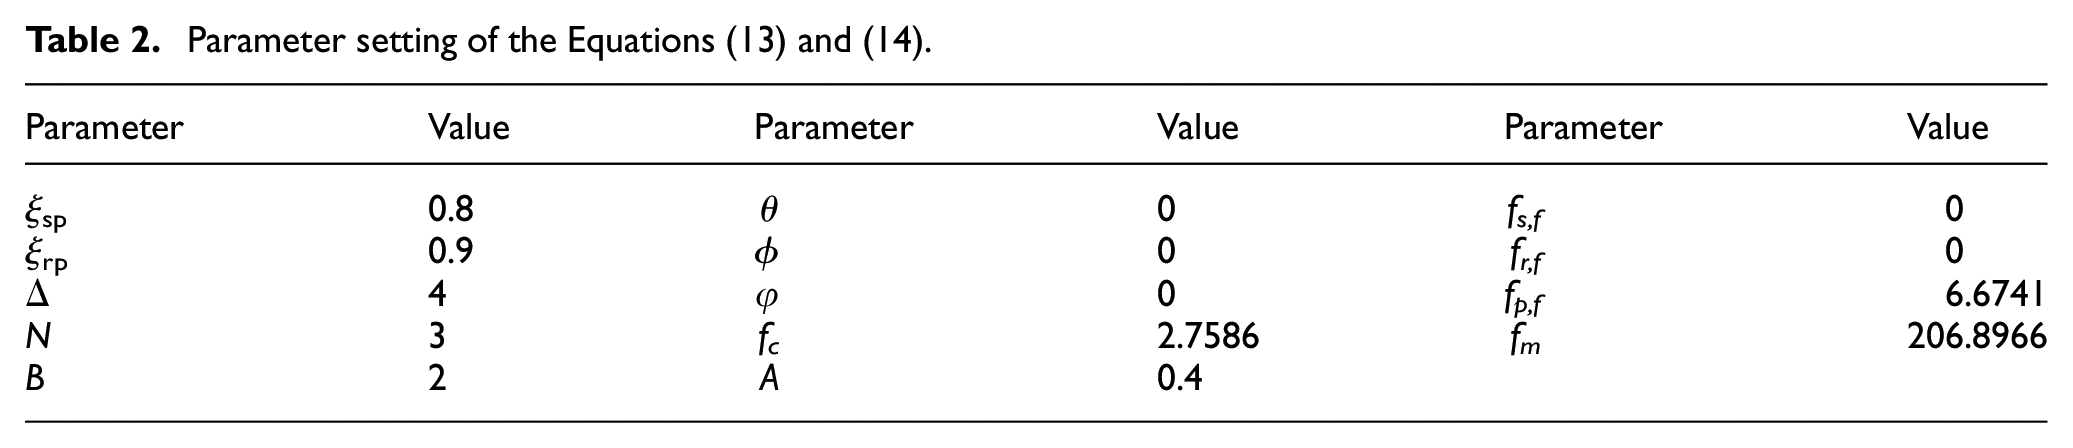
After researching the influence of the internal parameters on MCO_MCKD, it is also necessary to research the influence of the external parameter P on the performance of the algorithm, and we need to verify the FCE results of the algorithm with different P. Due to space limitations, only the envelope spectrum of FCE results in some cases are shown. Figure 10 shows the envelope spectrum of FCE results at different P. The specific setting of P is shown in Figure 10, the input signal duration is 4 s, and other parameter settings are shown in Table 2.
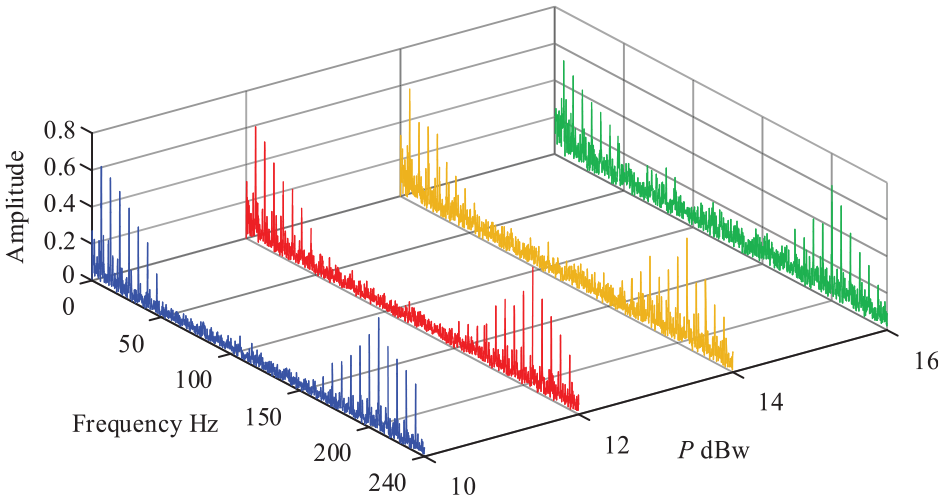
Comparison of characteristic extraction results with different power of noise.
It can be found from Figure 10 that MCO_MCKD still has the good FCE results with different P. However, it can be found that the amplitudes of fp,f and their harmonics, fm and their sideband decrease continuously with the increase of P, showing a downward trend. In order to accurately research the robustness of MCO_MCKD, Equation (10) is still used to calculate FCER under different parameter conditions. The parameter settings of FCER are the same as those in Figures 8 and 9. We get the change curve of the FCE results of MCO_MCKD with different P as shown in Figure 11.
Fault characteristic energy ratio curve with the change of power of noise. (a) Different sliding distance, (b) different window size, (c) different wear type, and (d) different wear degree.
It can be seen from Figure 11 that under different parameter conditions, the curve trend of FCER is the same with the increase of P. In the range of 1–4 dBw, FCER is in a state of steady fluctuation. With the continuous increase of P, the value of FCER continues to decrease, but the decreasing speed continues to decrease. P has a great influence on the FCE results. The larger P is, the worse the FCE results are, which is consistent with the practical application.
Experimental verification and discussion
PGB is a kind of important power transmission device. This part mainly uses the experimental vibration signal of the planet gear with DTSW fault in PGB to verify the proposed method.
Experiment and experimental signals
Experimental parameter settings
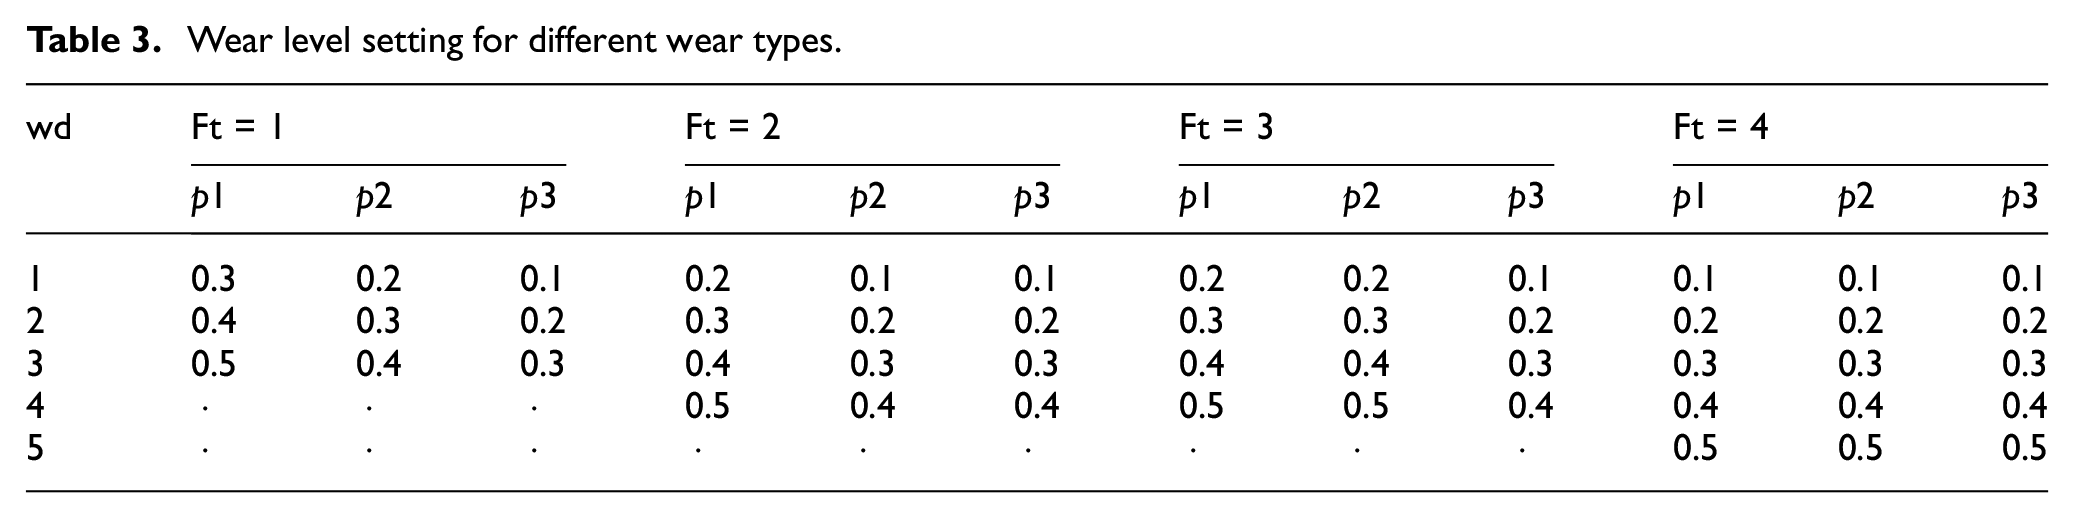
The experimental bench used for the experimental verification in this paper is shown in Figure 12. The left side is the motor and PGB of the driving part, the right side is the PGB and motor of the load part, and the fault gear is placed in the PGB of the driving part on the left. The structure diagram of the PGB is shown in Figure 13. The sun gear is input, the planet carrier is output, and the ring gear is fixed. The number of teeth of the sun gear, planet gear, and ring gear in the PGB is 12, 31, and 75 respectively, and the number of planet gears is 3. The sampling frequency of the signals is all set to 10 kHz. We use a gear grinder to grind all the teeth on a gear to the same thickness. The actual picture of the planet gear with DTSW fault is shown in Figure 14. In the process of signal acquisition, the speed is set to 1200 rpm and the load torque is set to 0 N/m. The wear thickness (mm) settings are shown in Table 3. Under this condition, the FCF and MF are the same as the simulated signal, which are 6.6741 and 206.8966 Hz respectively.
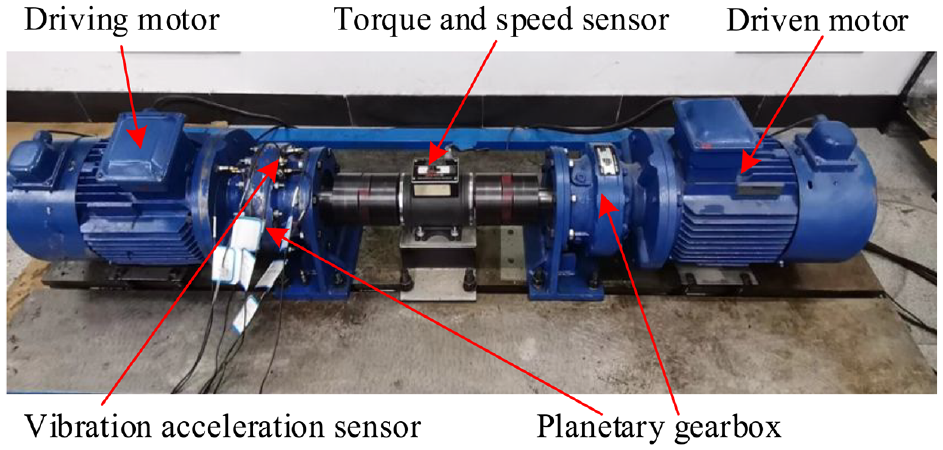
Fault diagnosis experimental bench for PGB.
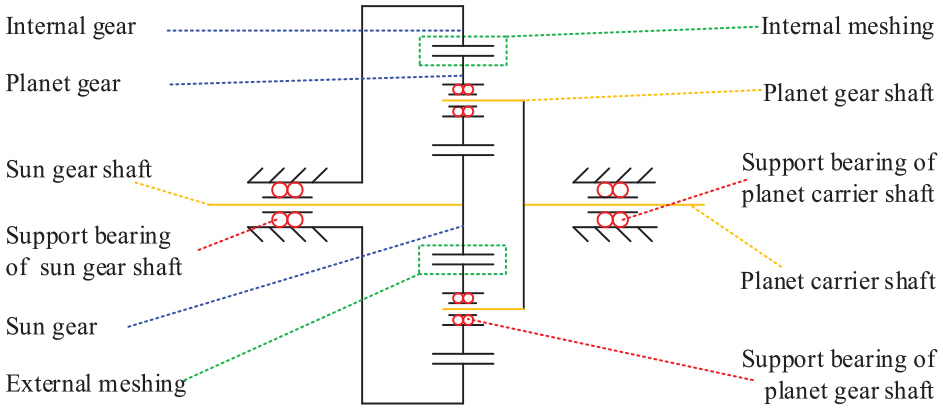
Structure diagram of planetary gearbox.
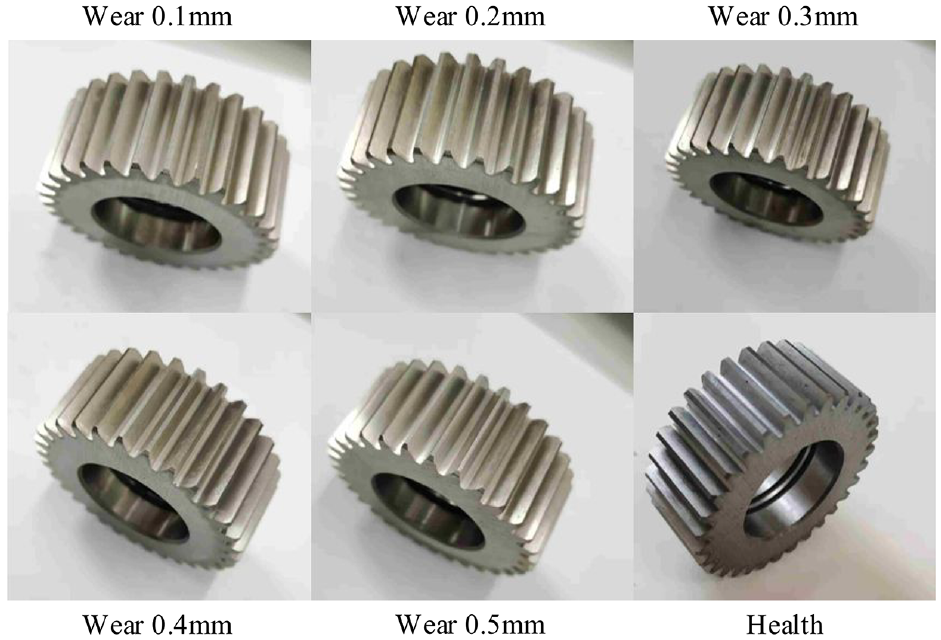
Planet gear with distributed tooth surface wear fault.
Wear level setting for different wear types.
The experimental signal
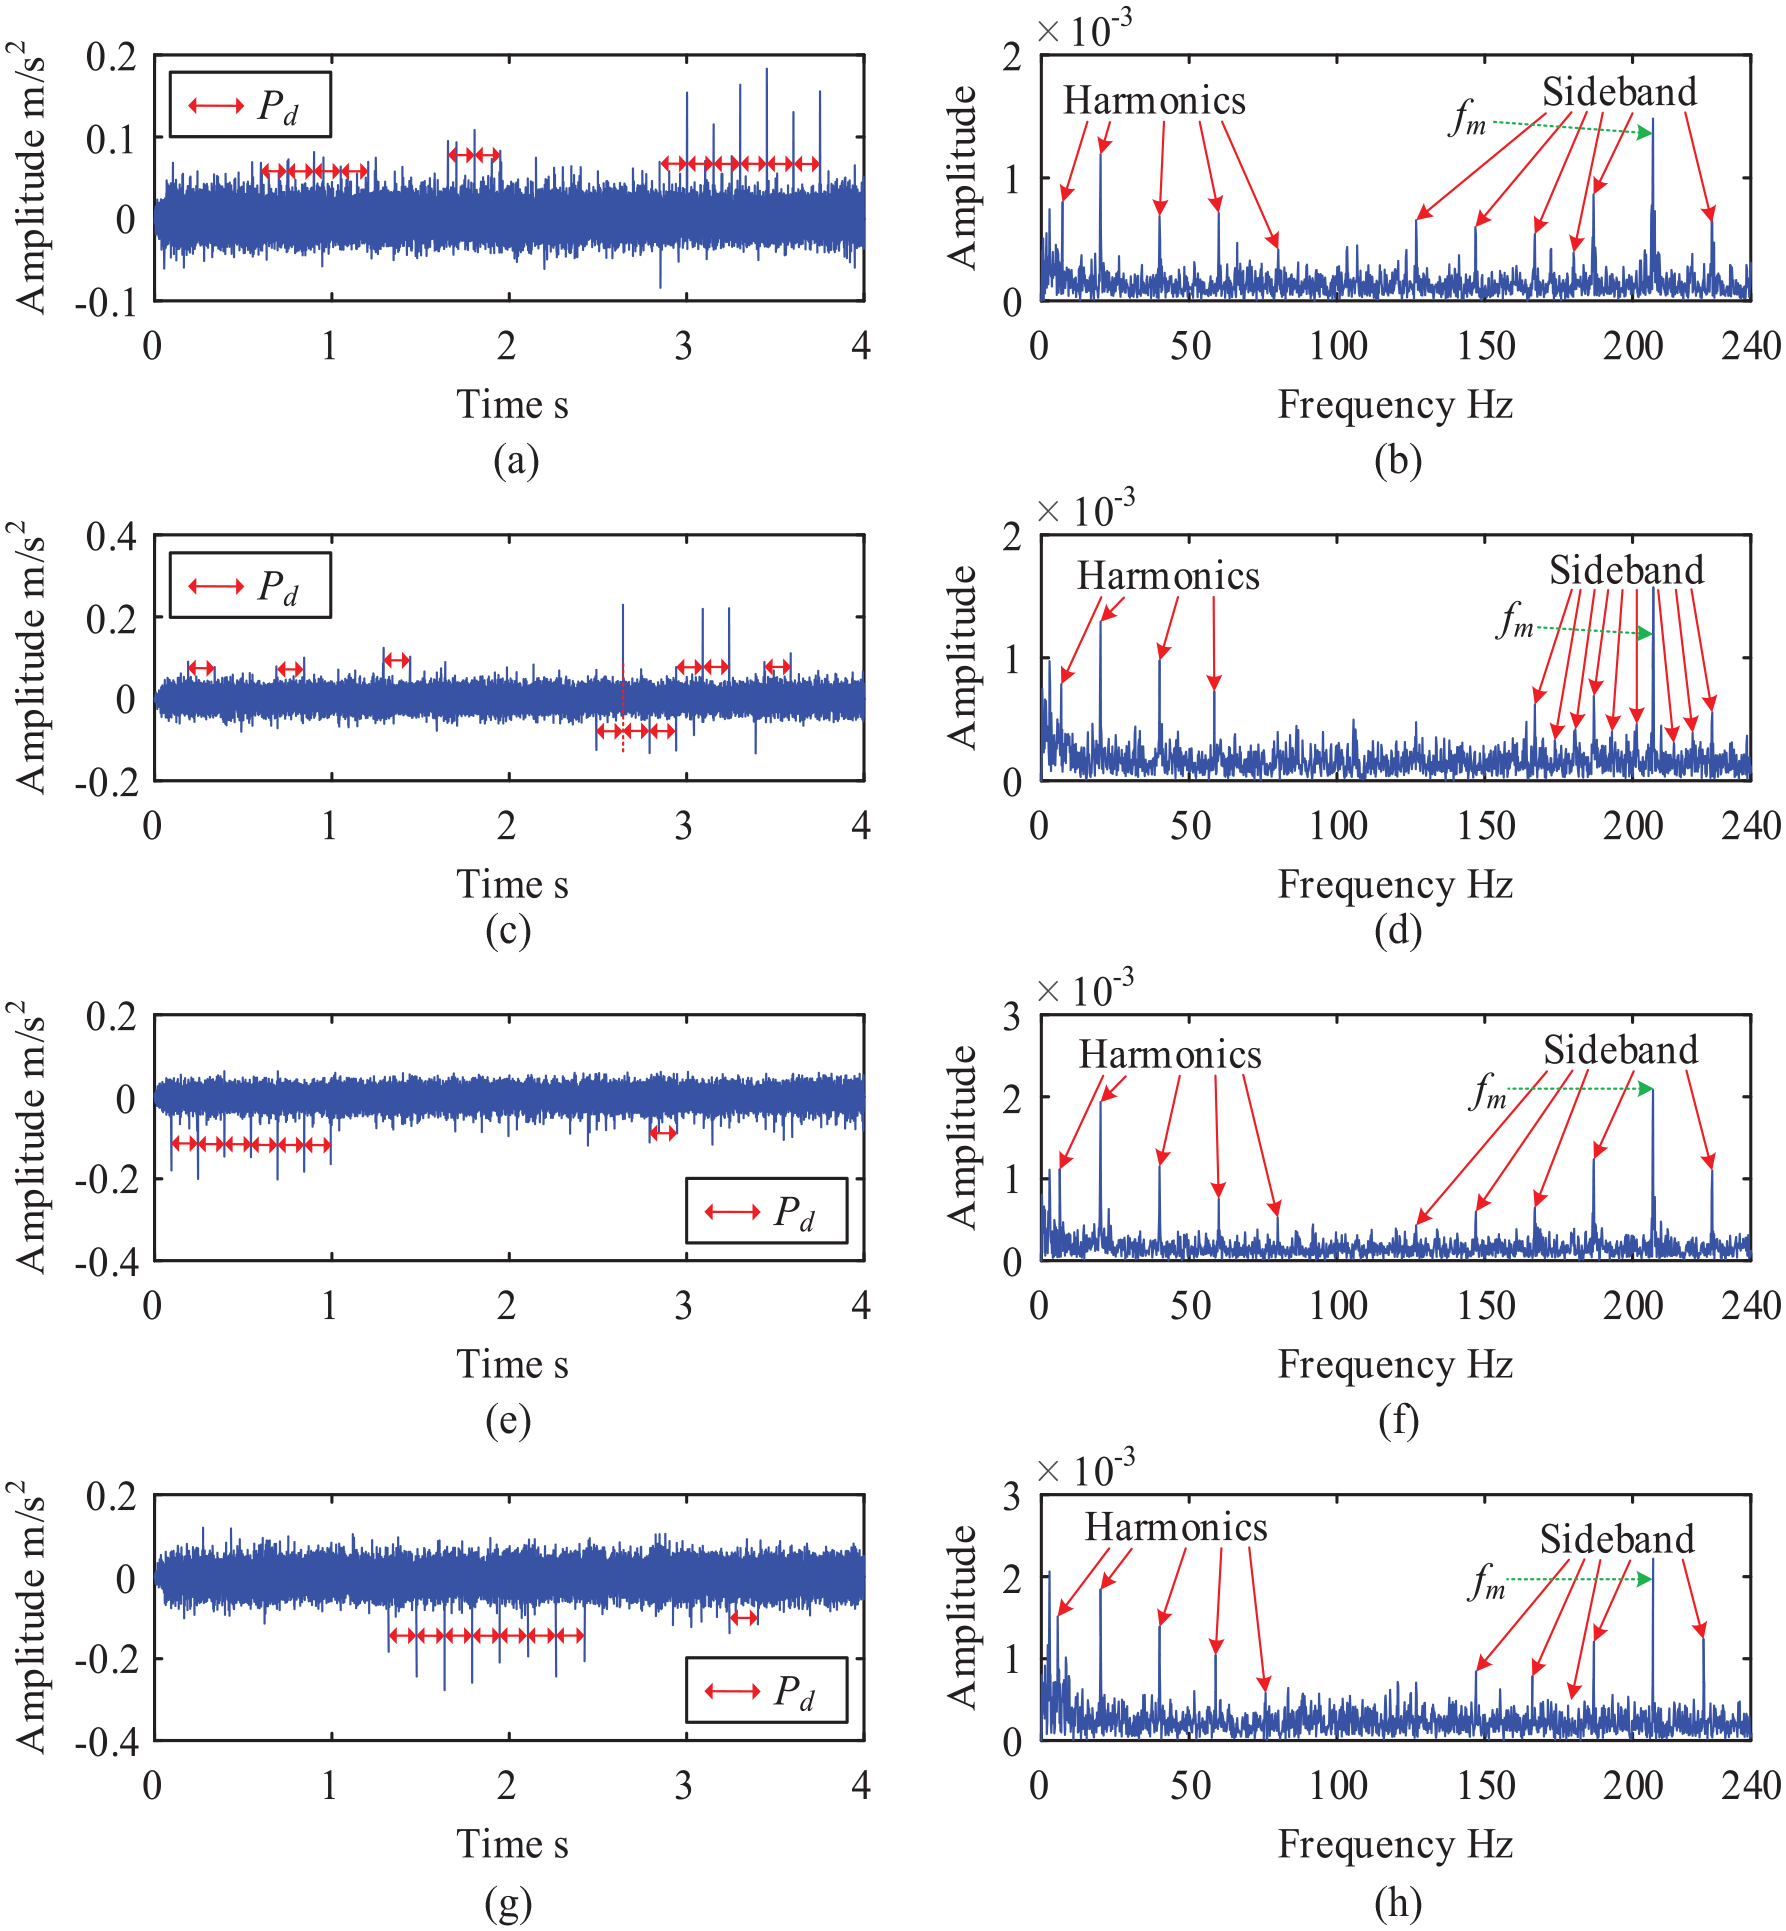
The vibration acceleration signal at different Ft and wd can be obtained by using the vibration acceleration sensor. As shown in Figure 12, the signals used in this paper are acquired using sensors on top of the PGB housing. When wd = 1, the time-domain diagram and envelope spectrum of the original vibration signal at different Ft are shown in Figure 15. When Ft = 4, the time-domain and envelope spectrum of the original vibration signal at different wd are shown in Figure 16. Due to space limitations, this section only shows a part of the signals shown in Figures 15 and 16. The signal length is 4 s.
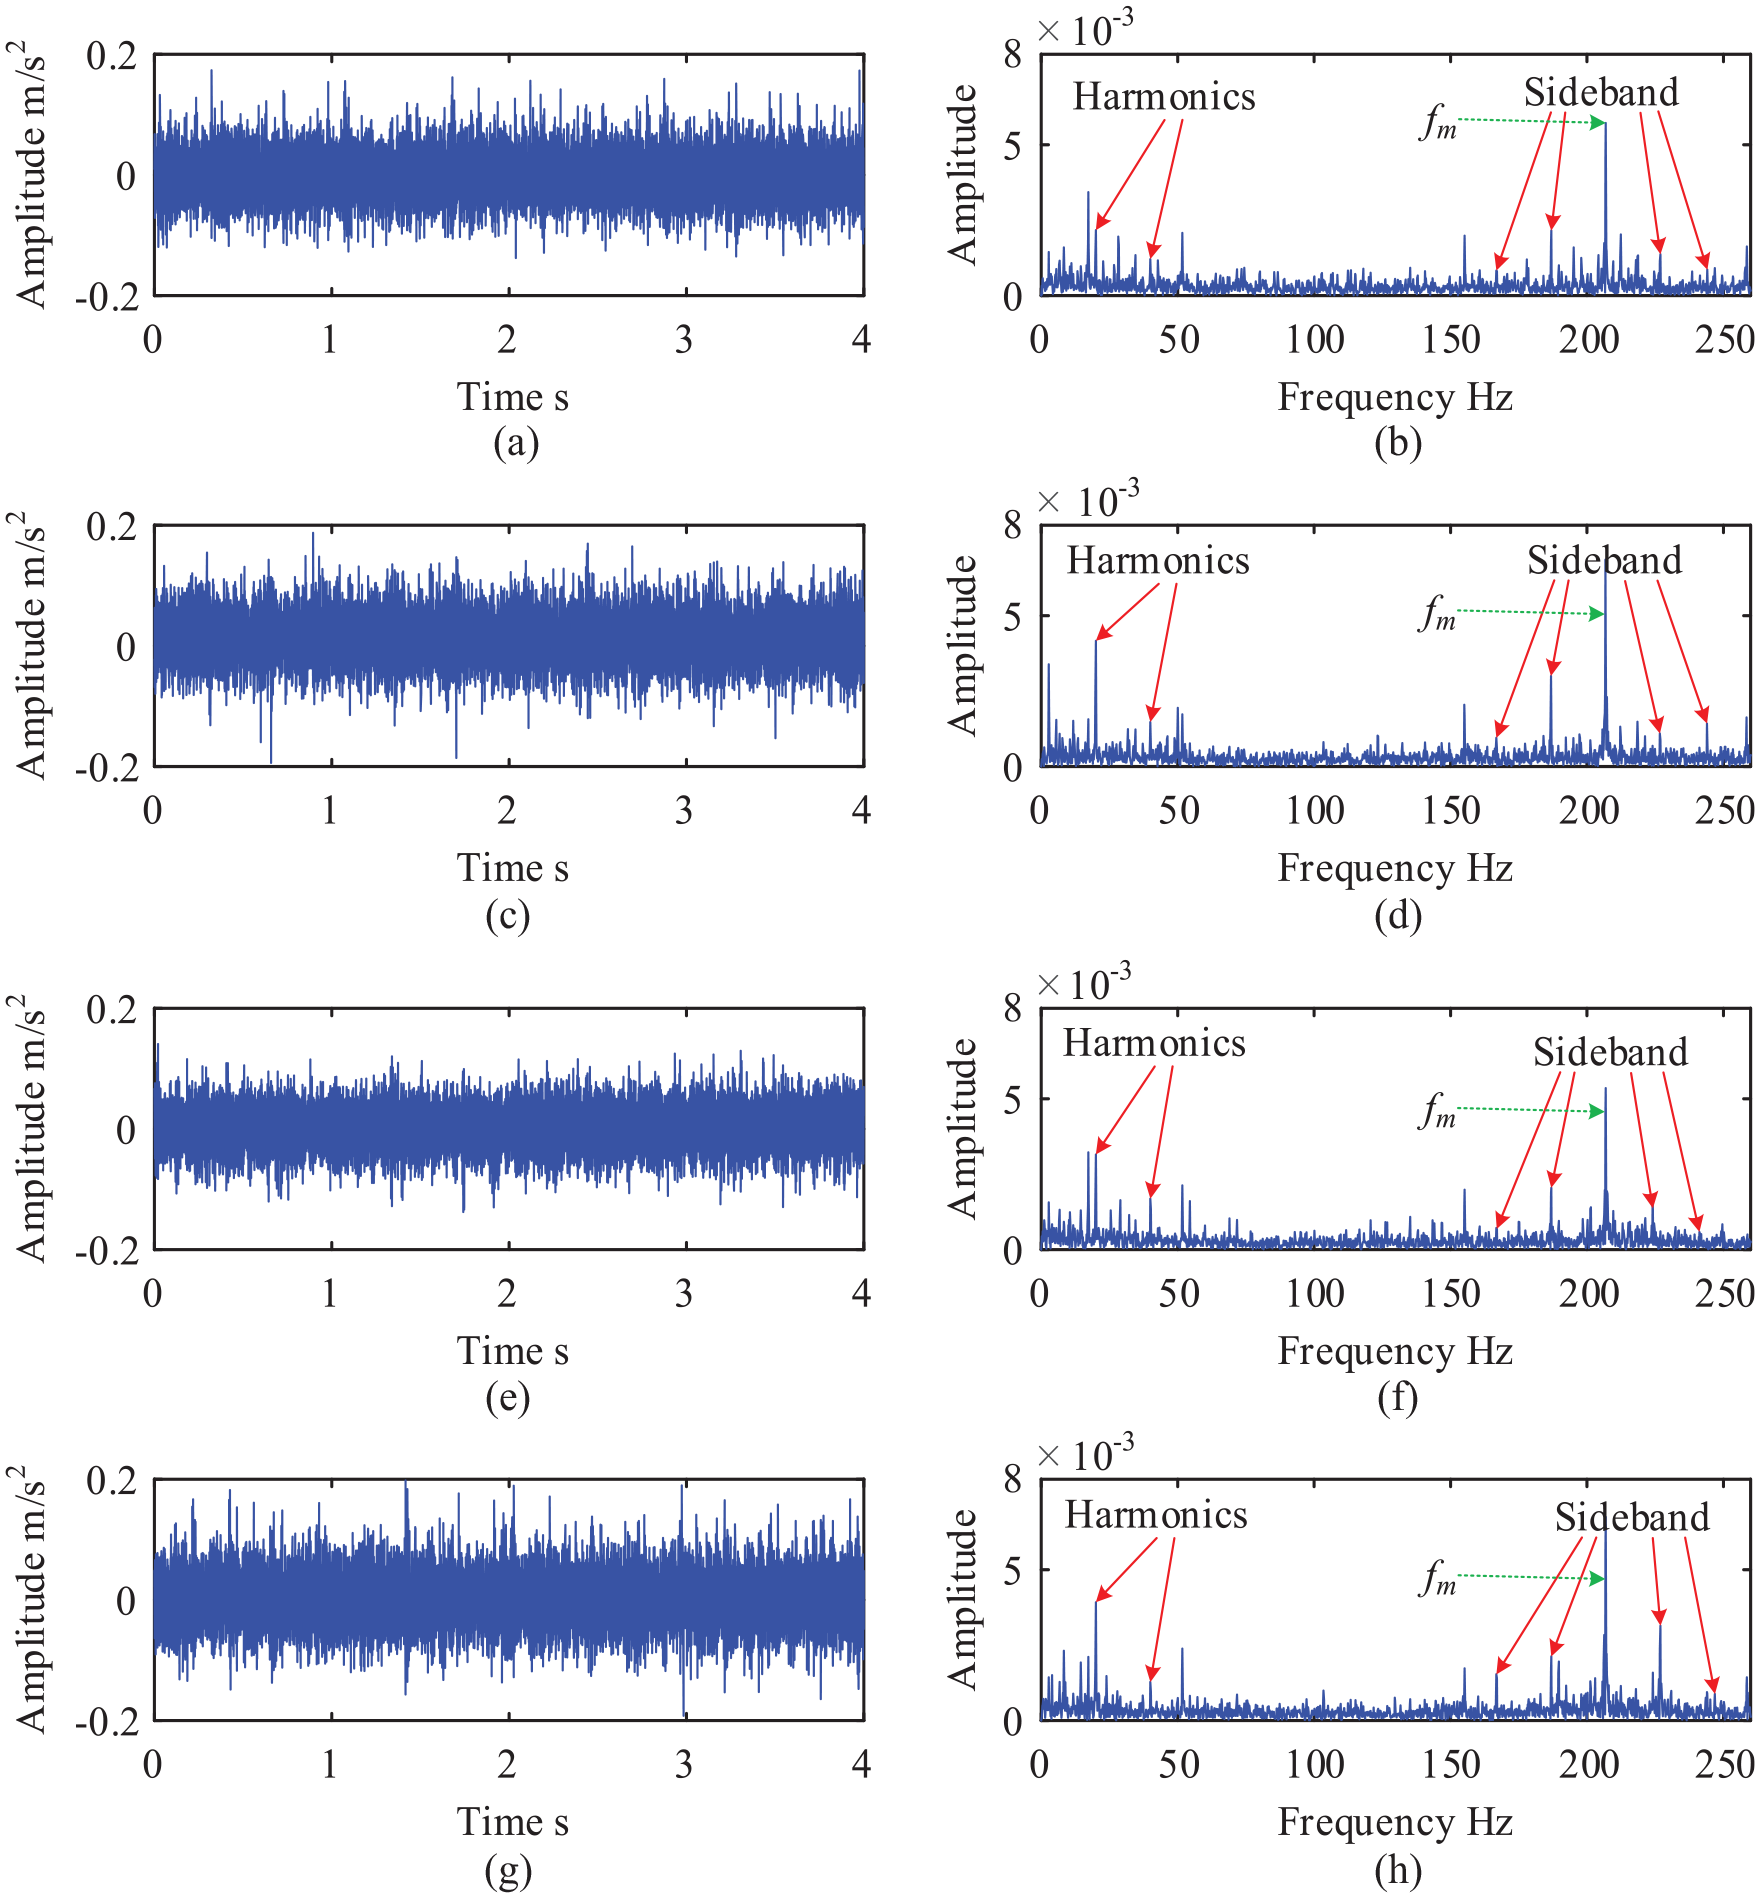
The original signal time-domain diagram and envelope spectrum at different wear type. (a), (c), (e), and (g) are time-domain diagrams of fault signals when wear type is 1, 2, 3, and 4 respectively and (b), (d), (f), and (h) are respective envelope spectrum corresponding to (a), (c), (e), and (g).
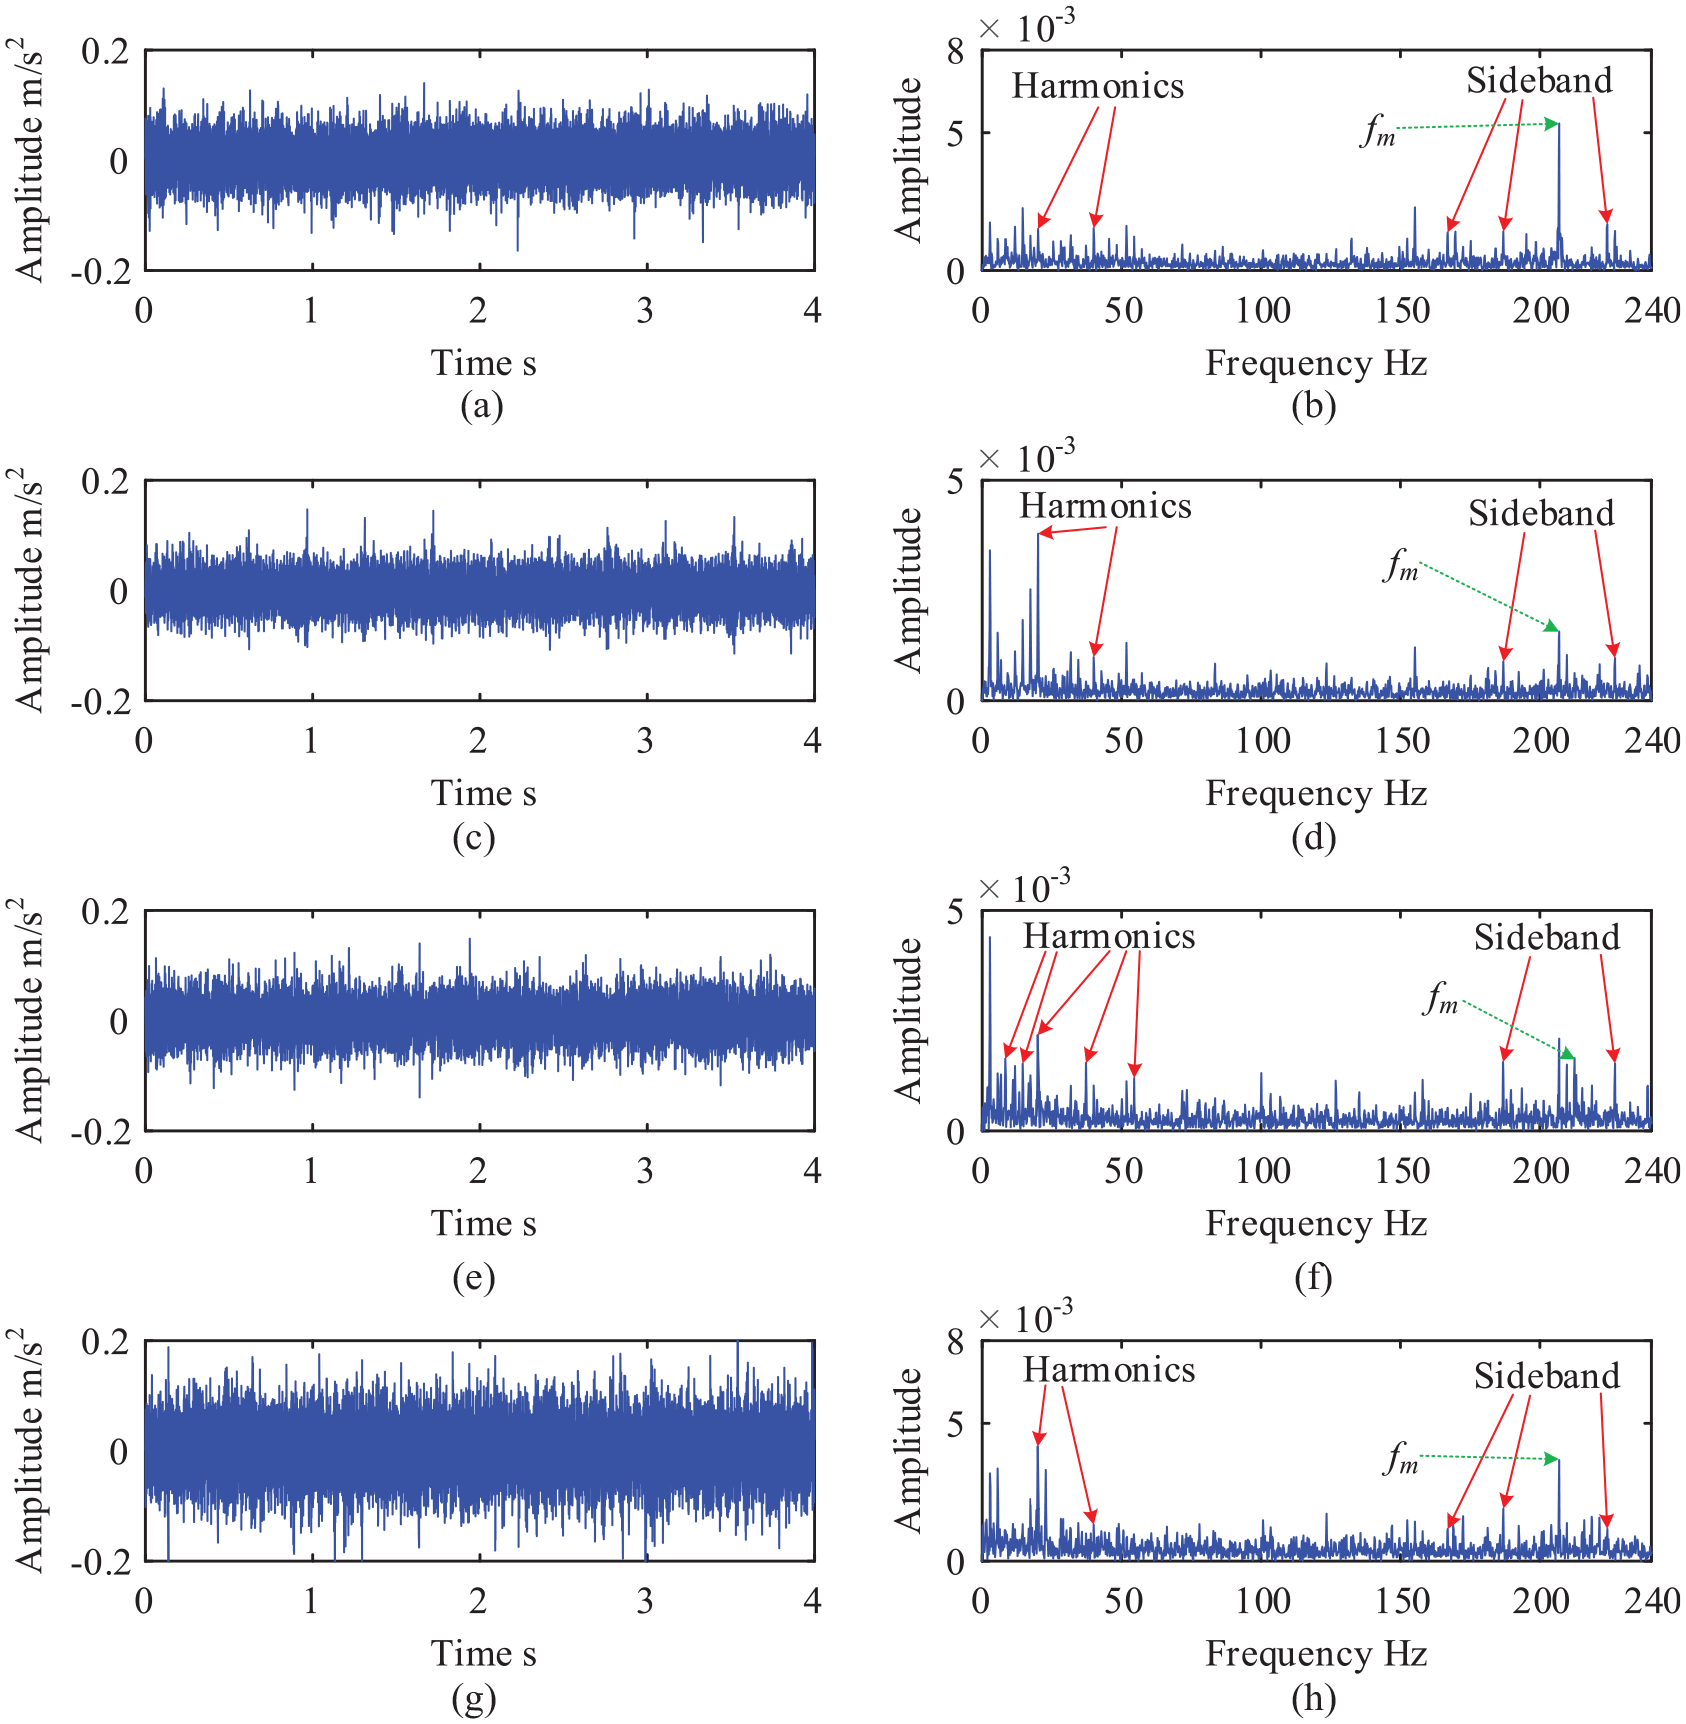
The original signal time-domain diagram and envelope spectrum at different wear degree. (a), (c), (e), and (g) are time-domain diagrams of fault signals when wear degree is 2, 3, 4, and 5 respectively and (b), (d), (f), and (h) are respective envelope spectrum corresponding to (a), (c), (e), and (g).
It can be found from Figures 15 and 16 that the amplitude of the original vibration signal in the time-domain is uniform. There are many frequency components in the envelope spectrum, and the spectrum lines are very disordered. A small number of FCF spectral lines can be found, and more are submerged in noise. The MF amplitude is the most significant.
The effect of signal length on max_CK
The input signal length (Ls) has an important influence on max_CK. Under the same conditions, the shorter the signal length is, the larger the max_CK is in MCKD. In Section ‘The proposed early fault diagnosis method for PGB,’ this conclusion has been applied in the process of proposing MCO_MCKD, and now it is proved by the experimental signal. In order to make the change of max_CK more intuitive, this paper defines the relative change rate τ of CK, which is calculated as follows:
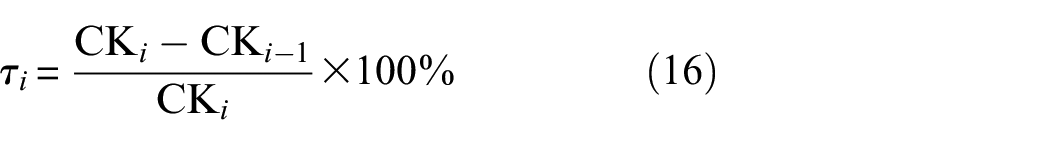
Where τi is the change rate of the i-th CK relative to the (i – 1)-th CK, and CK i and CKi − 1 represent respectively the i-th and (i − 1)-th CK.
According to Equation (16), the variation of τ with the Ls under different Ft and wd is calculated, and the result is shown in Figure 17. L and M are respectively set to 800 and 6, and I = 50.
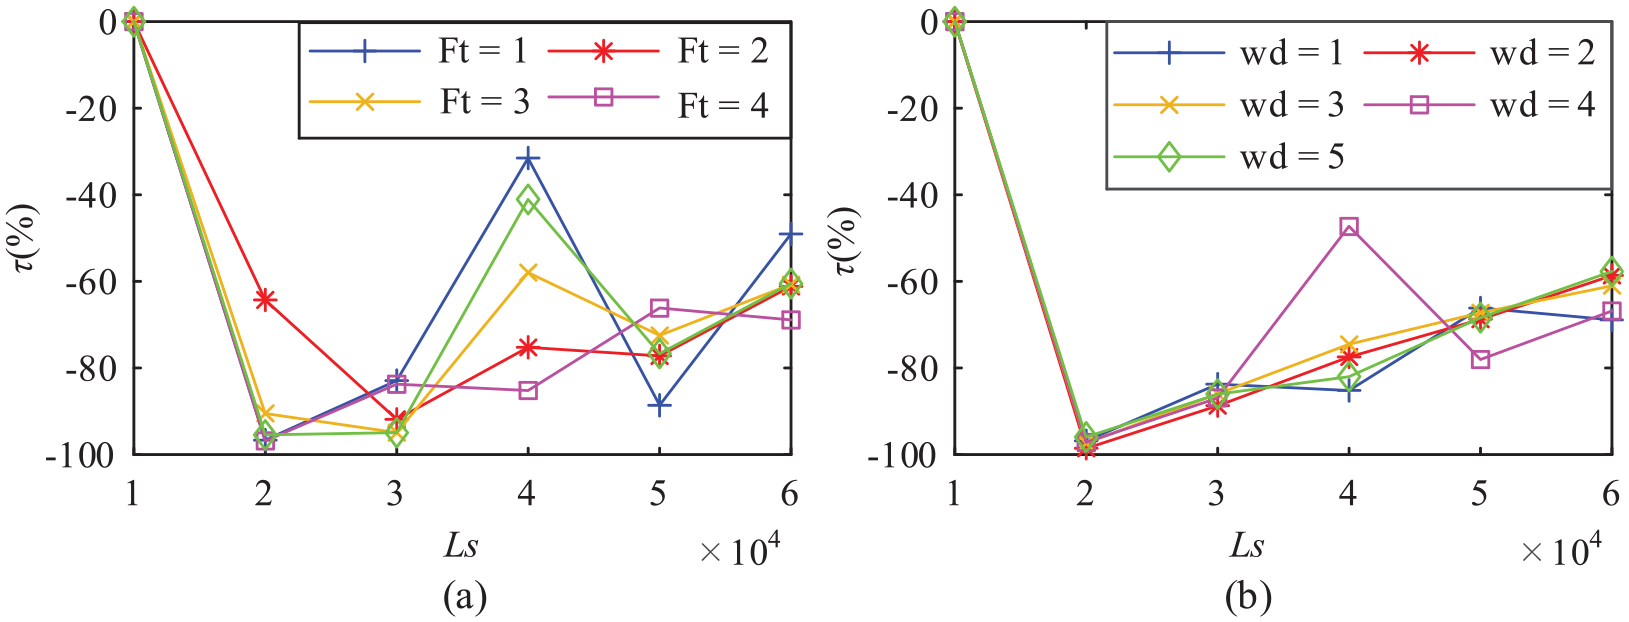
The change curve of relative change rate of correlation kurtosis when length of input signal changes. (a) Different wear type and (b) different wear degree.
From Figure 17, it can be found that with the increase of Ls, the max_CK decreases significantly. This fully shows that the signal length has a significant effect on max_CK. The max_CK can be effectively increased by shortening the input signal length.
FCE and diagnosis result analysis
The content of this part mainly includes the analysis of FCE results at different Ft and wd, the comparison of FCE results of different algorithms.
Comparison and discussion of FCE results of different algorithms
Figures 18 and 19 are time-domain diagram and envelope spectrum of FCE results of different algorithms, respectively. The experimental vibration signals under different Ft and wd are segmented respectively, and the length of each signal is shown on the abscissa in Figure 18. It can be found from the figure that under different Ft and wd, the FCE results of MCO_MCKD is better than that of other algorithms such as MED, MOMEDA, CYCBD, and MCKD. The noise amplitude in the result of directly using MCKD to process the short signal is obviously larger than that of MCO_MCKD, and there are frequency loss and distortion in the spectrum. The time-domain fault pulses extracted by MCKD and MCO_MCKD are concentrated. MCO_MCKD can effectively extract fault characteristic.
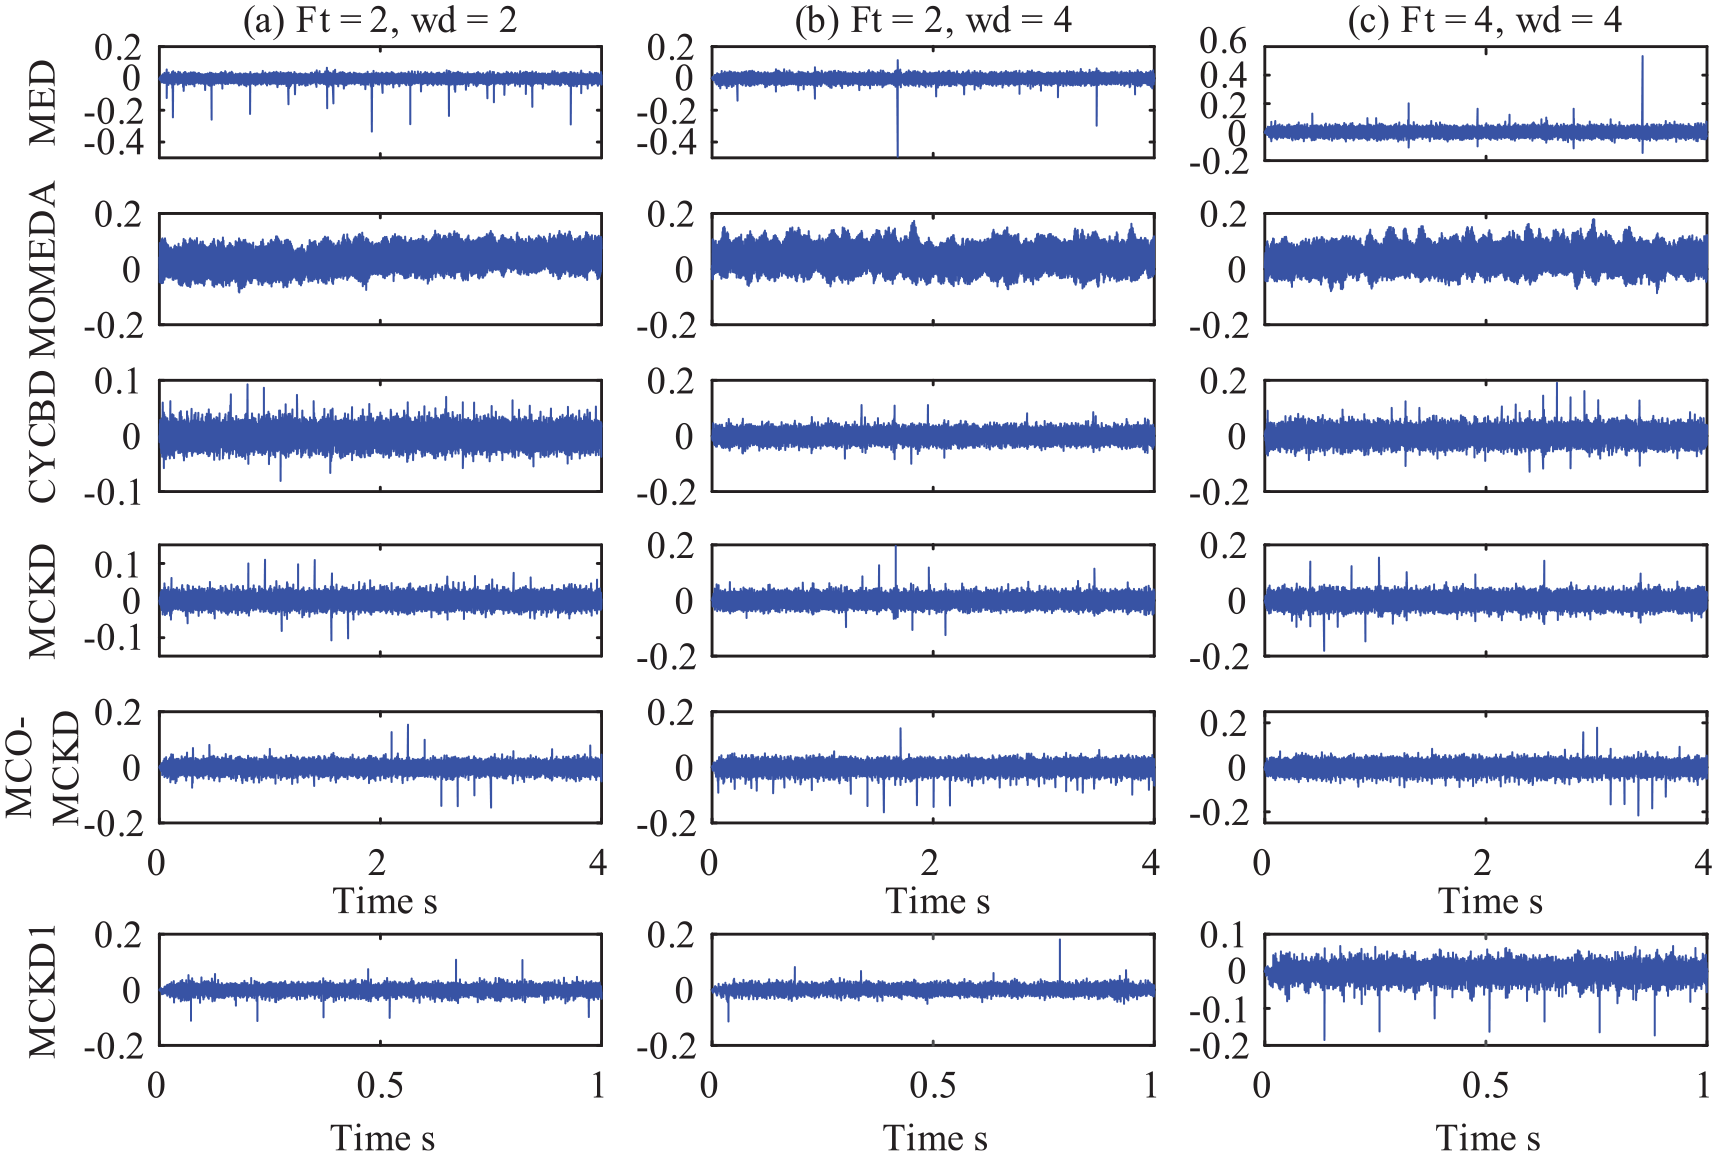
Comparison of fault characteristic extraction results of different algorithms in time-domain. (a) Wear type is 2 and wear degree is 2, (b) Wear type is 2 and wear degree is 4 and (c) Wear type is 4 and wear degree is 14.
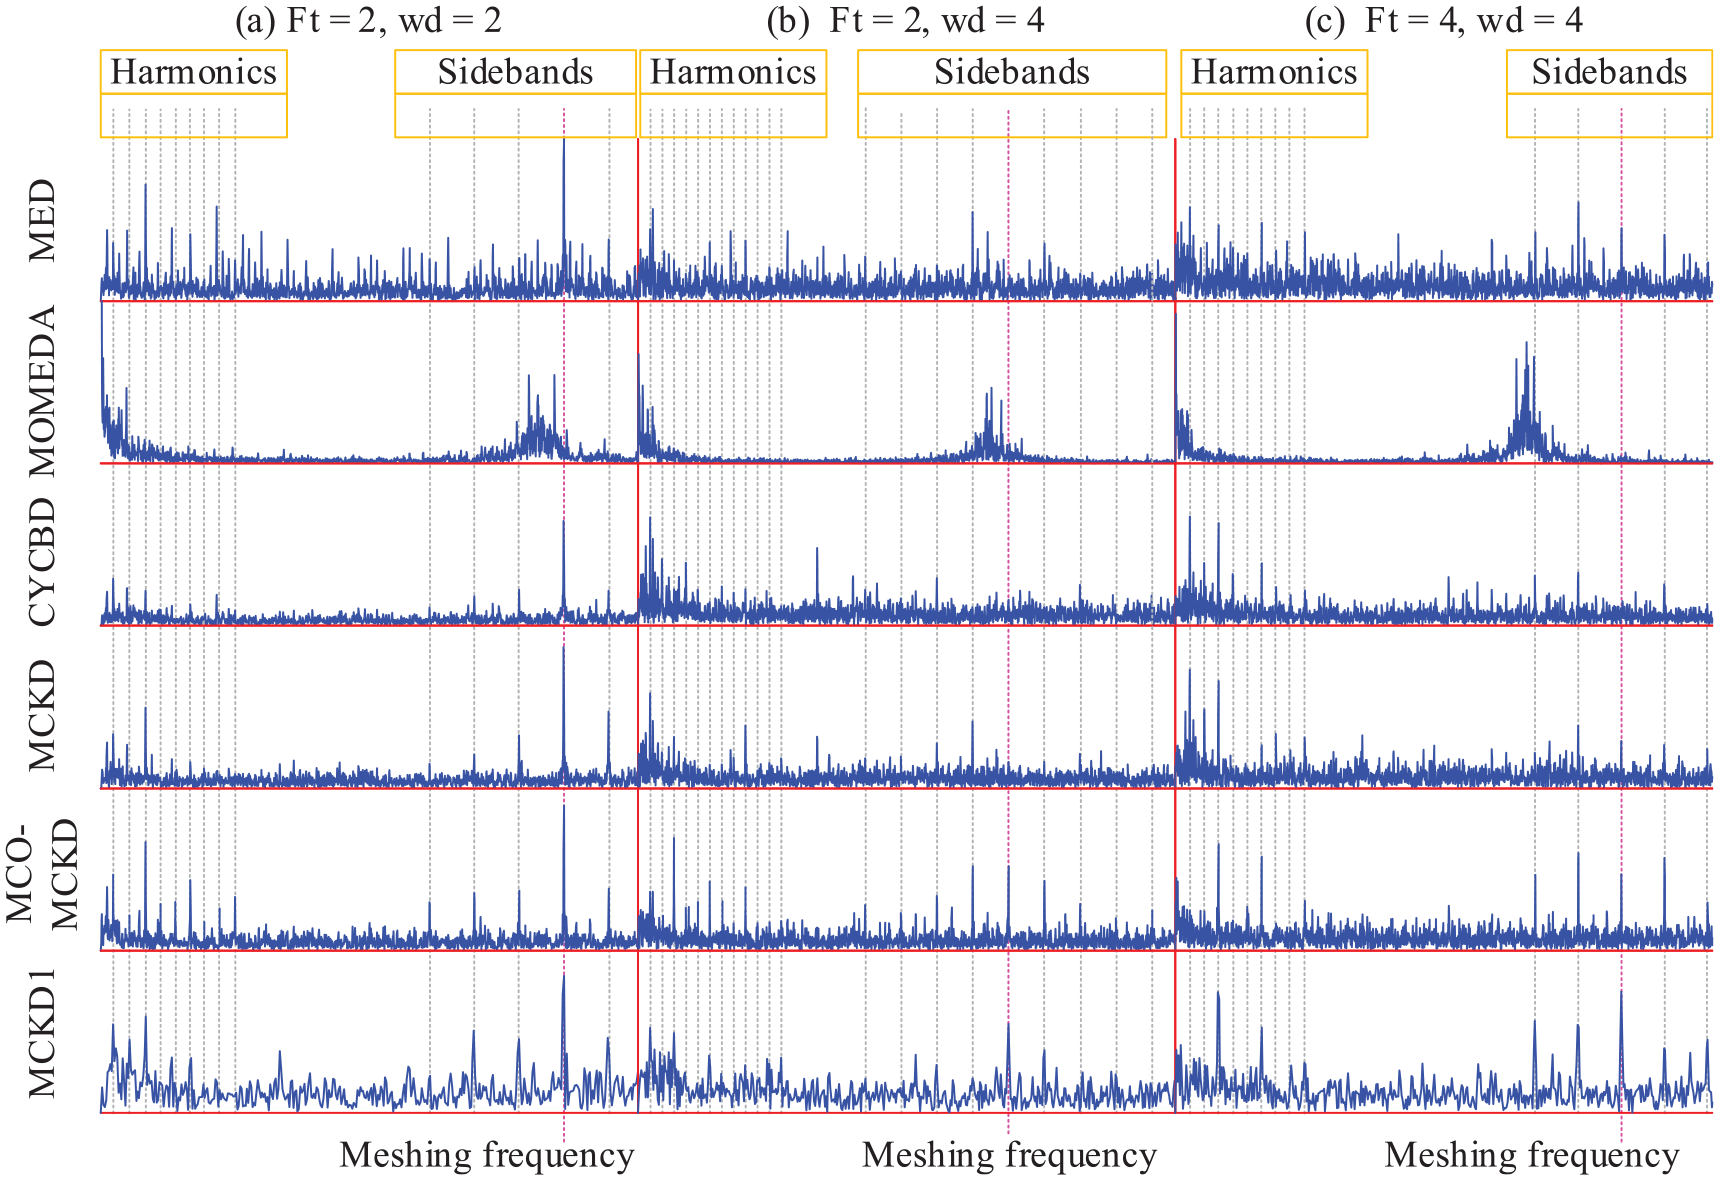
Comparison of envelope spectrum of fault characteristic extraction results of different algorithms. (a) Wear type is 2 and wear degree is 2, (b) wear type is 2 and wear degree is 4 and (c) wear type is 4 and wear degree is 14.
FCE results and discussion under different fault types and degrees
This experiment sets up a variety of fault types. The FCE results of the vibration signal shown in Figure 15 by MCO_MCKD processing are shown in Figure 20 at different Ft. The FCE results of MCO_MCKD processing the vibration signal shown in Figure 16 is shown in Figure 21 at different wd. The window size and sliding distance are 10000 and 4000 respectively. From the time-domain diagrams, it can be found that a lot of fault pulses can be detected with intervals of Pd. From the envelope spectrum, it can be found that in the FCE results at different Ft and wd, the FCF and its harmonics, the MF and its sideband distribution can be clearly seen. It can be found from the figure that the frequency nNpfp,f and the amplitude of the sidebands with Npfp,f as the interval are more obvious, and the frequency fp,f and 2fp,f are not obvious. The amplitude of fm also increases with the wd. Combining Figures 20 and 21, it can be found that MCO_MCKD can effectively extract fault characteristic under different Ft and wd.
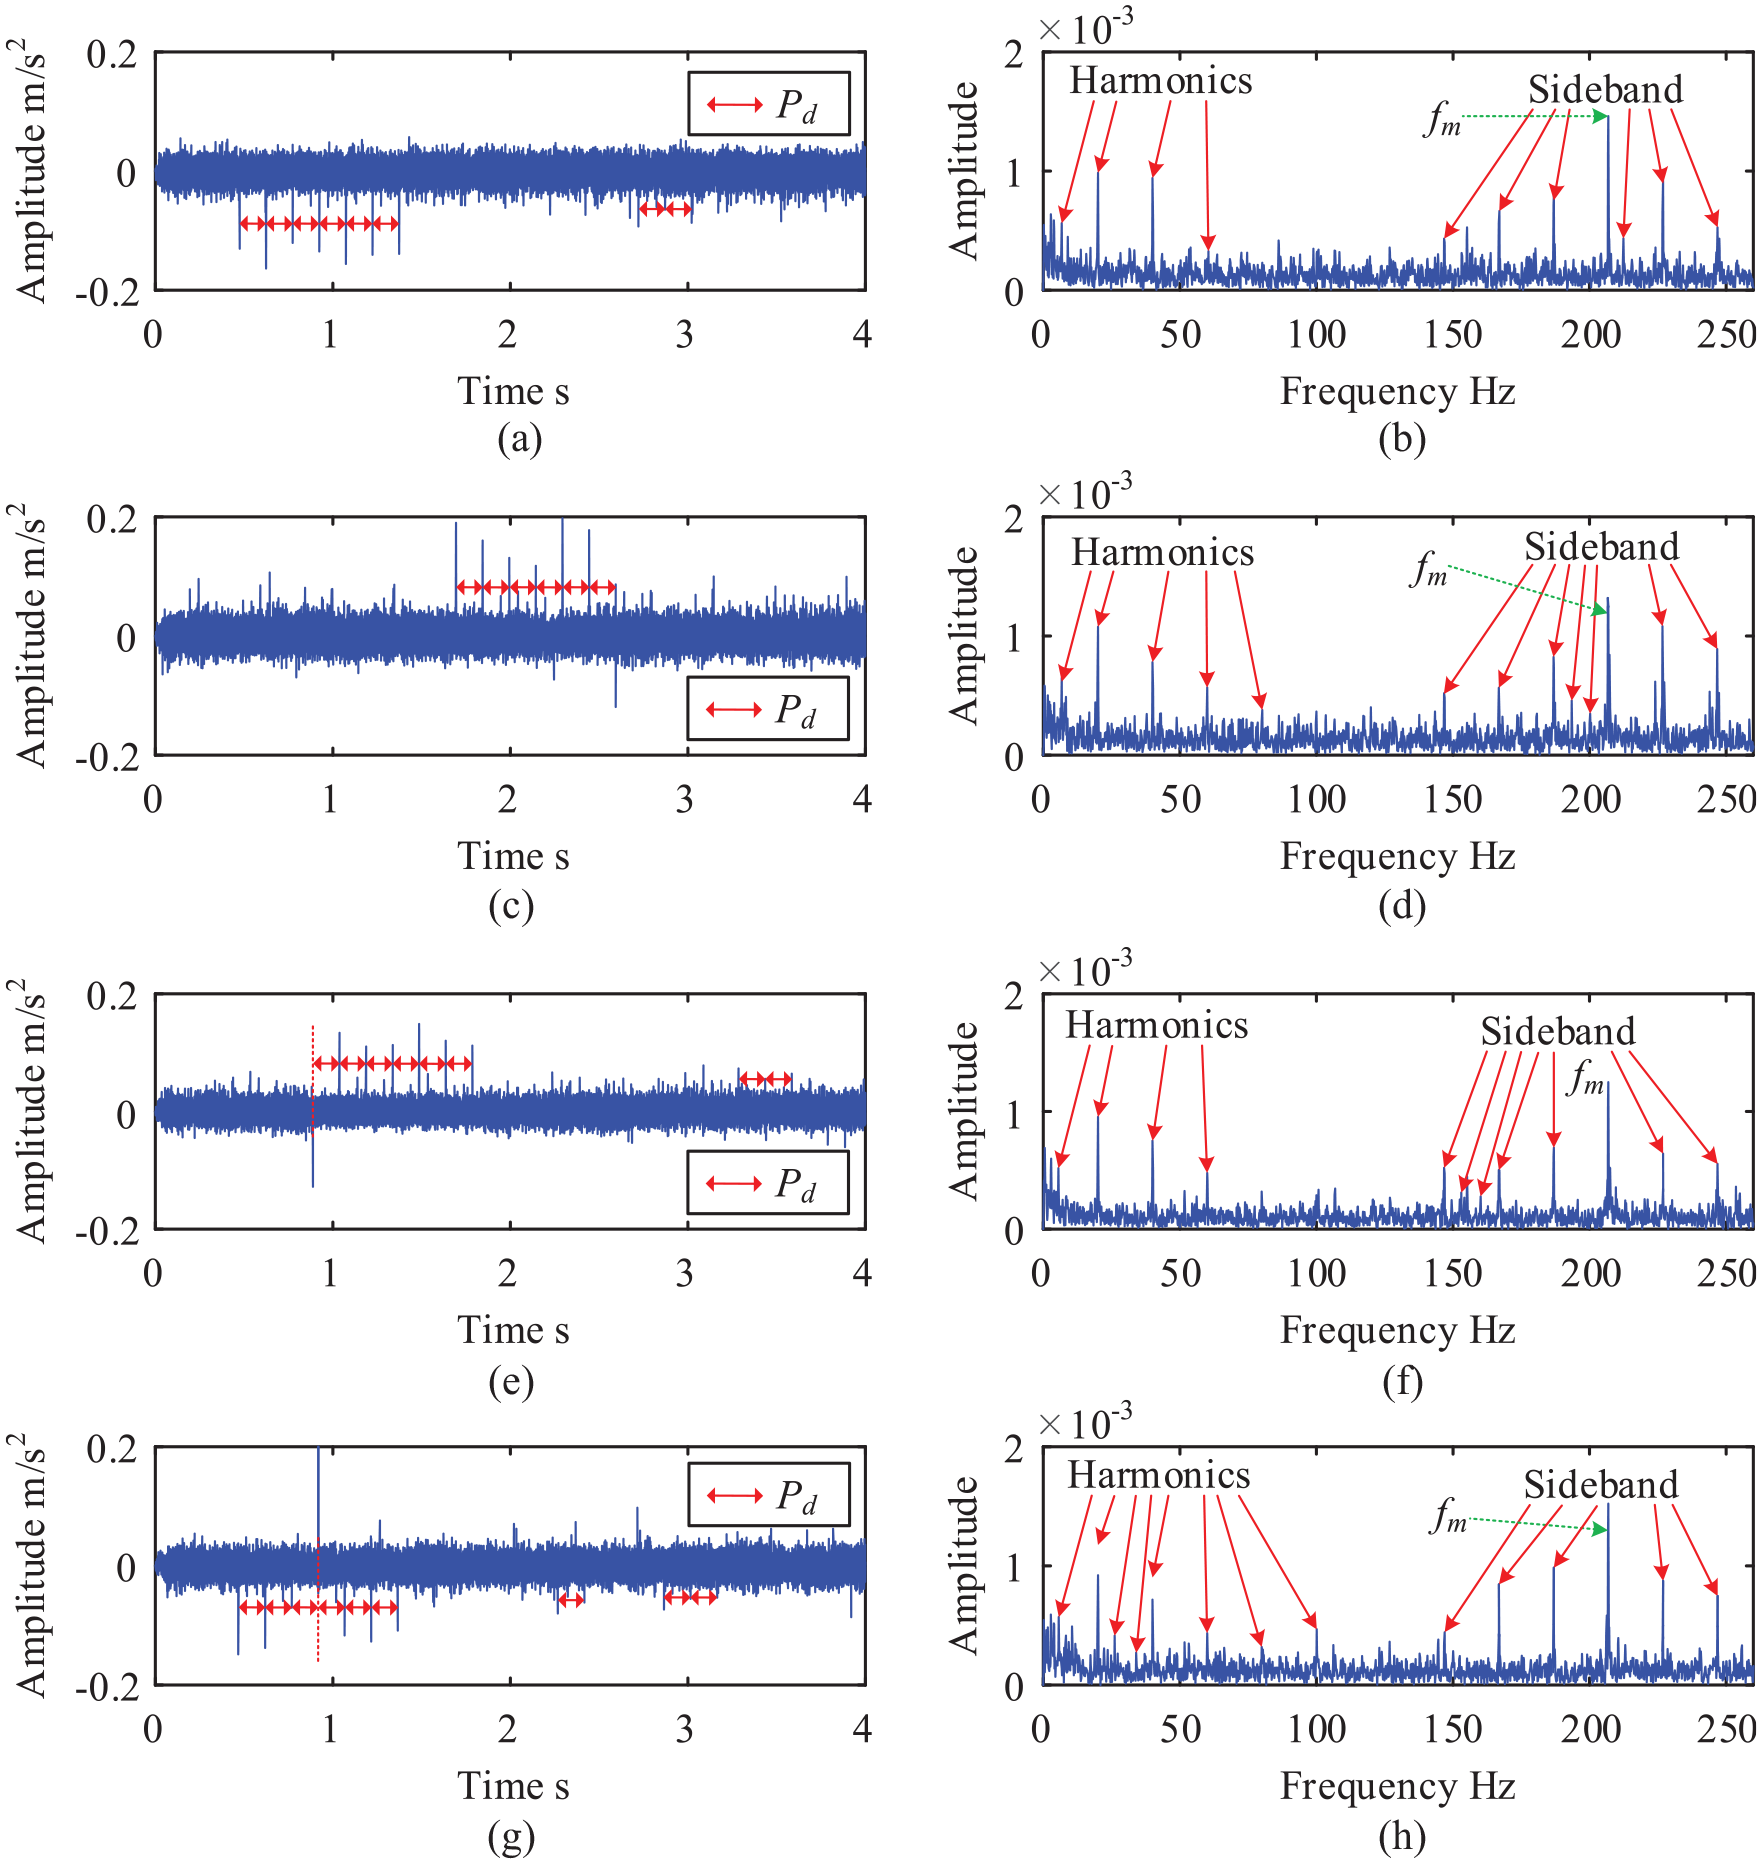
Fault characteristic extraction results at different wear type. (a), (c), (e), and (g) Are the time-domain diagrams when wear type is 1, 2, 3, and 4 respectively and (b), (d), (f), and (g) Are respective envelope spectrum of (a), (c), (e), and (g).
Fault characteristic extraction results at different wear degree. (a), (c), (e), and (h) Are time-domain diagrams when wear degree 2, 3, 4, and 5 respectively and (b), (d), (f), and (g) Are respective envelope spectrum of (a), (c), (e), and (h).
Fault diagnosis results and discussion
For accurate fault diagnosis, it is necessary to research the sensitivity of FCER to the change of fault characteristics with different Ft and wd. At present, kurtosis (Ku), RMS, impulse factor (IF) and waveform factor (SF) are often used in fault diagnosis. In this paper, Ku, RMS, IF, and SF are selected as the comparison indicators of FCER. In order to accurately describe the change rule of statistical indicators, the transformation method of statistical indicators as shown in the following equation is defined:
Where CI represents the statistical indicator, and ζ_CIwd represents the change rate of CI relative to the previous wear degree at wd.
Firstly, the traditional indicators such as Ku, RMS, IF, and SF are used to calculate the change of the experimental signal before and after FCE, and ζ_CI is used to convert the trend of the statistical indicators. Then, the change of ζ_FCER before and after FCE is calculated, and the diagnosis of the early DTSW fault of the planet gear is realized. ζ_CI of traditional indicators and FCER are shown in Figure 22.
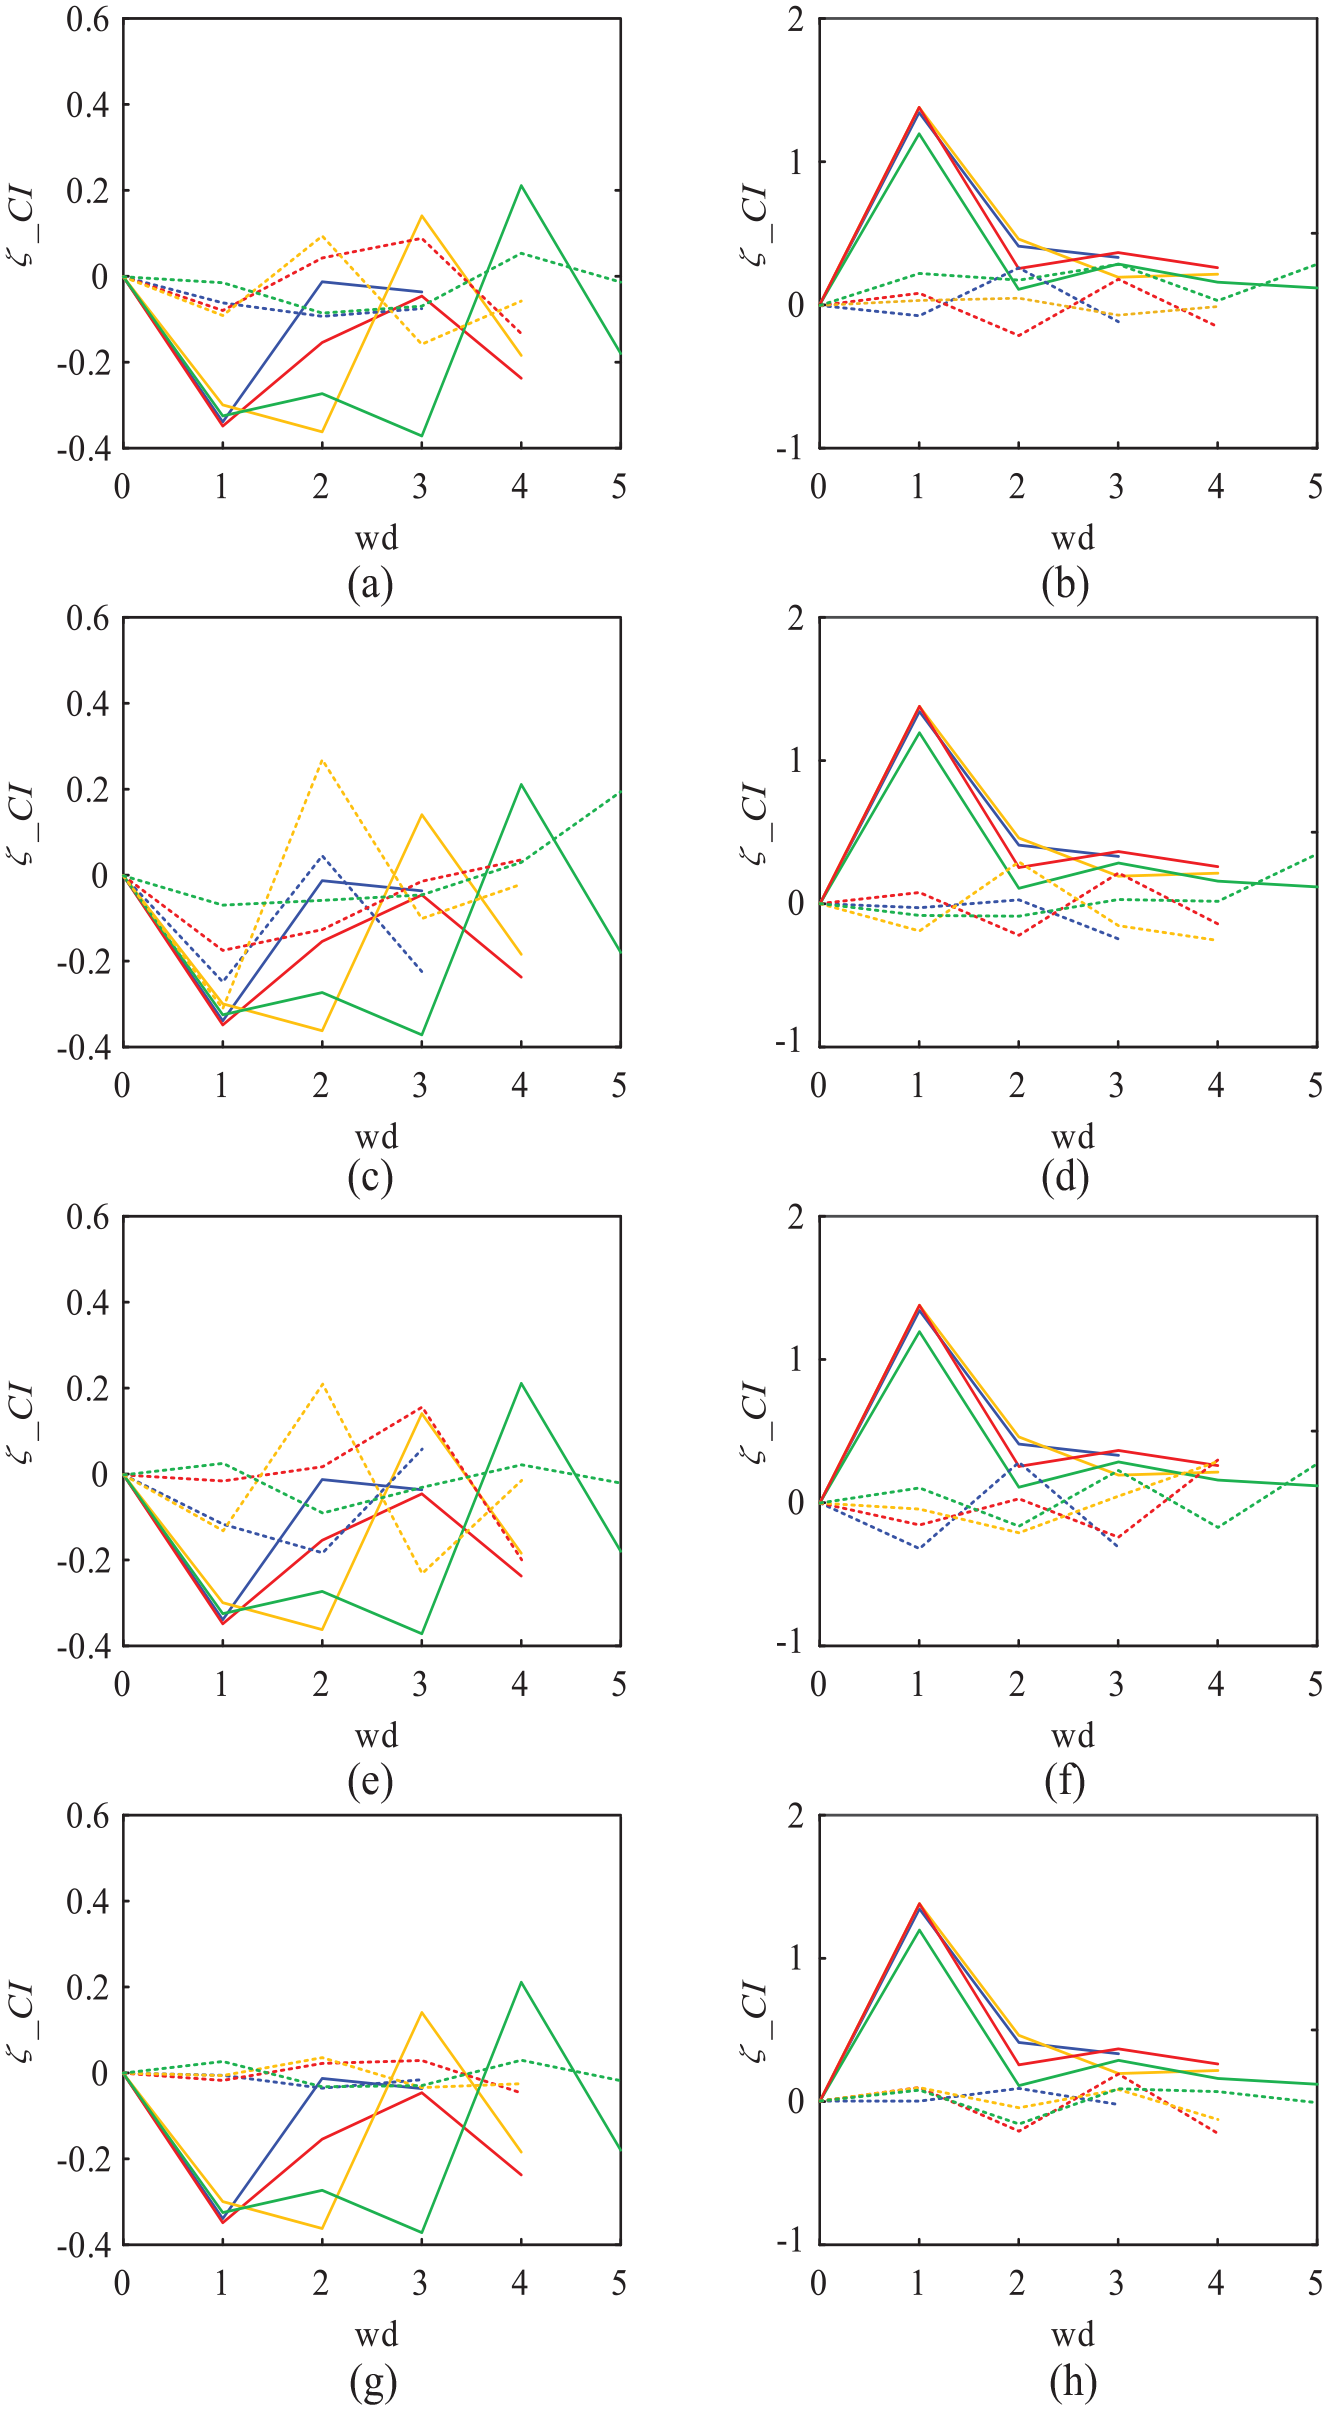
Relative change rate curves at different wear type. (a), (c), (e), and (g) Are the calculation results of the original time-domain signals and (b), (d), (f), and (h) Are the calculation result after fault characteristic extraction. The dotted line and the solid line represent the result curves of traditional indicators and FCER indicators respectively, and blue, red, yellow, and green curves represents the fault types 1, 2, 3, and 4 respectively. (a) Ku and FCER, (b) Ku and FCER, (c) RMS and FCER, (d) RMS and FCER, (e) IF and FCER, (f) IF and FCER, (g) SF and FCER, (h) SF and FCER.
From Figure 22, it can be found that the traditional indicators have the same trend before and after the FCE. The traditional indicators maintain stable fluctuations with the increase of wd, and the ζ_CI fluctuates around 0. At the initial stage of fault, the traditional indicators have no significant change relative to the health state, and the change rules of different Ft are different in the change process. Therefore, the traditional indicators are not suitable for the early distributed fault diagnosis.
At the same time, it can be found that before FCE, FCER first decreases with the increase of wd. Then it gradually decreased, but the rate of decrease gradually became smaller. Finally, FCER changed from downward trend to upward trend, and then showed a downward trend. There are many rises and falls in the change process, which is not suitable for the early diagnosis of DTSW fault.
After FCE, the value of ζ_FCER is always positive, and FCER always shows an upward trend. Moreover, the sudden large increase of FCER in the early stage of fault means that FCER can effectively diagnose and indicate early wear faults. FCE can effectively change the trend of FCER. The trend of FCER after FCE is more suitable for the early fault diagnosis of DTSW, which further proves the necessity of FCE.
Through the experimental verification, it can be found that MCO_MCKD proposed in this paper can effectively extract the fault characteristics of DTSW in the PGB. After FCE, FCER can be used to effectively diagnose the early DTSW fault, and the proposed early fault diagnosis method is effective.
Conclusion
This paper presents an early fault diagnosis method of DTSW in PGB, which mainly includes two parts: FCE and early fault indication. In this process, we propose an algorithm MCO_MCKD for FCE, and propose a statistical indicator FCER that can be used to evaluate the FCE result and early fault indication. In this paper, the proposed method is experimental verification, and the following conclusions can be drawn:
Shortening the length of the input signal effectively improves the max_CK of MCKD. According to this conclusion, the proposed MCO_MCKD can effectively extract the fault characteristics of DTSW in PGB, and the extraction effect is obviously better than other deconvolution algorithms. And the algorithm can still effectively extract fault characteristics under different window sizes, sliding distances and noise power, and it has strong robustness;
Based on the meshing characteristics of PGB and the frequency-domain characteristics of DTSW fault, FCER is proposed. This frequency-domain statistical indicator has good sensitivity to the early DTSW fault, and can produce a large mutation in the early stage of the fault. Compared with traditional time-domain statistical indicators, the effect is superior. And it can evaluate the FCE result. However, the sensitivity to the fault evolution process is low, and it is only suitable for early warning indication of DTSW fault.
Footnotes
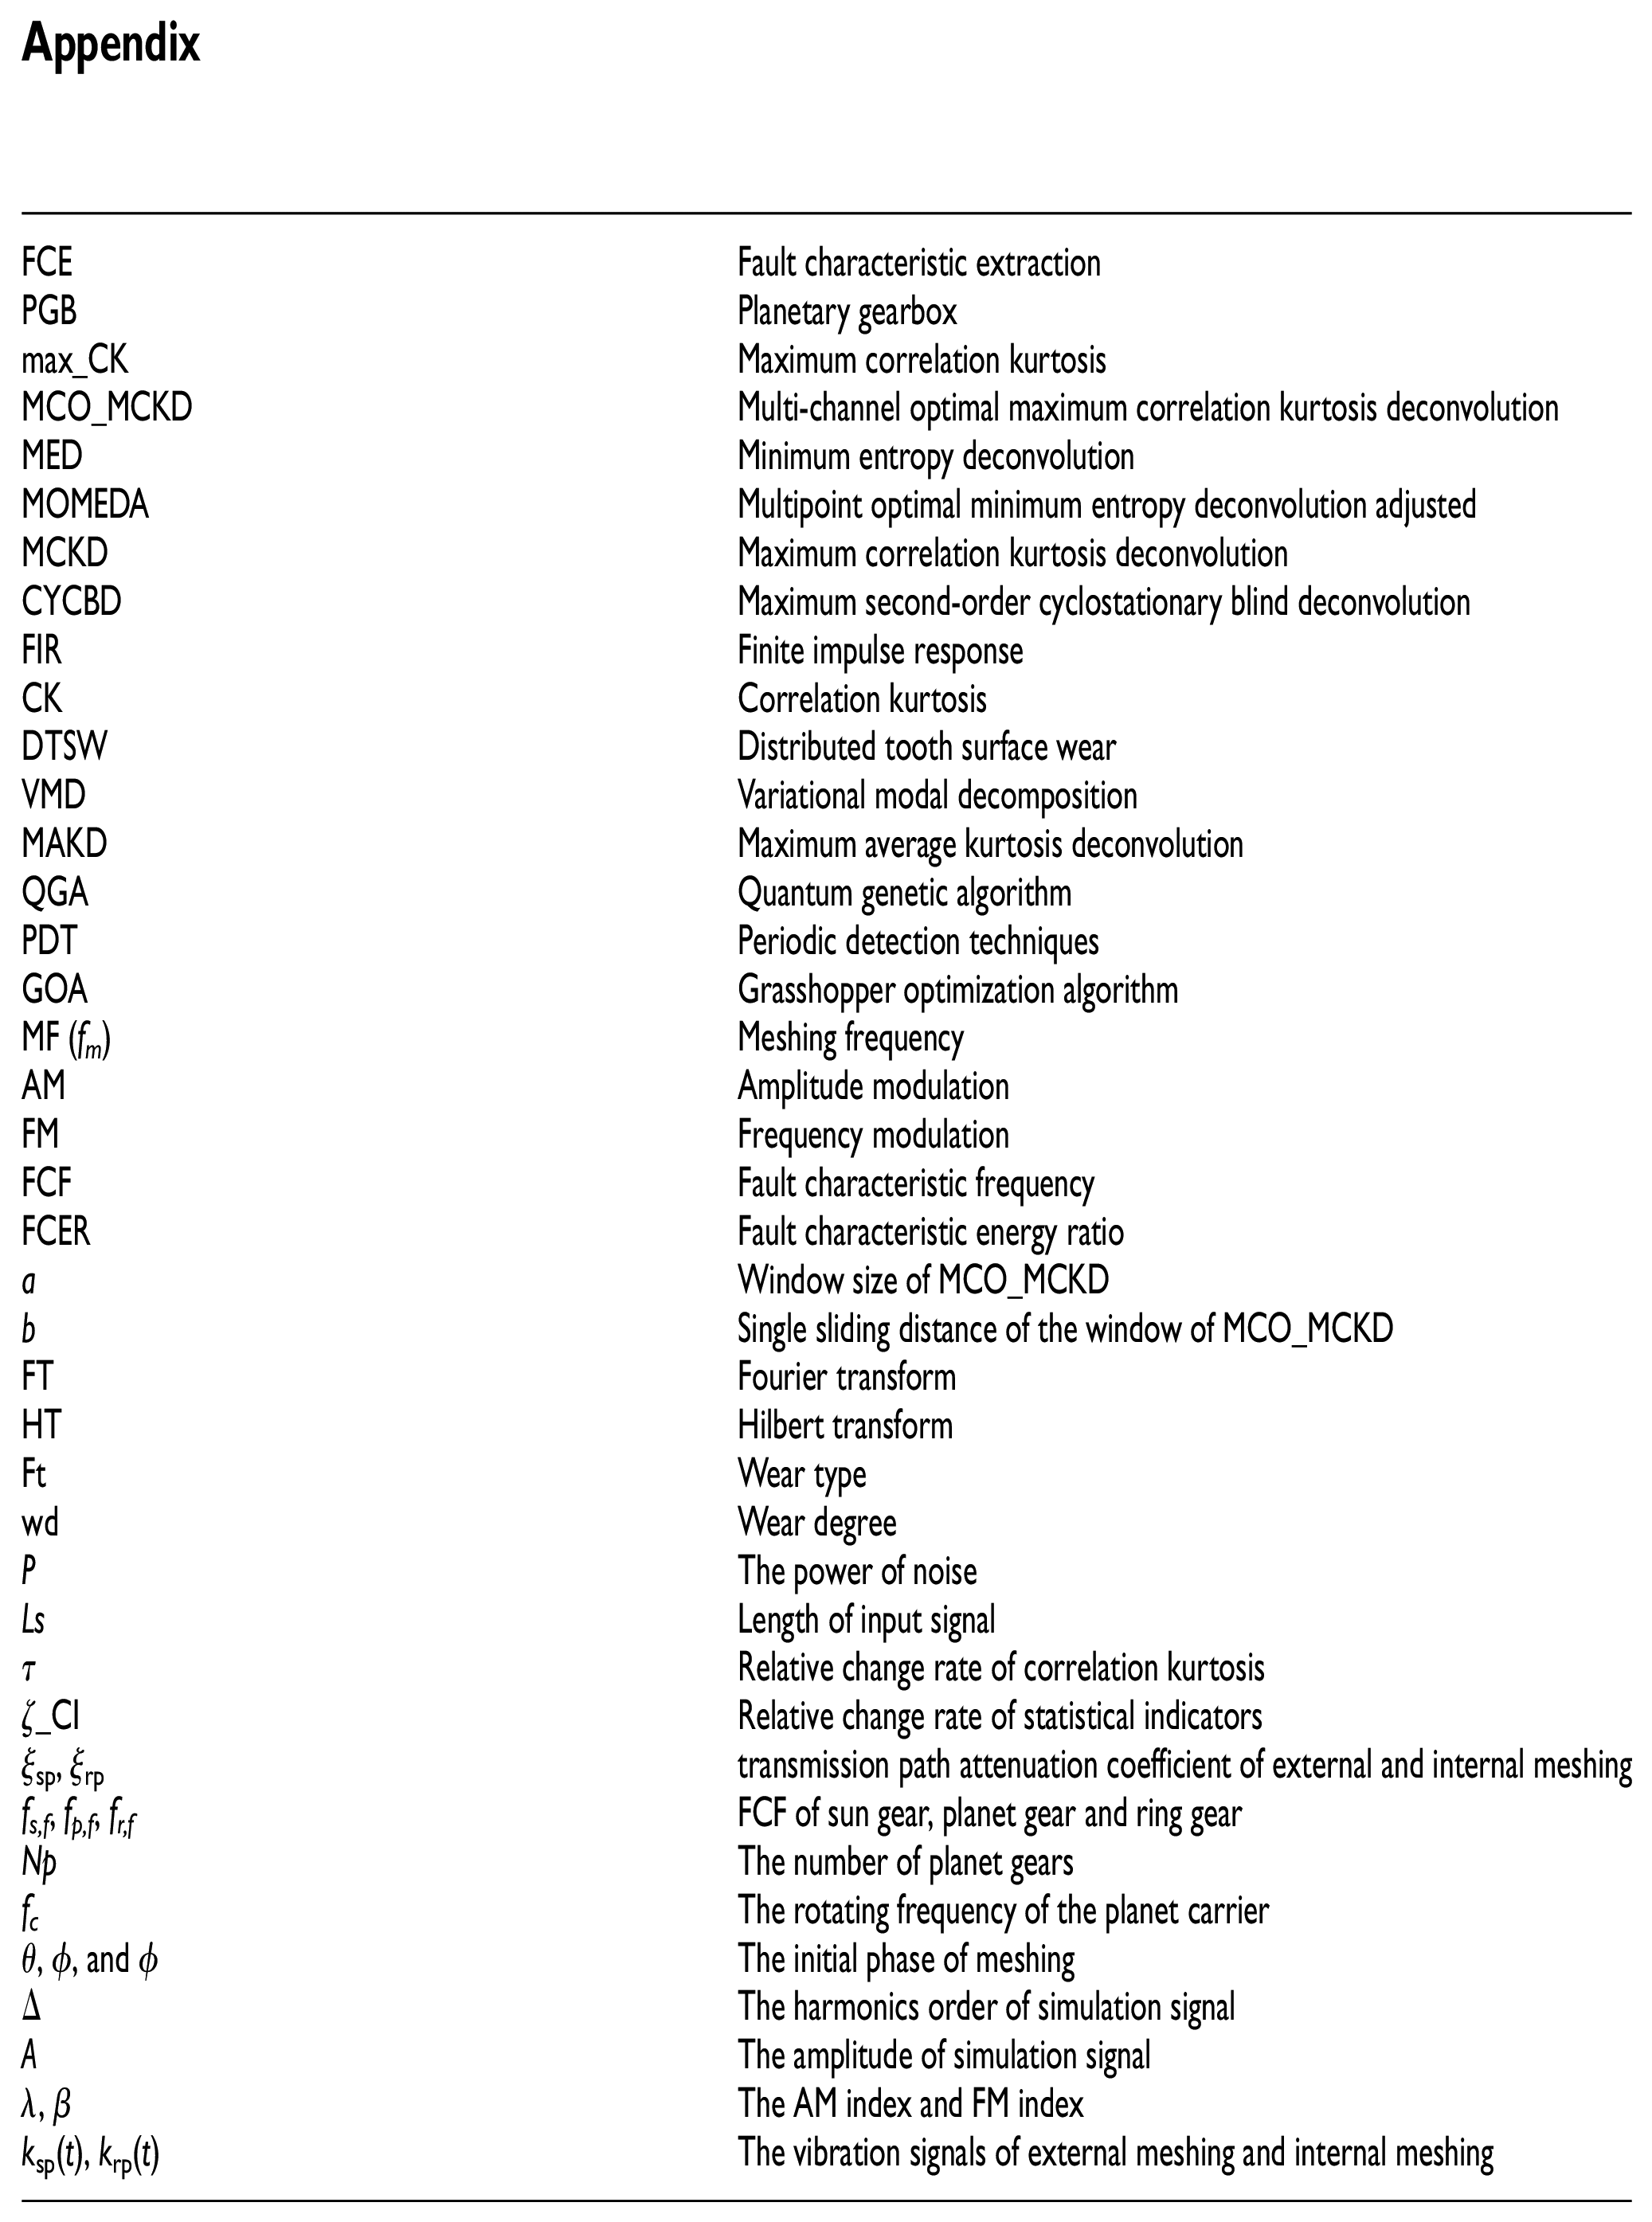
Appendix
| FCE | Fault characteristic extraction |
| PGB | Planetary gearbox |
| max_CK | Maximum correlation kurtosis |
| MCO_MCKD | Multi-channel optimal maximum correlation kurtosis deconvolution |
| MED | Minimum entropy deconvolution |
| MOMEDA | Multipoint optimal minimum entropy deconvolution adjusted |
| MCKD | Maximum correlation kurtosis deconvolution |
| CYCBD | Maximum second-order cyclostationary blind deconvolution |
| FIR | Finite impulse response |
| CK | Correlation kurtosis |
| DTSW | Distributed tooth surface wear |
| VMD | Variational modal decomposition |
| MAKD | Maximum average kurtosis deconvolution |
| QGA | Quantum genetic algorithm |
| PDT | Periodic detection techniques |
| GOA | Grasshopper optimization algorithm |
| MF (fm) | Meshing frequency |
| AM | Amplitude modulation |
| FM | Frequency modulation |
| FCF | Fault characteristic frequency |
| FCER | Fault characteristic energy ratio |
| a | Window size of MCO_MCKD |
| b | Single sliding distance of the window of MCO_MCKD |
| FT | Fourier transform |
| HT | Hilbert transform |
| Ft | Wear type |
| wd | Wear degree |
| P | The power of noise |
| Ls | Length of input signal |
| τ | Relative change rate of correlation kurtosis |
| ζ_CI | Relative change rate of statistical indicators |
| ξsp, ξrp | transmission path attenuation coefficient of external and internal meshing |
| fs,f, fp,f, fr,f | FCF of sun gear, planet gear and ring gear |
| Np | The number of planet gears |
| fc | The rotating frequency of the planet carrier |
| θ, ϕ, and ϕ | The initial phase of meshing |
| Δ | The harmonics order of simulation signal |
| A | The amplitude of simulation signal |
| λ, β | The AM index and FM index |
| ksp(t), krp(t) | The vibration signals of external meshing and internal meshing |
Declaration of conflicting interests
The author(s) declared no potential conflicts of interest with respect to the research, authorship, and/or publication of this article.
Funding
The author(s) disclosed receipt of the following financial support for the research, authorship, and/or publication of this article: This work was financially supported by The National Natural Science Foundation of China and the Civil Aviation Administration of China joint funded projects (U1733108), the Key Program of Natural Science Foundation of Tianjin (21JCZDJC00770), the Research and Innovation Project for Postgraduates in Tianjin (2020YJSB074).