
Abstract
Fuzzy entropy (FE) can be regarded as an effective measure for nonlinear characterization of rolling element bearing (REB) health condition by quantifying the complexity of vibration signals. However, during continuous monitoring operation under heavy noise, transient impulses corresponding to a REB fault get submerged under unnecessary random noise components. As a consequence, FE algorithm not only fails to detect a REB fault at the earliest point of inception but also performs poorly in monitoring the development of the incepted fault in an efficient manner. Aiming at solving the aforementioned limitations of FE in continuous monitoring of REB health, background noise associated with collected vibration signals is eliminated by weighting the corresponding square envelope signal. Due to the utilization of weighted squared envelope signal, the proposed measure is termed as weighted square envelope-based FE (WSEFE). One simulated case and two different run-to-failure experimental cases are used for validation. The comparison results demonstrate that the proposed WSEFE not only overcomes the limitations of original FE but also performs better than conventional permutation entropy and advanced FE-based measure multiscale FE (MFE) in continuous monitoring of REB health.
Keywords
Introduction
Rolling element bearings (REBs) are an important component in almost all types of rotating machineries. 1 Due to its continual nature of operation in harsh working conditions, nearly half of all types of machine failure are caused by REB faults. 2 Targeting the prevention of these kind of failures, prognosis of REB has obtained more importance in comparison to conventional diagnosis methods in the recent years 3 . Prognosis of REB health by analysis of collected vibration signals is the most efficient approach in this regard.4,5
Continuous monitoring is a major part of the REB health prognosis. Monitoring of REB health in a continuous manner consists of two distinct stages. 6 They are: (1) Detection of a REB fault at the earliest point of inception; (2) Monitoring the development of the incepted fault. Hence, designing of effective measure is the key to REB health monitoring. 7 Figure 1 shows the three distinct phases of continuous monitoring operation by an efficient REB health monitoring measure.
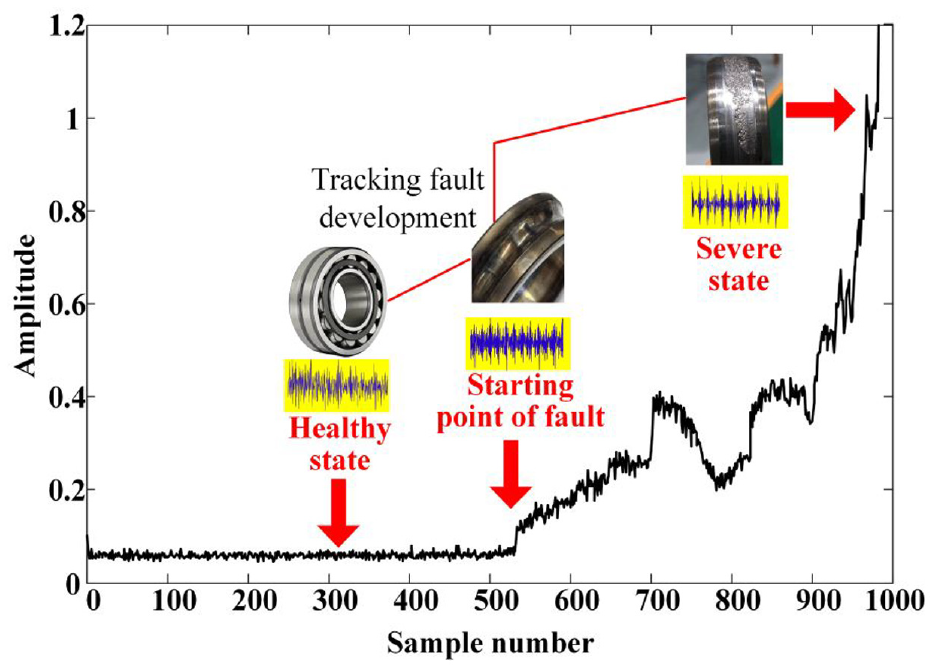
Continuous monitoring by a REB health measure.
Vibration signals collected from REBs are nonlinear in nature due to the contamination by environmental noise and effect of external strike and friction during the data acquisition process. Hence, construction of nonlinear health monitoring measures has drawn significant attention from the researchers in recent years. 9 REB health monitoring by entropy-based nonlinear measures plays an important role in this regard.10,11 The concept of entropy was first proposed by Shanoon in 1948. 12 On the basis of this concept, Pincus proposed approximate entropy (AE) in order to address the finite length problem of the original entropy algorithm. 13 However, one of the major weaknesses of AE is self-similarity problem. Targeting this problem, Richman proposed sample entropy (SampEn). 14 Nevertheless, both of AE and SampEn fail to capture the long-term correlation. Additionally, they are both heavily dependent on the data length. Unlike SampEn and AE, permutation entropy (PE) proposed by Bandt and Pompe 15 can address the self-similarity problem. Unfortunately, well-defined pattern of a particular design cannot be classified by PE. 16
Free from the limitations of aforementioned entropy algorithms, fuzzy entropy (FE) was proposed by Chen et al. 17 States of the orbit are counted by fuzzy set theory during the implementation of FE algorithm. As a result, FE possesses superior ability in estimating the complexity of the vibration signal during condition monitoring of a REB.18,19 However, during real-life industrial application, transient impulses corresponding to a bearing fault get submerged under the heavy noise originating from the surrounding environment. As a result, a direct application of FE in continuous monitoring of REB health suffers from two main drawbacks: (1) Insensitiveness of FE algorithm toward the earliest detection of incipient fault. A high value of FE may either infer the presence of heavy noise or deterioration of REB health; (2) Inconsistent monitoring of the development of incipient fault by FE algorithm. Hence, it is not possible for FE to perform the continuous monitoring of REB health status in an efficient manner. An alternative solution for the aforementioned limitations is the multiscale application of FE algorithm.20,21 However, multiscale analysis only analyzes the fault information hidden in the low frequency component and ignores the fault information present in the high frequency component. As a consequence, multiscale analysis is not sensitive enough for efficient continuous monitoring of REB health. Moreover, application of multiscale fuzzy entropy (MFE) is computationally expensive. In this context, two main contributions of this research are:
A new variant of FE algorithm has been proposed which can detect the incipient REB fault at the earliest point of inception during a continuous monitoring operation.
Tracking the development of the incepted REB fault during a continuous monitoring operation has been achieved.
It is required to preprocess the vibration signal collected from a REB before analyzing by entropy algorithms. Traditional preprocessing techniques such as band pass filters or wavelet transform are reliable on the fixed specific scale of a base function. As a result, they are not suitable for application in continuous monitoring of REB health.22,23 Furthermore, as an alternative signal preprocessing technique, adaptive decomposition methods such as empirical mode decomposition or local mean decomposition suffer from mode mixing problem.24,25 Different from aforementioned signal preprocessing techniques, lately square envelope (SE) analysis has been proven effective for extracting the REB fault features.26,27 Being a function of the original signal, a SE signal is suitable for continuous monitoring of REB health.
On the basis of all the above, weaknesses of original FE algorithm are described in section “Theory of FE and its weaknesses in continuous monitoring of REB health” with the help of numerically simulated REB signals. Section “Weighted squared envelope based fuzzy entropy for continuous REB health monitoring” describes the theoretical framework for the extraction of REB fault features by weighting the corresponding SE signals. Subsequently, extracted REB fault features have been incorporated into the calculation of proposed weighted squared envelope-based fuzzy entropy (WSEFE). Parameter selection regarding WSEFE calculation has been discussed in section “Parameter selection.” Proposed WSEFE is verified by simulation and experimental case studies in section “Performance verification.” Lastly, section “Conclusion” discusses the conclusions of this paper.
Theory of FE and its weaknesses in continuous monitoring of REB health
Original FE algorithm
FE utilizes a fuzzy similarity degree based on fuzzy membership functions and vectors shape to measure the similarity of two vectors. 17 Due to the continuity of the exponential fuzzy function, FE can produce more accurate entropy estimation. 20 Detailed steps of FE are listed as follows:
(1) For a time series
where
(2) Distance between
where
(3) Similarity degree
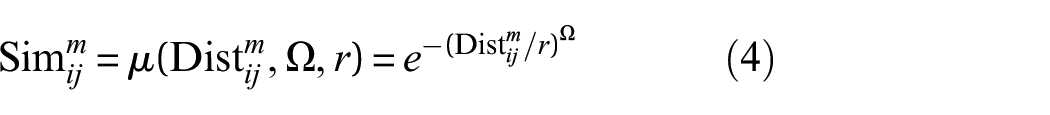
where
(4) Function
where
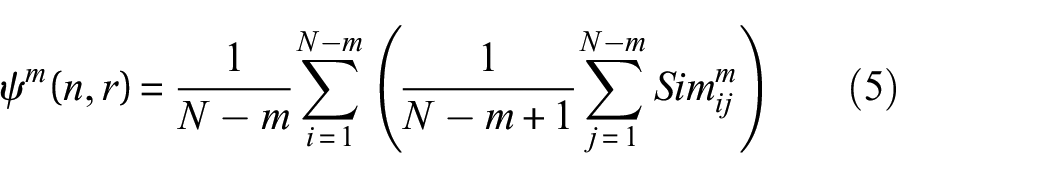
(5)
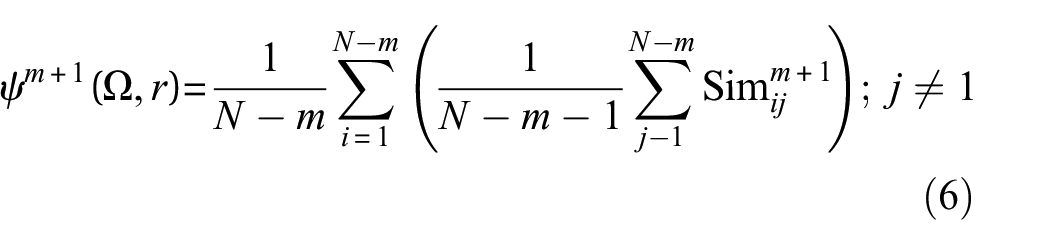
(6) Lastly, FE of
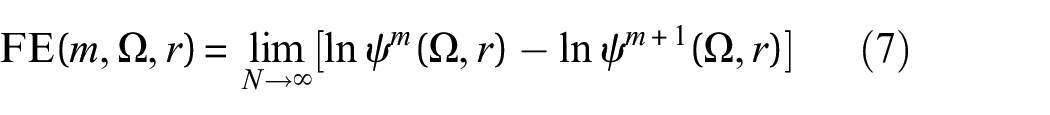
For a finite N,

Weaknesses of FE in continuous monitoring of REB health
A numerically simulated REB fault model has been utilized for studying the weaknesses of FE in continuous monitoring of REB health. Transient impulses generated in vibration signal due to the inception of inner and outer race fault can be written as McFadden and Smith. 28
where,
In this study,
(1) FE is unable to detect the incipient bearing fault under the influence of strong noise
Random Gaussian noise is the representative vibration signal for a healthy REB. 29 Hence, during normal health condition, randomness of the analyzed vibration signal is relatively higher and as a result value of FE approaches its upper limit. With the inception of fault in a REB, repetitive patterns corresponding to the fault transients start to appear in the vibration signal collected from it. As a consequence, randomness of the vibration signals decreases and subsequently, FE of the signal also starts to approach its lower limit. This phenomenon has been explained with the help of Figure 2.
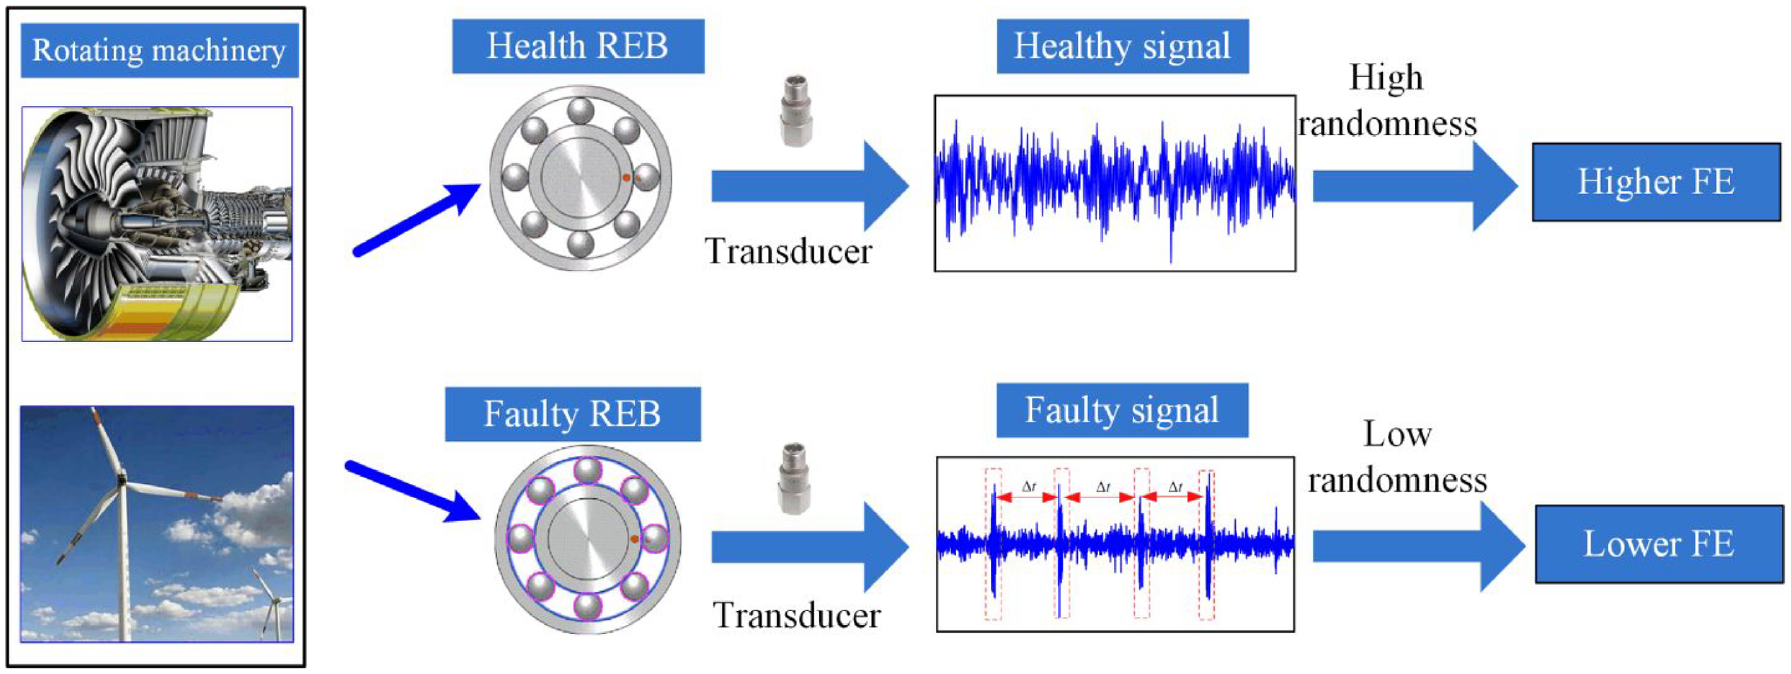
Principle of change of FE value corresponding to REB fault mechanism.
During the initial stage of REB fault inception, the impulse amplitude corresponding to the incepted fault is relatively small in nature. 30 As a result, at the early stage of the fault, fault impulses get submerged under the unwanted noise component associated with the REB signal. However, with the progression of the fault, the amplitude of the corresponding fault impulses increases and has a relatively high value at the severe stage of the fault. Due to the aforementioned REB fault mechanism, it is difficult for FE to detect the incipient fault at the earliest stage of its inception. This phenomenon has been explained in Table 1 as follows.
Change of FE value with REB fault mechanism.
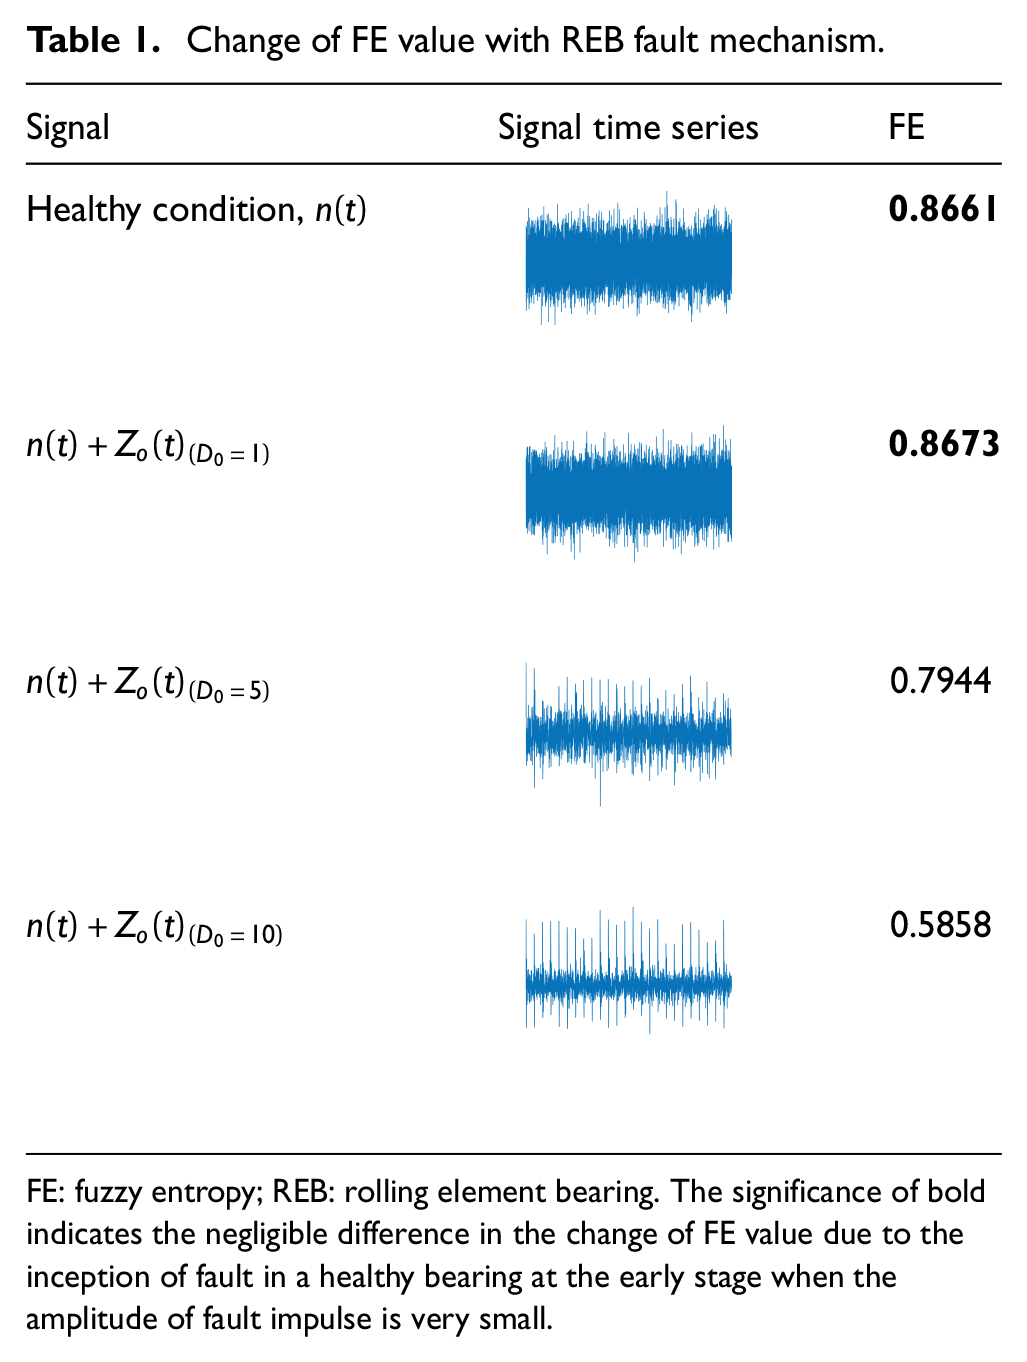
FE: fuzzy entropy; REB: rolling element bearing. The significance of bold indicates the negligible difference in the change of FE value due to the inception of fault in a healthy bearing at the early stage when the amplitude of fault impulse is very small.
From Table 1, it can be seen that for a healthy bearing signal represented by Gaussian noise
Hence, it can be said that FE cannot clearly detect the fault at the initial stage of inception.
(2) FE is not consistent during REB health monitoring process
Efficacy of Continuous monitoring of REB health greatly depends on the consistency of the monitoring measure. Due to the presence of unpredictable random knocks generated from bearing housings, vibration signals are often associated with the random impulses. Moreover, discrete harmonic interference signals are also present in a REB signal. As a result, value of FE often provides inconsistent health monitoring result. Discrete harmonic interferences and random impulses can be generated by Equations (11) and (12) as follows.

where

REB fault mechanism model is constructed for 2 s with a sampling frequency of 12,000 Hz. as shown in Figure 3(a). Initial 1 s corresponds to the healthy REB while final 1 s corresponds to the faulty REB. Continuous monitoring result of the simulated model by original FE algorithm is shown in Figure 3(b).
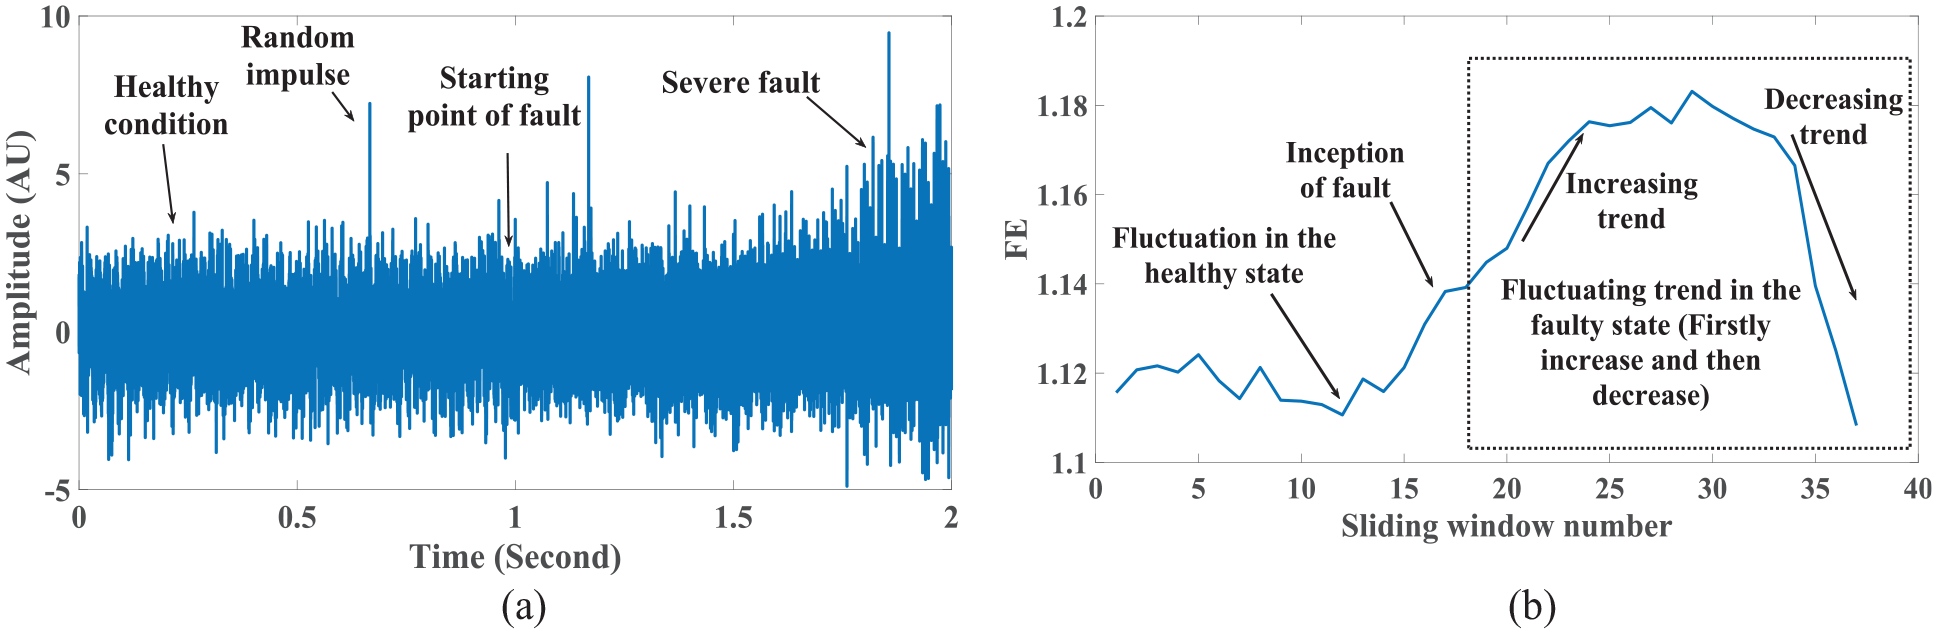
Inconsistent performance of original FE in continuous REB health monitoring. (a) Fault mechanism model and (b) inconsistent monitoring of REB health by FE.
From Figure 3(a), it can be seen that impulses corresponding to REB fault starts appearing at 1 s which is the time to start point (TSP) of the fault. It is obvious that at the initial stage of the fault inception, impulses are submerged under the heavy noise. However, distinctive impulses corresponding to bearing fault starts to appear at the severe stage of the fault. FE demonstrates a fluctuating result in the monitoring of REB health both in healthy and faulty state. Moreover, in the faulty state value of FE at first increases and then decreases in an inconsistent manner which makes FE an unreliable measure for REB health monitoring.
WSEFE for continuous REB health monitoring
Theory of weighted squared envelope (
)
Squared envelope signal (


Based on Equations (14) and (15), weighted squared envelope signal

where,
where,

here, MR represents the moving rate of the probability distribution function (PDF) values corresponding to
According to Hou et al.,
32
in order to obtain a reasonable value for

An illustrative explanation of
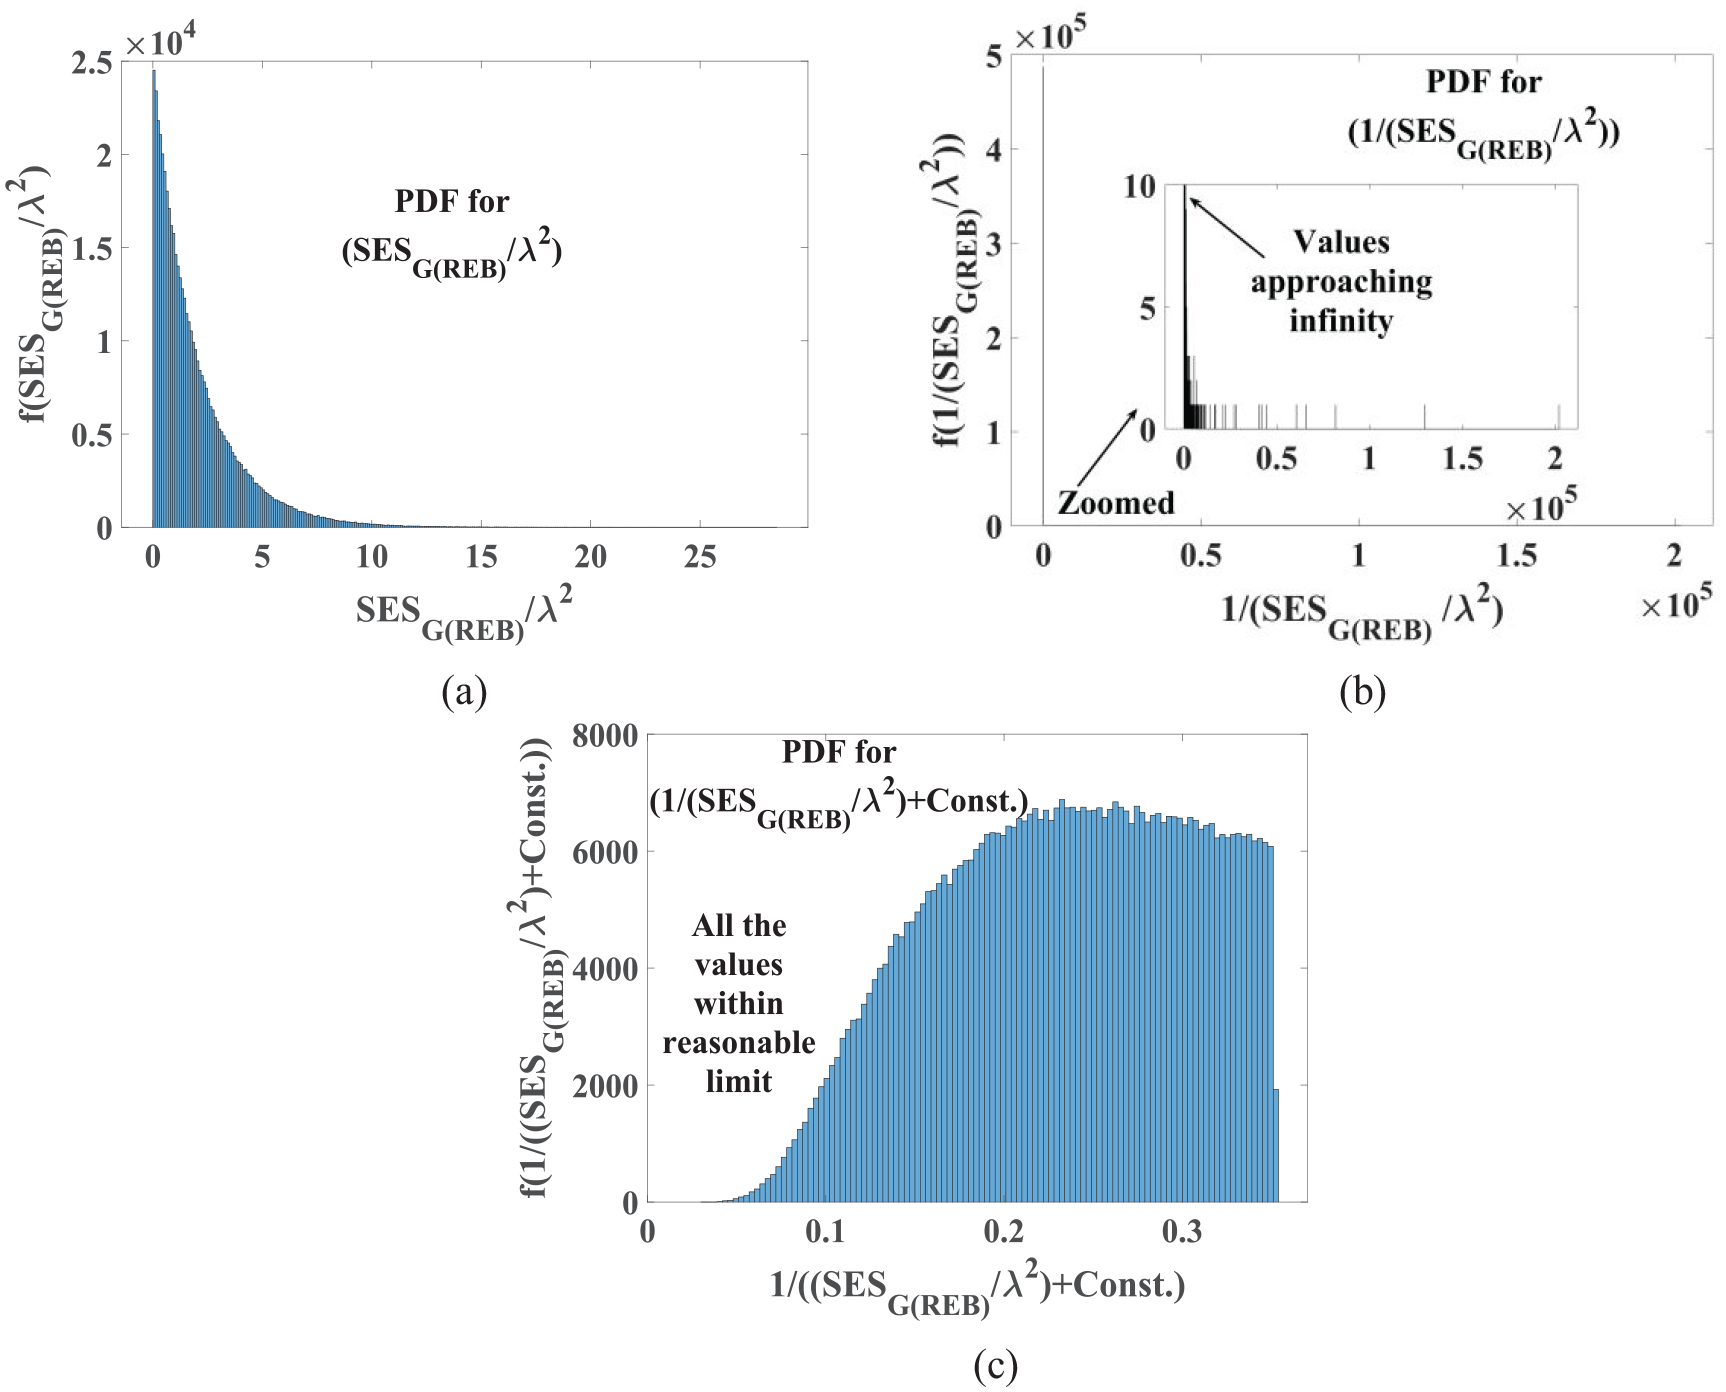
Illustration of
Continuous monitoring of REB health by WSEFE
In a continuous REB health monitoring operation, vibration signals are collected at a fixed time interval while each record is analyzed separately at a time. Finally, total monitoring result is obtained by summing the subsequent analysis result altogether. In this context, referring to the original definition of FE, continuous monitoring of REB health can be obtained by the proposed WSEFE with the help of followings steps and schematically illustrated in Figure 5.
Step 1: At a specific time

here,
Step 2: Corresponding

here,
Step 3:

where
Step 4:
where,

Step 5: Distance between
where
Step 6: Fuzzy function

where
Step 7: Function
where
Step 8:
Step 9:
For a finite N,

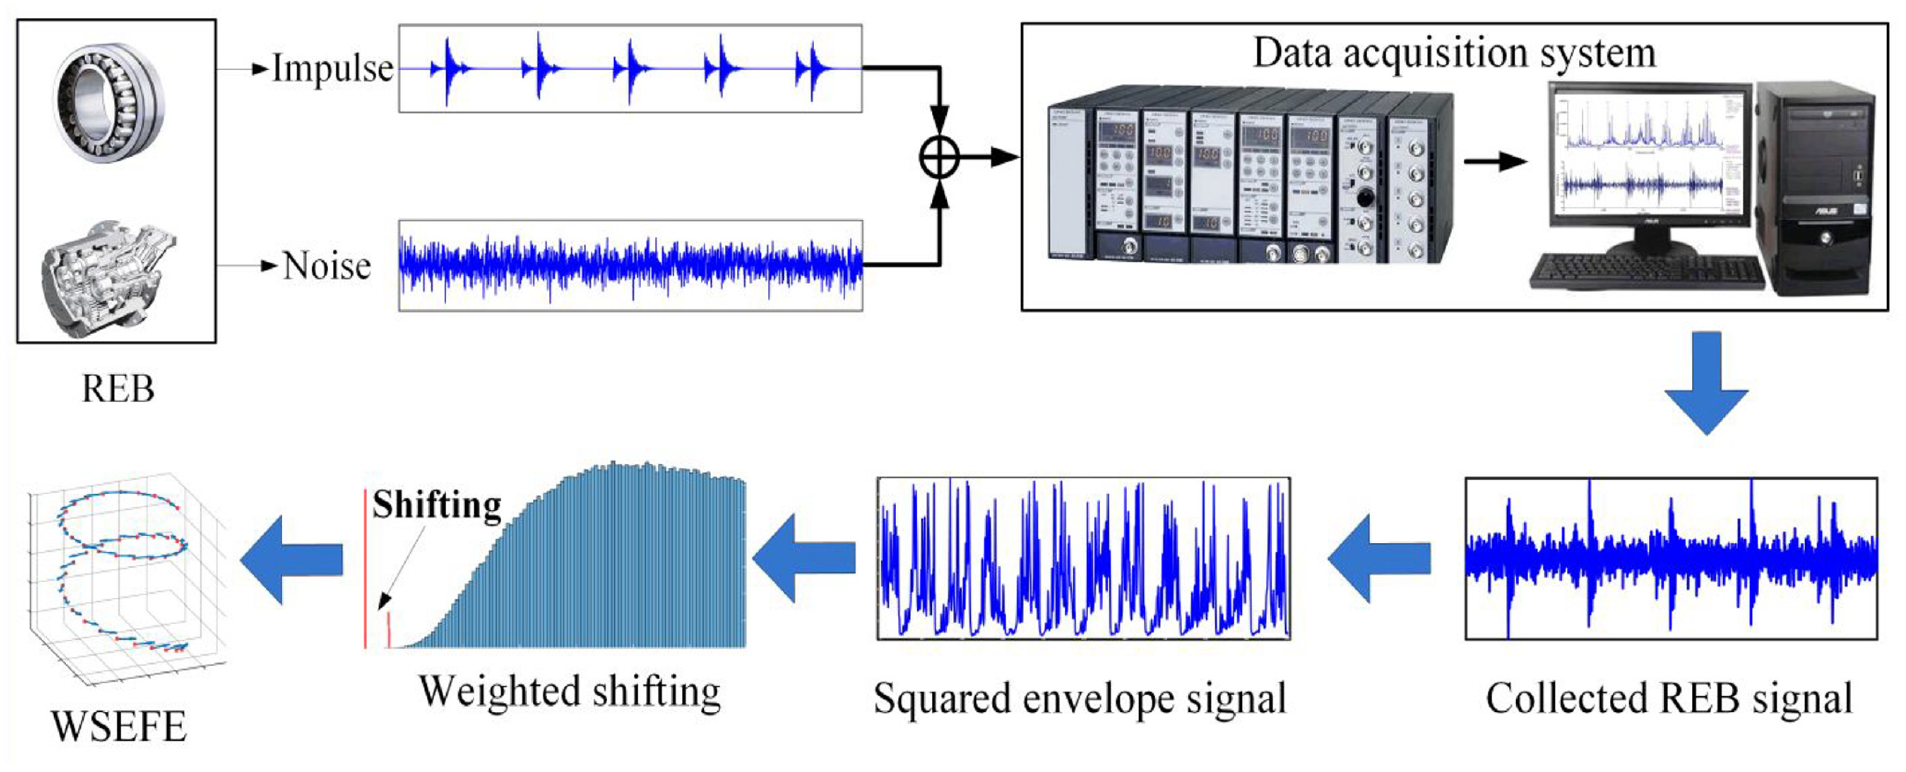
Continuous monitoring of REB health by WSEFE.
Parameter selection
As can be seen from Equation (31), calculation of WSEFE depends of four different parameters. They are: (1) Parameters related to fuzzy exponential function (
Parameters related to fuzzy exponential function
Two parameters related to fuzzy exponential function are: (1) Gradient of the fuzzy boundary (
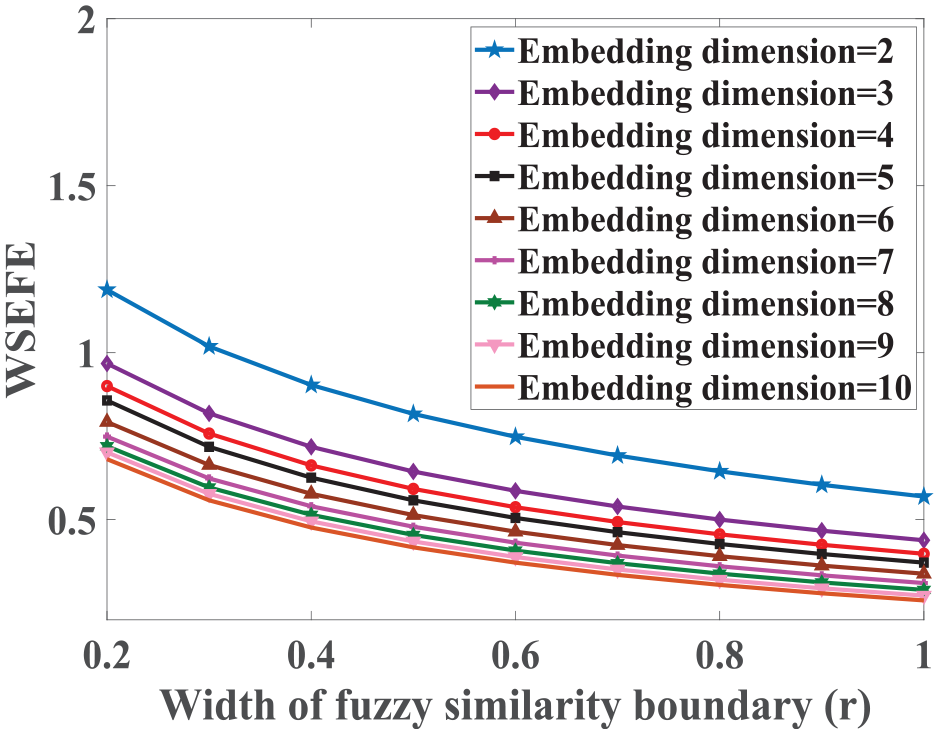
Study of fuzzy similarity boundary selection for WSEFE calculation.
From Figure 6, it can be seen that with the increase of r value, WSEFE converges for different m. However, if the similarity boundary is too broad, there is a possibility of information loss. On the contrary, too small r value will be resulted in salient influence from noise. Based on the study of Chen et al,
17
since standard deviation of the original signal is negligibly influenced by r > 0.5,
17
in this research
Data length (N) selection
For a fixed data length, a lower sampling frequency will lead to a higher period of sampling period and vice versa.
35
A higher period of sampling infers a longer observation time of the REB vibration signal and subsequent inclusion of increased amount of information during WSEFE calculation. In this context, simulation signals are generated under five different sampling rate such as 6, 9, 12, 15, and 18 kHz. as shown in Figure 7. It can be seen that for a data length more than 2000 points, value of WSEFE becomes relatively stable for different sampling frequencies. Moreover, it can be seen that for
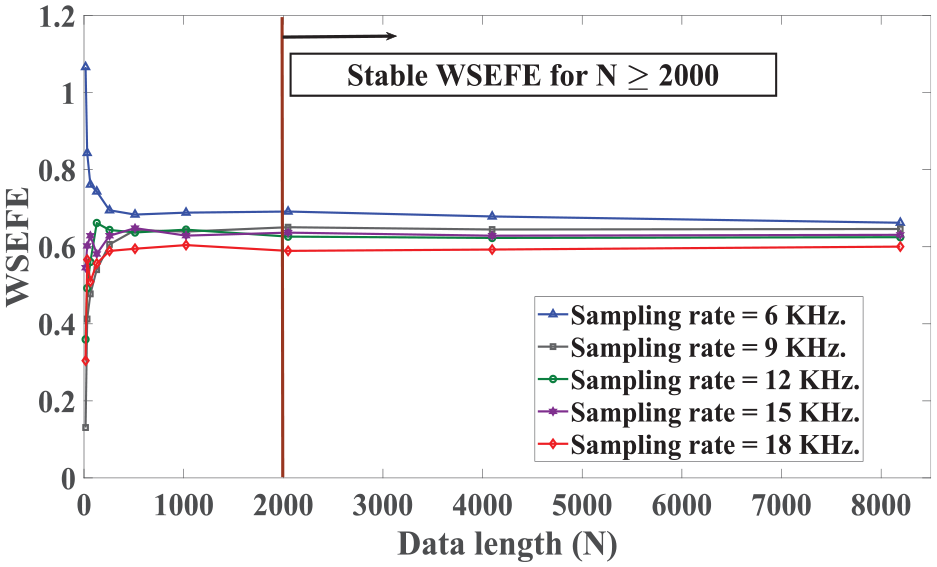
Effect of data length on WSEFE calculation.
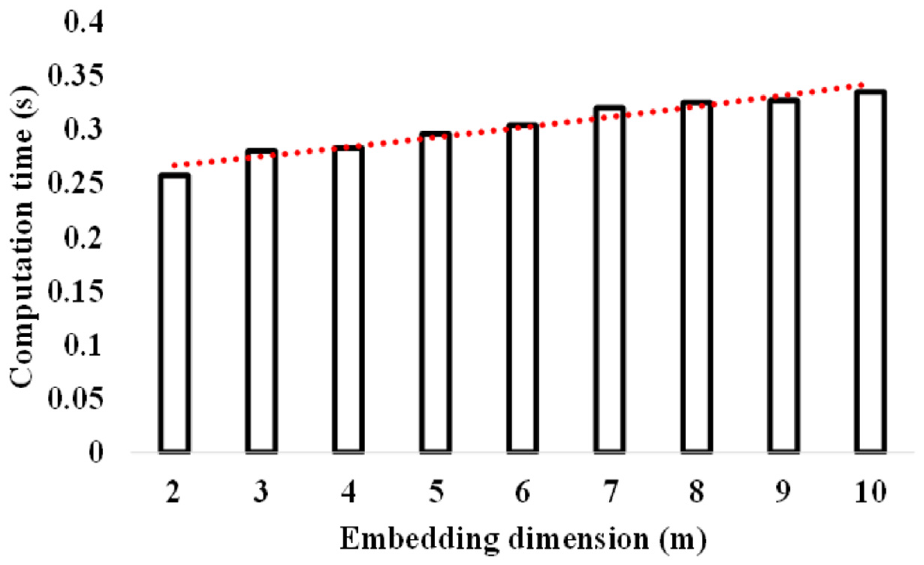
Embedding dimension (m)
Selection of embedding dimension (m) for WSEFE calculation is studied by calculating the WSEFE values for
Study of embedding dimension (m) for WSEFE calculation.
Typically, a higher value of embedding dimension (m) will infer more detailed reconstruction. However, from Figure 8, it can be seen that with the increase of value of m computational cost of WSEFE calculation also increases. A large value of m requires a large value of N (
Performance verification
One simulation case study and two different experimental case studies have been used for verifying the effectiveness of the proposed WSEFE in continuous monitoring of REB health. Performance of WSEFE has been compared with original FE, existing conventional approach, namely PE and improved version of FE, namely MFE. Parameters corresponding to the calculation of FE, PE, and MFE are utilized according to Chen et al., 33 Yan et al., 9 and Li et al. 20 respectively.
Simulated signal-based verification
In order to verify the performance of WSEFE in continuous monitoring of REB health, simulation model described in Equation (13) has been studied under two different noise levels. Noise level has been varied by changing the value of
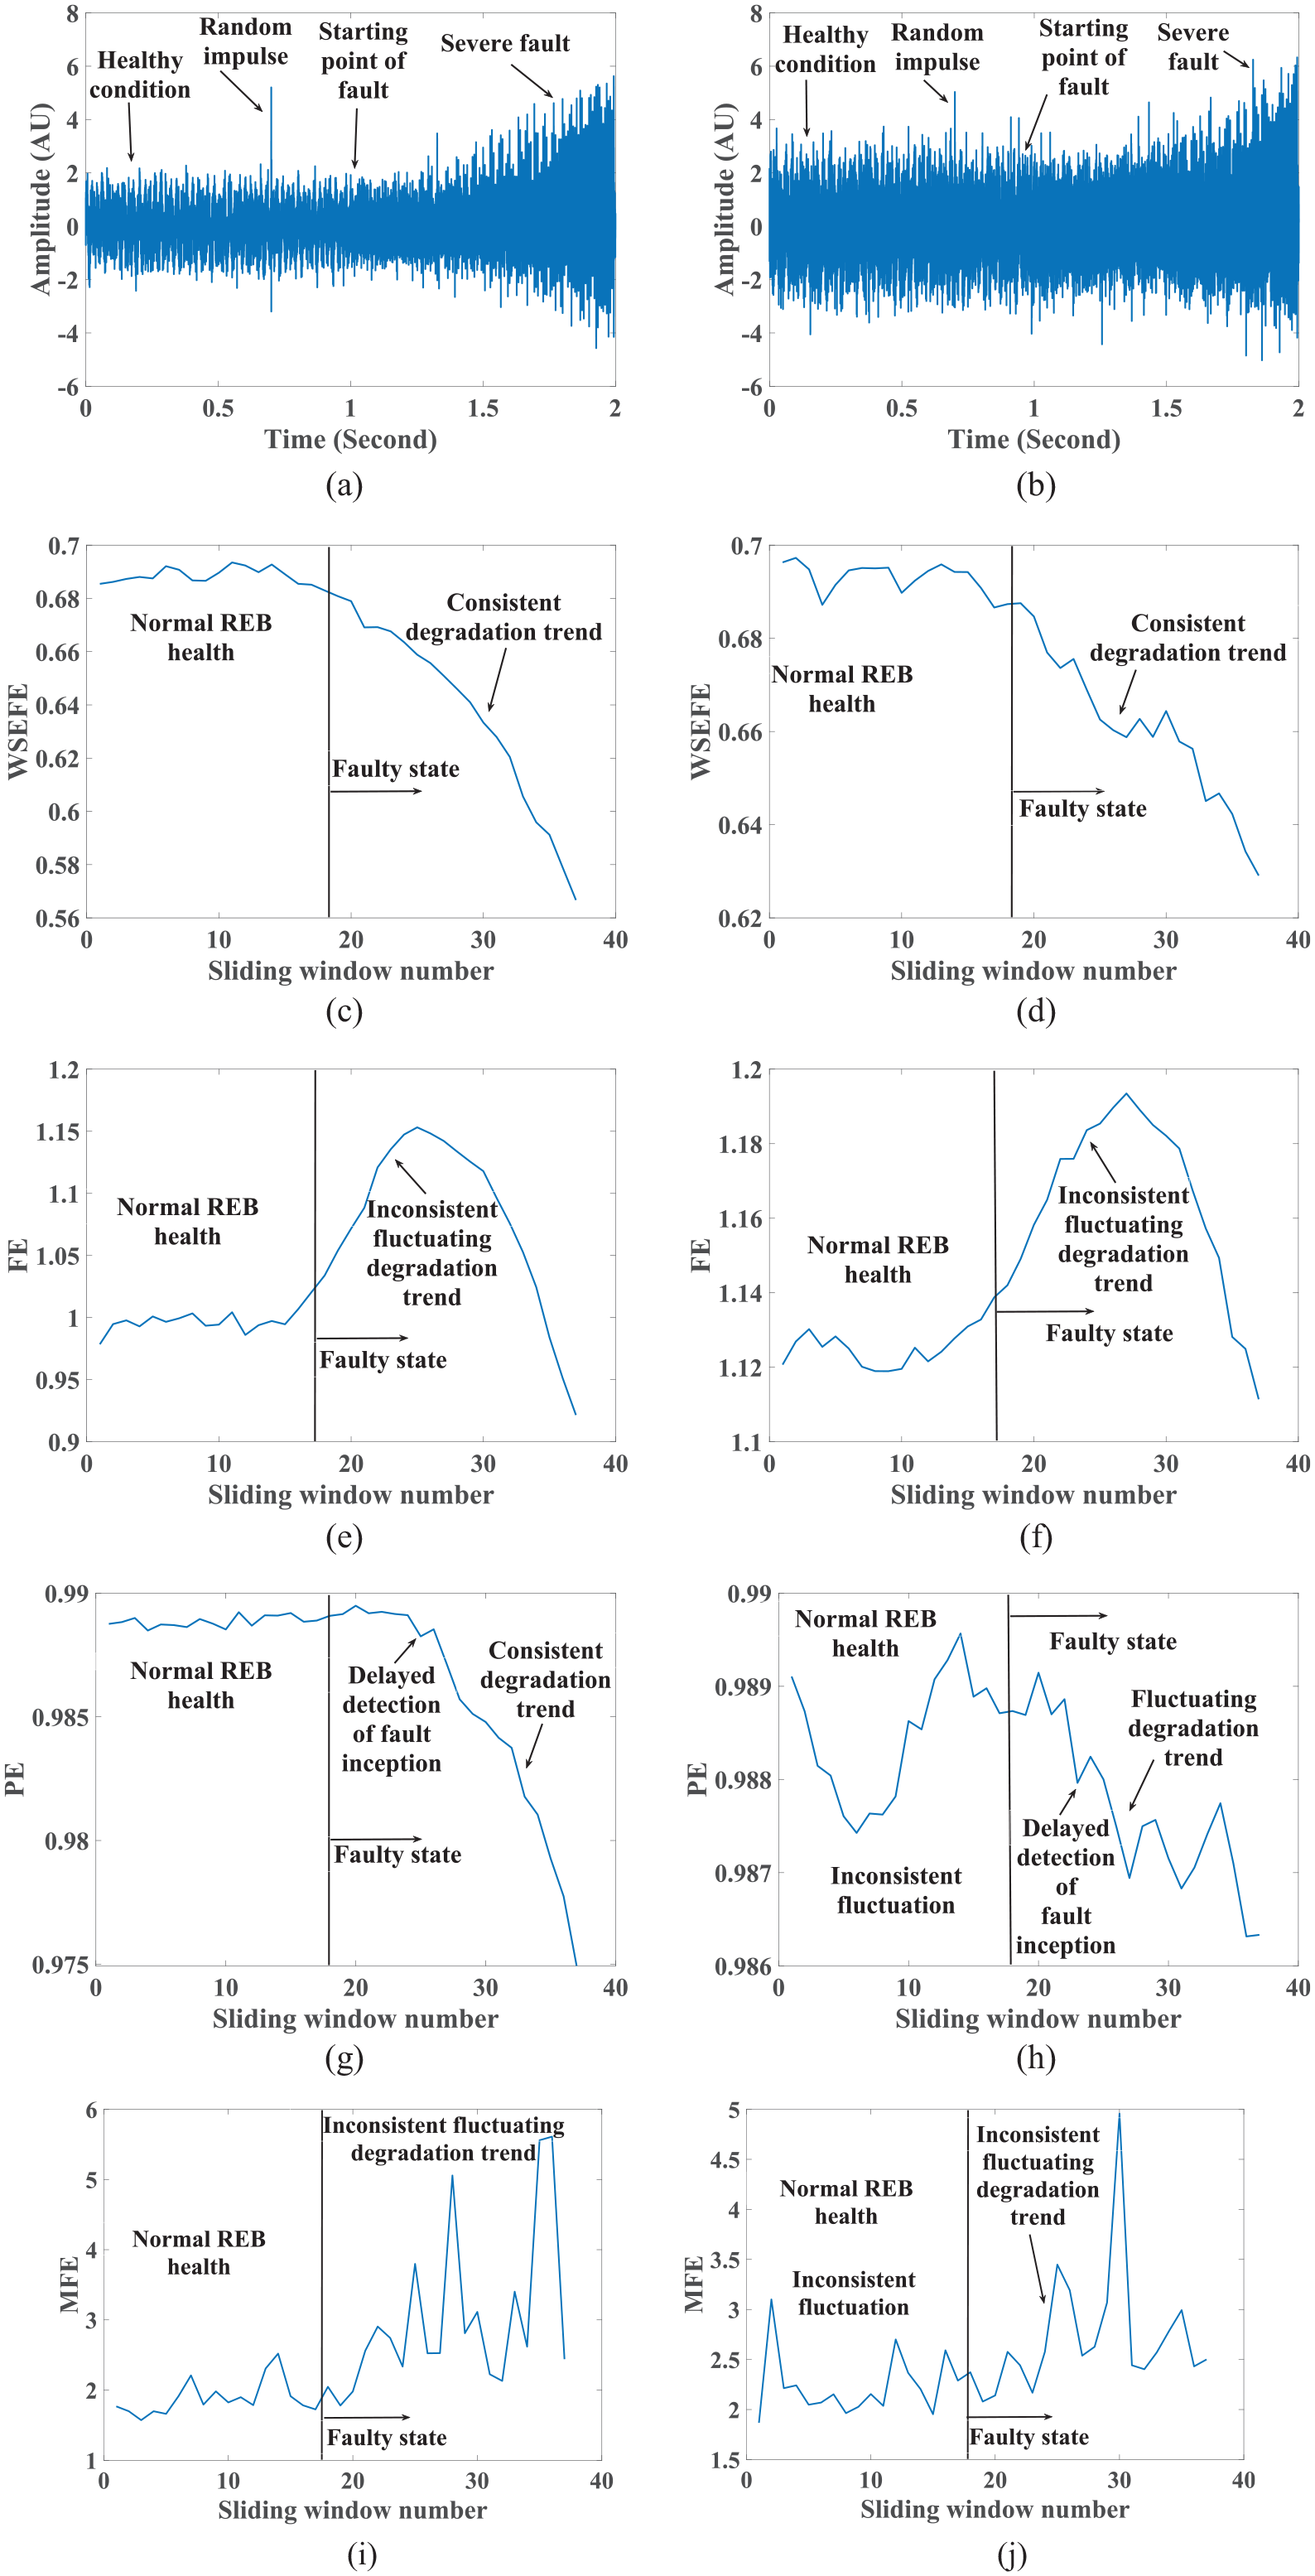
Simulated REB fault mechanism model under varying noisy condition. (a) n(t) = 5 dB SNR, (b) n(t) = 0 dB SNR, (c) monitoring of (a) by WSEFE, (d) monitoring of (b) by WSEFE, (e) monitoring of (a) by FE, (f) monitoring of (b) by FE, (g) monitoring of (a) by PE, (h) monitoring of (b) by PE, (i) monitoring of (a) by MFE, and (j) monitoring of (b) by MFE.
It can be seen from Figure 9 that WSEFE shows an efficient REB health monitoring result for both 5 dB SNR and 0 dB SNR with less fluctuation and consistent tracking of the fault development from the beginning of the fault inception. On the contrary, original FE algorithm shows an inconsistent fluctuating degradation trend in the faulty state of REB at both 5 dB SNR and 0 dB SNR. Even though PE shows a consistent degradation trend for 5 dB SNR, its performance is greatly deteriorated by the increase of noise at 0 dB SNR. Furthermore, PE detects the incepted fault at a delay for both 5 dB SNR and 0 dB SNR. MFE fails to monitor the REB health for both of 0 dB SNR and 5 dB SNR with inconsistent fluctuating degradation trend. The aforementioned discussion validates the applicability of WSEFE under heavy noisy scenario.
In order to further validate the monitoring suitability of WSEFE under different noisy conditions, a quantitative evaluation has been done. Quantitative evaluation of the performance of the proposed WSEFE has been conducted by three widely used measures, that is, (1) Monotonicity; (2) Trendability; (3) Prognosability. 36 Monotonicity infers the corresponding positive and negative trend of a measure by characterizing the irreversible nature of a deterioration process. Trendability facilitates the development of an accurate prognostic model by indicating the similarity degree of measures describing multiple systems of nature. Lastly, prognosability describes a failure threshold considering that a REB failure occurs at a crisp and well-defined degradation level. Total monitoring suitability of each measure in comparison is quantified by summing the aforementioned three performance metrics as shown in Table 2.
Total monitoring suitability of measures in comparison.
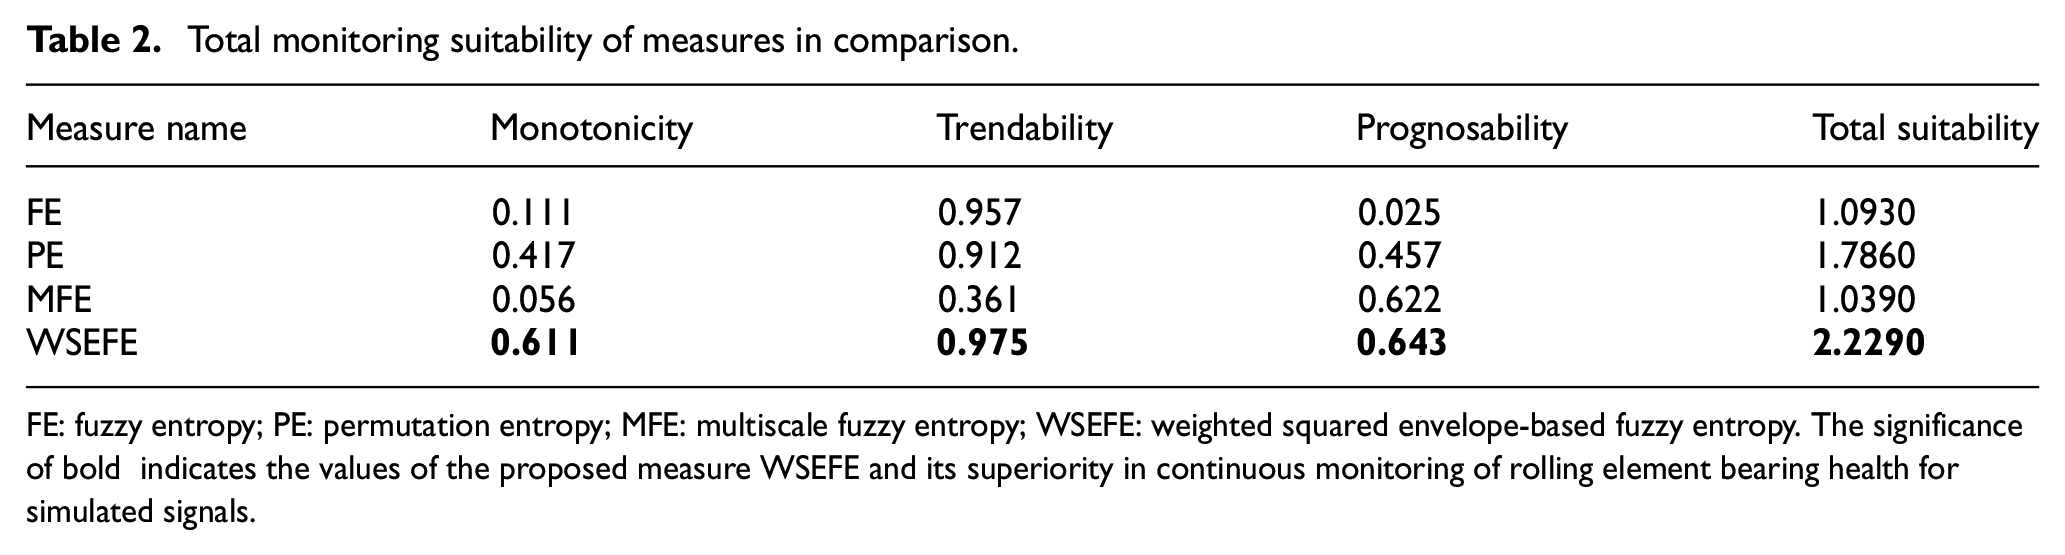
FE: fuzzy entropy; PE: permutation entropy; MFE: multiscale fuzzy entropy; WSEFE: weighted squared envelope-based fuzzy entropy. The significance of bold indicates the values of the proposed measure WSEFE and its superiority in continuous monitoring of rolling element bearing health for simulated signals.
It is seen from Table 2 that WSEFE has the highest total monitoring suitability under different heavy noisy scenarios. Additionally, in terms of suitability of each individual monitoring measure WSEFE also performs best. Hence, it can be said that WSEFE can effectively eliminate the effect of heavy noise in the continuous monitoring of REB health.
Experimental case study-1
In this experimental case study, REB vibration data from center of intelligent maintenance systems (IMS), university of Cincinnati has been used. 37 Experimental equipment and a schematic diagram of the data collection system is shown in Figure 10 as follows.
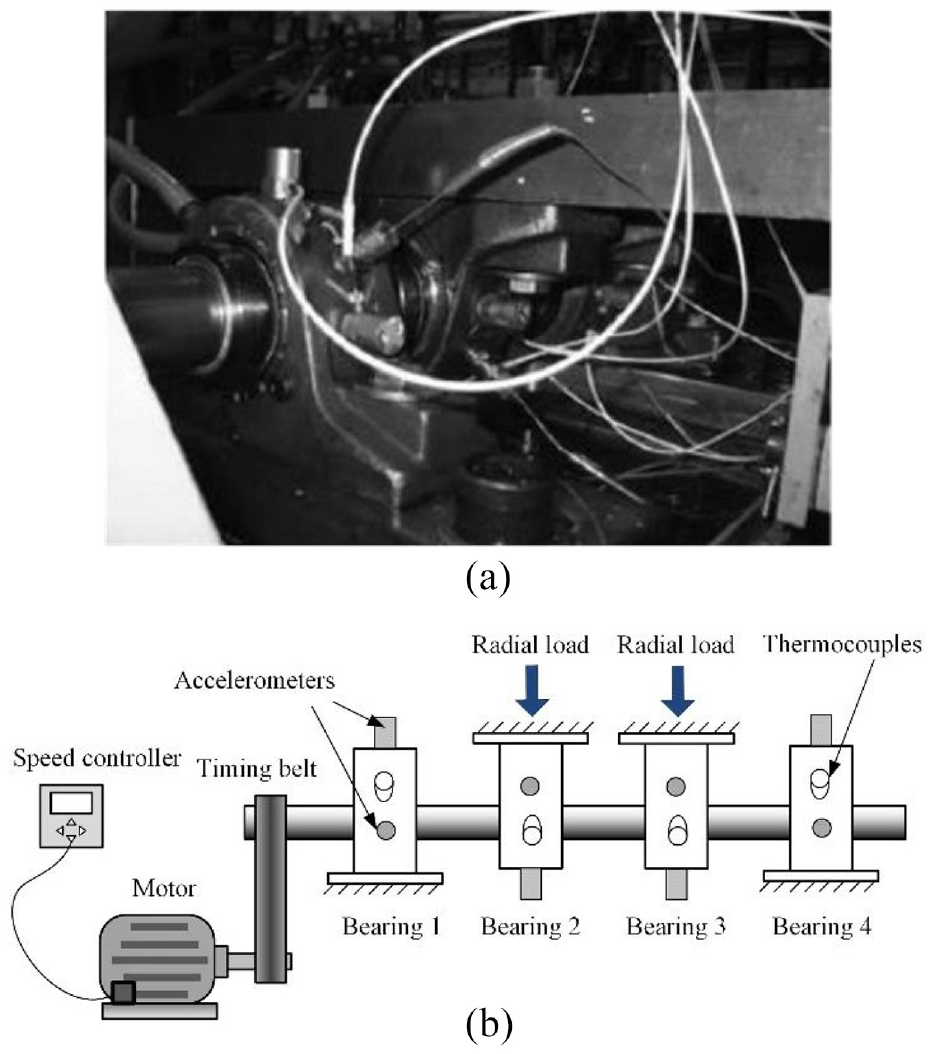
Experimental equipment and a sketch of bearing accelerated life testing system for IMS REB vibration data collection. (a) Experimental Equipment and (b) Sketch of REB accelerated life testing system.
The experimental setup consisted of four Rexnord ZA-2115 bearings mounted on a support shaft. The rotating speed of the experiment was kept constant at 2000 rpm. 6000 lbs radial load was implemented on the bearings by a forced mechanism. Sampling frequency of the data collection was set as 20,480 Hz. Vibration records were collected at an interval of 10 min. A NI DAQ card 602E was used for data collection. A total of 984 records were collected. Upon physical inspection of the bearing at the end of data collection, a naturally generated outer race fault was found. Aforementioned four indices, that is, WSEFE, FE, PE, and MFE have been used to perform the continuous monitoring operation of the analyzed REB as shown in Figure 11.
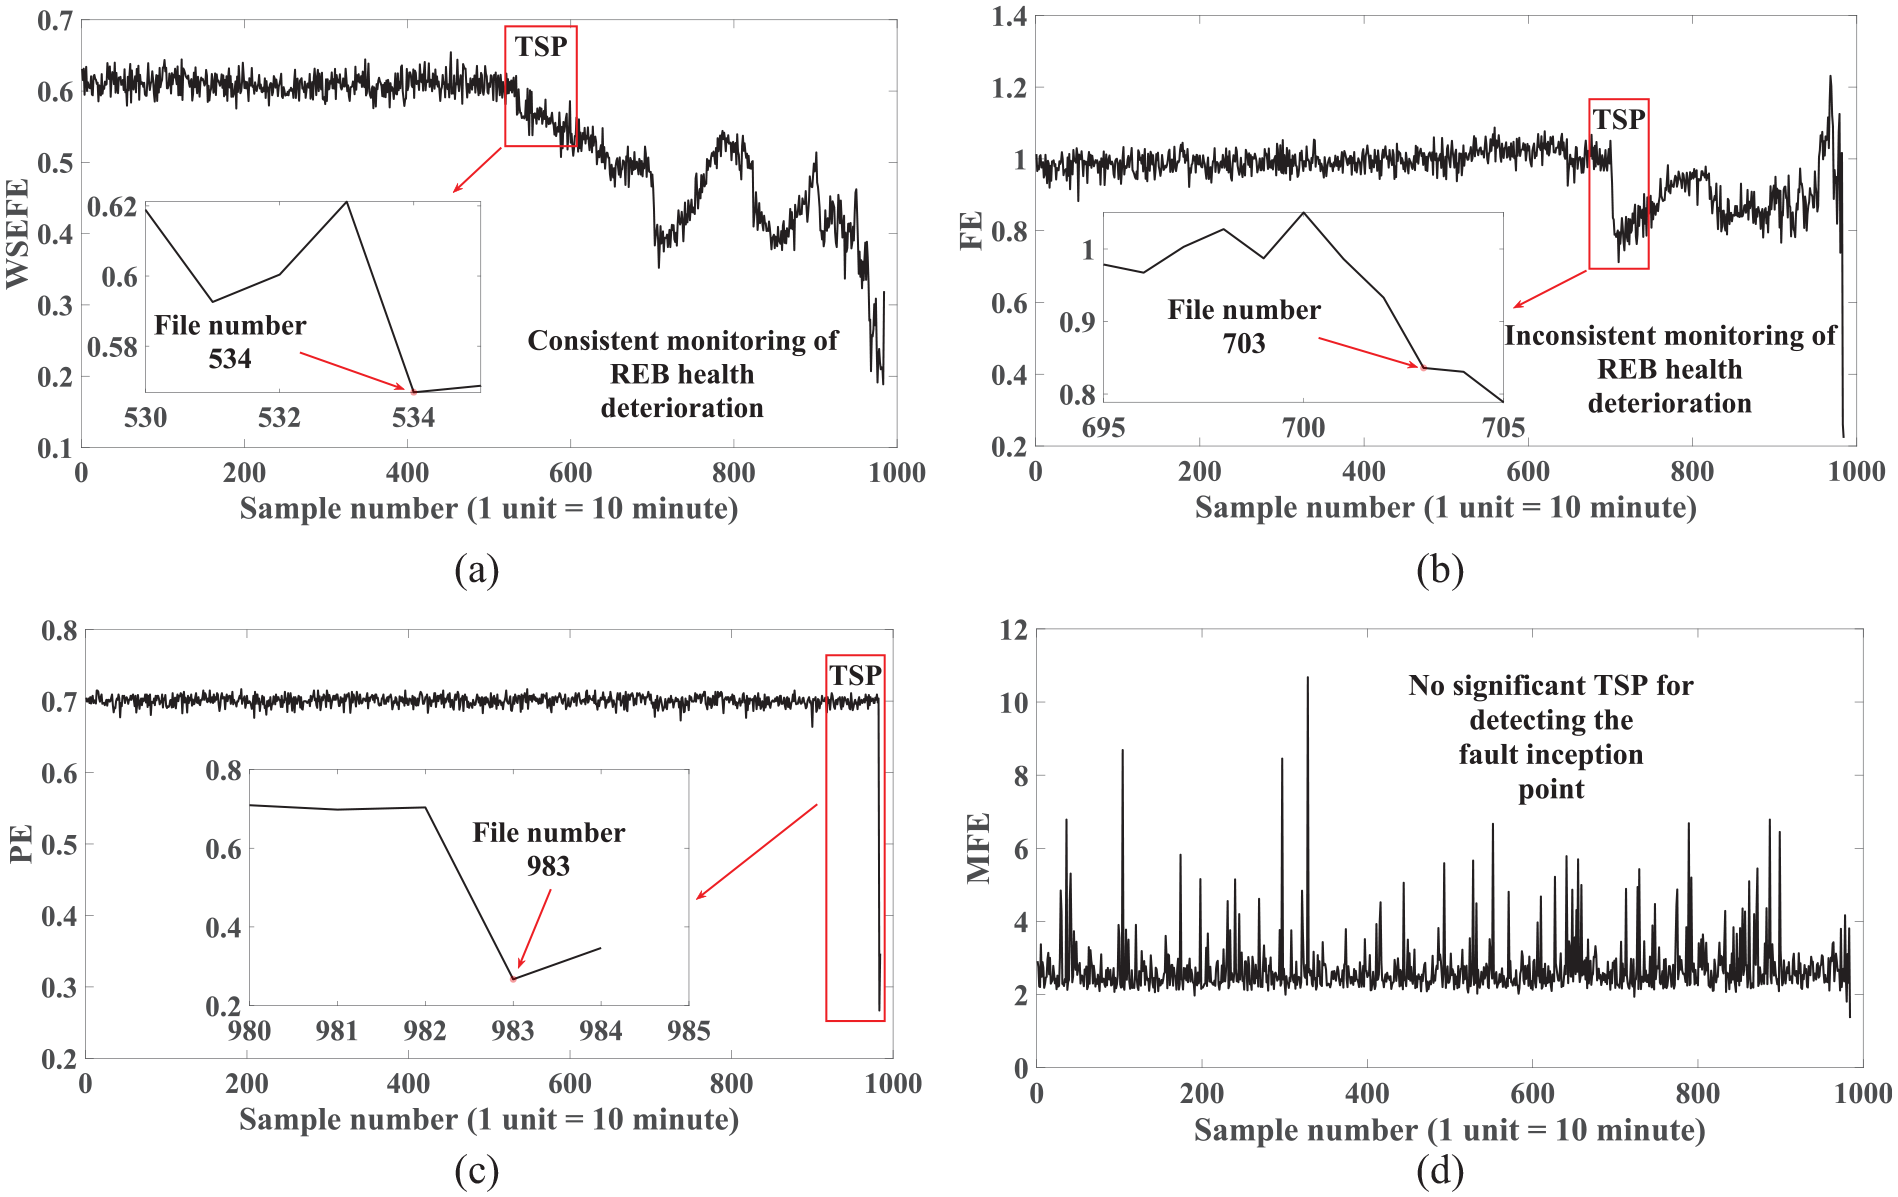
Continuous monitoring of REB by different entropy-based indices. (a) WSEFE, (b) FE, (c) PE, and (d) MFE.
It can be seen from Figure 11 that TSP for bearing fault detection by WSEFE, FE, and PE are at file numbers 534, 703, and 983 respectively. MFE cannot detect any significant TSP for bearing fault. According to the description file provided with the dataset, ball pass frequency for outer race fault (BPFO) is 236 Hz. 37 In order to verify the accuracy of the fault detection, time series representation of 534th file and corresponding envelope spectrum analysis has been shown in Figure 12.
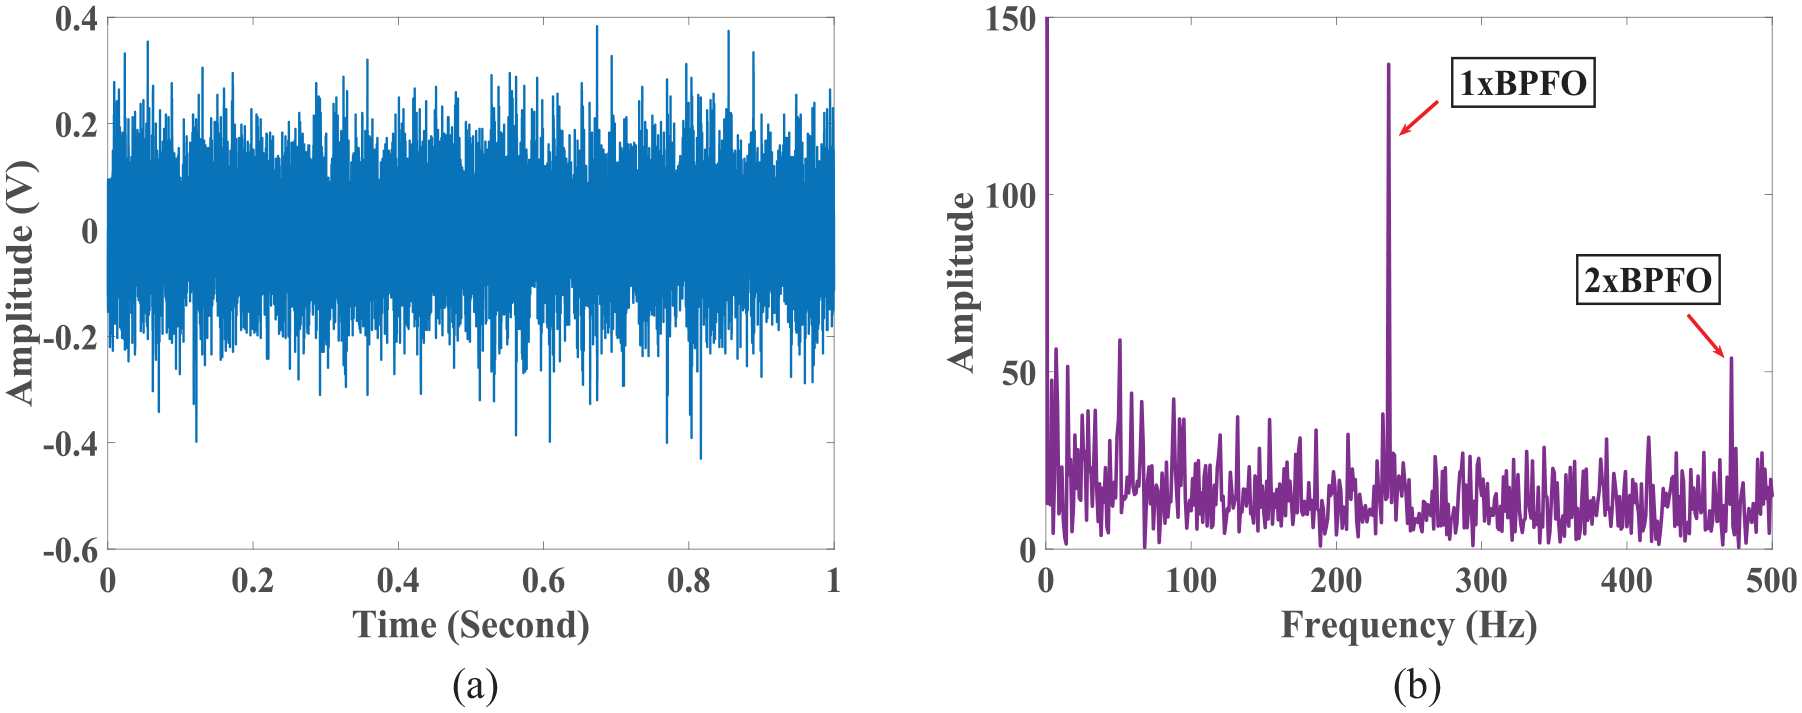
Time series of WSEFE-based TSP file and corresponding envelope spectrum analysis. (a) Time series of TSP file and (b) Envelope Spectrum of (a).
From Figure 12(b), it can be seen that clear peaks of BPFO and its harmonics are present in the envelope spectrum of file number 534. This infers that the proposed WSEFE has detected the fault accurately. Additionally, considering the irreversible nature of physical degradation of REB health, it also infers that WSEFE has detected the fault 1690 and 4490 min earlier than other FE and PE respectively. Furthermore, Figure 11(a) shows a consistent tracking of REB health deterioration by the proposed WSEFE. However, Figure 11(b) demonstrates an inconsistent monitoring by original FE algorithm where at the severe stage of monitoring process FE values greatly increases and become higher than that of healthy condition.
Experimental case study-2
REB run-to-failure data provided by Xi’an Jiao Tong University (XJTU), Xi’an, China and Changxing Sumyong Technology Co. (SY), Zhejiang, China have been used in this experimental case study. 38 Setup for the experimentation and corresponding inner race failure have been shown in Figure 13 as follows.
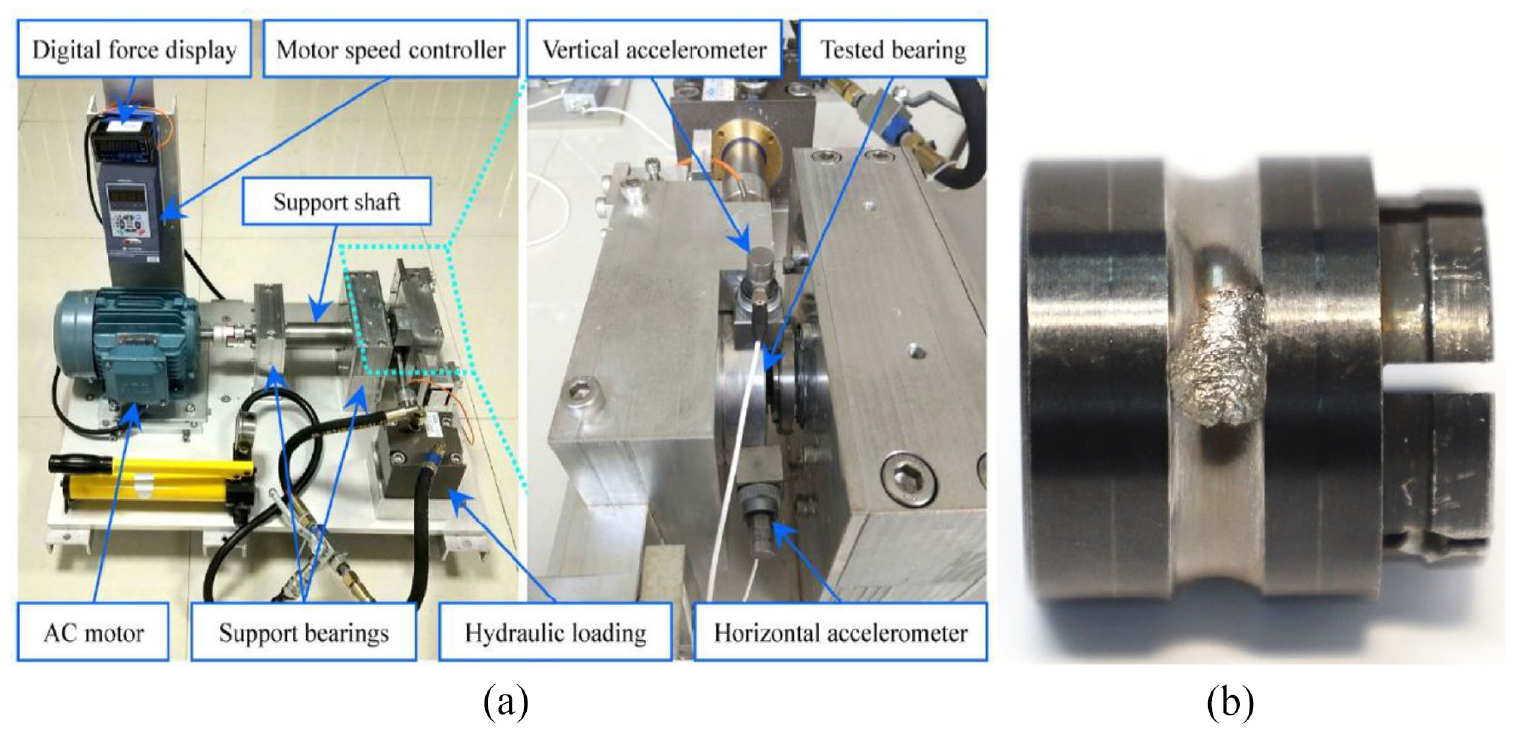
Experimental setup and corresponding inner race failure for XJTU–SY REB vibration data collection. (a) Experimental setup and (b) inner race fault.
From Figure 13, it can be seen that two heavy-duty REBs are used as support REBs and an AC induction motor has been used for driving the REB shaft. A motor speed controller has been used to control the speed of the REB shaft. A 11 KN hydraulic load was exerted on the REB at a rotating speed of 25.6 kHz. Samples were collected at an interval of 1 min. A DT9837 data acquisition module is used for data collection. A total of 491 samples were collected. Upon the physical inspection at the end of data collection, a naturally generated inner race fault was detected on the tested bearing. Continuous monitoring result of the tested REB by aforementioned four indices, that is, WSEFE, FE, PE, and MFE is shown in Figure 14 as follows.
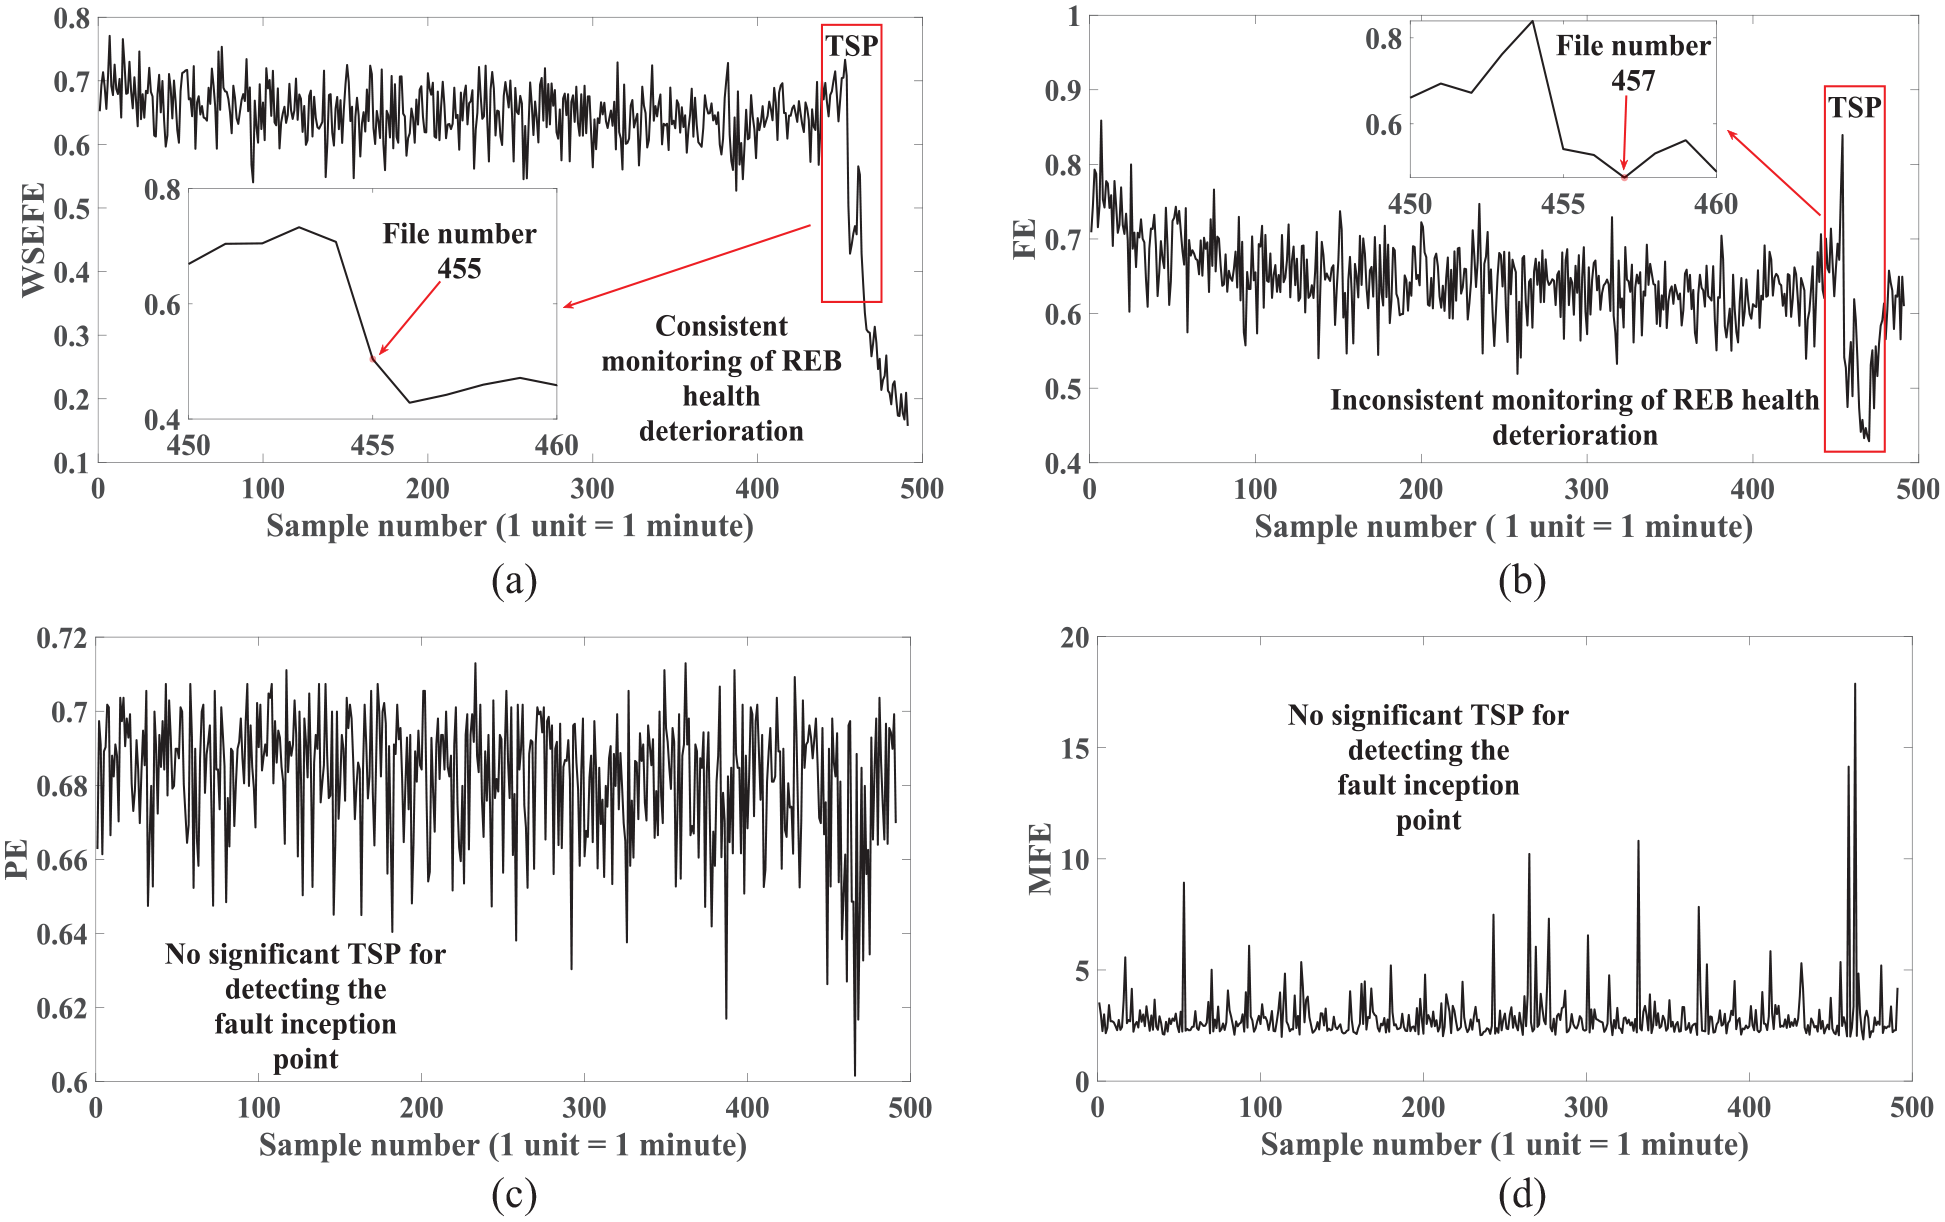
Continuous monitoring of REB by different entropy-based indices. (a) WSEFE, (b) FE, (c) PE, and (d) MFE.
It can be seen from Figure 14 that WSEFE detect the fault at file number 455 while TSP for original FE algorithm is 457. PE and MFE algorithm cannot detect the fault in the whole life cycle of the REB. According to the description file provided with the dataset, ball pass frequency for inner race fault (BPFI) is 184 Hz. In order to verify the accuracy of the fault detection, time series representation of 455th file and corresponding envelope spectrum analysis have been shown in Figure 15.
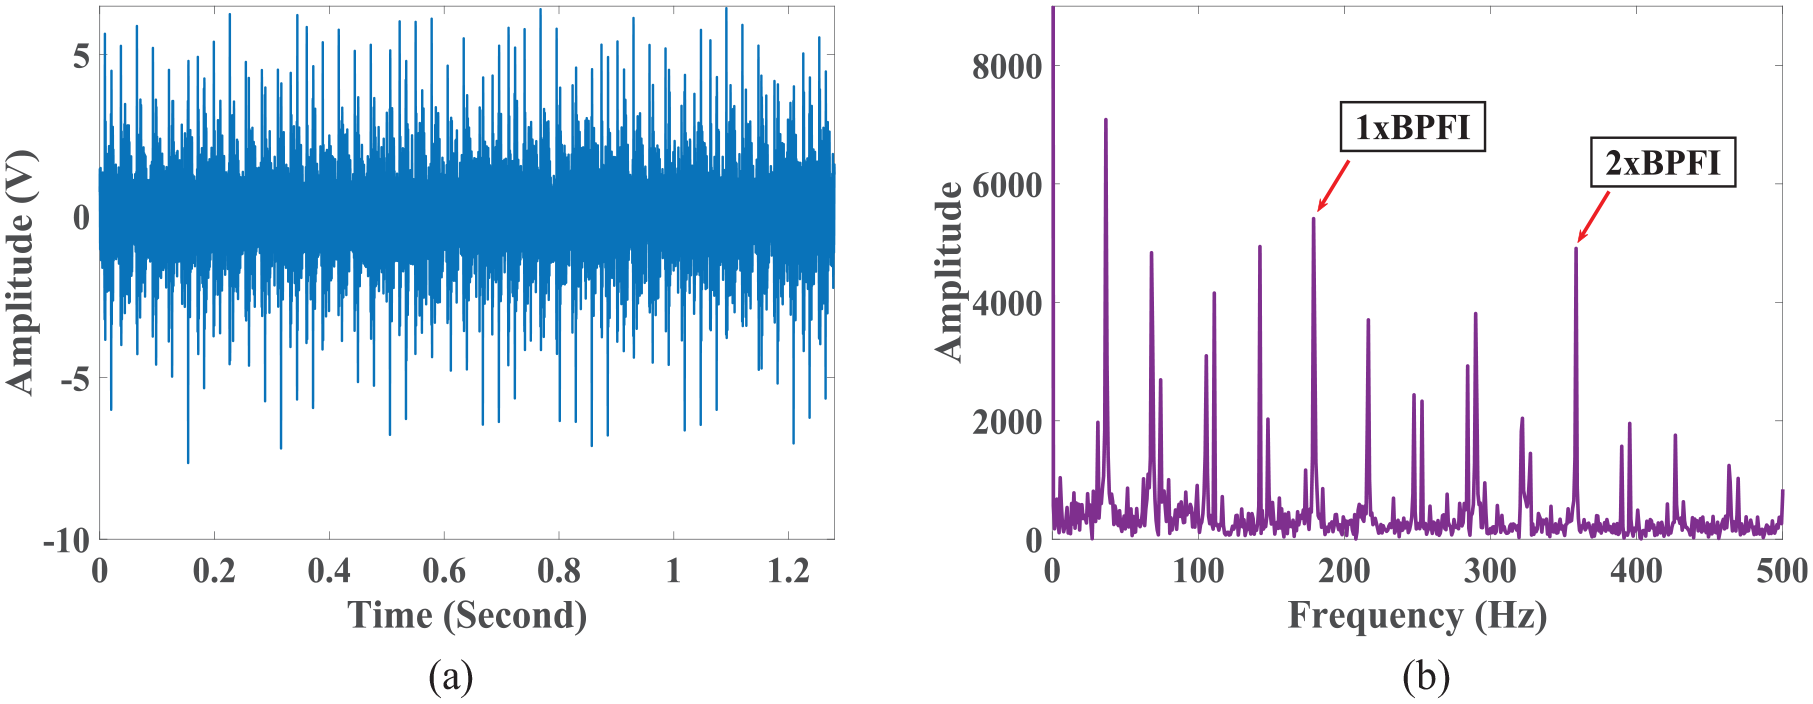
Time series of WSEFE-based TSP file and corresponding envelope spectrum analysis. (a) Time series of TSP file and (b) Envelope spectrum of (a).
From Figure 15(b), it can be seen that clear peaks of BPFI and its harmonics are present at sample number 455. Hence, it can be inferred that the proposed WSEFE has detected the fault accurately. Considering the irreversible nature of physical degradation of bearing health, WSEFE has detected the fault 2 min earlier than original FE algorithm. Similar to experimental case study-1, in experimental case study-2, a consistent monitoring result can be seen from the proposed WSEFE with a great value difference between normal and health deterioration stage after fault inception. However, values of original FE increase greatly toward the value range of healthy bearing from which it is inferred that an inconsistent monitoring of REB health has been made.
Quantitative evaluation for experimental case study
Quantitative performance evaluation of the proposed WSEFE for experimental case studies has been conducted by three aforementioned measures, that is, (1) Monotonicity; (2) Trendability; (3) Prognosability as shown in Table 3.
Total monitoring suitability of measures in comparison.
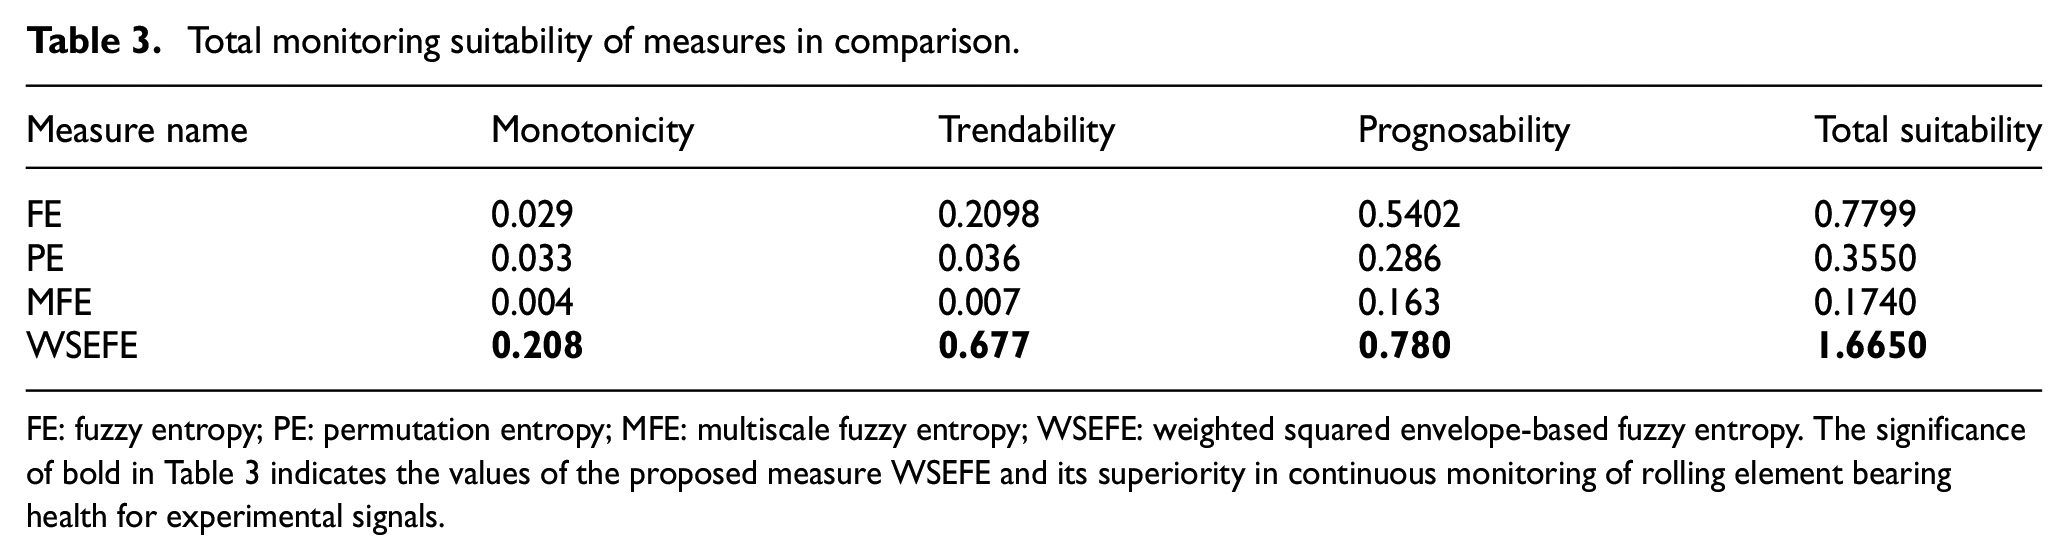
FE: fuzzy entropy; PE: permutation entropy; MFE: multiscale fuzzy entropy; WSEFE: weighted squared envelope-based fuzzy entropy. The significance of bold in Table 3 indicates the values of the proposed measure WSEFE and its superiority in continuous monitoring of rolling element bearing health for experimental signals.
It can be seen from Table 3 that, total monitoring suitability of WSEFE is highest in relation to the other measures in comparison. Moreover, in terms of each individual performance measure, performance of WSEFE is also highest. Hence, it can be said that the proposed WSEFE is the most suitable for continuous monitoring of REB health among the measures in comparison.
Conclusion
Aiming at the weaknesses of original FE algorithm in continuous monitoring of REB health, WSEFE is proposed in this paper. Contrary to original FE algorithm, main novelties of this paper lie in continuous extraction of the transient signal component corresponding to a REB fault and incorporation of the extracted component into FE calculation by weighting the SES of the relevant REB vibration signal. Utilization of SES enables incorporation of the transient fault impulse component into FE calculation while simultaneous weighting of utilized SES supresses the unwanted random noise. Simulation and experimental case studies have been used to verify the superiority of WSEFE over the state-of-the-art FE, PE, and MFE. Simulation case study has verified the suitability of WSEFE application in continuous monitoring of REB health under different heavy noisy scenarios. In addition, qualitative evaluation of the experimental results show that the proposed WSEFE detects the REB fault earlier than other measures in comparison while quantitative evaluation of the experimental results verifies the suitability of the proposed WSEFE for monitoring of REB health in terms of monotonicity, trendability, and prognosability. Being an efficient nonlinear REB health monitoring measure, WSEFE can be a promising tool for researchers in the areas of feature engineering, artificial intelligence, etc.
Footnotes
Appendix A
Declaration of conflicting interests
The author(s) declared no potential conflicts of interest with respect to the research, authorship, and/or publication of this article.
Funding
The author(s) disclosed receipt of the following financial support for the research, authorship, and/or publication of this article: This research is supported by National Natural Science Foundation of China (Grant numbers: 52250410345, 12172290).