
Abstract
Composite structures are widely used for aerospace applications but are prone to barely visible impact damage from low velocity impacts. Guided wave measurements using sparse arrays of distributed sensors provide an important structural health monitoring (SHM) tool for detecting and localizing impact damage in composites. However, the anisotropy of composites needs to be considered as it can affect guided wave propagation and scattering, impacting imaging performance. Improved defect characterization can be achieved by considering the scattering characteristics for the signal processing. Scattering around two different damage types for multiple incident wave directions in a quasi-isotropic carbon fiber reinforced polymer (CFRP
Introduction
Carbon fiber reinforced polymer (CFRP) laminates are being widely employed to reduce the weight of aerospace components whilst improving structural performance. 1 Composite laminates consist of multiple fiber matrix ply layers with high in-plane stiffness and anisotropic material properties. Poor interlaminar strength, however, makes composite laminates prone to damage from low velocity impacts (e.g., from bird strikes or dropped tools). 2 Barely visible impact damage (BVID) consisting of fiber breakage, matrix cracking, and delamination can occur below the laminate surface, significantly reducing strength.2,3 Depending on the thickness of the laminate, damage typically propagates in a cone from the impact location resulting in the characteristic “pine tree” (thick laminates), inverted pine tree (thin laminates) 4 and “butterfly” patterns of delaminations. 5 Further mechanical loads can cause the damage to propagate, reducing structural integrity and potentially leading to catastrophic failure of a component. Therefore, rapid and accurate structural health monitoring (SHM) techniques are required to monitor structural integrity and detect and characterize damage.
Low frequency ultrasonic guided waves generated by lightweight piezoelectric transducers can rapidly interrogate large areas of a structure, and therefore provide a promising in situ SHM solution. 6 Generally, it is desirable to excite a single guided wave mode well below the cut-off frequency of higher order modes as this simplifies signal processing. Low frequency guided waves are particularly advantageous to minimize effects of attenuation in composites. 3 Numerous studies have used the fundamental symmetric S0 mode, as it has the fastest propagation velocity and thus is easy to distinguish experimentally (first arrival). However, the S0 mode does not provide sensitivity for delamination damage at interfaces with zero shear strain. 7 The fundamental antisymmetric A0 guided wave mode, however, is sensitive to damage at all depths 7 and has a shorter wavelength at the same frequency, resulting in improved sensitivity for smaller defects. The A0 mode has been used successfully to detect delamination damage in both experimental and Finite Element (FE) studies.8–10 Fiber reinforced composites have highly anisotropic material properties that impact guided wave propagation. Wave energy tends to be focused along the high stiffness (fiber) directions, resulting in phase and group velocity being directionally dependent 11 and wave skewing to occur. 12 The velocity distribution depends strongly on the stacking sequence of the laminate. 13 Generally, the A0 mode shows less directional dependency compared to the S0 mode in anisotropic composite structures, but still significant enough to impact SHM.
Sparse array imaging, using a distributed sensor network, provides a cost-efficient in situ SHM solution. Various imaging algorithms for sparse arrays of distributed sensors have been developed to localize damage, the majority of which require baseline subtraction data. Clarke et al. 14 demonstrated that environmental conditions can have a significant effect on baseline signals, and the subsequent performance of imaging algorithms. Wang et al. 15 developed delay and sum (DAS) imaging for isotropic structures, for which the group velocity is the same in all directions. Hall et al. developed minimum variance (MV) 16 and multipath imaging. 17 These algorithms adaptively weigh signals based on prior knowledge of the defect. This results in improved imaging compared to DAS with fewer artefacts. However, MV imaging requires prior knowledge of the scattering behavior of a particular defect in all directions. Scattering information for a defect can be summarized using 2D scattering matrices, where the respective wave amplitude at each combination of incident and scattered direction is recorded.18,19 The performance of sparse array imaging algorithms is impacted by material anisotropy. 20 Williams et al. demonstrated the robustness of minimum variance distortionless response (MVDR) imaging in a quasi-isotropic composite plate by using directional velocity distribution to weigh the damage probability index. Bao et al. 21 developed the model-based modified MUSIC algorithm to account for material anisotropy. Ostiguy et al. 20 compared the performance of several imaging methods for detecting damage in a unidirectional composite laminate and found that whilst some methods are robust for mild anisotropy, severe anisotropy needs to be considered in the imaging algorithms.
Impact damage is complex and often multi-modal in composite laminates. 4 Ply layer separation, otherwise known as delamination, causes the most severe strength reduction and therefore is a critical failure mode. 22 Several studies have focused on characterizing the major delamination in an impact damaged region. 8 Mode conversion and scattering occur when guided waves interact with a delamination. As guided waves enter a delaminated region, waves propagate in each of the sub-laminates. Multiple reflections back and forth within the sub-laminates occur, forming standing waves. 9 This results in increased ‘trapped’ amplitude on top of the delamination, which has been observed both numerically and experimentally.23–27 The wave trapping phenomena can be exploited to detect delaminations and arrival times of multiple reflections can be used to estimate delamination size. 9 At the exit of the delamination, the waves propagating in the sub-laminates recombine, resulting in a forward and back scattered component. 13 The amplitude of forward scattered waves depends on the phase difference between the waves in each sub-laminate, which is influenced by delamination size, shape, and thickness of the sub-laminate (i.e., delamination depth). 28 When a delamination is located at an asymmetric depth, a high trapped amplitude can be observed on top of the thinner sub-laminate. 10 Delaminations located toward the mid-plane experience less wave trapping but have a higher scattered wave amplitude. 29
Specimens containing artificial delaminations, created by placing a film between the ply layers during manufacturing, are often used to study guided wave scattering in composites. This enables the size, location, and depth of damage to be controlled. To avoid the requirement for multiple specimens with permanent damage for the development and testing of SHM algorithms, magnets, placed on opposite sides of a structure, are easily removed from a specimen and have been used in several studies to simulate damage.18,30–31 For example, Williams et al. 18 experimentally investigated the scattering directivity around magnets mounted on a quasi-isotropic composite panel using sparse array and noncontact laser measurements. Magnets provide a simple and cost-effective method to experimentally simulate damage in composites. The influence of anisotropy on scattering directivity around a magnet, however, has not been studied numerically for composites.
Anisotropy of individual ply layers, and the layup of the laminate as a whole can influence propagation and scattering directivity of guided waves. Scattering patterns have been found to depend on the layup sequence, even for laminates with the same number of ply layers. 29 Fiber steering effects result in energy of the S0 mode being focused along the laminate fiber directions, resulting in higher incident and scattered amplitudes in these directions. 32 Several studies have investigated scattering directivity of the A0 mode at a delamination numerically.33–35 However, relatively few have validated numerical simulations experimentally on the studied damage cases. Murat et al. 33 observed strong forward scattering for both square and circular delaminations. Delamination size was found to impact the amplitude of scattered waves. Pudipeddi et al. 34 and Ng and Veidt 35 found that delamination depth had a significant effect on the amplitude and directivity of scattered waves. The influence of directionality (incident wave direction) on scattering directivity of the A0 mode around delaminations in composite laminates should be ascertained.
This contribution aims to investigate the impact of material anisotropy and directionality on guided wave scattering around damage in a quasi-isotropic CFRP panel. Scattering of the A0 mode around an artificial insert delamination and permanent magnets is investigated for multiple incident wave directions through both noncontact laser measurements and full 3D FE simulations. The scattering patterns at the two damage types are analyzed and compared. The paper is organized as follows. Firstly, details of the specimen, and noncontact laser measurements are presented, followed by details of the FE models. Energy focusing and measured angular distribution of wave amplitudes in an undamaged laminate is discussed. Scattering results for the delamination and magnet damage cases are then presented, respectively. 2D scattering matrices are calculated for each damage and angular dependence on scattering discussed. Implications for anisotropy influence on sparse array SHM imaging is considered.
Experimental measurements
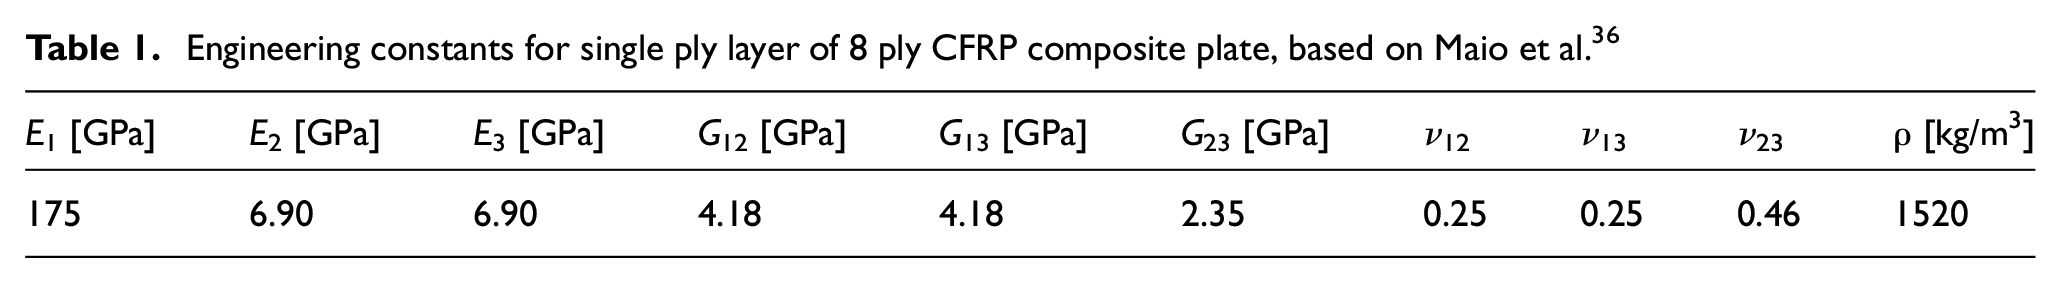
Measurements were performed on an eight-ply quasi-isotropic CFRP panel with symmetric layup [−45/45/90/0]s. The specimen was manufactured using unidirectional pre-preg plies (nominal thickness 0.2 mm) and manual layup, with dimensions of 600 mm × 600 mm × 1.6 mm. The nominal material properties of individual ply layers are given in Table 1. A circular polytetrafluoroethylene (PTFE) film insert (diameter 15 mm, thickness 0.02 mm) was placed between the second and third plies (depth 0.4 mm) at the center of the plate during manufacturing to produce an artificial delamination. The presence and shape of the delamination was verified by ultrasonic C-scan and detached plies were indicated by an ellipse-shaped crown. 36 The nominal dimensions of the delamination were estimated to be 20 mm × 16 mm.
Engineering constants for single ply layer of 8 ply CFRP composite plate, based on Maio et al. 36
Piezoelectric transducers (lead zirconate titanate (PZT) disk, PI Ceramic PIC-255, wrap-around electrode, diameter 10 mm, thickness 0.25 mm) were bonded to the surface of the composite plate using cyanoacrylate glue. Transducers were placed 100 mm from the delamination center in the 0°, +45°, −45°, and 90° directions respectively, to measure the scattering for different incident wave directions. A single transducer was excited using a 5-cycle sine wave modulated by a Hanning window at 50 kHz center frequency using a programable function generator (Agilent 33220A). The excitation signal was amplified to 25Vpp (Krohn-Hite 7602M wideband amplifier) before being applied to the transducer. A laser vibrometer (Polytec OFV-505 sensor head, OFV-5000 vibrometer controller) was used to measure the velocity of the out-of-plane displacement at the plate surface. The laser head was attached to a scanning rig, allowing for horizontal and vertical scanning parallel to the specimen. Retroreflective tape was applied to the plate to improve the laser beam reflection and thus signal-to-noise ratio. Time signals were filtered using a band pass filter with cut-off frequencies of 25 and 75 kHz respectively. The signals were recorded using a digital storage oscilloscope and averaged 20 times before being saved to a PC for further analysis in MATLAB.
Initially, a circle of points, 80 mm radius centered on a single transducer was scanned in 2° increments to determine the amplitude of the excited wave in all directions in an undamaged region of the plate. Scattering measurements were then performed on top of the delamination region. A 40 mm × 40 mm grid of points centered on the delamination was scanned in 1 mm steps. A circular scan with radius 30 mm was performed in 2° increments. Measurements were repeated for each incident wave direction.
Permanent neodymium magnets (NdFeB, Type N42, diameter 20 mm, thickness 2 mm) were placed on each side of the plate, in an undamaged region, shown schematically in Figure 1. Set honey was applied to the magnets to couple them to the plate surface 37 and the reflective tape under the magnets removed to improve coupling (Figure 1(a) inset). Honey couplant was found to give a higher and more consistent scattered signal amplitude than ultrasonic gel couplant or dry coupling the magnets to the plate surface. PZT transducers were placed 100 mm from the magnet center in the 0°, 45°, −45°, and 90° directions. A single transducer was excited and a 30 mm circular scan was performed in 2° increments centered on the magnet. A baseline scan was performed before the magnets were applied and was repeated after the magnets were removed. Measurements were repeated for each incident wave propagation direction.
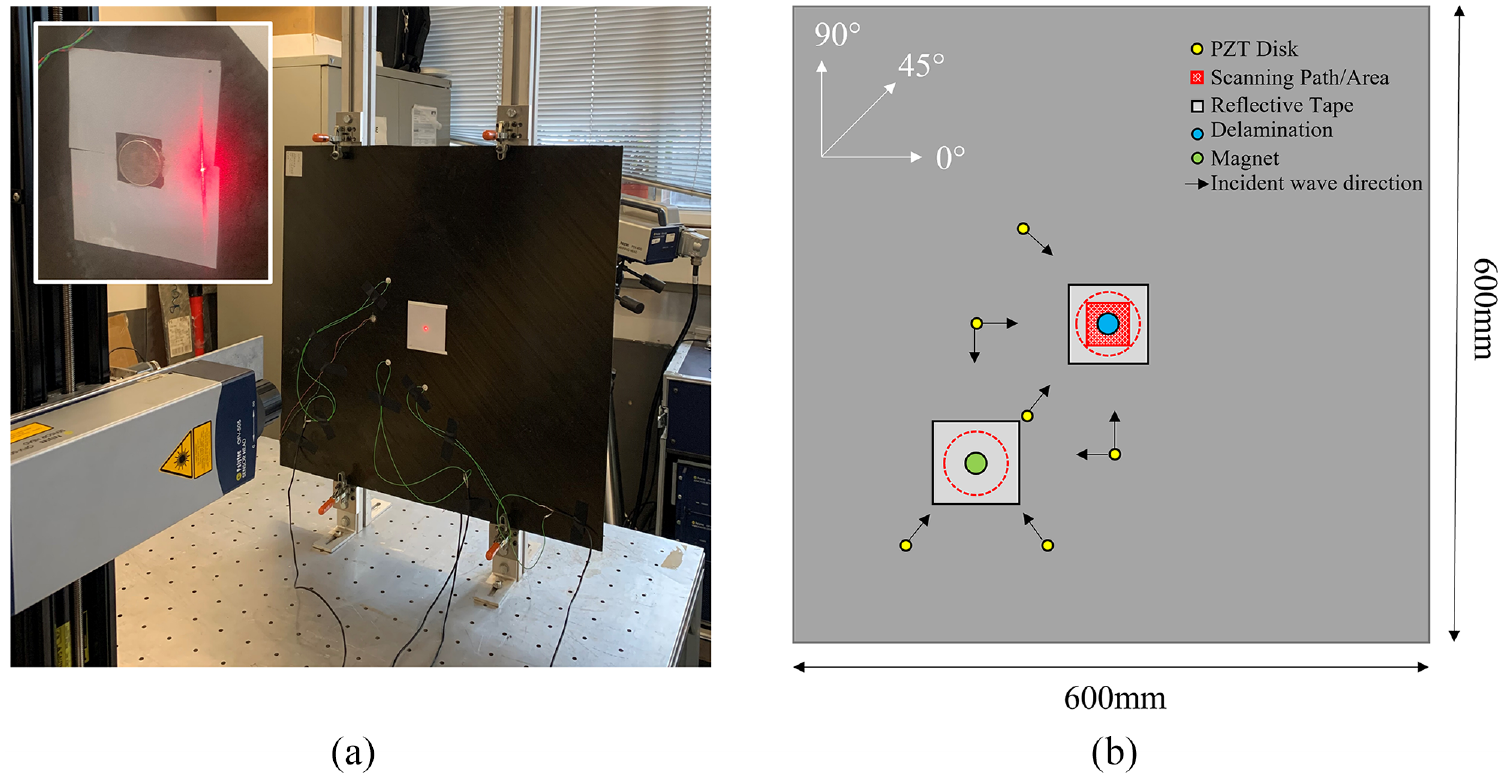
(a) Photograph of experimental setup for delamination measurements on CFRP plate. Inset: Close-up photo of magnet placed on undamaged region of the laminate and (b) schematic of damage and transducer locations. Direction of arrows indicate incident wave direction transducer was used for. Red dotted lines/regions indicate scanning locations.
Finite element modelling
Full 3D FE simulations of a 600 mm × 600 mm ×1.6 mm quasi-isotropic CFRP plate were carried out in ABAQUS/Explicit. A model input file, specifying parameters and geometry, was generated in MATLAB before being imported into ABAQUS 2018 for analysis. Each ply layer was modelled as a single layer of elements (0.2 mm thickness) with unidirectional material properties as given in Table 1. The orientation of the material properties of each layer was defined to produce the stacking sequence of the specimen ([−45/45/90/0]s). Eight node solid brick elements with reduced integration and hourglass control (C3D8R) were used. The element size was 0.5 mm × 0.5 mm × 0.2 mm and the time increment was chosen as 50 ns to achieve stable simulations. 38 These parameters gave sufficient numerical convergence to accurately model incident and scattered waves in undamaged regions of the plate (i.e., away from the damage location) as discussed in more detail in Hervin et al. 39 A uniform mesh was generated as it has been shown to reduce numerical dispersion when simulating wave propagation. 40 Stiffness proportional (Rayleigh) damping was incorporated to model wave attenuation. The damping coefficient was set to β = 30 ns. An out-of-plane force was applied to a single node to excite the A0 mode with a 50 kHz 5-cycle sine wave modulated by a Hanning window as in the experiments. The simulation time was 30 ms for all simulations. Each simulation took approximately 4 h to run on 32 CPUs of a shared memory Linux computer.
A circular zero volume delamination (diameter 20 mm) was incorporated into the model by overwriting existing elements at the delamination location. New nodes connected to one side of the plate were defined over a square area with approximate dimensions of the delamination. A node-to-node tie constraint was applied to form the edges of the circular delamination, interpolated onto a Cartesian grid. This procedure can be used to define arbitrary shaped delaminations and is discussed in more detail in Hervin et al.
39
A 60 mm grid of measurement points, centered on the delamination, was defined and history output requests for the out-of-plane displacements were recorded at each node. From this a 40 mm × 40 mm grid and 30 mm circle can be selected and interpolated during analysis to match the experiments. The excitation node was defined 100 mm from the delamination center, initially in the 0° direction and then varied to 90°, −45°, and 45° to match experiments. It should be noted that delamination depth has been shown to influence the magnitude and directivity of scattered amplitudes.33–35,39 However, in general, the overall scattering behavior at each depth was found to be similar (large forward lobe and small backscattered lobes). For this study the delamination depth was set to 0.4 mm (between second and third plies) to match the experimental specimen. Baseline simulations containing no delamination were performed for each incident wave direction. The Fast Fourier Transform (FFT
The baseline plate model (no delamination) was modified to incorporate permanent magnets and is illustrated in Figure 2. Initially, an additional set of nodes was defined in a circular region (diameter 20 mm) on the front and rear faces of the plate. The model was then imported into ABAQUS CAE to model magnets mounted on the plate. Two cylindrical parts (diameter 20 mm, thickness 2 mm) were defined. A node-to-surface tie constraint was defined between the circular node sets on the plate and the magnet surface, as illustrated in Figure 2(a), ensuring no relative motion between the plate and the magnet. Nominal material properties of NeFeB were assigned to the magnet parts as given in Table 2. History output requests were identical to the delamination simulations and a circle of measurement points could again be interpolated during analysis as shown in Figure 2(b).
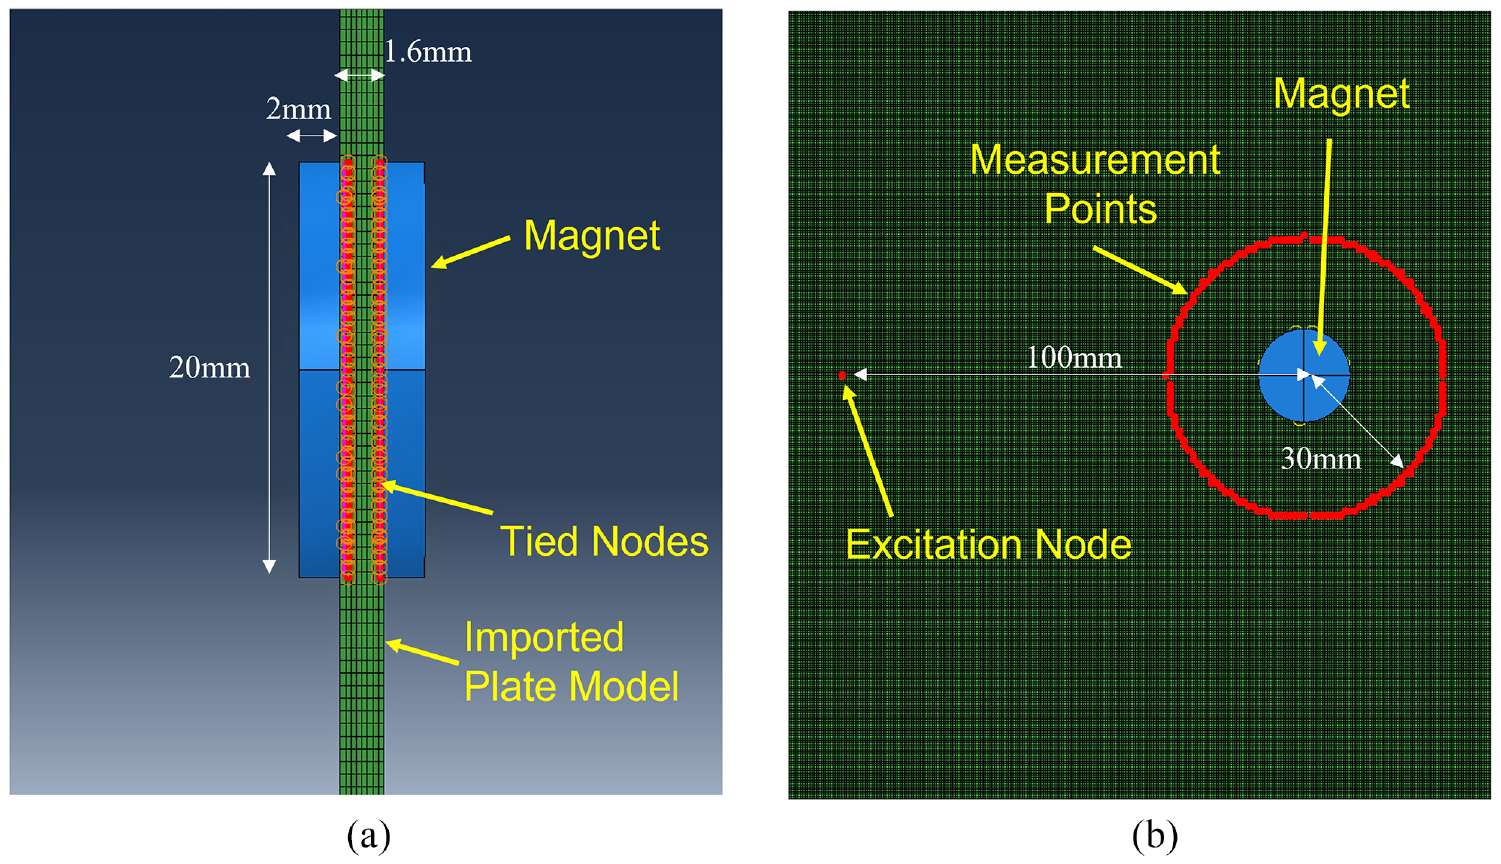
(a) Cross section view of the plate with magnets and tied nodes highlighted and (b) excitation and measurement locations for magnet model.
Material properties for magnets (NdFeB).
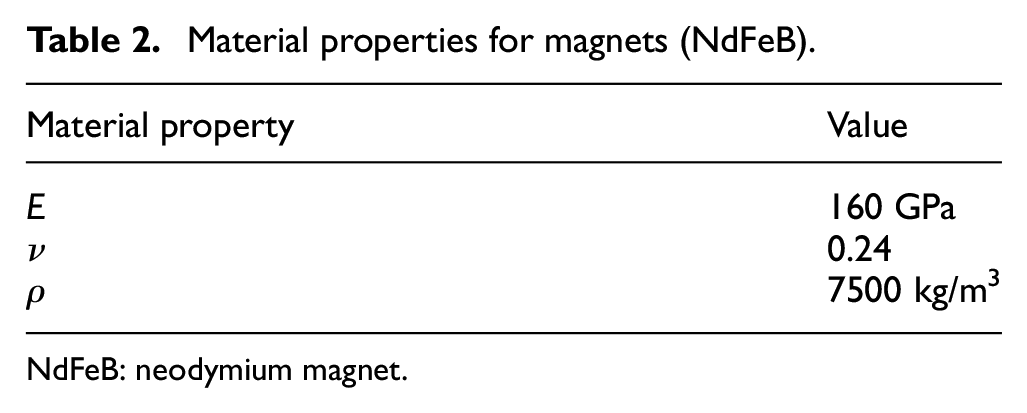
NdFeB: neodymium magnet.
In addition to the models described above, an additional undamaged plate simulation was created to quantify the amplitude variation of the excited guided waves depending on the propagation direction. History outputs were recorded around a circle of measurement points (radius 80 mm, 2° increments) centered on the excitation node to determine the incident wave amplitudes in all directions.
Results and discussion
Wave propagation in undamaged quasi-isotropic laminate
The variation of incident wave amplitude with propagation direction around one of the transducers was investigated first. The wave amplitude (magnitude of FFT at center frequency 50 kHz) was calculated on a circle for both experiment and simulation and is shown in Figure 3. Increased amplitude can be observed in the +45°/−45° directions, corresponding to the fiber directions of the outer ply layers of the laminate. This indicates that wave energy is focused along the outer ply layers, consistent with results reported in literature.13,32 Despite the quasi-isotropic stacking sequence, the strong directivity in the ±45° directions means that the incident wave propagation for this particular layup (eight plies) is more similar to that of a cross-ply plate. The experimental measurements show similar increased amplitude in the ±45° directions (approximately, factor 2), however the pattern is not as symmetric as the FE results and there is approximately 10% variation between measured and predicted amplitudes in the 225° and 315° directions. This could be influenced by the lack of uniformity of the coupling of the PZT to the plate, or potential local variations in the material properties, while the FE results are idealized and therefore perfectly symmetric. An additional peak in the 90° direction can be observed in the experiments, which is likely due to the connection between the wire and wrap-around electrode at this orientation. Overall, the undamaged plate FE simulation shows reasonable agreement with the experimental measurements. The incident (excited) wave for this composite layup is directionally dependent and therefore anisotropy needs to be considered when studying scattering around damage.
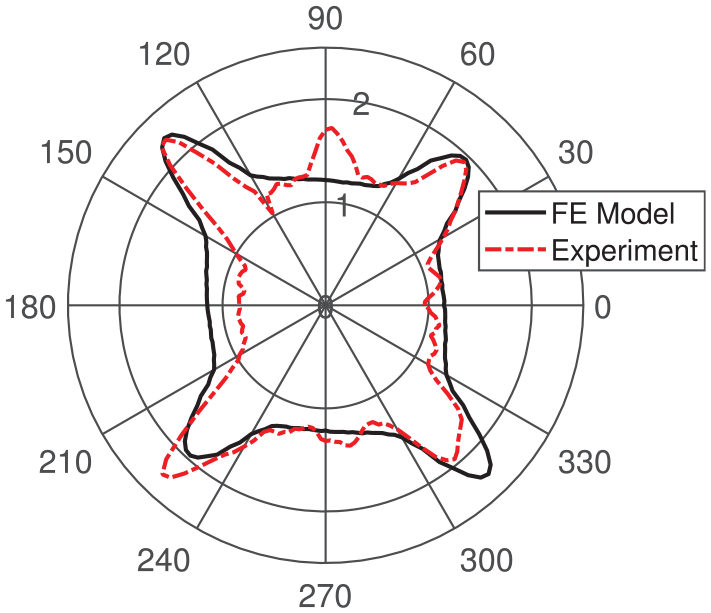
Measured and FE simulated normalized FFT magnitude at 50 kHz around excitation (80 mm radius circle, 2° increments), undamaged composite laminate.
Scattering at a delamination
The guided wave scattering at a delamination for multiple incident wave directions was investigated. The 2D wavefield images in Figure 4 show the FFT magnitude at 50 kHz for a 40 mm × 40 mm grid centered on top of the circular delamination region (approx. 20 mm diameter) for incident wave directions 0°, 90°, −45°, and +45°, respectively. All simulation amplitudes were normalized with respect to the amplitude of the incident wave in the 0° direction at the plate center (0 mm, 0 mm) obtained from the baseline simulation. Experimental amplitudes were normalized with the same factor for three of the PZTs, as an estimate of the incident wave amplitude in the 0° direction. For one incident wave direction (+45°) the measured amplitude was approximately 20% lower, likely due to the coupling of that PZT to the plate, and therefore was normalized with a different factor. The normalization factors were applied to the amplitudes for both the 2D scattering images (Figure 4), and the polar plots (subsequent figures).
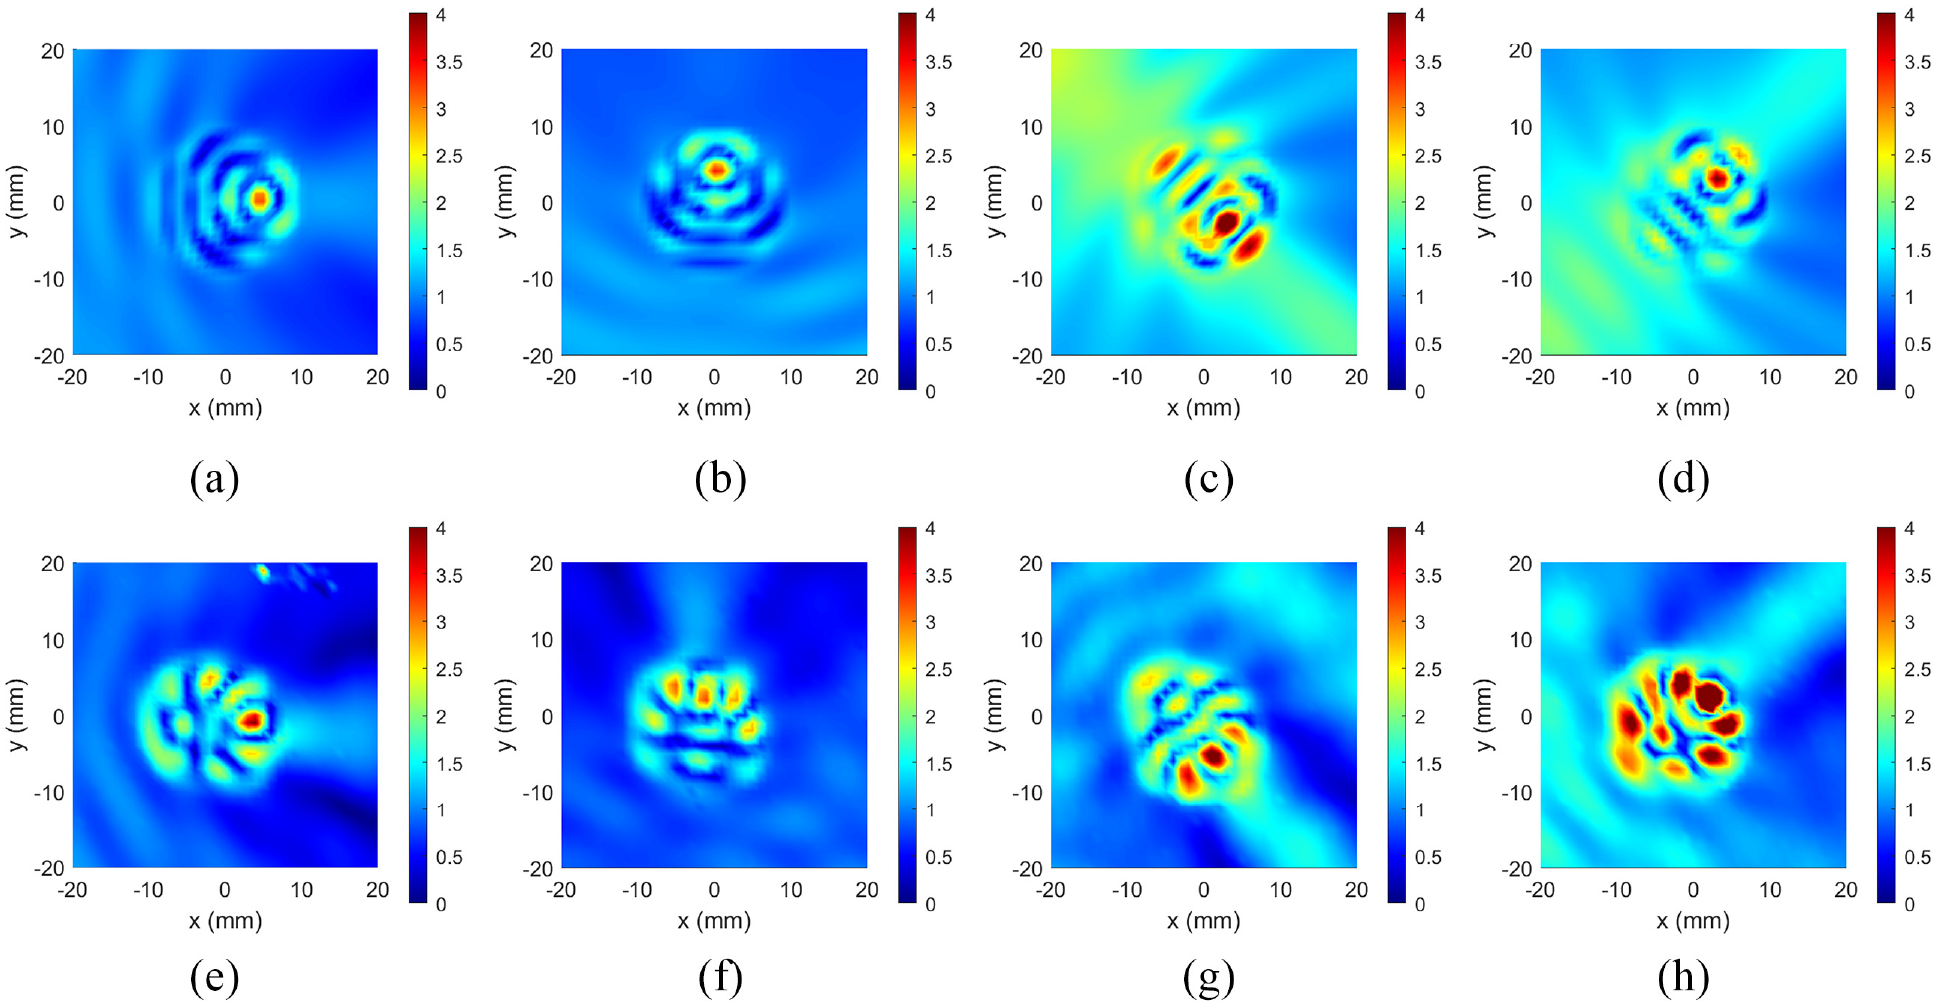
2D wavefield images (normalized FFT magnitude, 50 kHz); 40 mm grid centered on delamination. Top row: FE simulation: (a) 0°, (b) 90°, (c) −45° and (d) +45° incident wave directions. Bottom row: Experiments: (e) 0°, (f) 90°, (g) −45°, and (h) +45° incident wave directions.
For the 0° incident wave direction (Figure 4(a) and (e)), the incident wave propagates from left to right. Both experiment (Figure 4(e)) and simulation (Figure 4(a)) show increased amplitude on top of the delamination indicating that wave trapping occurs. A forward scattered wave with increased amplitude is observed at the delamination exit. Shadow regions either side of the forward scattered lobe are present in the experimental measurements, but less pronounced in the FE simulations. Some interference between the incident and backscattered waves is indicated by the crescent shape around the left side of the delamination. The interference pattern on top of the delamination is different for the numerical and measured cases for all directions. This is likely due to the exact, slightly oval delamination shape not being modelled. However, previous work 39 indicates that the exact delamination shape has only a limited effect on scattered waves in the undamaged region of the laminate at a distance from the delamination, which are of interest in a SHM context.
Each of the experimental scans shows trapped amplitude on top of the delamination and a forward scattered component with shadow regions on either side. However, the shadow regions are not observed that clearly in the FE results, and no forward scattered component is visible in the 90° direction FE simulation (Figure 4(b)). Higher trapped and forward scattered amplitudes are observed for the diagonal incident wave directions (−45° direction (Figure 4(c) and (g)), +45° direction (Figure 4(d) and (h))), compared to the 0° and 90° incident directions. The highest amplitude observed for the −45° incident wave direction corresponds to the fiber orientation of the outermost ply layer of the laminate, with +45° corresponding to the second plies. This indicates that energy is being focused along the outer ply layers.
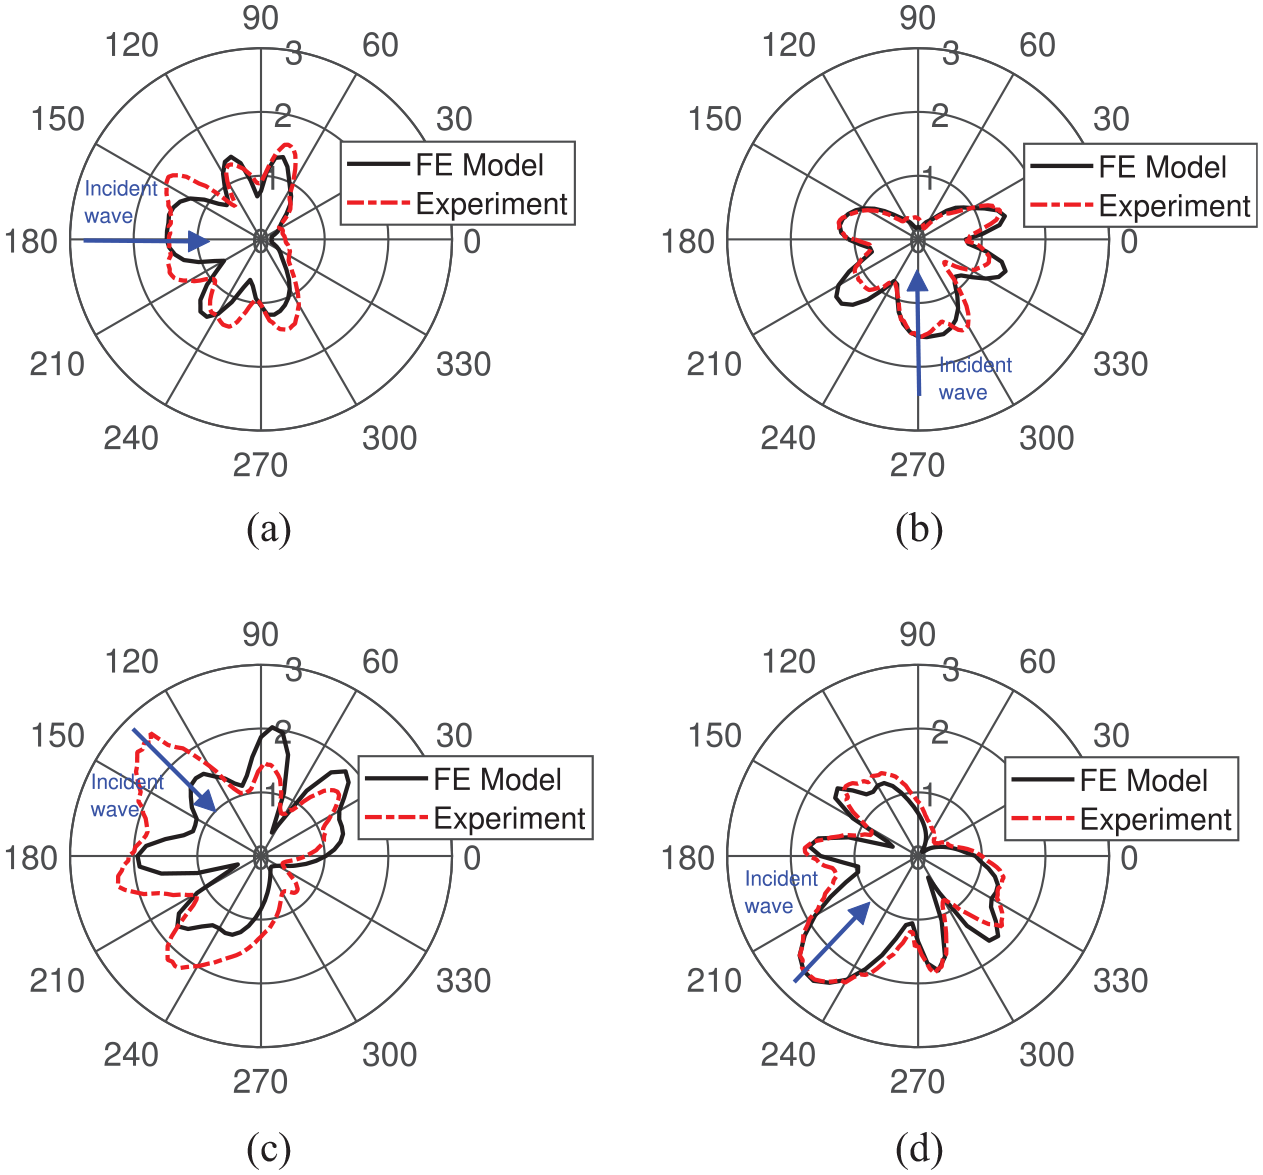
Figure 5 shows the amplitude comparison on a circle (radius 30 mm) around the delamination for the different incident wave directions. Overall, good agreement between experiments and FE simulations can be observed. As observed in the 2D images, the directions with low amplitude next to the large forward scattered lobe are more distinct in the experimental measurements than in the FE predictions, and for the 90° incident wave the FE model underpredicts the forward scattered wave amplitude. An ideal circular delamination is modelled, whereas the shape of the delamination in the specimen is not perfectly uniform (as observed from an ultrasonic C-scan 36 ), which could be the reason for this discrepancy. The scattering patterns in the 0° (Figure 5(a)) and 90° (Figure 5(b)) directions are reasonably symmetric, consistent with the symmetry observed in the 2D scans in Figure 4. In the diagonal directions, the simulated scattering patterns are elongated and slightly asymmetric. This asymmetry could be due to the layup of the sub-laminates in the diagonal directions causing more focused scattering on one side of the delamination. Significant asymmetry is observed in the experimental pattern for the −45° incident wave direction (Figure 5(c)), inconsistent with the FE results. This asymmetry is also observed as a region of higher amplitude in the top right corner of the experimental 2D scan (Figure 4(g)), which could be due to a local variation of the material properties in this region. Overall forward and backscattered amplitudes are higher in the diagonal directions with the highest amplitude in the −45° direction (Figure 5(c) and (g)), as expected from the 2D scans. This again indicates that energy focusing is occurring along the outer ply layers. Overall good agreement between experiment and FE simulation is observed.
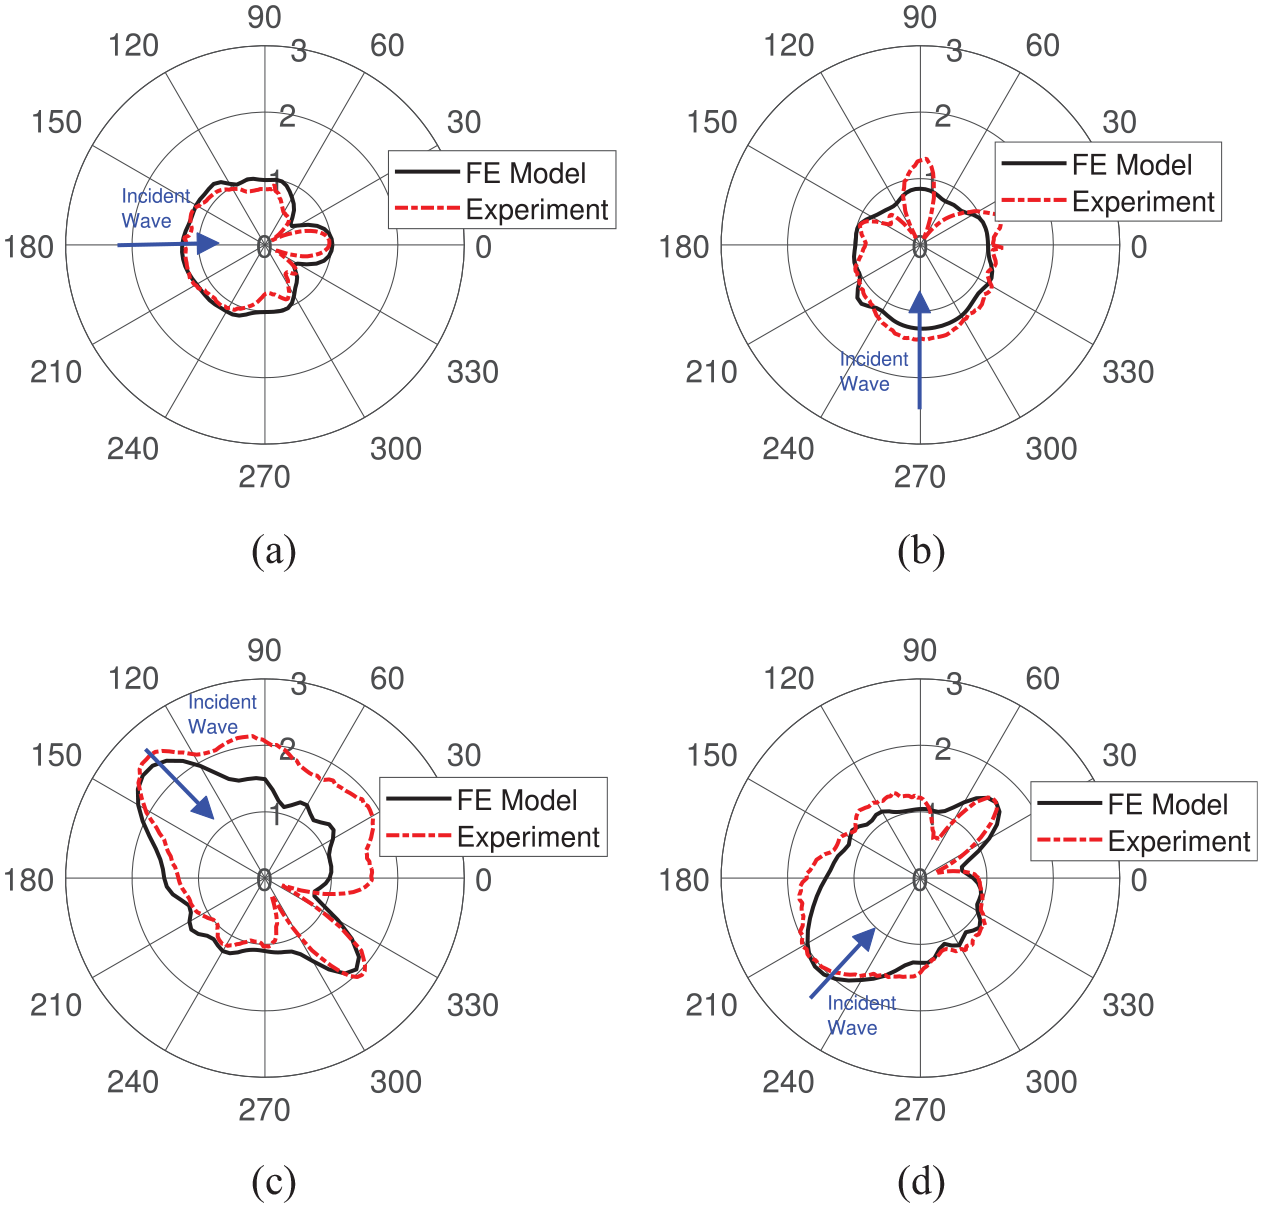
Measured and FE simulated guided wave amplitude (normalized FFT magnitude, 50 kHz) around a circle of points (radius 30 mm) centered on the delamination. Incident wave directions: (a) 0°, (b) 90°, (c) −45°, and (d) +45°.
The amplitude patterns shown in Figures 4 and 5 include both the incident and scattered components of the wave. In order to isolate the scattered wave, a baseline subtraction analysis was performed on the FE results as described in Section “Finite element modelling” (Figure 6). For each of the four incident wave directions there is a large forward scattered lobe with only very small back-scattered amplitude. For the 0° and 90° directions (Figure 6(a) and (b)) a small forward scattered lobe is observed, with low amplitude for the 90° direction as expected from the 2D scan (Figure 4(b)). A significant increase in forward scattered amplitude can be observed in the diagonal directions, with the highest amplitude again observed in the −45° direction. The above results (Figures 4–6) indicate that incident wave direction has a significant influence on the scattering around a circular delamination, due to the anisotropic layup of the composite laminate. It should be noted that layup alone cannot be used to predict forward scattered amplitudes, as it depends on the respective wavenumber and phase of the modes in each sub-laminate. The forward scattered wave at the delamination exit is generated by the recombination of the guided wave modes in the sub-laminates on top and bottom of the delamination. 13 For delaminations, in general scattering is dominated by a large forward scattered wave lobe with increased amplitude in addition to a significant reduction in back and sideways scattered amplitude. Previous studies33–35,39 indicate that a strong forward lobe, with low backscattered amplitude, occurs for delaminations at all depths. This would indicate that a pulse-echo detection approach may not be suitable to detect this type of damage.
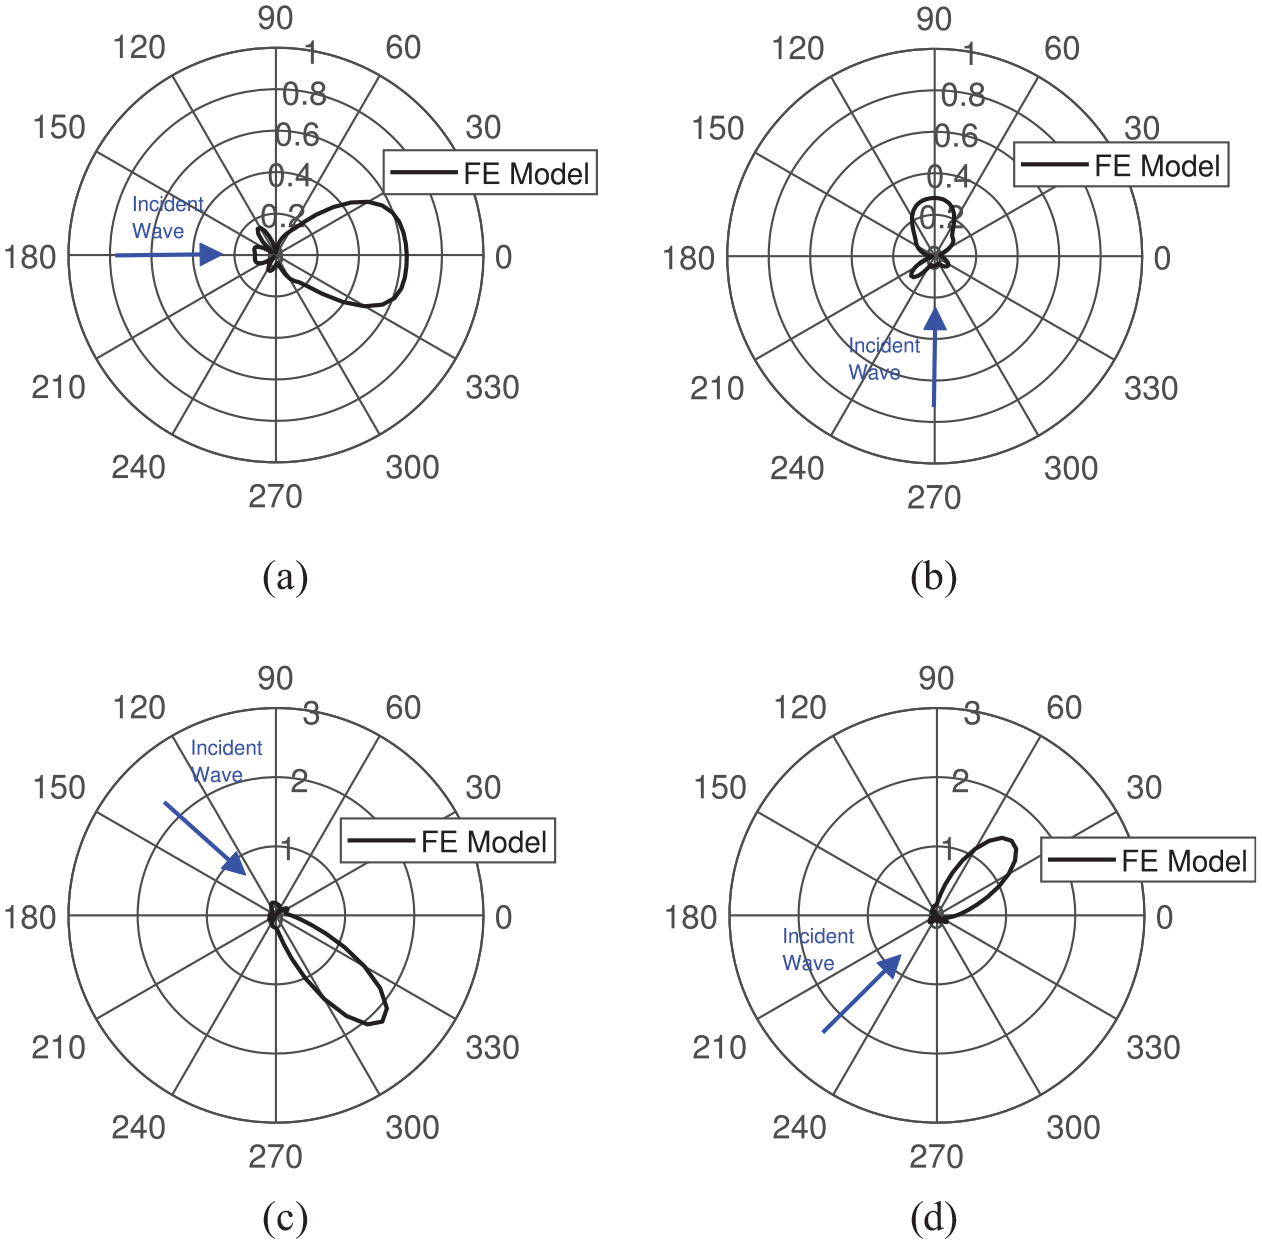
FE simulated scattered wave (normalized FFT magnitude, complex baseline subtraction) around a circle of points (radius 30 mm) centered on delamination for: (a) 0°, (b) 90°, (c) −45°, and (d) +45° incident wave directions.
Scattering at magnets
Experimental and numerical results for scattering at circular magnets, often used as a detection target to validate SHM approaches, were investigated. Figure 7 shows normalized displacement contour plots at three time snapshots for both the delamination (Figure 7(a)–(c)) and magnet FE simulations (Figure 7(d)–(f)). The contours are shown for the 0° incident wave direction. At 120 ns (Figure 7(a) and (d)) the incident wavefront is not circular due to the anisotropy of the laminate, resulting in slightly higher wave velocities in the diagonal directions. Energy focusing of the incident wave can be observed in the diagonal directions, indicated by higher amplitude in these directions. As the wave pulse passes the delamination (Figure 7(b) and (c)) the forward scattered wave at the delamination exit can be seen, and almost no backscattered wave is observed as expected from the FFT amplitude plots. On the other hand, the permanent magnet blocks the propagation of the guided wave, resulting in a large back-scattered amplitude. Interference between incident and sideways scattered waves can be observed in Figure 7(e) and (f).
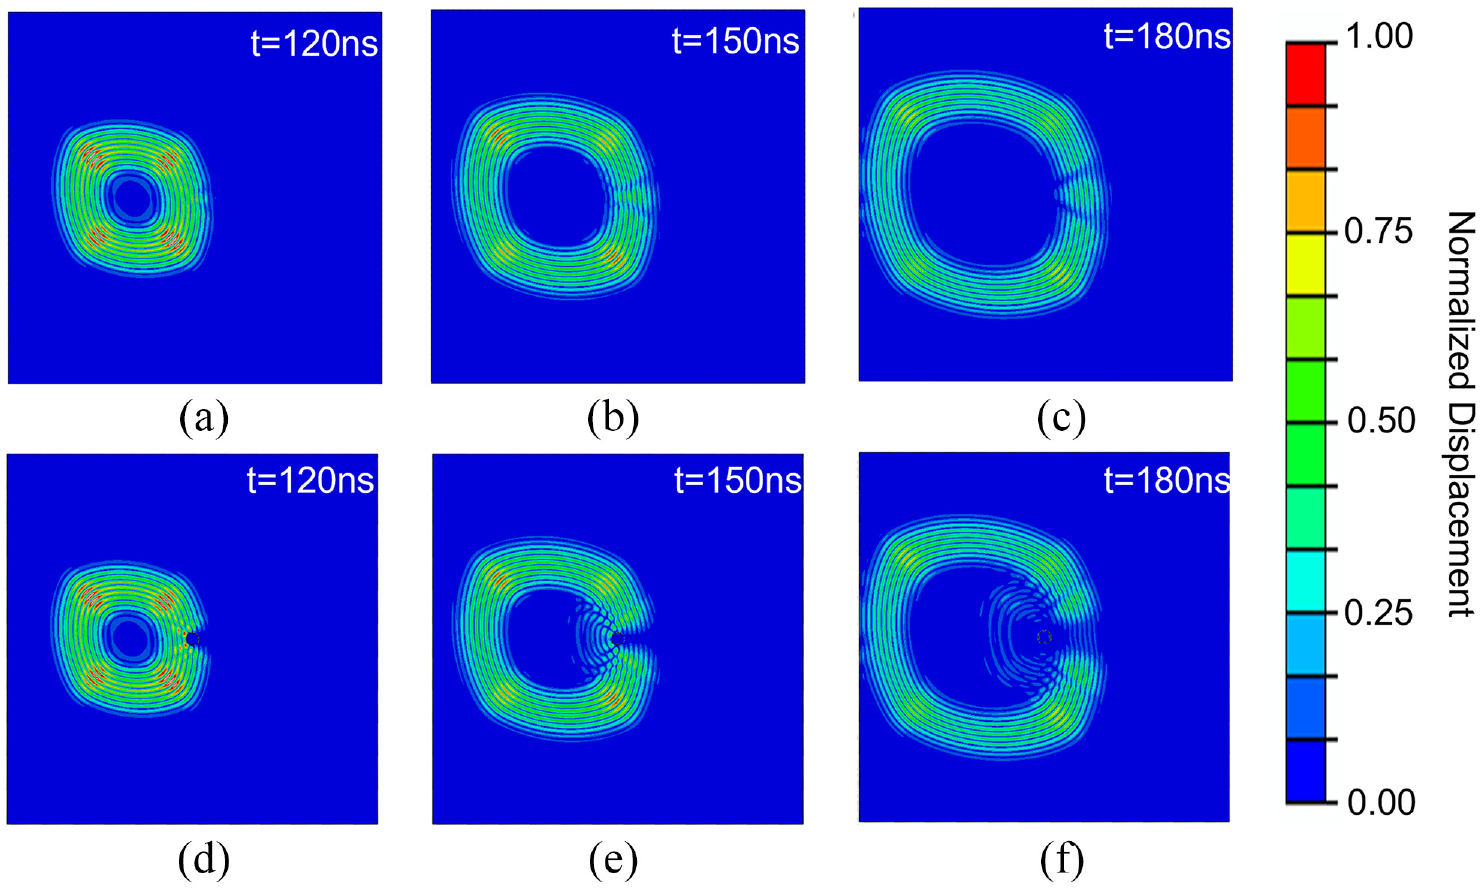
Normalized displacement magnitude contour plots for 0° incident wave direction. Obtained from FE model at time snapshots 120, 150, and 180 ns, respectively. Top row: Delamination model. Bottom row: Magnet model.
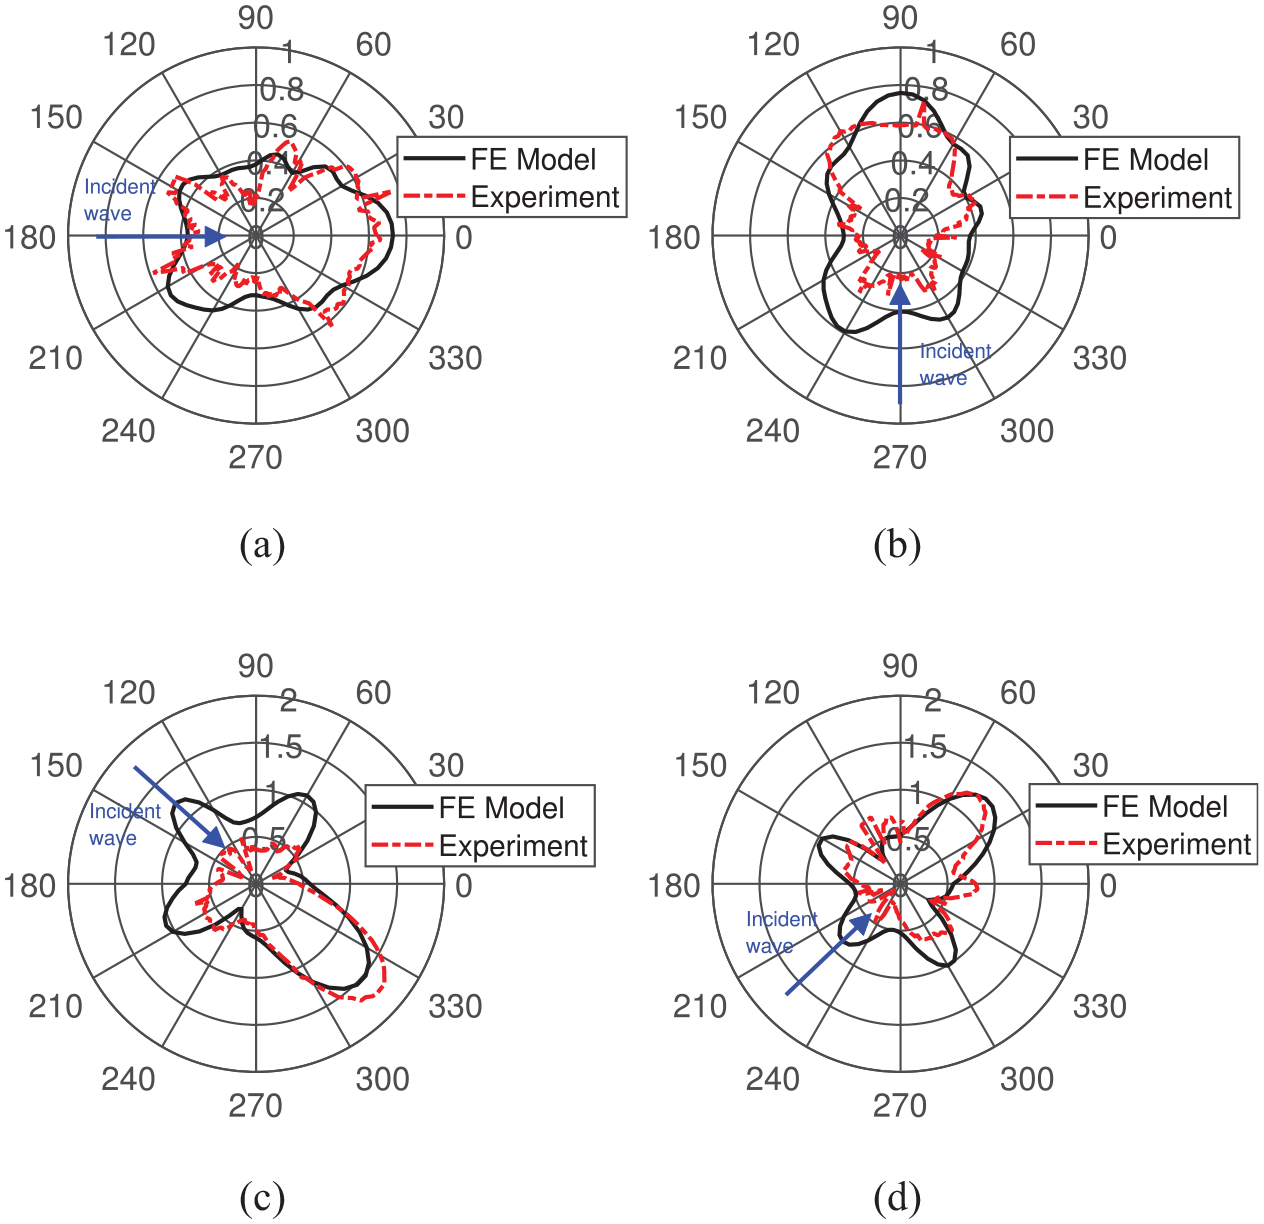
The measured and simulated FFT amplitudes around a circle of points (radius 30 mm) centered on the magnet are presented in Figure 8 for the four incident wave directions. No forward scattered lobe is present, indicating blocking of the incident wave. A large, backscattered amplitude is observed for each incident wave direction, consistent with Figure 7 (0° incident wave direction). The FE scattering patterns in Figure 8 are symmetric with additional lobes, approximately perpendicular to the respective incident wave direction, present. Overall, this gives a distinctly different scattering pattern compared to the delamination case. The experimentally measured scattering patterns for the 0° and 90° incident wave directions are reasonably symmetric and show good agreement with the numerical results. The overall number and position of lobes are similar, although there is some variation in amplitude. The experimental measurements used honey to couple the magnet to the plate, whereas the FE model used an idealized tied contact condition, and nominal material properties, which could be causing the discrepancies. Higher scattered amplitudes can be observed for the diagonal cases as expected, again indicating energy focusing is occurring along the outer plies. Excellent agreement between measurement and simulation was observed for the +45° direction. However, there is significant discrepancy between the −45° measurements and simulation, as also seen for the −45° delamination case (Figure 5(c)), and the −45° measured scattering pattern around the magnet is not symmetric (possibly due to manufacturing inconsistencies of the composite ply layup). There is good agreement between the FE model and experiment for the other directions and the magnet model captures the key scattering behavior of blocking forward wave transmission. It should be noted that especially the backscattered amplitudes depend on the respective phase of the incident and scattered waves leading to destructive or constructive interference, for example, the backscattered FE amplitude in the −45° direction (Figure 5(c)) is smaller than for +45° (Figure 5(d)), in contrast to the previous scattering results. Depending on the exact measurement location (e.g., a different radius of 25 mm), a higher backscattered amplitude in the −45° direction, in comparison to the +45° direction, could be observed.
Measured and FE simulated guided wave amplitude (normalized FFT magnitude, 50 kHz) around a circle of point (radius 30 mm) centered on permanent magnets. Incident wave directions: (a) 0°, (b) 90°, (c) −45°, and (d) +45°.
The scattered waves were isolated by performing a baseline subtraction to remove the incident wave for the experimental and simulation data (Figure 9). Here, the forward scattered wave represents blocking of wave transmission caused by the magnet. Backscattered amplitudes are significantly higher for all incident wave directions than observed for the delamination case, consistent with results presented in Figures 7 and 8. Figure 9(a) and (b) shows the scattered wave for the 0° and 90° directions respectively. Both directions show similar-shaped scattering patterns with scattered amplitude in all directions and comparable, higher forward and backscattered amplitudes. There is reasonably good agreement between experiment and simulation, although the experimental baseline subtraction data is noisier than the FE model. This could be due to small errors in scanning position between baseline and magnet scans, resulting in a phase difference.
Measured and FE simulated scattered wave (normalized FFT magnitude, complex baseline subtraction) around permanent magnets. Circle of measurement points (radius 30 mm). Incident wave directions: (a) 0°, (b) 90°, (c) −45°, and (d) +45°.
In the diagonal directions, more distinct lobes are present, producing a cross-like pattern. These lobes are perpendicular to the incident wave direction (i.e., in ±45° respectively), which correspond to the orientations of the two outer plies, indicating scattering is focused along these directions. It should be emphasized that the amplitude and direction of lobes of the combined scattered wave field (Figure 8) can vary significantly with measurement radius due to the phase difference between incident and scattered waves leading to constructive and destructive interference. However, the baseline subtracted scattering patterns (isolated scattered wave, Figure 9) remain essentially the same at all radii, with a systematic drop in amplitude with radius, as the complex difference takes the respective phase of the incident and scattered waves into account. 41 Therefore, the baseline subtraction analysis is a more reliable measure of the relative scattered amplitudes in the different directions. For each incident direction the amplitude in the forward direction is approximately twice that of the backscattered direction, but mainly represents a blocking of the forward wave. Again, reasonably good agreement with experiments is observed in the forward direction. However, a lower backscattered component was measured experimentally for the diagonal incident wave cases. The side lobes are present in the experiments but not as well defined as for the simulations. Williams et al. 18 considered A0 mode scattering around magnets for multiple incident wave directions in a 26-ply quasi-isotropic CFRP panel. Scattered amplitudes were found to vary with incident wave direction; however, the significant change in shape between the horizontal/vertical and diagonal patterns as seen in Figure 9 was not observed. A greater number of ply layers with quasi-isotropic stacking sequence results in more uniform material properties, compared to the 8-ply laminate studied here, as energy focusing effects are layup dependent.
The scattering behavior of the magnet, like the delamination, is directionally dependent due to the material anisotropy, and can be used to experimentally test the robustness of sparse array imaging algorithms for composite structures. However, the results presented in Figures 8 and 9 indicate that a circular permanent magnet shows significantly different scattering behavior compared to a delamination of similar size, with a blocking of the forward wave and higher back and sideways scattered wave amplitude, which should be considered for sparse array imaging algorithms, for example, from additional numerical simulations.
Scattering matrices
Scattering matrices allow the visualization of full scattering characteristics of a defect19,42 and are shown in Figure 10 for both the delamination and permanent magnet cases. To obtain the scattering matrices, simulations were run for incident wave directions between −90° and +90° degrees in 5° increments for each damage case. Baseline data was also obtained. The isolated scattered wave was calculated for each direction around a circle of measurement points in 5° increments, as shown for the principal directions in Figures 6 and 9. As the simulated damage cases presented here are symmetric, the scattering is reversible. Scattering data for the remaining angles could be therefore obtained from existing cases rotated by 180°. The 2D scattering matrices shown in Figure 10 were plotted for each incident direction against respective scattered directions. Each column of the matrix corresponds to the amplitudes of a single polar plot (e.g., Figures 6 and 9).
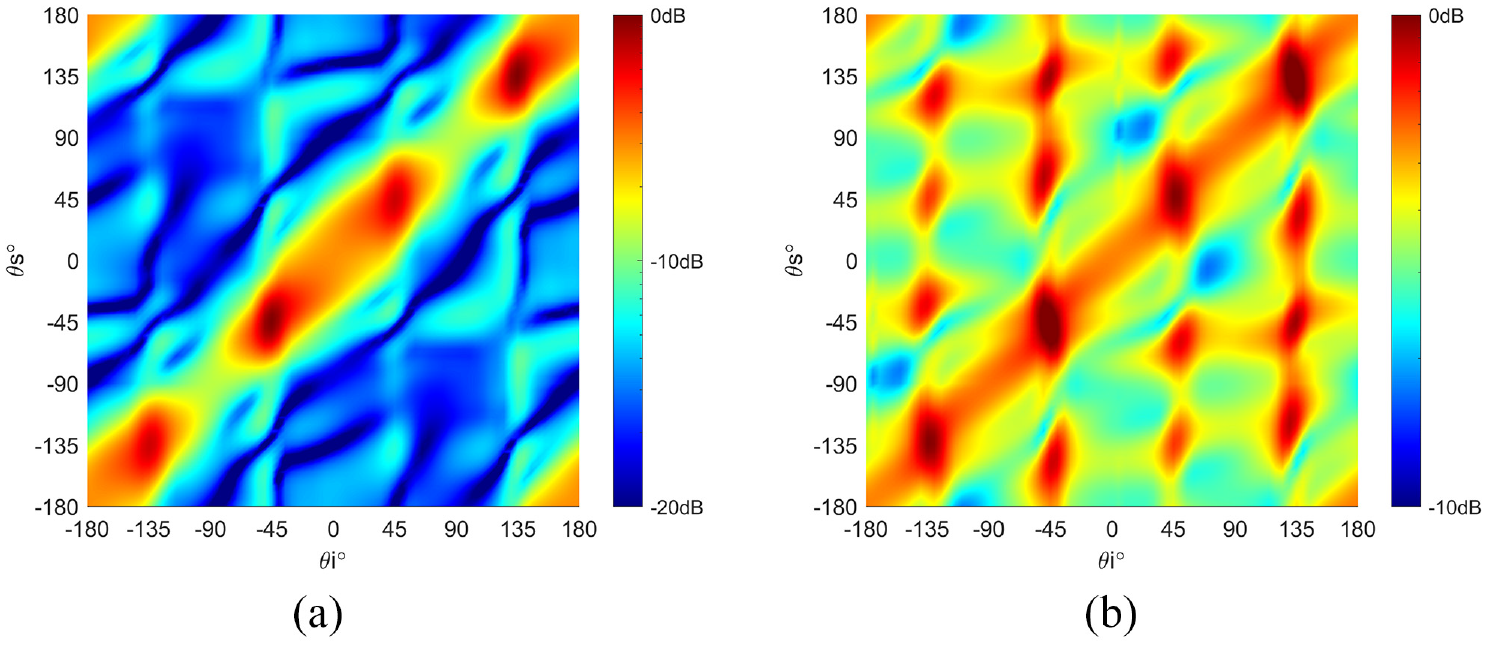
Simulated scattering matrices for: (a) circular delamination and (b) magnet.
The scattering matrix for the delamination case is shown in Figure 10(a) on a 20 dB scale. The scattering is dominated by a strong forward scattered wave, as represented by the lobes in Figure 6, observed for all incident wave directions (high amplitude diagonal band). The forward scattered amplitude increases around the 45° and 135° incident wave directions. This indicates energy focusing is occurring in these directions, consistent with the polar plots in Figure 6, and further indicates energy focusing along the fiber directions of the outer ply layers. Generally, there is approximately a 10 dB drop in amplitude between forward and backscattered amplitudes either side of the diagonal band. Regions of low scattered amplitude are observed in most directions, which could result in delaminations being missed from distributed sensors depending on their location. Strong forward scattering and low backscattered amplitude has been observed for delaminations at different depths,33–35,39–43 thus qualitatively the scattering matrices would be expected to resemble Figure 10(a), although the relative amplitudes, for example, of the diagonal band, will vary with delamination depth. 43 The scattering matrix for a delamination located at the midplane of the laminate is shown in Appendix A.
The scattering matrix for the permanent magnet is shown in Figure 10(b) (10 dB scale) which shows a significantly different scattering pattern compared to the delamination. Again, a diagonal band with higher forward scattered amplitude is observed, but here the forward scattered amplitude results in a drop in amplitude, caused by wave transmission being blocked by the magnet. Higher scattered amplitude can be observed toward the ±45° and ±135° directions as for the delamination. This indicates that the anisotropic layup of the plate influences scattering behavior, regardless of defect type. However, the increase in amplitude is not as significant for the magnet as it is for the delamination; scattered amplitudes are overall more uniform, with scattering occurring in all directions. Additional directions of higher scattered wave amplitude can be observed for incident wave directions ±45° degrees and ±135° degrees. This is due to the cross-shaped scattering patterns (e.g., Figure 9(c)) that occur in these directions, likely caused by scattered waves being focused along the outer ply layers oriented in these directions. For some directions, low amplitude is observed; however, this effect is much less pronounced than for the delamination. Overall, for the magnets, the ratio of forward to backscattered amplitudes is lower than for the delamination. This is due to scattered amplitude observed in multiple directions in the magnet cases, whereas the delamination cases were dominated by a distinct forward scattered lobe.
Implications for sparse array SHM imaging
The results indicate that guided wave scattering around a delamination in composite structures can be strongly influenced by incident wave direction due to the anisotropy of the laminate. Therefore, imaging algorithms should take the anisotropic effects into account. Large variation of incident and scattered amplitudes with propagation direction were observed due to energy being focused along fiber directions of the outer ply layers. However, as the group velocity of the A0 mode is less directionally dependent than, for example, the S0 mode, accounting for the variation in group velocity for an anisotropic laminate may not be as critical as considering the significant changes in amplitude due to energy focusing.
Algorithms such as MVDR may be better suited for damage localization in anisotropic structures as the signals are adaptively weighted based on prior knowledge of expected damage scattering patterns, as presented in the scattering matrices (Figure 10). For delaminations, a significant variation in the amplitude of the forward scattered lobe was found, with very limited scattered wave amplitude observed in other directions. Slightly counterintuitively, increased rather than decreased amplitude in the forward direction was observed for the artificial delamination damage. Scattering patterns around magnets were also demonstrated to vary with incident wave propagation direction, although scattered amplitudes were more uniform for different incident wave directions. As scattering occurs in all directions for the magnet, this could indicate that magnets simulating damage are easier to detect with sparse array imaging and that realistic damage types might be missed if imaging algorithms are only tested on magnet targets. This is particularly the case if the selected SHM method relies on the backscattered wave (e.g., phased array imaging). Additionally, delamination damage with limited scattering except in the forward direction, located outside of the area covered by a distributed sensor array could be missed unless edge reflections are considered. Whilst magnets are an effective tool for the experimental development and testing of SHM imaging algorithms due to their low cost and ability to be easily re-positioned without damaging the structure, the robustness of imaging algorithms for realistic defect scattering patterns should also be ascertained.
Conclusions
The influence of anisotropy and incident wave directionality on guided wave propagation and scattering in a quasi-isotropic CFRP laminate was investigated through experiments and FE simulation. Guided waves propagating in the undamaged laminate were found to have increased amplitude in directions corresponding to the fiber orientations of the outer ply layers, due to energy focusing. Scattering around a circular delamination and magnet target was studied for multiple incident wave directions. Isolating the scattered wave from a complex difference baseline subtraction analysis provides a good measure of the respective scattering patterns. Distinct scattering patterns were observed for the delamination and magnet cases, with significant directional dependency for both damage types. For the delamination, a strong forward scattered lobe with small, backscattered amplitude was observed for each incident direction. The magnet was observed to block transmission of forward scattered waves and higher backscattered amplitude was present. As scattering around a magnet is directionally dependent, magnets can be a very valuable experimental tool for developing and testing distributed guided wave sensor monitoring of anisotropic structures. However, the different scattering patterns for different damage types should be considered when developing SHM systems to ensure that damage is not misinterpreted due to, for example, low backscattered amplitudes. It should be ensured and tested, for example, from FE simulations, that the employed imaging algorithms are reliable by considering the variations in guided wave scattering for different damage types. Pulse-echo detection approaches and distributed sensors could have limited sensitivity for delamination detection outside the area covered by the guided wave sensors due to the low backscattered amplitude. Overall, the results demonstrate that guided wave scattering at different damage types is influenced by the incident wave direction, and material anisotropy should be considered when designing SHM imaging methods for composite laminates.
Footnotes
Appendix A: Scattering matrix for mid-plane delamination
The finite element study used to obtain the scattering matrices presented in Figure 10 was repeated for a delamination located at the mid-plane (0.8 mm depth) of the plate. As for the 0.4 mm depth case (ply 2–3, Figure 10(a)) the scattering is dominated by a large forward scattered wave, generating the diagonal band of high amplitude observed in Figure A1. The structure of back and sideways scattered lobes in Figure A1 is somewhat different to those observed for the 0.4 mm depth delamination; however, an amplitude drop of approximately 10 dB is again present for these lobes. The forward scattered amplitudes for the mid-plane delamination are generally higher than those of the shallower 0.4 mm depth delamination. For delaminations located close to the mid-plane, less energy trapping occurs within the delamination. Strong directional dependency on the scattering is observed, with higher amplitudes in the ±45° and ±135° incident wave directions, as seen for the 0.4 mm depth delamination and magnet cases. The low backscattered amplitudes (up to 20 dB lower in some cases) further indicate that care should be taken when using SHM approaches relying on the backscattered wave, as delaminations could easily be missed.
Acknowledgements
The authors would like to thank Dr. Leandro Maio, Università degli Studi di Napoli Federico II, for the generous provision of the composite specimen.
Declaration of conflicting interests
The author(s) declared no potential conflicts of interest with respect to the research, authorship, and/or publication of this article.
Funding
The author(s) received no financial support for the research, authorship, and/or publication of this article.