
Abstract
Fatigue crack growth is one of the most common damage mechanisms of structural components and can result in a sudden and unexpected abrupt fracture which can cause catastrophic failure. Thus, monitoring of crack propagation is an important topic of structural health monitoring. For that reason, this work aims at the detection of crack propagation by the application of a high-frequency vibration-based method, using the electromechanical admittance (EMA). It enables the local monitoring of the coupled dynamic behavior of the structure and the piezoelectric transducer which changes, for example, due to damage. It is the purpose of this study to develop a method from the recorded data reflecting fatigue crack growth in weld zones. As it is known that the data are affected by temperature, a temperature compensation strategy is considered. In this study, a presentation of the coupled EMA data has been found, which allows the isolation of the crack propagation effects. Within the scope of fatigue experiments, fatigue cracks were introduced into threaded bolts of rail support points, welded onto base plates. In practice, they are embedded in a layer of mortar and, therefore, have poor accessibility. Electromechanical impedance measurements were carried out at different states of fatigue crack growth. The fatigue crack growth was validated by strain gauge measurements executed during the fatigue experiment. The proposed feature was calculated from the recorded EMA data. The technique produces promising results detecting fatigue cracks and can also be transferred to similar types of welded joints or rods where fatigue crack growth occurs.
Keywords
Introduction and motivation
Monitoring of fatigue crack growth is an important topic within structural health monitoring (SHM), as it can finally result in a sudden and unexpected abrupt fracture which can cause catastrophic failure. 1 In this work, the monitoring of fatigue cracks is investigated. The monitoring process is carried out by the application of the electromechanical impedance (EMI) method. This method is one of the latest established techniques within SHM 2 and has been enhanced in the last years. The EMI method is a nondestructive and high-frequency vibration-based technique with piezoelectric transducers permanently attached to the structure. The EMI and the admittance (EMA) as its reciprocal, respectively, can be measured directly as an electrical quantity. 3 It has been shown that these spectra reflect the coupled systems dynamics. Therefore, features can be derived from these spectra which characterize the current structural state. The origin of the EMI method can be found in the work of Liang et al. 4 and Sun et al. 5 After that, this method has been applied in numerous examples documented in several review papers and books.6,3,7–9 In this work, an approach for a feature based on the EMA is proposed, which enables to isolate crack propagation effects. Several published articles addressed the detection of fatigue damage by utilizing the EMI method. Within the literature research, the most studies investigate artificially created cracks or cuts, respectively, for example, by machining or saw cutting.10–13 Although there are studies which introduce cracks by carrying out fatigue experiments, in most cases lab-sized or other types of idealized specimens like plates are inspected. 14 There exist only a small amount of studies that deal with the monitoring of fatigue cracks in real structures, especially in welded structures such as Giurgiutiu et al. 15 and Annamdas et al. 16 In this work, a threaded bolt welded onto a base plate (as part of a rail support point) is investigated. Therefore, cracks have been introduced into the weld zone by the conduction of fatigue experiments. Giurgiutiu et al. 15 and Wu et al. 17 observed the impedance or the resistance as the real part of the impedance, respectively. Annamdas et al., 16 Lim and Soh, 18 Zuo et al., 11 Winklberger et al., 12 and Bhalla 14 looked at the absolute admittance, the conductance or the susceptance as the real and imaginary parts of the admittance, respectively.
In this article, the complex EMA, consisting of the conductance and the susceptance as its real and imaginary parts, is evaluated. Therefore, complex admittance signatures of the several examined states normalized by the baseline signal are computed and their real parts are plotted versus their imaginary parts. The results show increased scattering in the presence of propagating cracks. This characteristic is used to derive a feature, which reflects the growing crack.
As it is known that temperature variations affect the EMI or EMA data, respectively, which can cause a false alarm of the monitoring system, the temperature influences on these data have been addressed in numerous studies19–24 as well as approaches of their compensation25–27 have been derived. The temperature compensation strategy of this work includes the effective frequency shift (EFS) which has been introduced by Park et al. 23 and extended by Koo et al. 25 This technique was applied on the conductance and susceptance data in order to eliminate the resonance shifts caused by varying temperature. Additionally, the varying slope of the susceptance has been compensated by the approach introduced by Dreisbach et al. 28 Based on these investigations and additional experiments, a possible approach for a feature is introduced in this article.
In this work, welded joints containing bolts of rail support points have been inspected. Rail support points are important elements of rail construction as their task is to attach rail tracks and transfer occurring loads to the ground. The observed components consist of threaded bolts welded onto base plates. The weld zone itself and the surrounding material of the heat-affected zone are their weak points. A common cause for failure is the fatigue crack growth in the weld zone, which is in practice located under layers of mortar and, therefore, has poor accessibility. As failure of these components can even cause train derailment, an approach to detect fatigue cracks is the purpose of this work. Sahm et al. 29 have also investigated these elements and figured out that damage detection by employing the EMI method on these real-life structures is possible.
In the following sections, at first the damage detection method is presented. The second section contains the experimental setup and the description of the executed experiments. Afterwards, the results are shown and discussed. Finally a conclusion of this study is drawn and an outlook for further research is presented.
Methodology
As the measurement data are influenced by varying temperature, at first the effects on the EMA data are described and a resulting compensation strategy is presented. Subsequently the approach for a possible damage indicator for monitoring the fatigue crack propagation, which was deployed in this work, is shown. At the end of this section, the influence of the propagating crack on the strain distribution in the specimen’s cross section area is discussed.
Temperature compensation strategy
First experiments have shown the influence of temperature on the conductance and susceptance spectra, which are also depicted in Figure 1 and confirmed by the work of Yang et al. 30 and Buethe et al. 23 :
The peaks shift toward lower frequencies with increasing temperature and vice versa.
The height of the peaks changes.
The slope of the conductance
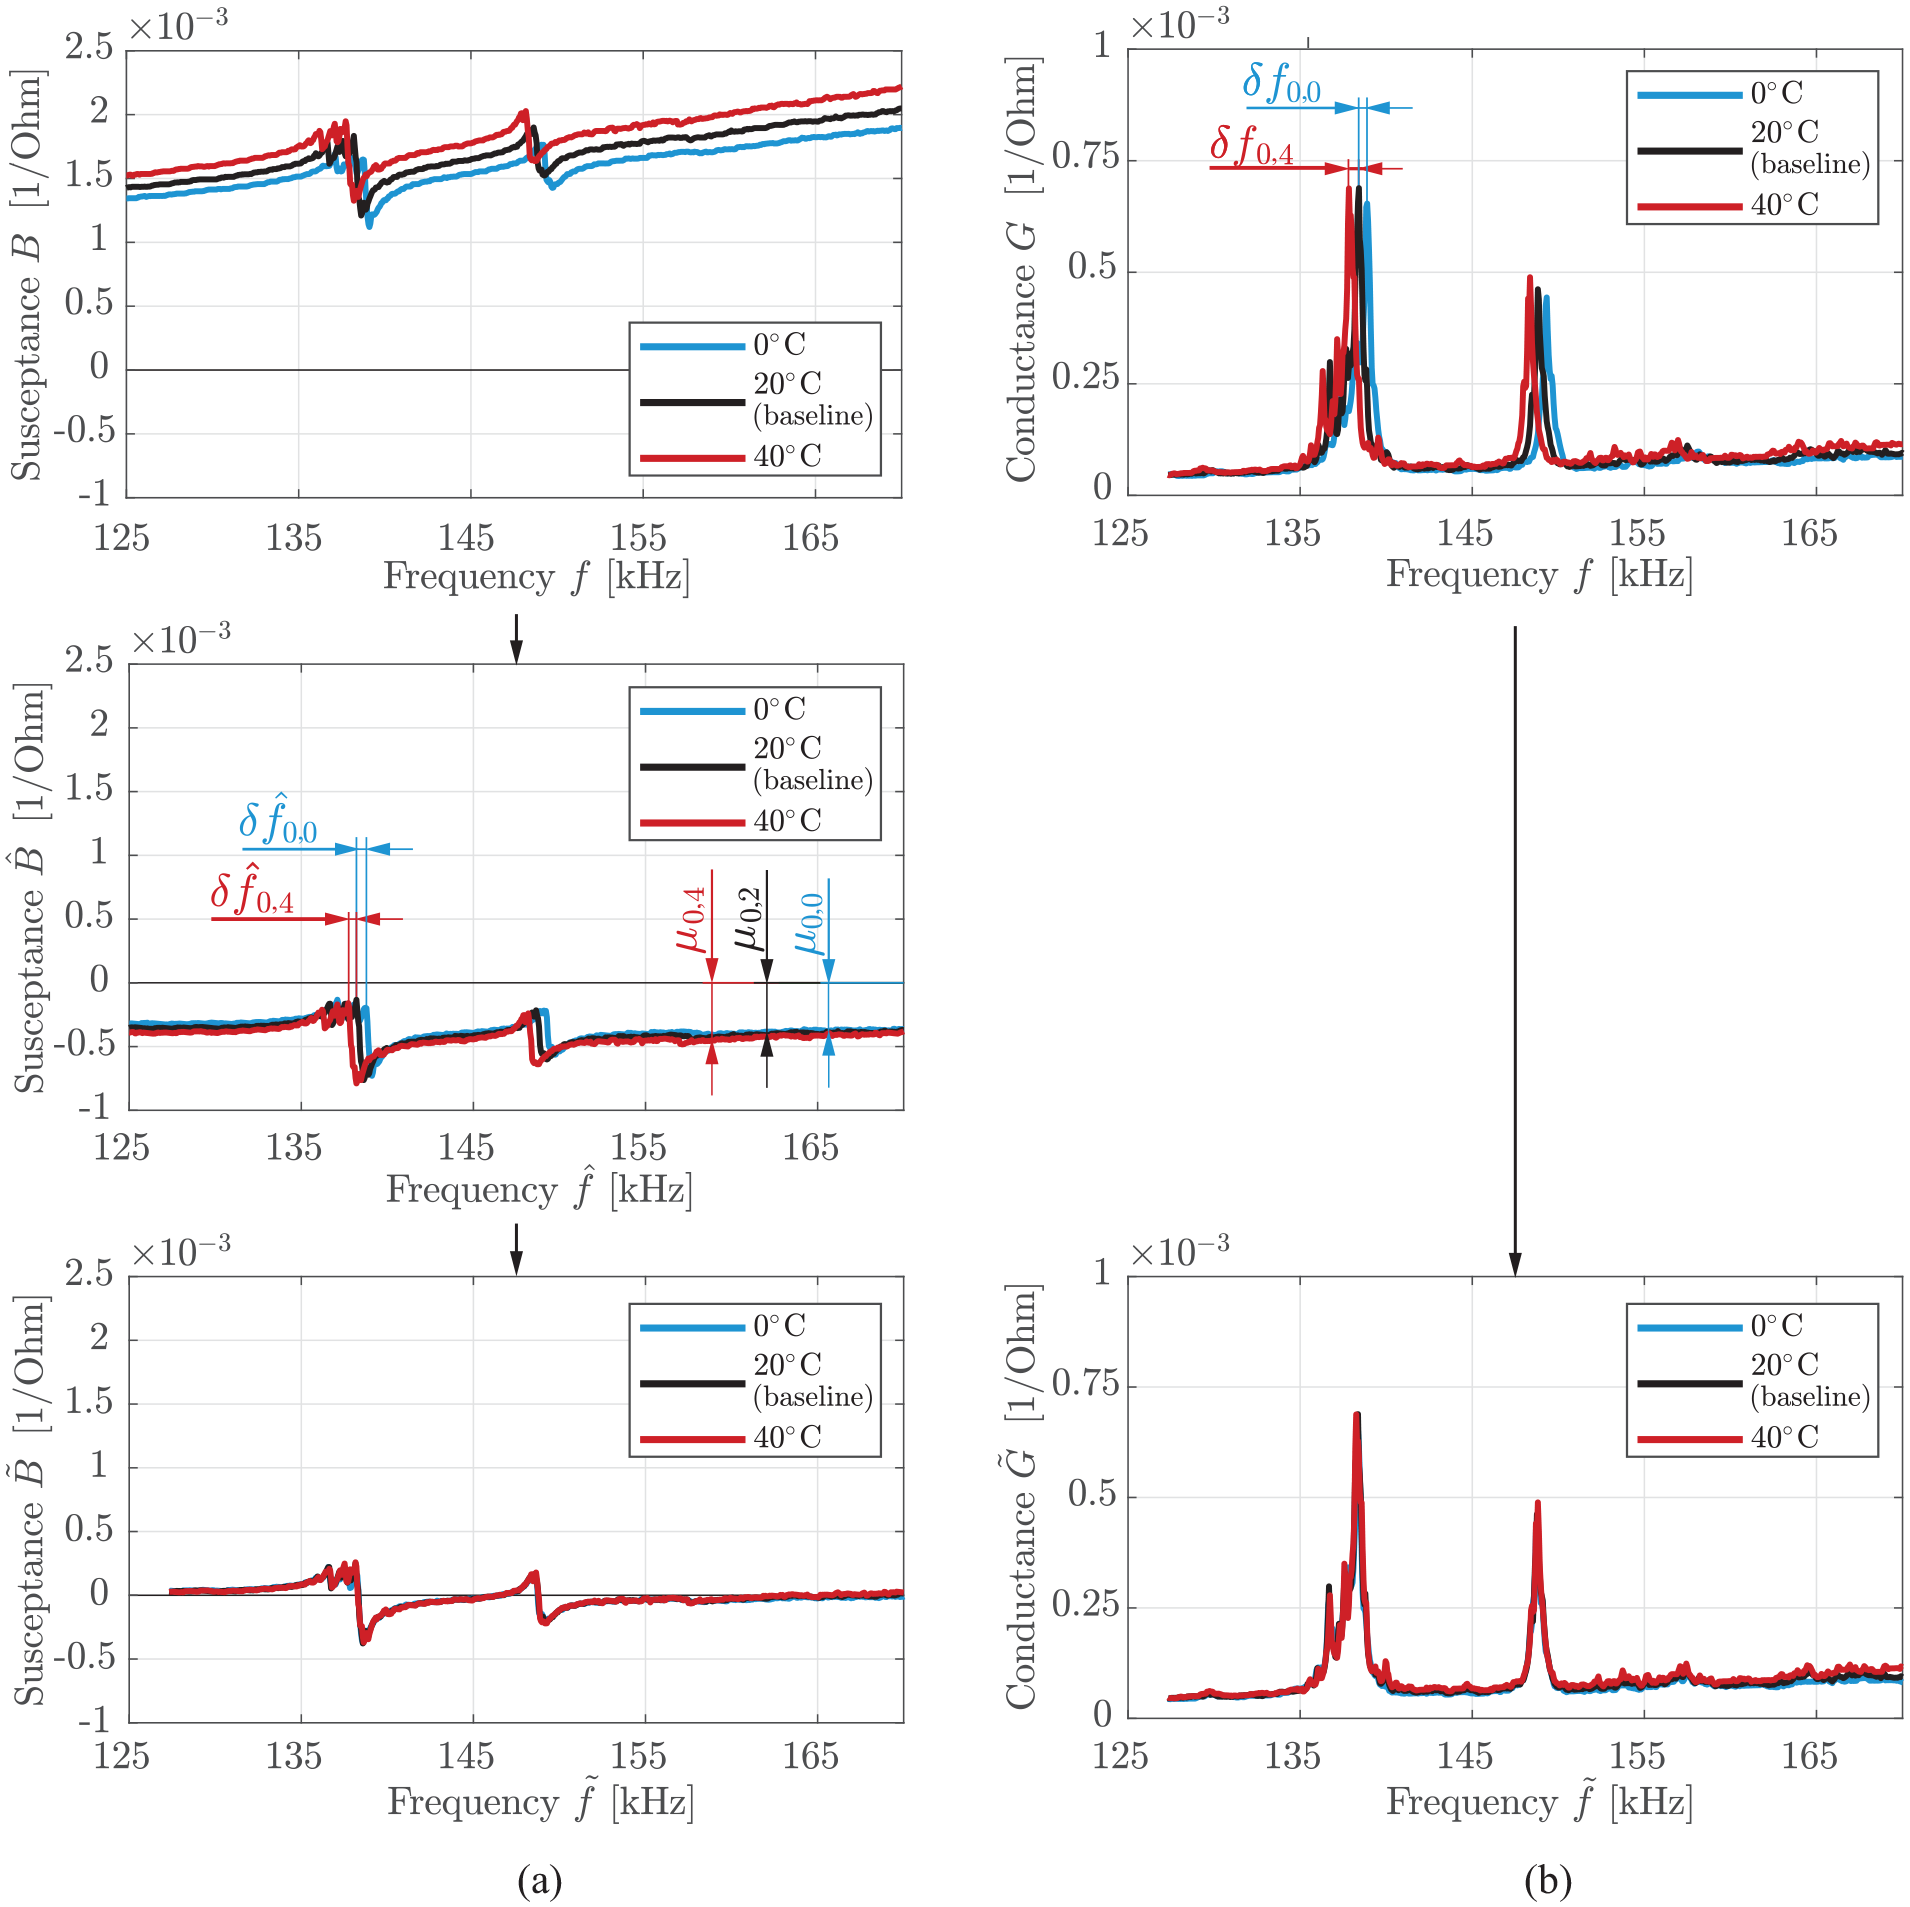
Temperature compensation of data recorded at 0°C, 20°C, and 40°C for the (a) susceptance and (b) conductance.
Whereby the change of the conductance’s slope is much smaller than that of the susceptance. Therefore, the temperature compensation strategy is addressed to the shifts of the peaks of both, the conductance and the susceptance spectra. But only the slope’s change of the susceptance is considered.
To compensate for the temperature effects on the susceptance spectra, in the first step, the slope is determined by the application of linear least squares and the signals are then rotated by the transformation matrix

Thereby, the subscript “
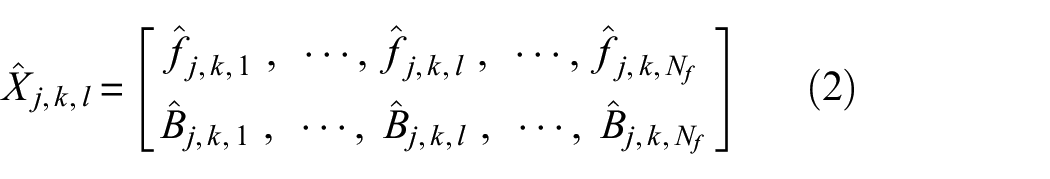
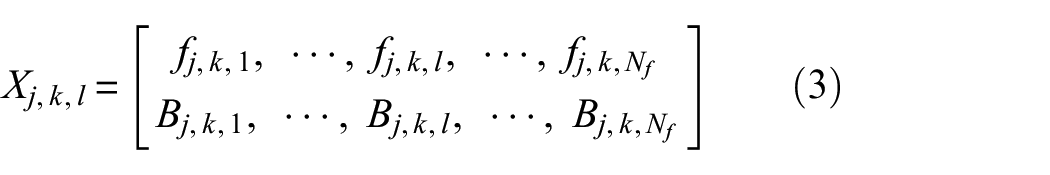
Where
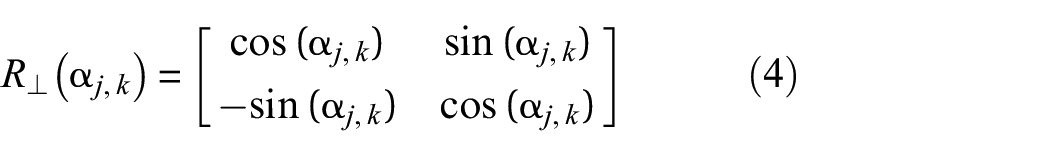
The connection of the slope angle and the slope

Subsequently to the rotation process, the susceptance is shifted horizontally about the frequency shift
In order to eliminate the deviating peak frequencies, the concept of the EFS is utilized.25,26 The frequency shift
The baseline’s subscripts “0” and “2” indicate the pristine state at
Equation (9) shows the resulting data vector of the susceptance data after temperature compensation
Similar to the susceptance data, the EFS is applied onto the conductance data, as follows


The temperature compensated conductance and susceptance data are used afterwards to calculate the damage indicator for the monitoring of the crack propagation.
Monitoring of the propagating crack by means of the EMA data
For evaluating the EMA data, we propose the complex EMA signature in normalized form. Therefore, the complex admittance of the current state is normalized by the baseline’s complex admittance. A similar way of normalization has been applied on the transfer function between two sensors in the work of Dziendzikowski et al. 31 The admittance contains the temperature compensated conductance and susceptance data according to Equations (6) and (11). After rearranging this equation, the quotient appears as given in Equation (12)
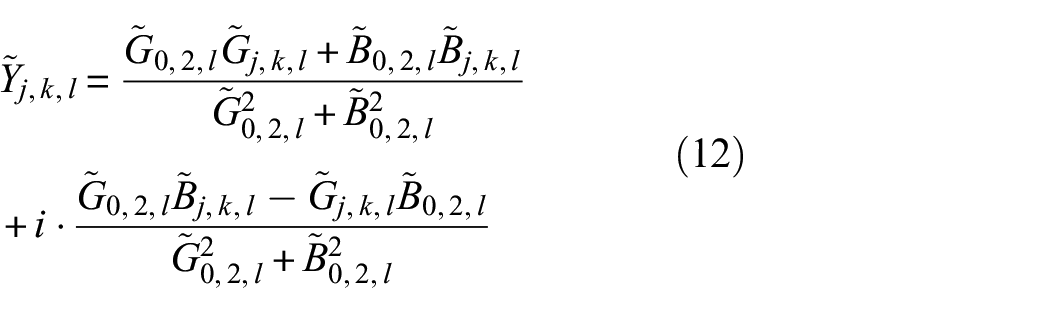
where
An advantage of computing the normalized admittance is the inclusion of both the effects of structural changes on the conductance and the susceptance spectra. Furthermore, the representation of the current state always contains the comparison to the baseline, and a scattering at the frequencies, where the current state data differ from the baseline data, can be observed.
Influence of the fatigue crack on the strain
According to the experience of preliminary studies, the crack growth could possibly start from the inside of the weld zone. For this reason, crack propagation gauges could not be deployed to observe the crack size during the fatigue experiments. It has been decided to draw conclusions by observing the strain distribution in the cross-section area above the weld zone.
For exploiting the fatigue crack growth state afterwards and comparing it to the EMA results, the relative strain was defined. For this quantity only, the maximum strain corresponding to the maximum load occurring during one load cycle is observed. Equation (13) shows the relative strain for the first strain gauge (SG1)
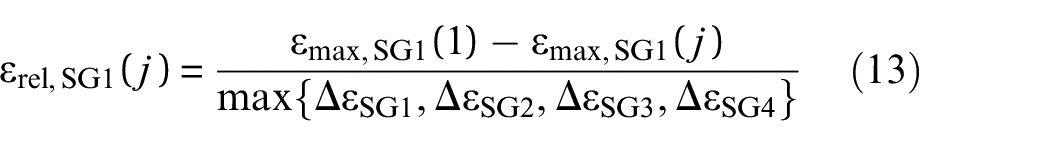
The relative strain

The variation is calculated by the absolute value of the difference between the maximum strain
In this study, the presented quantity
Experimental setup and test
In this section, the specimen, experimental setup, and data acquisition for performing the aforementioned EMI measurements are briefly described.
Specimen and sensor arrangement
The specimens consist of threaded M22-bolts, which are welded onto base plates via drawn arc stud welding. The welding process is a resistance welding process without filler material. Both parts are composed of the structural steel S355. Due to the high electrical resistance at the transition of the base plate and the bolt, the base plate and the bolt are melted locally. Then the parts are pressed together. After the welding process, the welded joint exists between the face side of the bolt and the base plate. Additionally, melted material is pressed out of the welded area and forms a collar-shaped bead around the circumference of the bolt. A more detailed description of the welding process can be found in the work of Brätz and Henkel. 32 For the experiments, the bolts having a length of 85 mm have been welded onto squared 150 mm × 150 mm base plates having a thickness of 40 mm. The specimen including the sensor arrangement is depicted in Figure 2(a). For conducting the EMI method, a PWAS has been installed according to Figure 2(a). The PWAS was made of Pb(Zr,Ti)O3–lead zirconate titanate (PZT) from PI (type PIC255) and has a diameter of 10 mm and a thickness of 0.5 mm. The PWAS is positioned at the upper face side of the bolt. Furthermore, four strain gauges (SG1–SG4) have been attached equidistantly around the circumference, 15 mm above the weld zone as shown in Figure 2(a). The strain gauges from HBM (type 1-LY71-3/350) measured the strain in the direction of the bolt’s axis in Wheatstone quarter bridge circuit.
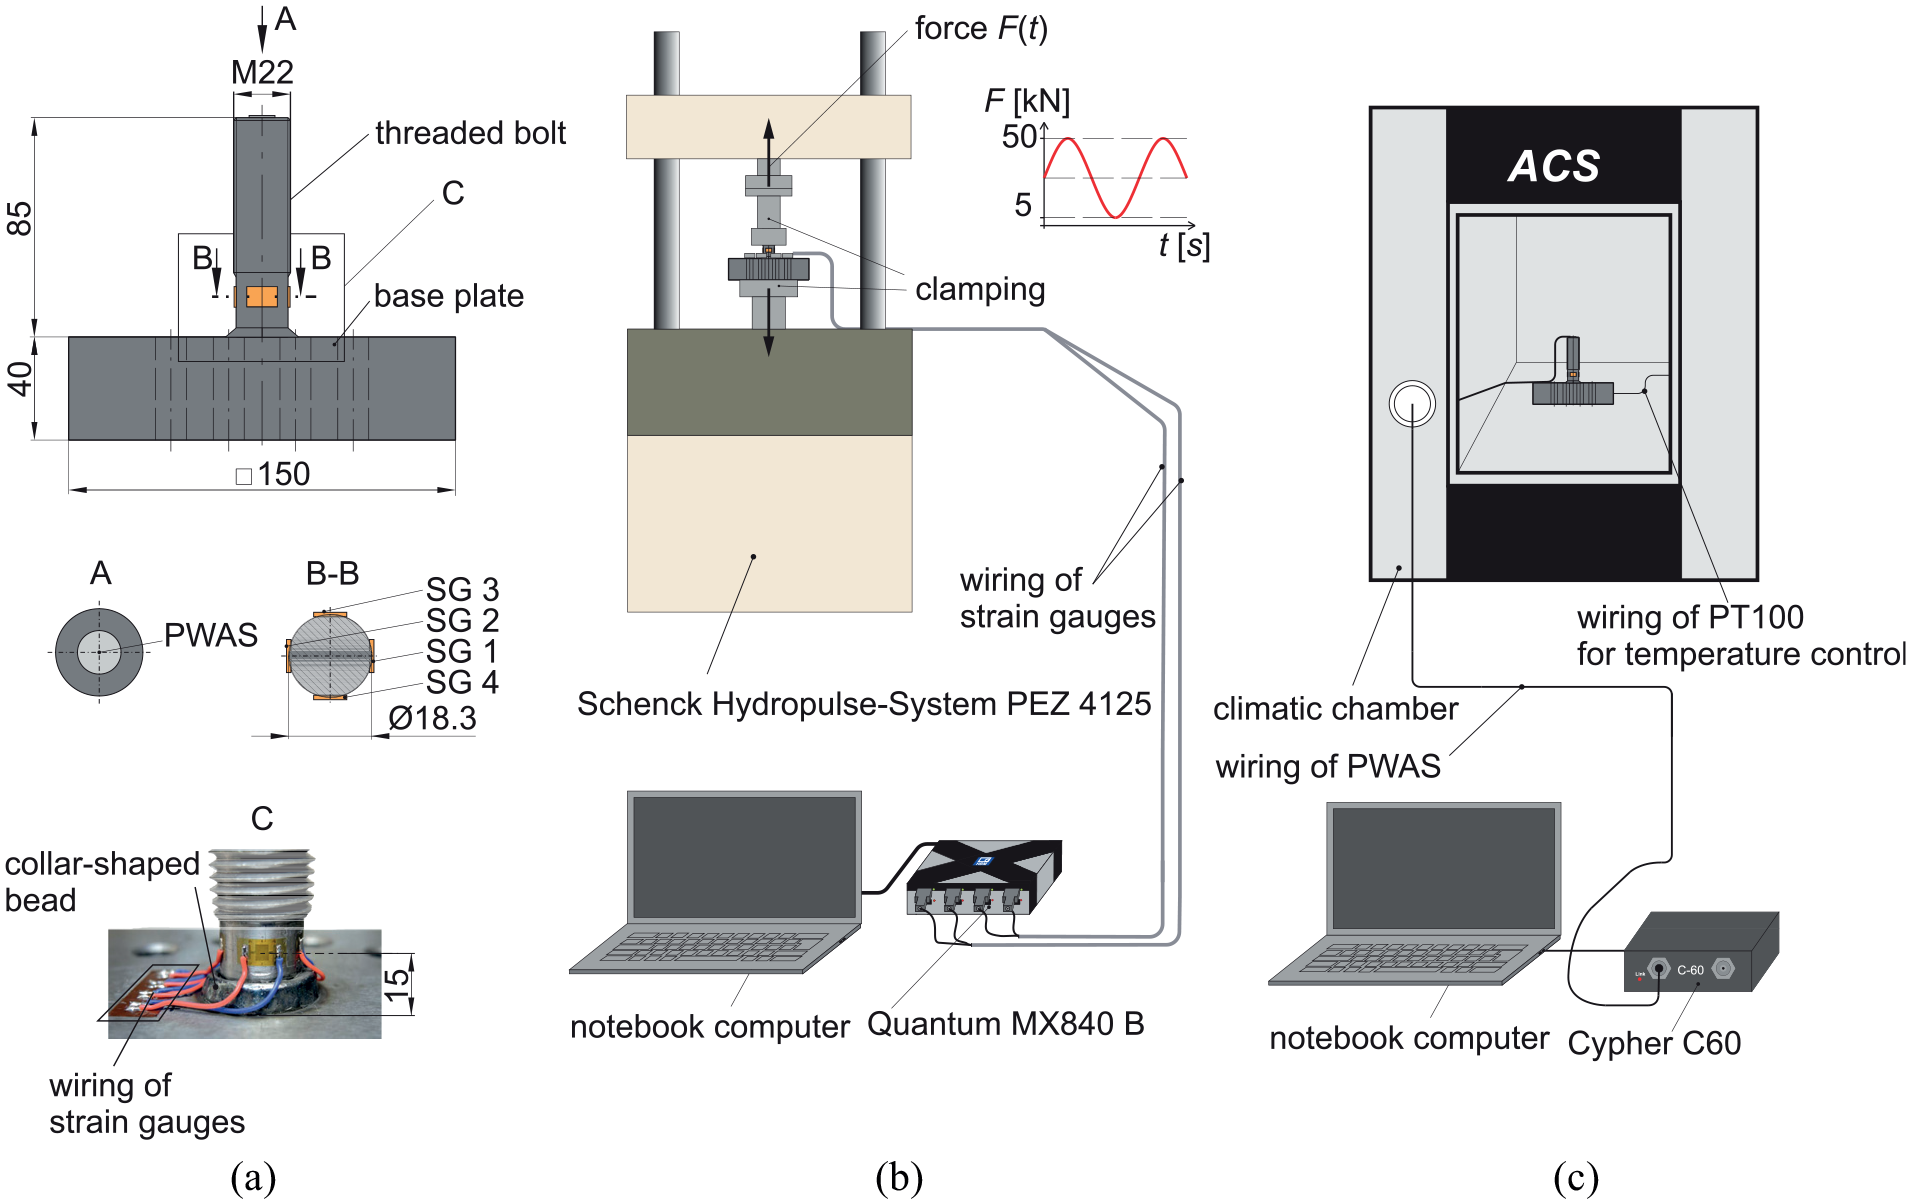
Experiments: (a) specimen and sensor arrangement, (b) setup for the introduction of the fatigue cracks, and (c) setup for acquiring the electromechanical admittance signatures in the climatic chamber.
Measuremental setup
In Figure 2(b) and (c), the measurement setup is shown. Figure 2(b) contains the specimen mounted in the Schenck Hydropulse-System PEZ 4125, loaded by the displayed load curve for the crack initiation. The strain gauge data are led to the measuring amplifier Quantum MX840 B. Its output signals are led to the notebook computer for storing and evaluating the data. Figure 2(c) contains the specimen located in the ACS climatic chamber. The temperature is regulated by means of a temperature sensor PT100 capturing the specimen’s temperature. The impedance analyzer, Cypher C60, is used to supply an alternating voltage in a specified frequency range and to measure the corresponding EMI spectra across the PWAS. A notebook computer with CypherGraph software coming along with the C60 is used for configuring the measurement settings and recording the data.
Experiments
In the first step of the experiments, the specimen is put into the climatic chamber in order to record the EMA data in pristine state under varying temperature, starting at a temperature of 0°C and progressing in steps of 10°C until the maximum of 50°C is reached. The EMI measurements are executed between the several steps of heating, when the specimen reached steady state temperature. The data are recorded in a frequency range, which exhibits high mode density as it is recommended by Sun et al. 33 (here: 125–185 kHz). In the second part, the fatigue tests are carried out using a Schenck Hydropulse-System PEZ 4125 at constant room temperature of 20°C. The specimen mounted in the hydropulse system is shown in Figure 2(c). At different states of crack propagation, the specimen is dismounted from the hydropulse system and EMI measurements are repeated at the aforementioned temperatures in the climatic chamber. In pre-investigations on the observed components, it has been found that applying a sinusodial tensile load with a minimum of 5 kN, a maximum of 50 kN, and a frequency of 40 Hz produces slowly propagating cracks in the weld zone of the specimen. Thus, the immediate interruption of the cyclic loading for executing the EMI measurements is possible. During the fatigue test, the cyclic loading was interrupted either in intervals of 50.000 load cycles or with the sudden appearance of growing asymmetries in the strain distribution.
Experimental results
In the following part, the normalized admittance combined with the proposed temperature compensation strategy is presented. Therefore, in the first step, the strain gauge data are evaluated in order to determine the validation data for comparison with the normalized admittance results. Then, the temperature compensation method is applied and the resulting data are used for calculating the damage indicator based on the normalized admittance. The analysis and presentation of the data were done with MATLAB.
Variation of the strain distribution in the fatigue experiment
In Figure 3, the raw strain data
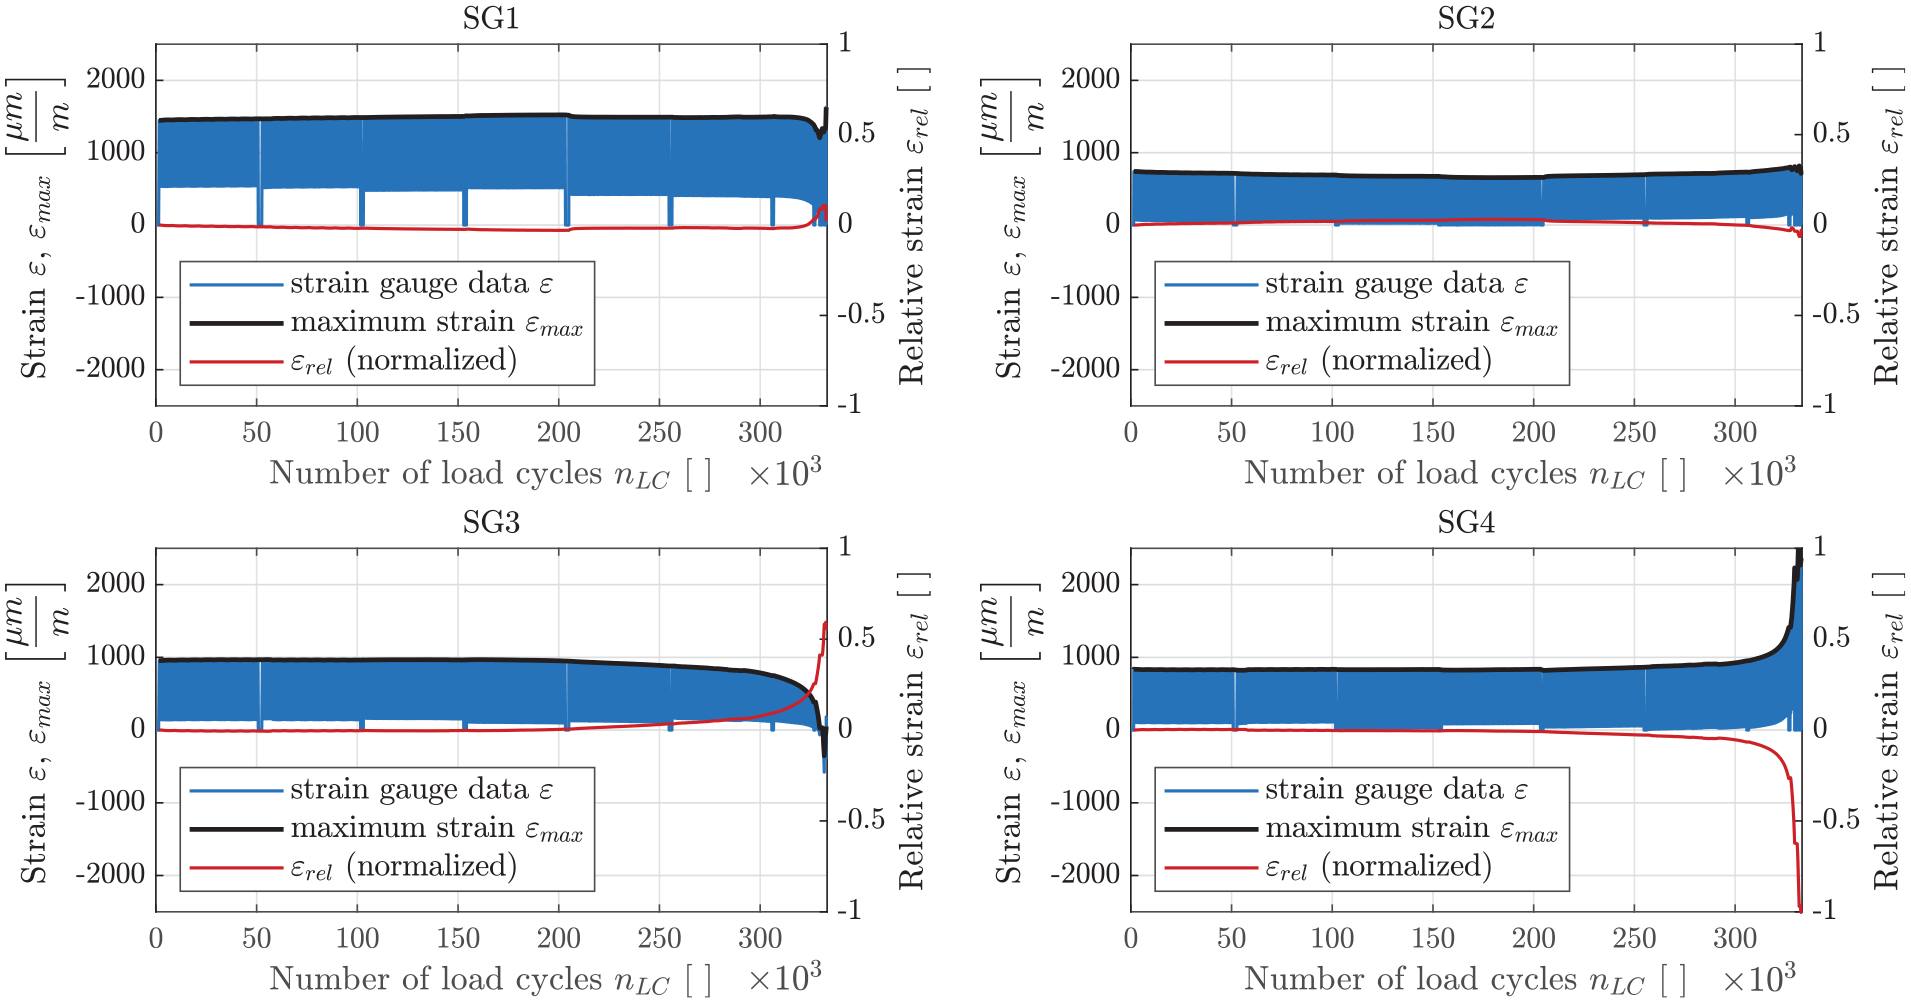
Strain gauge data, maximum strain, and relative strain of one specimen failed after 324.000 load cycles.
Damage indicator based on temperature compensated EMA spectra
Now the results of the evaluated EMA data are presented and compared to the validation data of the strain gauges. Therefore, the normalized admittance, which is introduced in Equation (12) is computed for the EMA data at the constant temperature of 20°C. In Figure 4(a) to (c), it has been applied on the original data without temperature compensation.
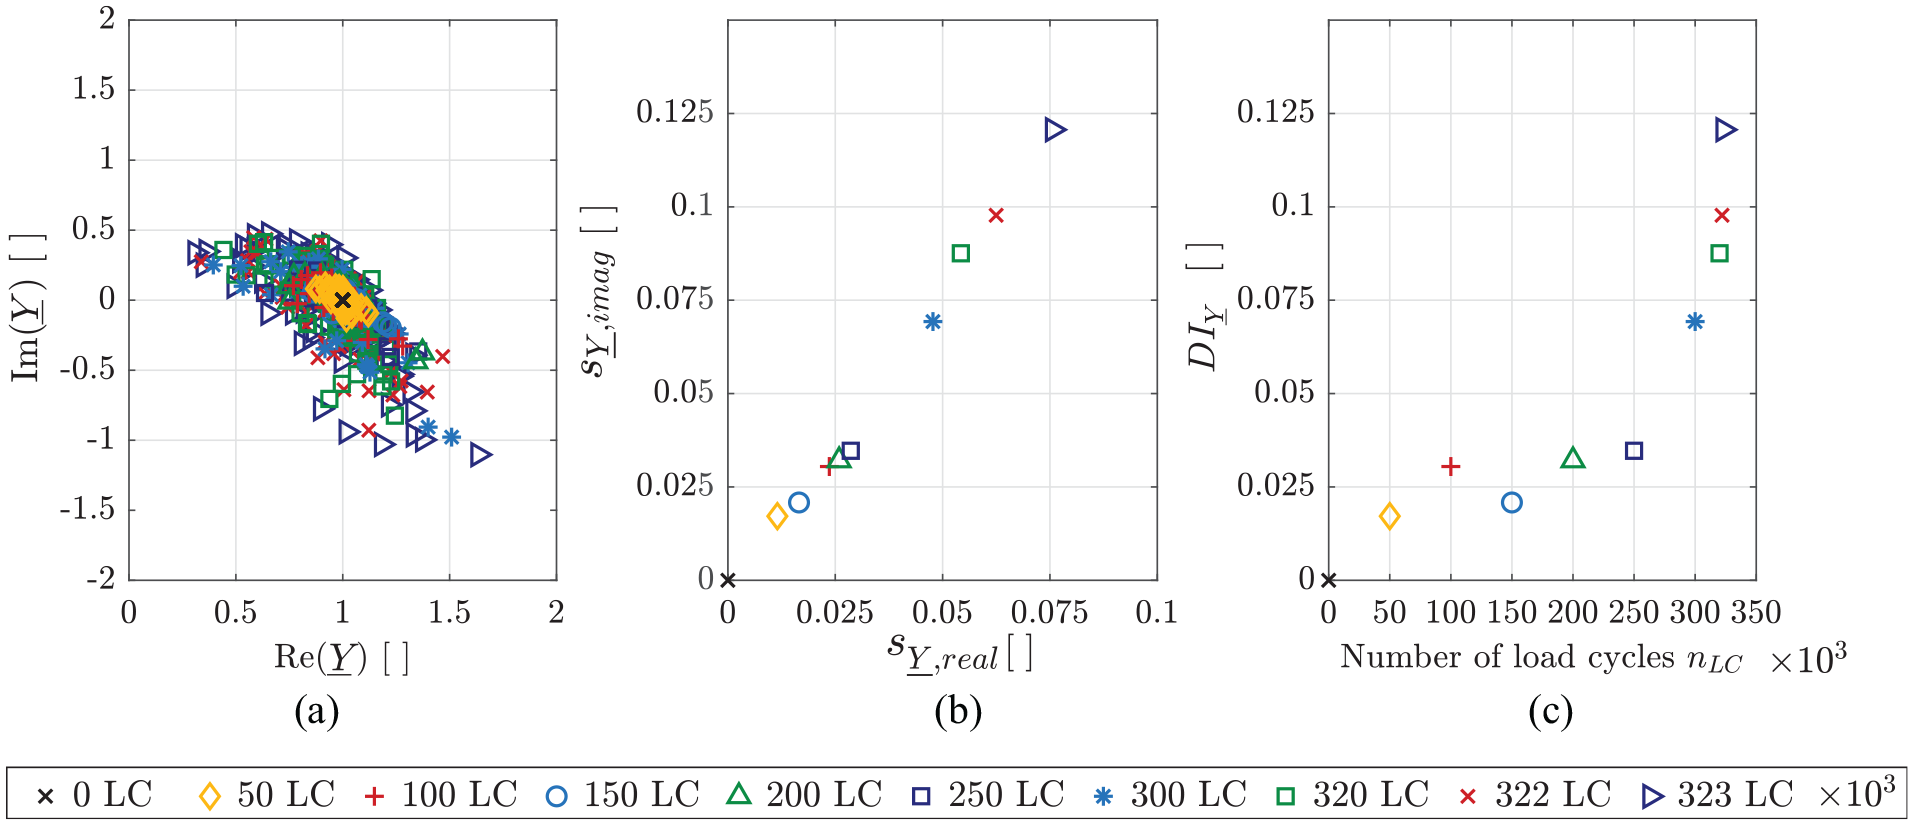
Normalized admittance without temperature compensation at 20°C computed from signatures recorded by PWAS1 in a frequency range of 135–150 kHz; (a) real and imaginary parts, (b) standard deviations of the real and imaginary parts, and (c) damage indicator
For the evaluation of the results, the imaginary parts of the normalized admittances
and
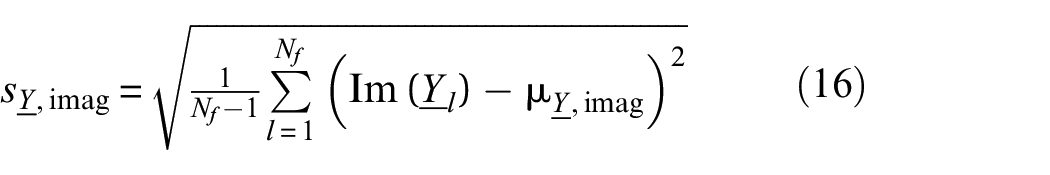
For the data which were recorded after running 50.000–250.000 load cycles, the standard deviations in Figure 4(b) remain low. After 250.000 load cycles, the scattering in Figure 4(a) starts to increase significantly. The growth rate of the data which have been recorded after 323.000 load cycles (failure occurred after 324.000 load cycles) in comparison to the data, which exhibit the smallest scattering, comes to 556% in case of the real part and to 603% in case of the imaginary part. The standard deviations increase more sharply with increasing number of load cycles. As both, the standard deviation of the real as well as of the imaginary part of the normalized admittance show a qualitative similar behavior (Figure 4), only one of the two quantities has been used as damage indicator. In the further evaluation therefore, only the imaginary part of the normalized admittance is observed and labelled as

and

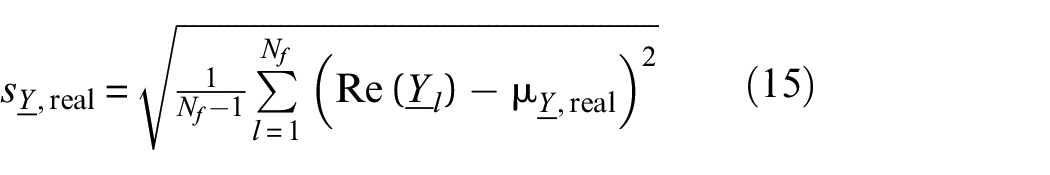
in case of the temperature compensated data (Figure 5(c)).
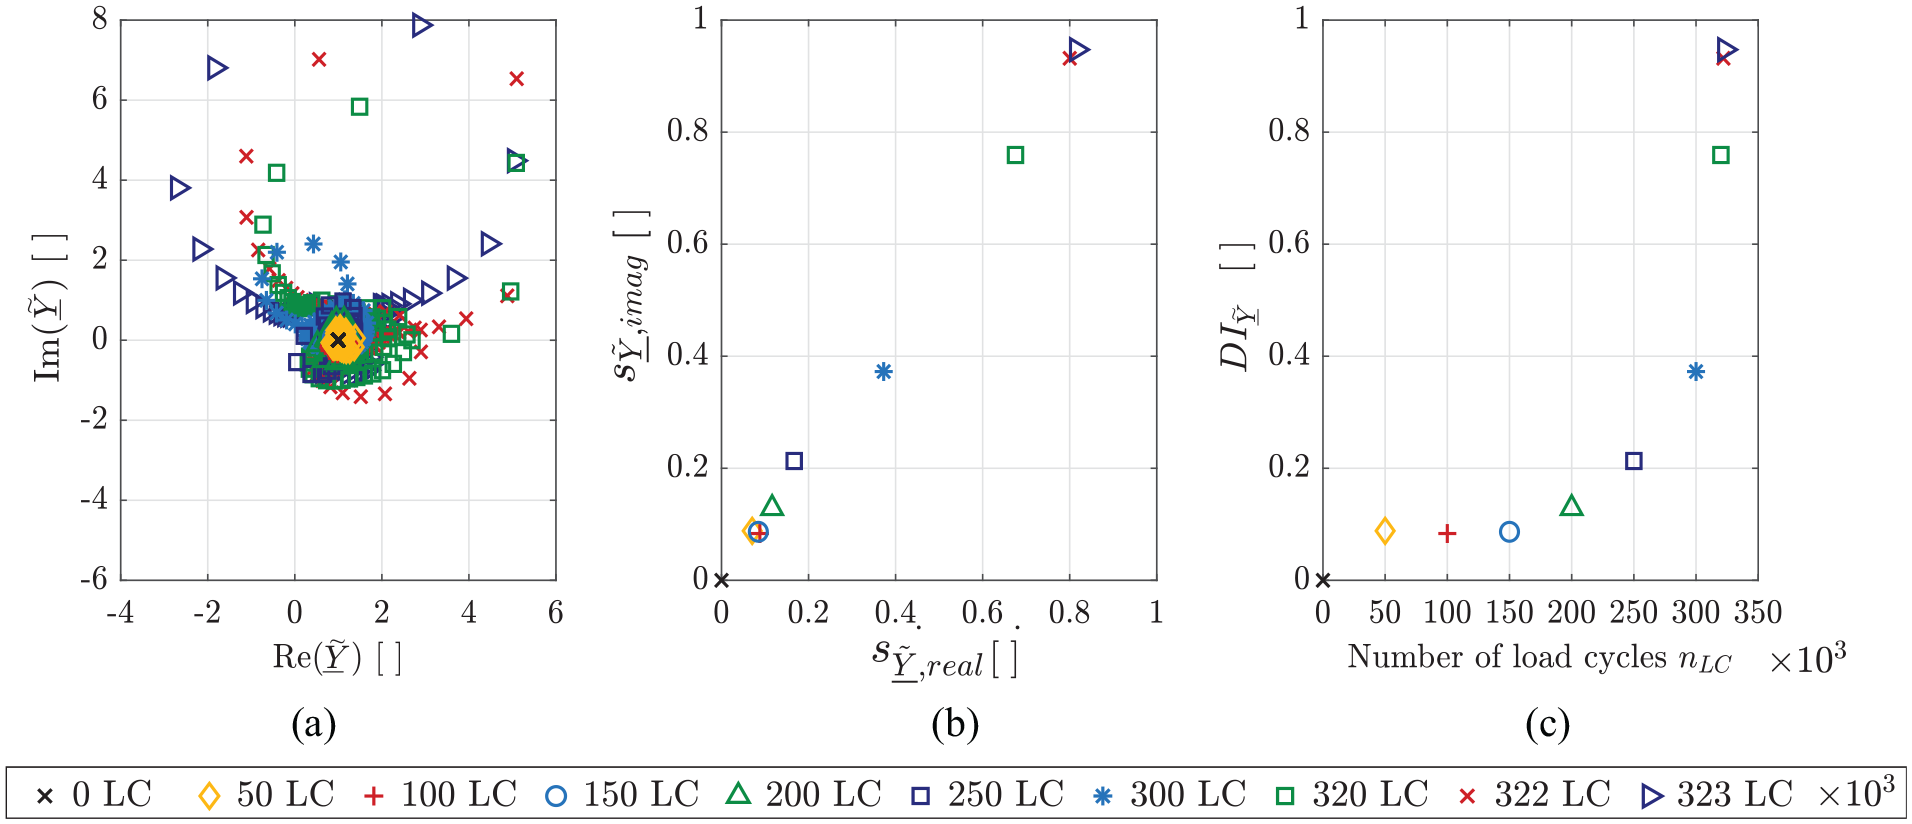
Effect of temperature compensation algorithm on normalized admittance: normalized admittance of temperature compensated data at 20°C; (a) real and imaginary parts, (b) standard deviations of the real and imaginary parts, and (c) damage indicator
Figure 5(a) presents the imaginary parts of the normalized admittance plotted against the real parts for the temperature compensated data. In this case (temperature equals baseline temperature), a temperature compensation should not be necessary. However, to show the procedure and the effect on damage evaluation, the compensation is still performed. Therefore, the normalized admittance is computed for the original data recorded at 20°C, which have been temperature compensated. The data range increased remarkably in comparison to Figure 4(a). This is attributed to the increased scattering of the data in the presence of damage: In case of the original data, the susceptance or the slope of the susceptance, respectively, makes a great contribution to the normalized admittance in contrast to the conductance, as it is much higher. When the slope is eliminated, the peaks represented in the susceptance are more pronounced and, therefore, the damage sensitivity becomes higher. This is confirmed by Figure 5(b) and (c): The growth rate of the data which have been recorded after 323.000 load cycles in comparison to the data which exhibit the smallest scattering comes to 860% in case of the real part and to 973% in case of the imaginary part.
The results for the original as well as for the temperature compensated data are shown exemplarily for one specimen. Figure 6 contains the damage indicator
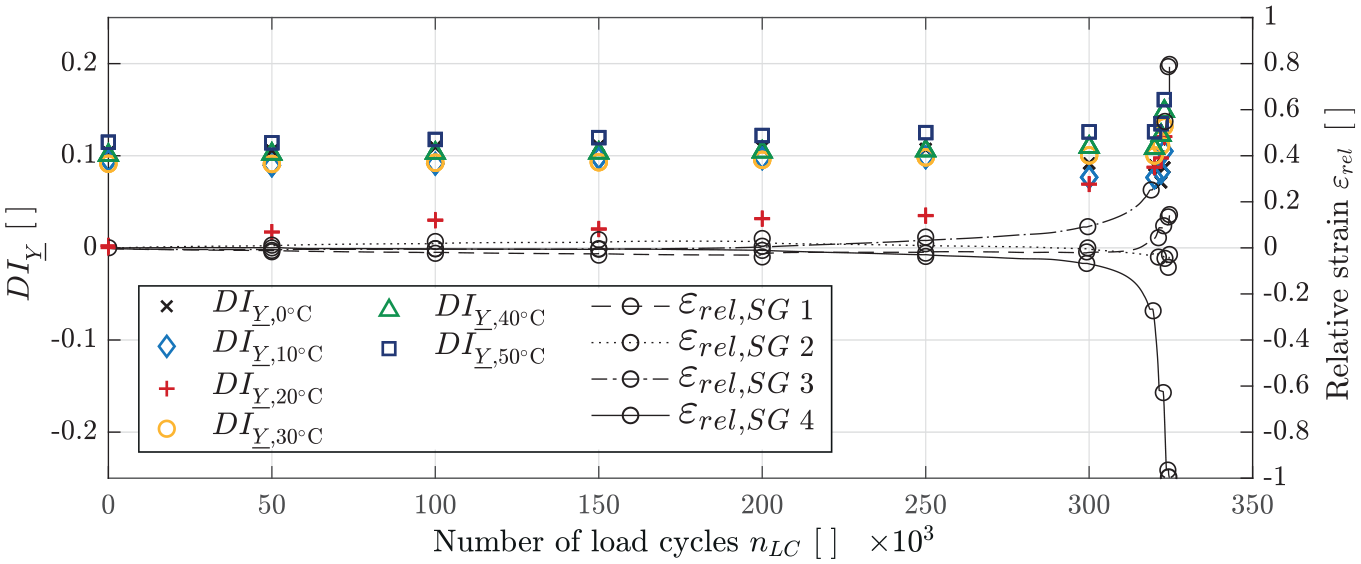
The damage indicator
In Figure 7(a), the damage indicator
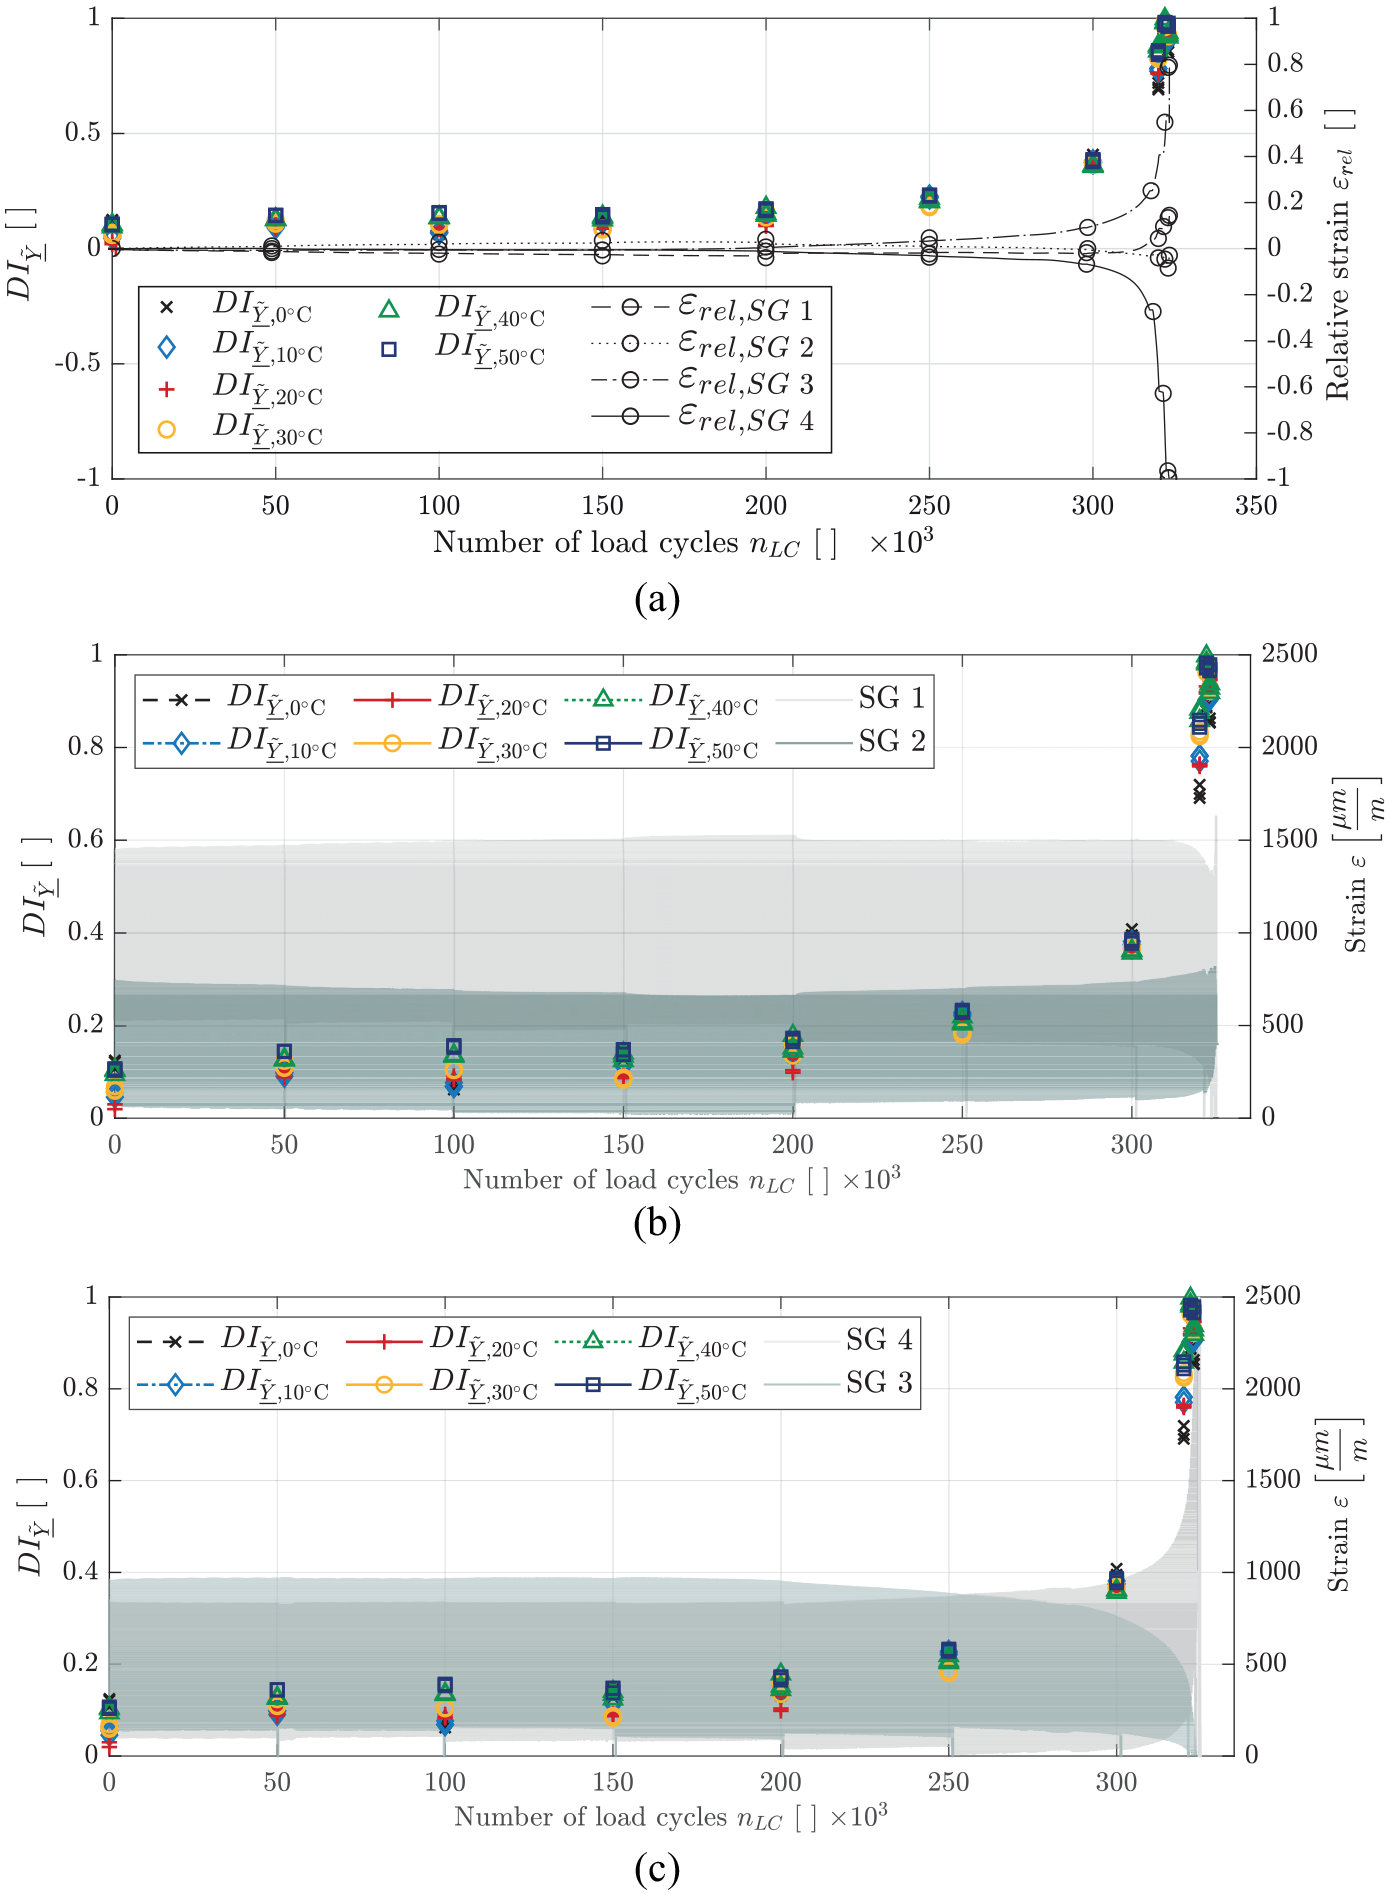
The damage indicator
This investigation exhibits an approach for a damage indicator, which is calculated from temperature affected data. It shows a good correlation with the quantities derived from the strain at the circumferential surface of the specimen.
Discussion
This section contains an overview of similarities and differences with the work of Sahm et al.
29
regarding the investigation of bolts used in rail supports. Afterwards, the proposed approach for the damage indicator
Just as in this work, Sahm et al. 29 investigated the monitoring of bolts used in rail supports by observing EMA spectra. Their study consists of preliminary investigations of the effects of varying temperature, varying pretension of the bolt, cuts in the bolt as well as fatigue cracks on the EMA spectra in general. The evaluation of the data was only conducted by the correlation coefficient. In contrast to their study, an approach for a damage indicator in combination with a temperature compensation algorithm was developed in this study.
The next paragraph contains a comparison of the proposed damage indicator
Therefore, the indicators are computed for the non-temperature compensated data as well as for the temperature compensated data. Thereby, the effect of the damage on the proposed indicator can be compared to the above mentioned indicators. Additionally, the effect of the temperature compensation strategy on the several indicators can be observed. Note that regarding the non-temperature compensated data, the commonly used indicators are compared to the non-temperature compensated indicator
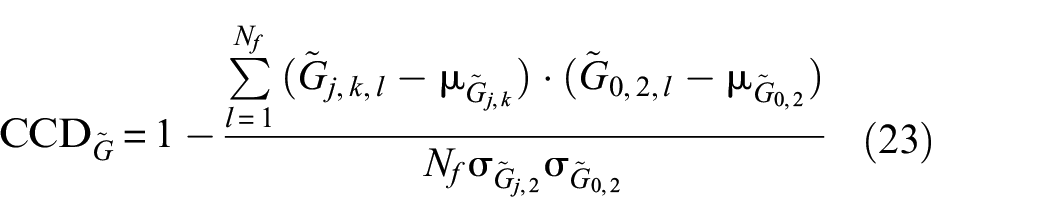
The indicators computed for the non-compensated temperature data with the baseline at 20°C are defined as follows: Equation (19) describes the CCD
G
indicator for the conductance
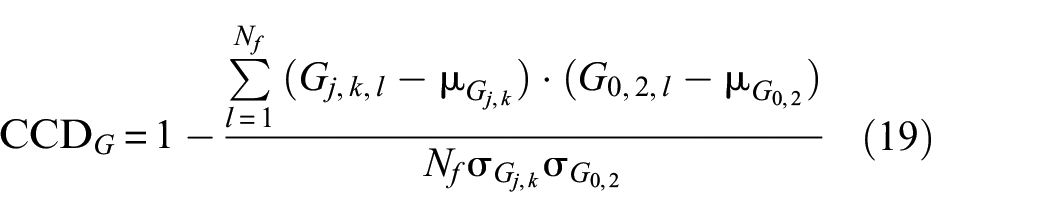
where
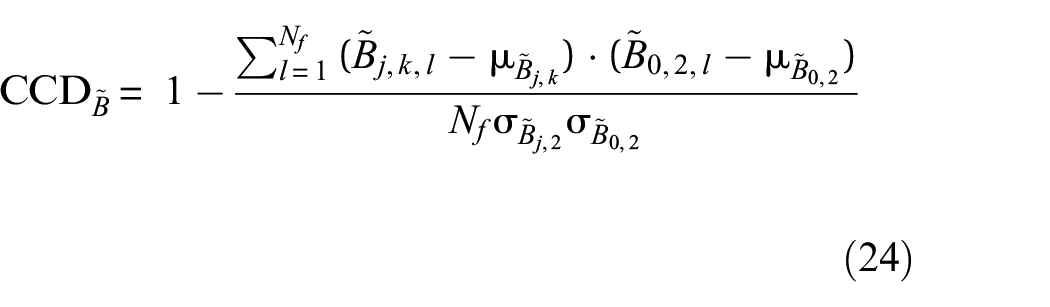
Equation (20) shows the
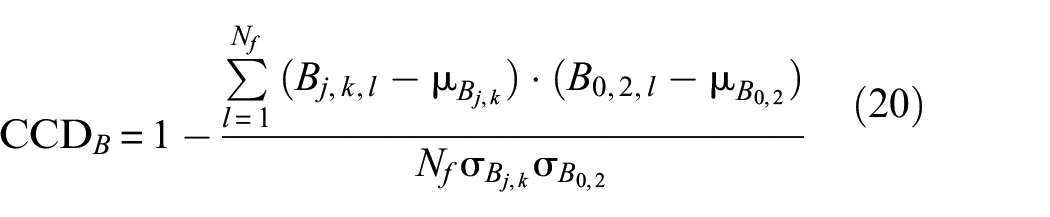
where
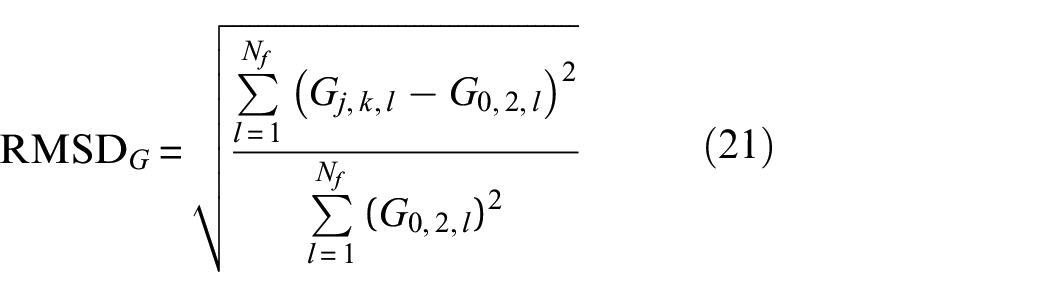
Equation (21) describes the RMSD
G
indicator for the conductance
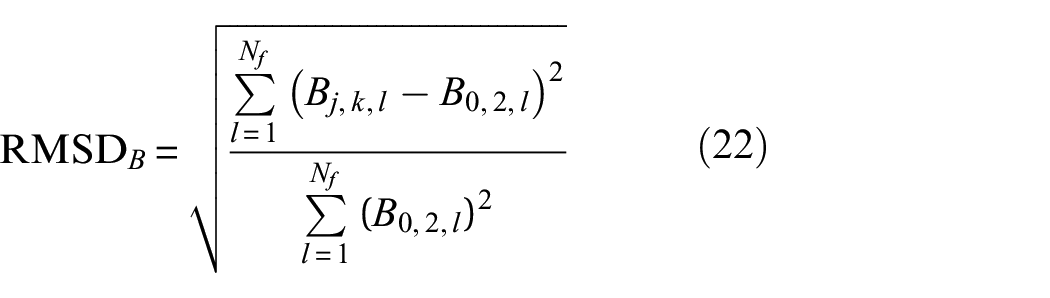
and Equation (22) describes the RMSD
B
indicator for the susceptance
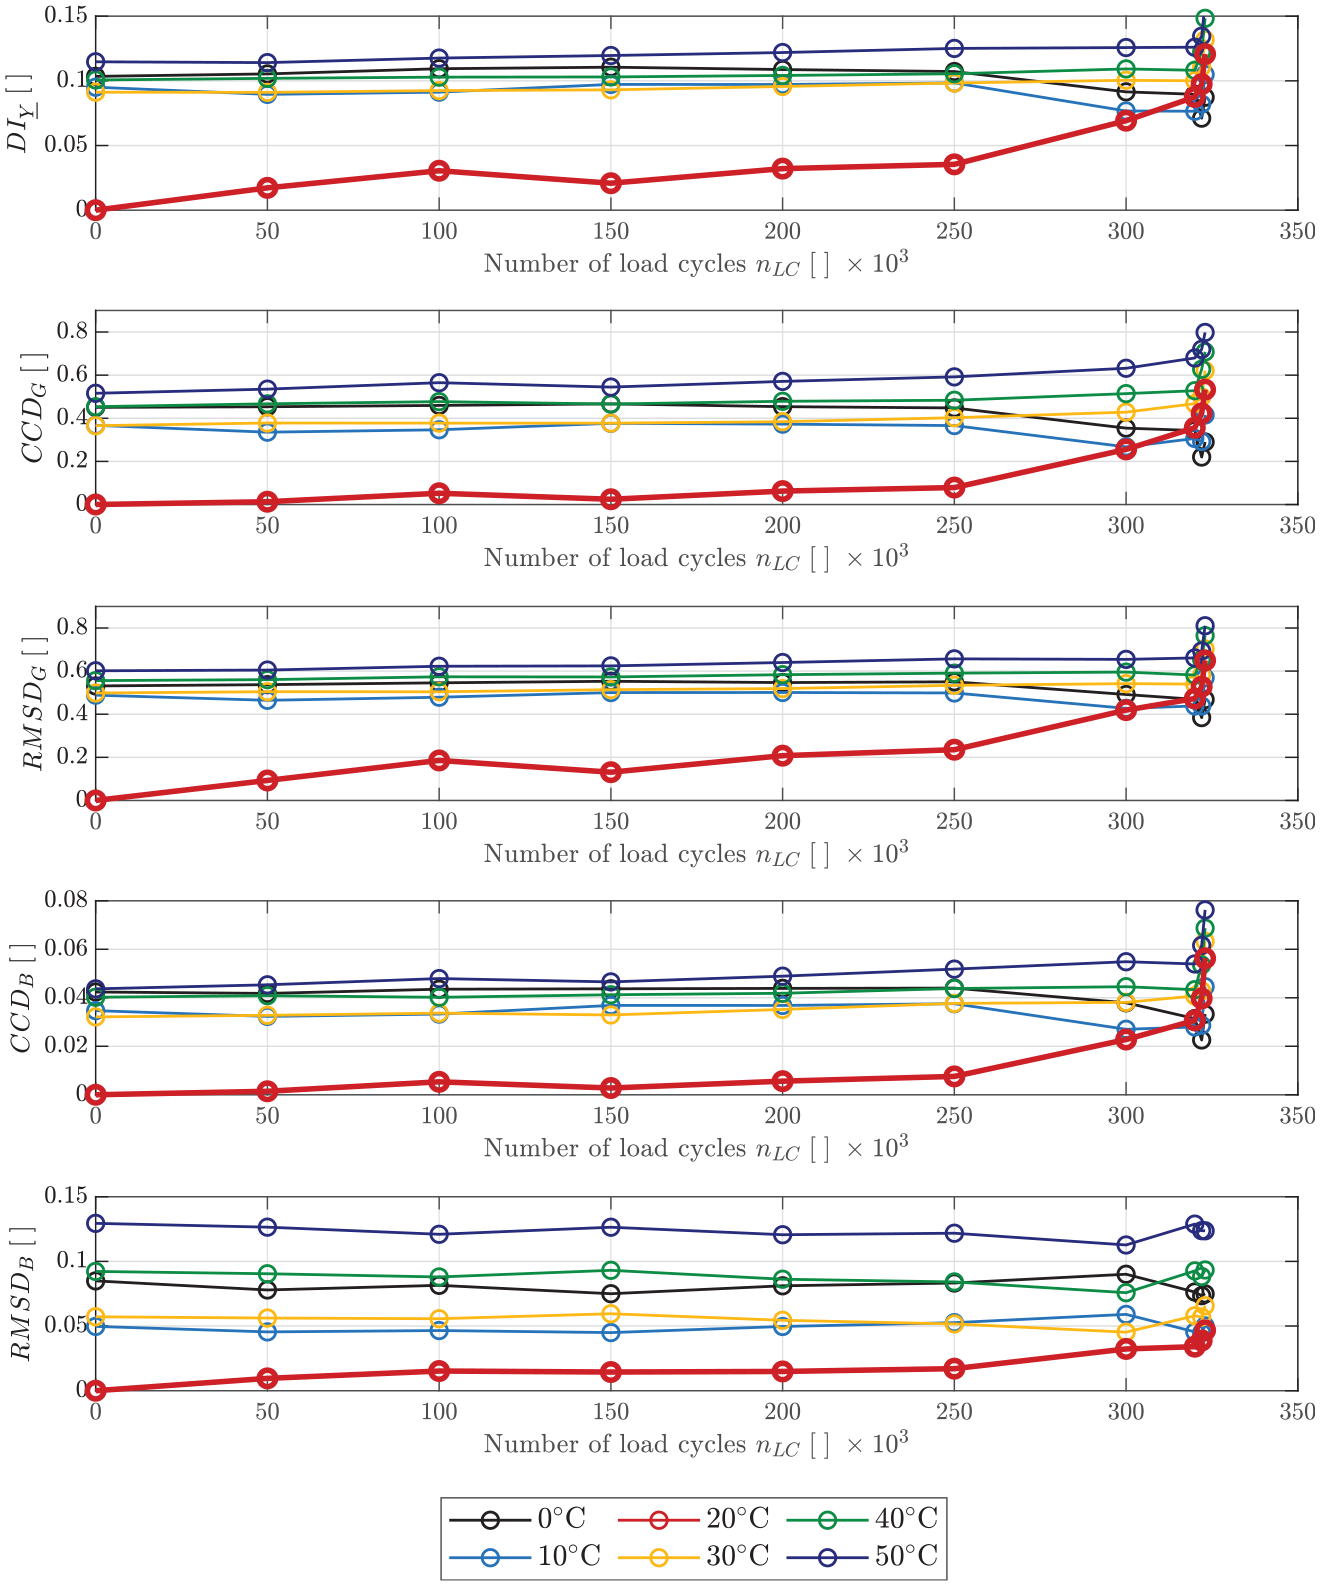
In Figure 9, the several indicators defined in Equations (19) to (22) as well as the proposed indicator
For further comparison of the proposed strategy, the indicators are calculated for the temperature compensated data. The corresponding equations for
where
where

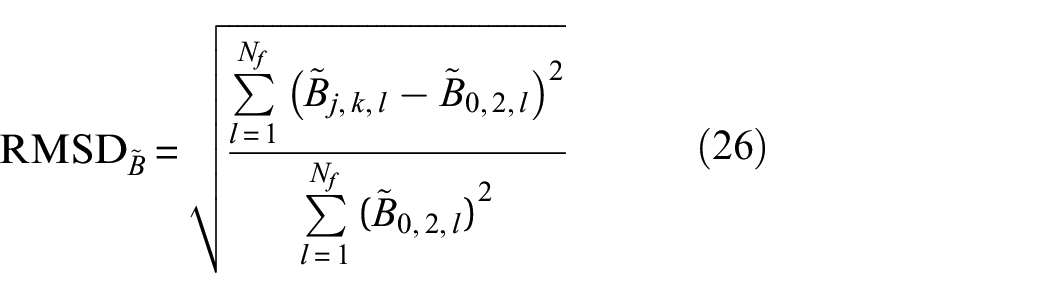
Figure 8 shows the five damage indicators for the six different temperatures. None of them ensure full temperature compensation, as all values for a damage state differ under varying temperatures. But in comparison to Figure 9, the temperature effects are significantly reduced and the influence of the damage is more pronounced. Regarding the
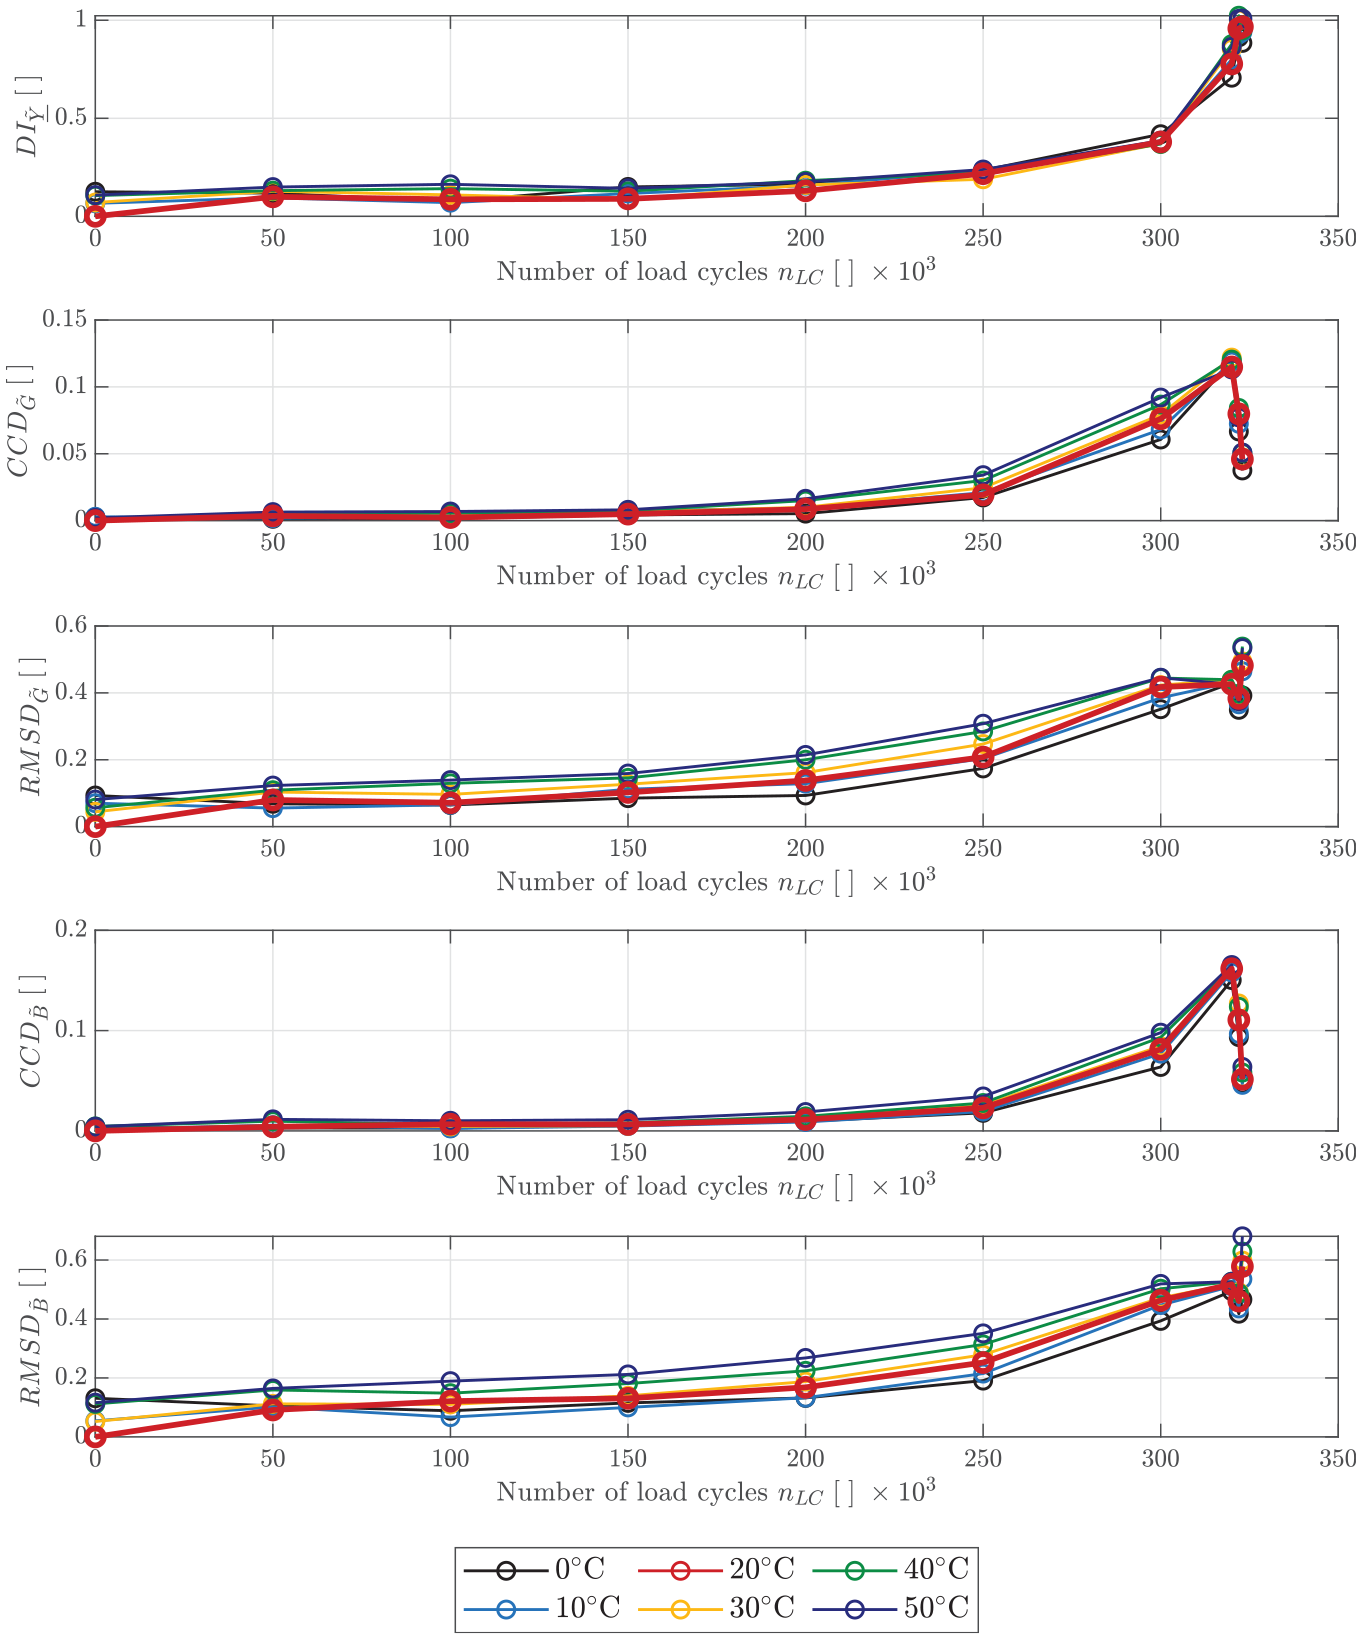
The damage indicator
The damage indicator
Figure 10 shows the broken threaded bolt in the upper picture and the fracture surface of the welded joint after the failure of the specimen due to the fatigue crack from two perspectives. In the middle, the top view is shown and at the bottom this area was photographed from an angular viewing direction. It is clearly visible that the bolt is undamaged on its circumferential surface. The black color of the surface is the result of the drawn arc stud welding process. It can be seen that the crack has progressed within the welded area between the bolt and the base plate. As the bolt is surrounded by a weld bead at the contact to the base plate, it prevented the observation of the growing crack by the application of crack propagation gauges. This concerned all samples observed in this study as well as in preliminary studies. In the upper part of the figure, the dark area of the fracture surface is assigned to the forced rupture area. This part stood connected almost until the specimen failed. The brighter part is assigned to the area, where the fatigue crack propagated until the specimen failed. This corresponds to ≈57% and is considered as crack size at 324.000 load cycles. As the strain changes noticeable, at about 200.000 load cycles, the start of the crack growth is estimated at this point. The increase of the
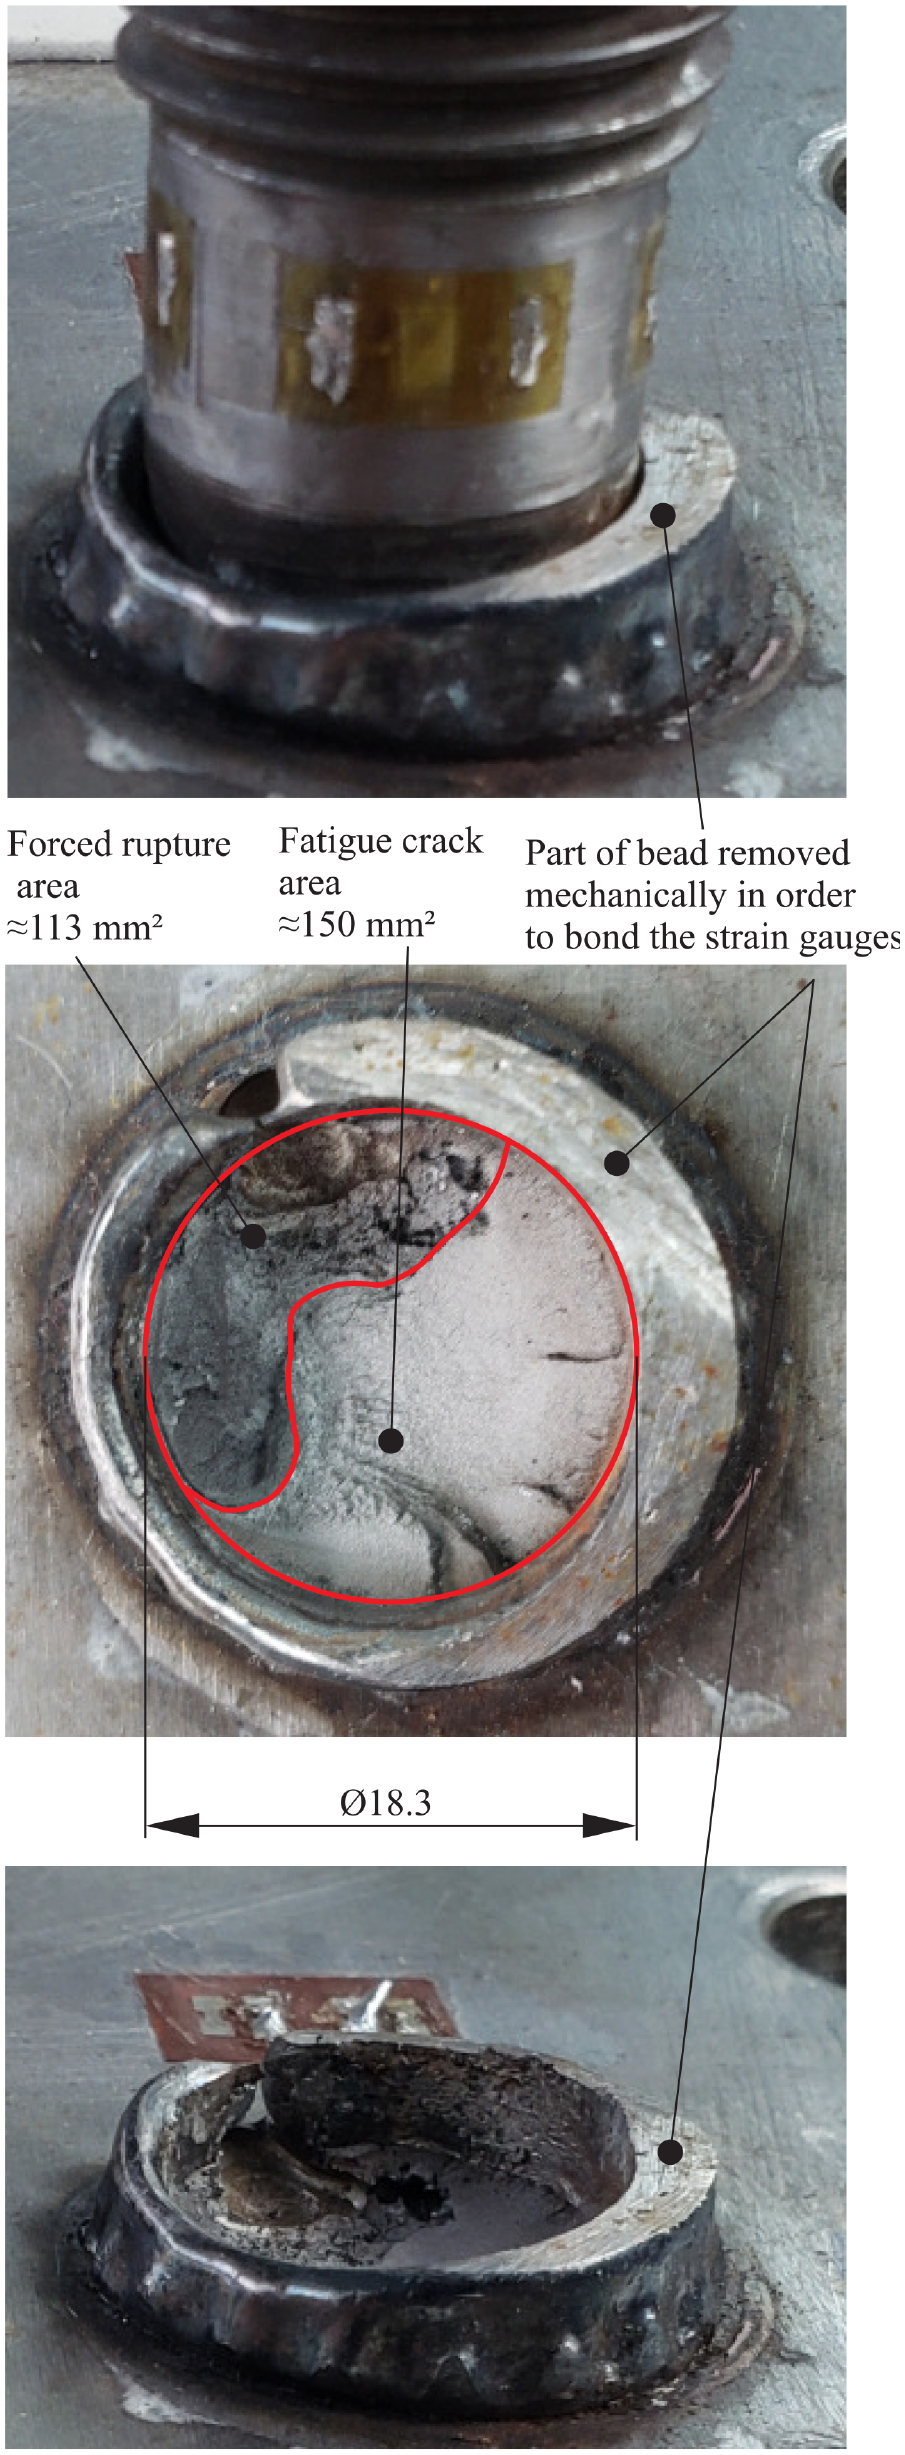
Crack pattern.
Conclusion and outlook
In this work, an approach for a novel damage indicator for the monitoring of fatigue crack propagation under varying ambient temperature between 0°C and 50°C based on the EMA has been proposed. For this study, fatigue experiments on real structures have been carried out. As it wasn’t possible to employ crack propagation gauges, the strain distribution of the cross-section area above the weld zone was observed. The relative strain and the raw strain data have been used representatively for gaining information about the crack growth. Furthermore, estimates about the sensitivity have been made with the help of the crack pattern.
The approach for the novel damage indicator
The results of the temperature compensation method show substantial, but not a full reduction of the temperature effects on the EMA data recorded at varying temperatures between 0°C and 50°C. This is assigned to the temperature compensation algorithm, which does only compensate for the frequency shifts of the peaks in the data and the slope of the susceptance, but not for the changing heights of the peaks of the data. The proposed damage indicator shows a very good correlation with the quantities derived from the strain measured at the circumferential surface of the specimen, which are attributed to the crack propagation. However, when no temperature variations are expected and, therefore, no temperature compensation is needed, also common damage indicators like the CCD or the RMSD can be used for the corresponding application.
As a topic for further research, it would be desirable to get a direct relationship between the damage indicator and the crack size. In future studies, the normalized admittance and the redistribution of data points in the Im-Re-plot with increasing change of the strain distribution will be further investigated. Therefore, a huge amount of fatigue tests are planned with the objective to statistically validate the derived damage indicator. In addition, the method shall be developed for industrial applications.
Footnotes
Acknowledgements
Furthermore, the authors would like to acknowledge the support given by Prof. Dr.-Ing. PD Kerstin Weinberg and Dr.-Ing. Ralf Nötzel of the Solid Mechanics Group, University of Siegen, while carrying out the fatigue experiments presented in this article.
Declaration of conflicting interests
The author(s) declared no potential conflicts of interest with respect to the research, authorship, and/or publication of this article.
Funding
The author(s) disclosed receipt of the following financial support for the research, authorship, and/or publication of this article: This research project was funded by the Faculty IV of the University of Siegen.