
Abstract
Displacement is an essential indicator of the functioning and safety of long-span cable-supported bridges under operational conditions. However, displacement estimation is challenging as these bridges are simultaneously subjected to various loading conditions such as temperature, wind, and vehicles. This article investigates an approach for estimating bridge displacement responses under multiple loads using a residual autoencoder model. Monitoring data of a cable-stayed bridge are collected to validate the proposed approach, including comprehensive measurements of the various loads and the displacement responses. Characteristics of temperature, wind, and vehicle loads are taken as the input, and the displacement responses at the mid-span of the main girder and top of the two pylons are taken as the output. The results showed the effectiveness of the proposed approach with an accuracy higher than 95%, which clearly outperformed other models such as long short-term memory networks in accuracy and efficiency. The effects of different types of loads are also investigated, and the wind load is found to be the most influential. Furthermore, multistep ahead prediction is carried out using the proposed approach, and good accuracy is achieved even 5 min ahead. The proposed approach can shed light on early warning of the malfunction of the bridge.
Keywords
Introduction
In recent years, numerous cable-supported bridges have been constructed worldwide to support the traffic network. They are usually built on essential routes and should be maintained in a healthy condition to ensure their serviceability and safety. After completion, bridges are subject to harsh environments such as strong winds, extreme temperature, and heavy vehicles, which poses challenges for bridge management and maintenance. The displacement responses can be used directly and indirectly for structural safety assessment as it reacts sensitively to loads applied to the structure.
Traditional routine inspection is costly in time and labor force, which is often inadequate for efficient bridge maintenance. Therefore, structural health monitoring (SHM) systems have enjoyed more popularity in long-span cable-supported bridges.1–4 SHM can provide real-time information on bridge behavior for early warning of potential hazards and evaluation of damages in important components such as expansion joints,5–7 stay cables,8,9 and suspenders.10–12 Monitored parameters can be categorized into input and output parameters for the bridge system.13,14 The former includes traffic loading and environmental effects such as wind and temperature. And the latter includes bridge responses such as displacement, strain, and acceleration at concerned locations. Owing to the SHM development, the behavior of long-span bridges has been captured under thermal loads,15,16 strong winds,17,18 vehicles,19,20 trainloads,21,22 or earthquakes.23,24
Among the different monitored parameters, displacements of the main girder and pylon of cable-supported bridges provide important information for the functioning of bridges, and they are usually monitored with global positioning system (GPS) sensors. For example, displacement is often measured during static load test before opening for traffic, especially for long-span cable-stayed bridges.25,26 The purpose is usually to evaluate the bridge performance according to the design requirement. Displacement responses can be obtained from acceleration measurement, but they are not very accurate. Moreover, displacement of long-span bridges is affected by various loads, such as temperature, wind, or vehicles, and they have been investigated in the past few years. Cao et al. 27 utilized the monitoring data to investigate the thermal behavior of a cable-stayed bridge with a steel box girder. The displacements of the main girder and the towers were found to be affected by the temperature variation. Based on field temperature and displacement measurements on an operational cable-stayed bridge, Zhou and Sun 28 investigated mechanisms of thermally induced variations in girder length and mid-span deflection. Liu et al. 29 proposed an approach based on long short-term memory (LSTM) network to estimate the wind spectrum, then applied a finite element (FE) bridge model to compute wind-induced buffeting responses. Westgate et al. 30 analyzed the monitored data of a suspension bridge and studied the deflection of towers and the deck during the passage of a 269-tonne trailer. These results showed an accurate match with the response predicted by an FE model of the bridge. Browhjohn et al. 31 investigated displacement responses of two suspension bridges under operational and extreme loads. A comparison of the effects of vehicular, thermal, and wind loads indicated that temperature variations dominate quasi-static response apart from rare extreme traffic and wind loads. Jesus et al. 32 developed a modular Bayesian framework to investigate the effects of temperature and traffic on displacement and natural frequency response of a suspension bridge. Results demonstrated that the bridge mid-span displacements are predicted more accurately than the natural frequencies.
Though SHM systems can directly provide the bridge responses, data interpretation is an intricate task. First, bridges are often under load effect levels much lower than the design capacity, and noise can seldom be eliminated. Second, various loads such as wind, temperature, and vehicles simultaneously affect the bridge response, which are difficult to decouple. Therefore, it is necessary to develop a robust and reliable approach to predict the displacement responses. Advances in machine learning have opened an opportunity to exploit a tremendous amount of measured data with various sources of factors involved.33,34 Commonly used machine learning algorithms include artificial neural networks,35–37 cluster analysis, 38 support vector machines,39,40 and transfer learning. 41 The state-of-the-art on the application of machine learning methods in SHM of civil infrastructures was reviewed in several studies.42–45
An autoencoder (AE) is a type of learning architecture that employs the encoder and decoder blocks to compress the inputs to small latent features and then reconstruct the target outputs to the same size as the inputs.46,47 Wang and Cha 48 used the AE to reconstruct the high-precision structural responses and detect structural damages. Fernandez-Navamuel et al. 49 proposed a partially explainable AE to duplicate and improve the data reduction and reconstruction ability of principal component analysis. It improves the identification capability of anomalies and allows for the detection of minor damages. Sarwar and Cantero 50 trained the AE model with the vertical acceleration data from several vehicles to detect the bridge damages. The error in signal reconstruction from the trained AE model is sensitive to damages. Li et al. 8 developed a novelty detection method based on cable force correlation using spatiotemporal graph convolutional networks, and it was verified in detecting sensor fault and structural variation of a cable-stayed bridge. Fan 51 employed AEs with skip connection to reconstruct the incomplete measured vibration data with a high loss ratio. The identified modal characteristics between the original and reconstructed signals exhibit excellent agreement. The AE model provides a stable and accurate response reconstruction method for the measured response of the structure.52,53
In this paper, a method is developed to predict the displacement responses of a cable-stayed bridge based on a residual autoencoder (ResAE) model, which is investigated using the monitoring data under temperature, wind, and vehicle loads simultaneously. The strengths of this model are as follows. (1) It is designed with multiple convolutional, sampling, pooling, and other layers in the architecture of encoder–decoder. The displacement response could be precisely reconstructed based on the extracted features within the different load types and between the loads and response. The residual learning is also added in each block to alleviate the issue of gradient vanishing. (2) With the exclusion of each type of the load in the input dataset, the significance of load types could be revealed. The dominant loads might vary for each operating period. (3) The proposed model could also achieve multistep ahead response predictions. This could benefit the bridge operator in managing the structure when future responses are obtained in advance.
The remaining part of the article is organized as follows. Firstly, the cable-stayed bridge and its SHM system are introduced as a case study of the proposed method. The traffic, temperature, and wind data are presented as the input variables, while girder and pylon displacement data are described as the output variables of the prediction. Secondly, the proposed deep learning-based approach is designed to incorporate the characteristics of the multiple loads, and the model performance metrics are described. Thirdly, the model training and the predicted results are given, and the prediction accuracy represented by
The case-study bridge and the monitoring data
Description of the cable-stayed bridge and the SHM system
Anqing Bridge is a cable-stayed bridge on the Yangtze River that opened in 2004 in Anqing city of Anhui Province, China. It comprises a middle span of 510 m, two side spans of 215 m, and two transition spans of 50 m, respectively, as shown in Figure 1. The streamlined steel box girder has a depth of 3 m and a width of 30 m, accommodating a four-lane highway. They are supported by a fan-shaped double cable-plane system, with a total of 128 parallel-strand stay cables of the length between 92.8 m and 274.1 m. The typical distance between adjacent cables is 15 m on the deck and 2–4 m on the pylon. The bridge has two reversed-Y-shaped reinforced concrete pylons of around 184.63 m tall, which are supported by a bored pile foundation with a concrete cap. There are 12 bearings in total supporting the steel box girder vertically. At both ends of the bridge, two modular type expansion joints are installed for longitudinal movement with a capacity of 1440 mm.
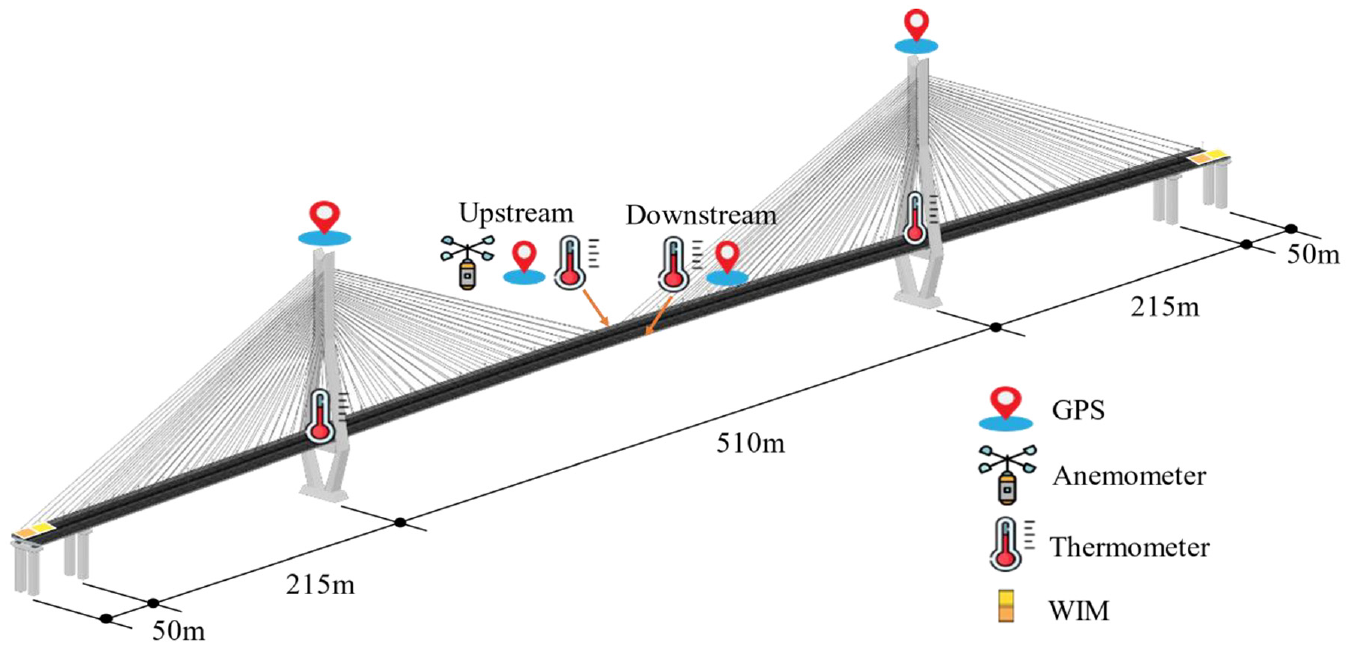
Layout of the structural health monitoring system.
To better monitor the structural behavior, an SHM system was deployed on Anqing Bridge, which includes sensors measuring wind speed and direction, temperature, strain, acceleration, displacement, and so on. This study investigates the displacement responses under multiple loads, and only the layout of the relevant sensor locations is illustrated in Figure 1. The three-dimensional supersonic anemometer is deployed in the middle of the deck on the upstream side. There are four temperature sensors installed at the cross-sections of the mid-span and the two pylons, respectively. Two GPS antennae are installed on upstream and downstream sides at the mid-span, and another two on top of the two pylons. As vehicle loads have significant influences on bridge performance, a WIM system was installed on Anqing Bridge at the entrance of the approach bridge that measured the weight and speed of the passing vehicles.
Monitoring data
The datasets extracted from SHM of the case-study bridge are introduced in this subsection. In the surrogate model, the input variables include three main types, which are traffic, wind, and temperature, respectively. The output variables include displacements of the girder and the pylon. In total, monitoring data for five successive days were collected, which started from 13:15 on December 16, 2014. Each sample was processed on a 1-min scale. As the monitoring system did not record 18 min of data, 7182 samples were finally used to establish the datasets of this study.
Traffic data
Effects of roadway traffic loads on bridge responses have been indicated as significantly influencing displacements of long-span cable-supported bridges. The traffic data are obtained from the WIM system, which covers the traffic volume, vehicle weight, and vehicles speed in each lane on the deck. In this study, six input variables are used to represent the traffic data, which are vehicle volume, vehicle average speed, and vehicle average weight on both upstream and downstream sides of the bridge. Vehicle volume is defined as the number of passing vehicles in 1 min, while vehicle average speed and vehicle average weight are obtained with all passing vehicles in 1 min.
The details of the six parameters are illustrated in Figure 2, which clearly shows the periodic characteristic of the traffic data. However, an offset of the peak positions is indicated in Figure 2(c) compared with Figure 2(a) and (b). It can be explained that the traffic volume is larger during the daytime, while it is much smaller during the night. And the vehicles during the daytime are often passenger cars which are lighter and faster, while the freight trucks usually run at night at a lower speed. Figure 2(c) also demonstrated a larger vehicle average weight on the upstream side. The reason is that this direction leads to Anqing city, and goods are often transported to the city at night.
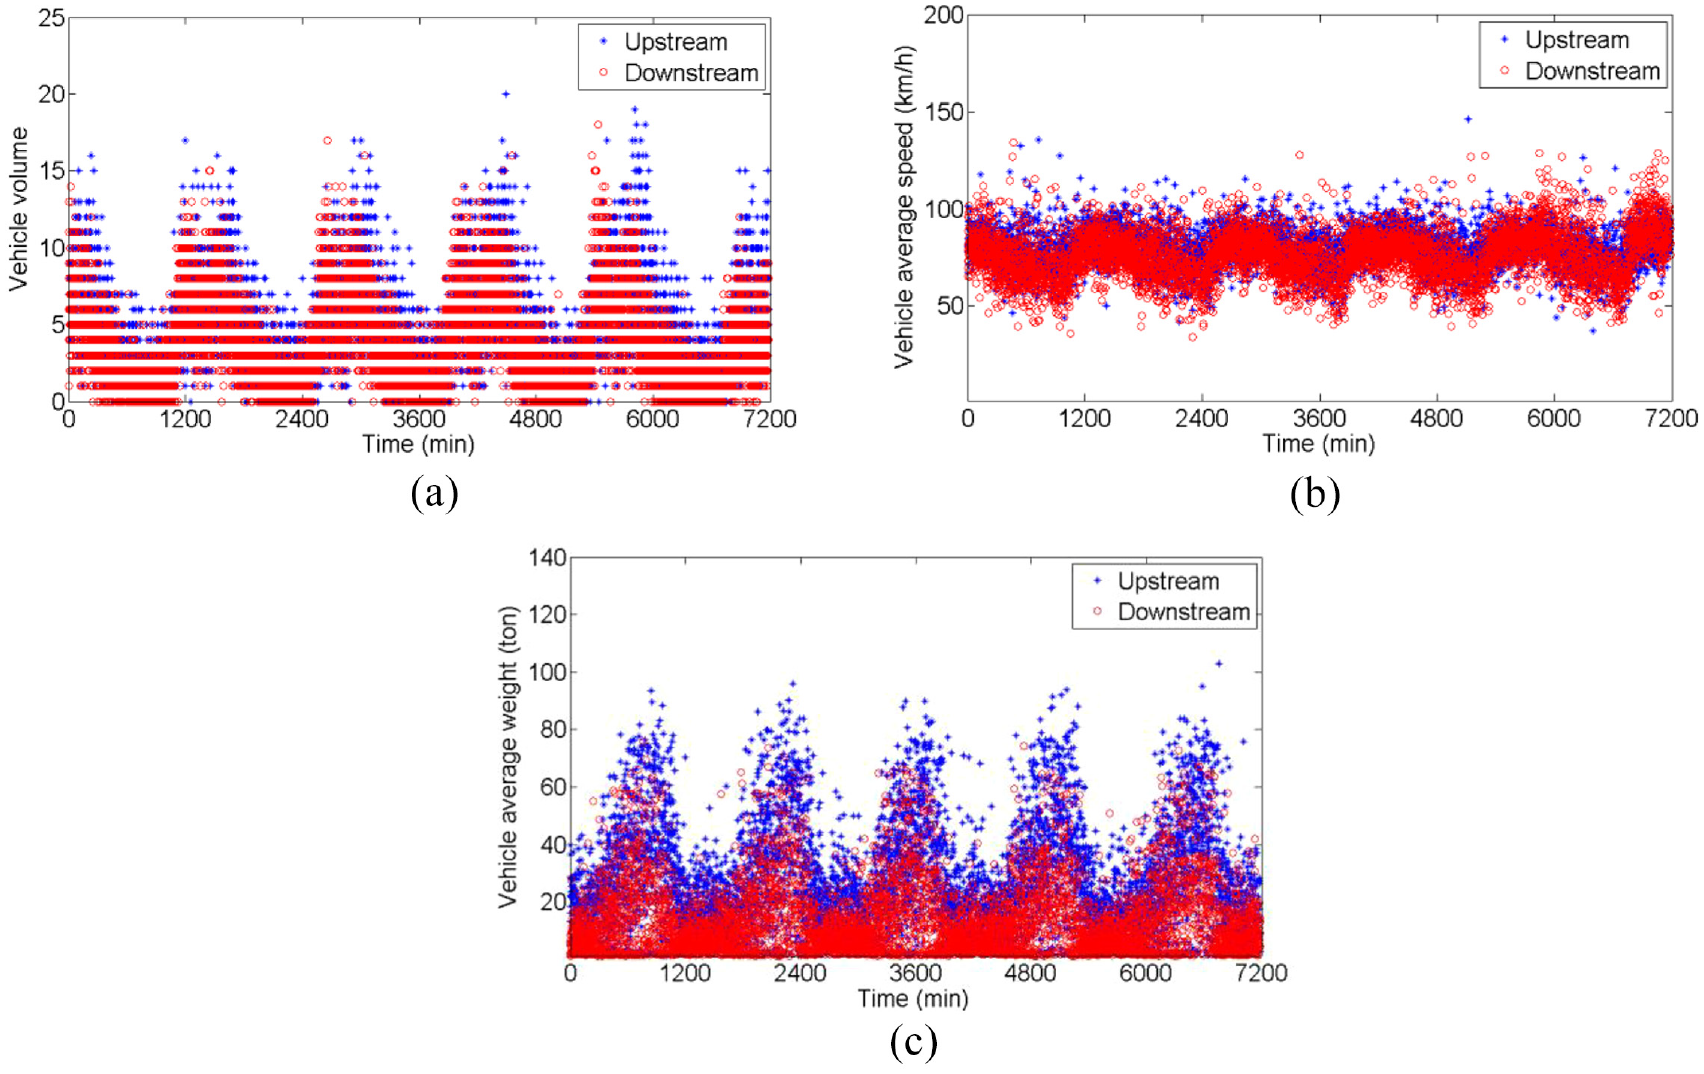
Measured traffic data. (a) Vehicle volume variation. (b) Vehicle average speed. (c) Vehicle average weight.
Temperature data
Temperature data are extracted from the four positions indicated in Figure 1, and the average is calculated as the input variable. The 1 min average temperature amplitudes in the 5 days are illustrated in Figure 3. It can be observed that there is a clearly daily periodic pattern in the temperature data. This characteristic has been indicated by the previous studies5,54 on monitoring data. The temperature varies between −1.3 and 13.9°C in this period.
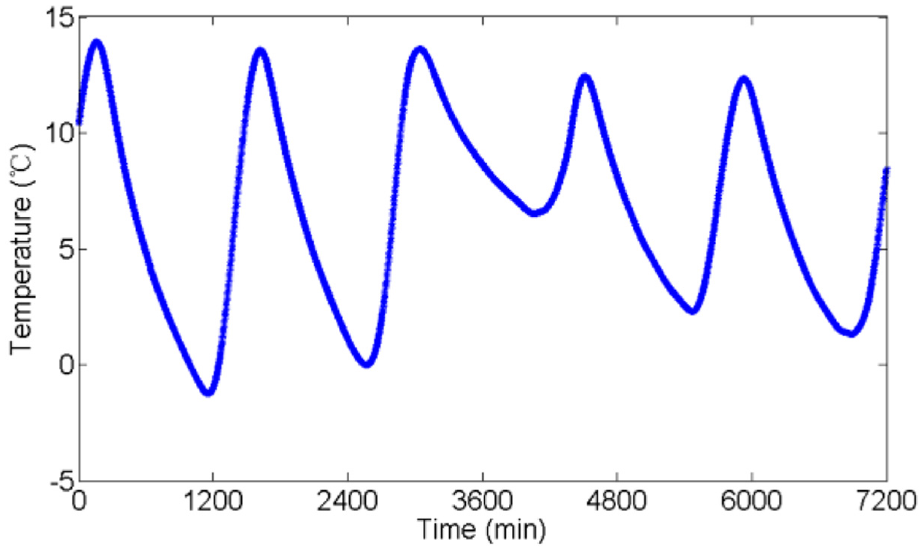
Temperature data.
Wind data
Wind data is obtained with the anemometer at the mid-span of the bridge on the upstream side. The 1-min mean values of the wind direction and wind speed are shown in Figure 4(a) and (b). The north and east are defined as 0° and 90° for the wind direction. A large variation is noticed in this period, and the northwest and northeast winds are dominant. The wind speed is generally under 9 m/s, indicating a relatively moderate wind.
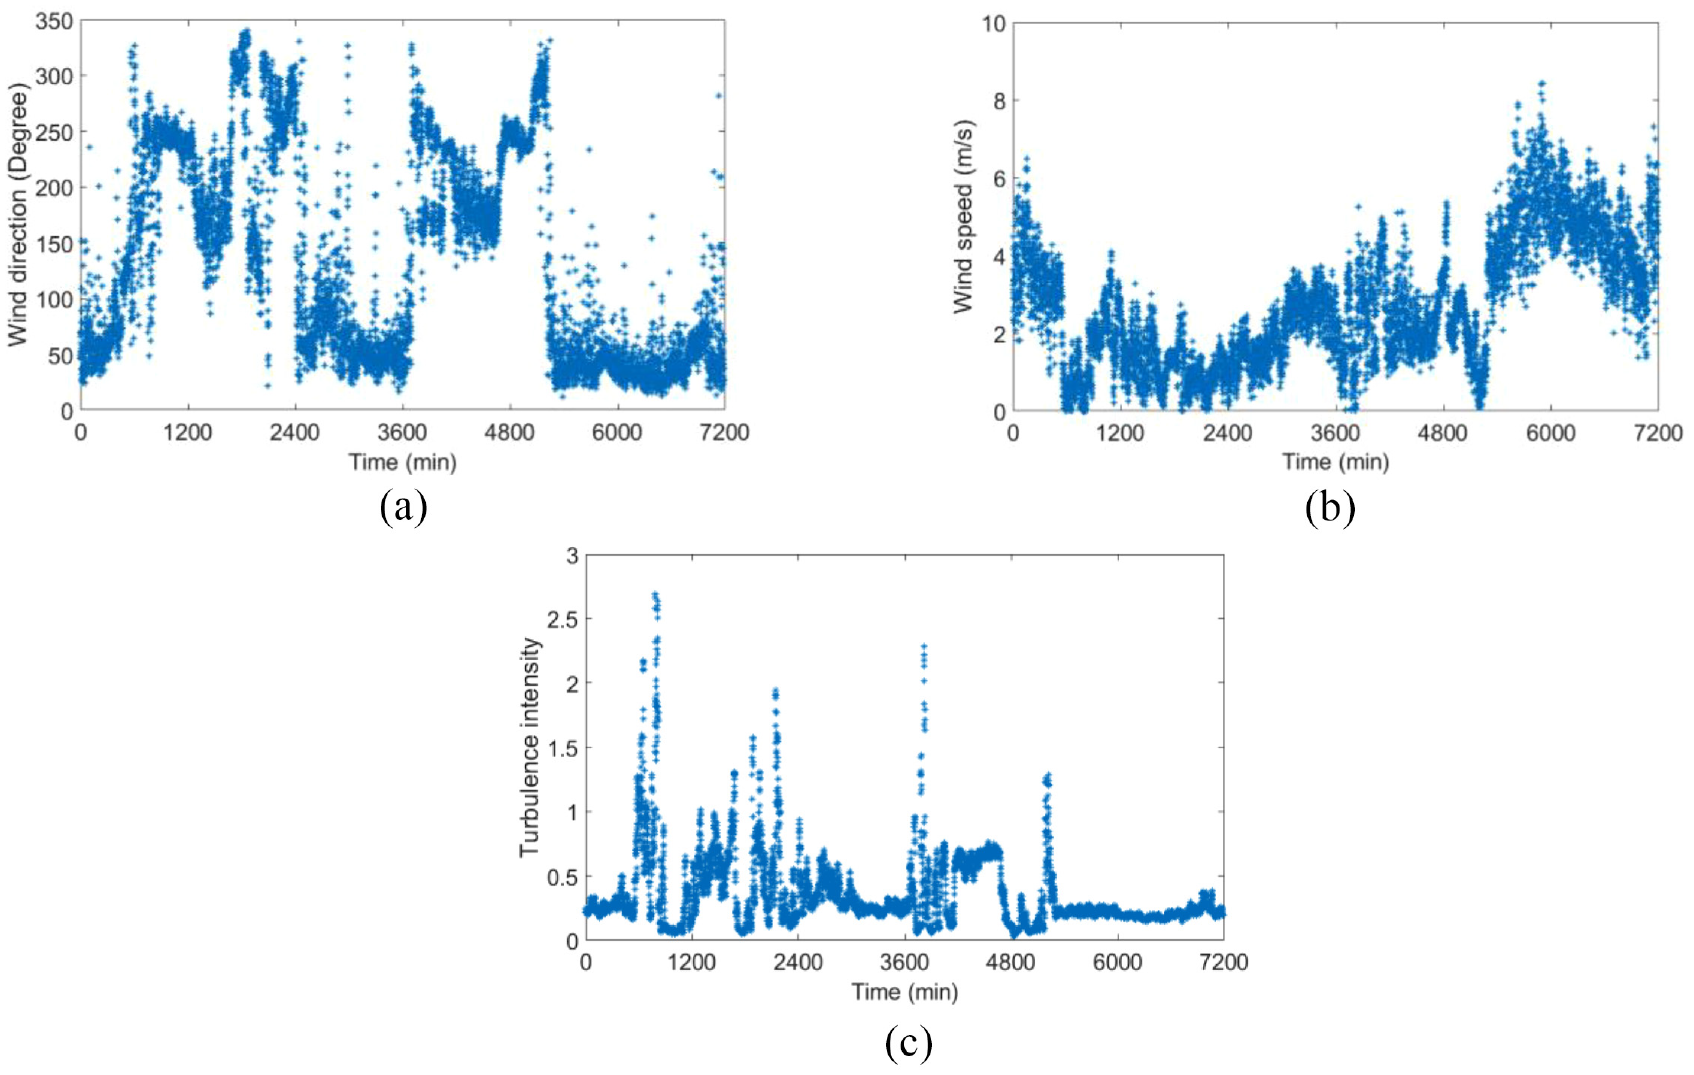
Measured wind data. (a) Wind direction. (b) Wind speed. (c) Turbulence intensity.
The turbulence intensity represents the fluctuating properties of wind, which has a crucial influence on the wind-induced behavior of long-span bridges. 15 It is defined as the ratio between the standard deviation of fluctuating wind and the mean wind speed. A 1-min period is adopted to calculate the turbulence intensity, which is then processed with 10-min moving average.
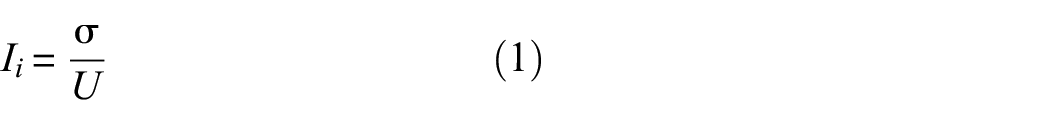
where
Girder displacement
Girder displacements are collected on upstream and downstream sides at the mid-span in vertical, lateral, and longitudinal directions, and they are preprocessed as shown in Figure 5(a), (b), and (c), respectively. It is demonstrated that the displacements on upstream and downstream sides generally resemble each other in amplitude. The amplitude in the vertical direction is the largest, followed by the longitudinal direction, while the lateral displacement is the smallest in all three directions.
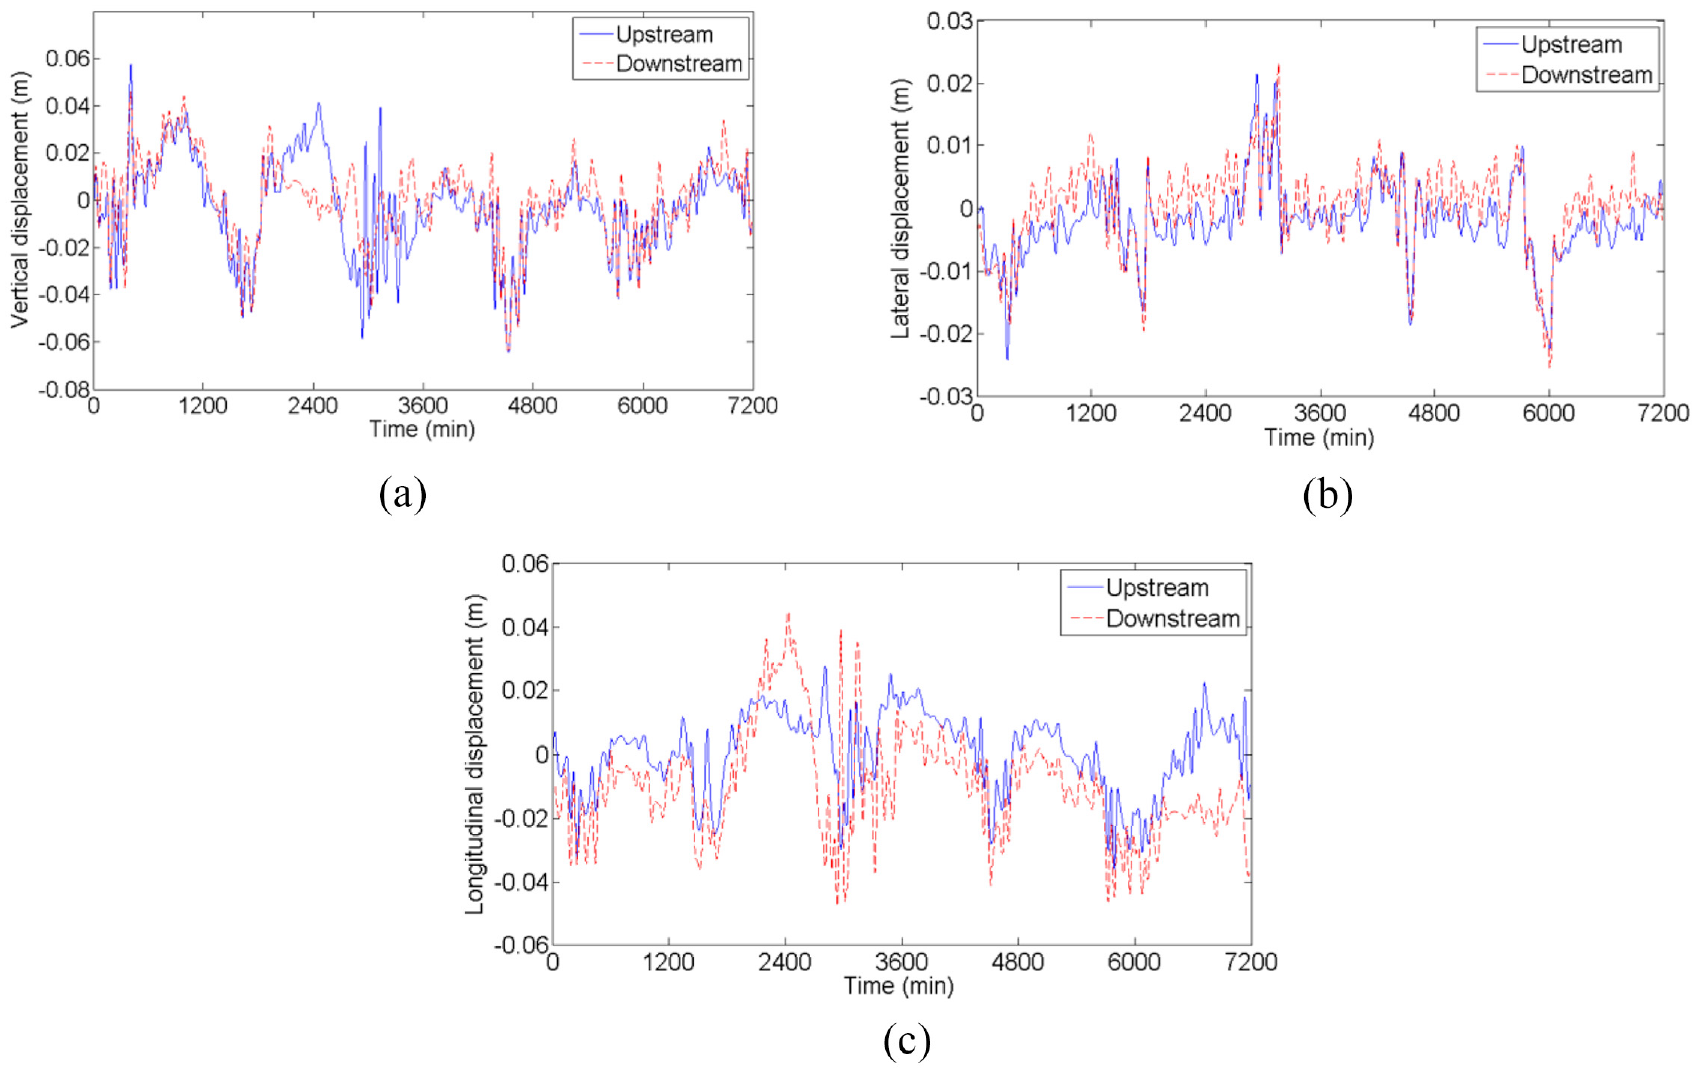
Measured girder mid-span displacement data. (a) Vertical displacement. (b) Lateral displacement. (c) Longitudinal displacement.
Pylon displacement
Pylon displacement data includes the longitudinal and transverse directions on top of north and south pylons, and they are shown in Figure 6(a) and (b) after preprocessing. In the longitudinal direction, the north-ward displacement is defined as positive. It is noticed that after around the second hour, the north pylon top moves south and the south pylon top move north. At around the 20th h, the moving trend is reversed. Comparing with temperature variation in Figure 3, a decrease of temperature causes the pylon tops to move toward each other and vice versa. Such a phenomenon has also been reported in another cable-stayed bridge. 55 The similarity in the lateral displacement can also be observed in north and south pylons, indicating that the monitoring data have correctly captured the behavior of the pylons.
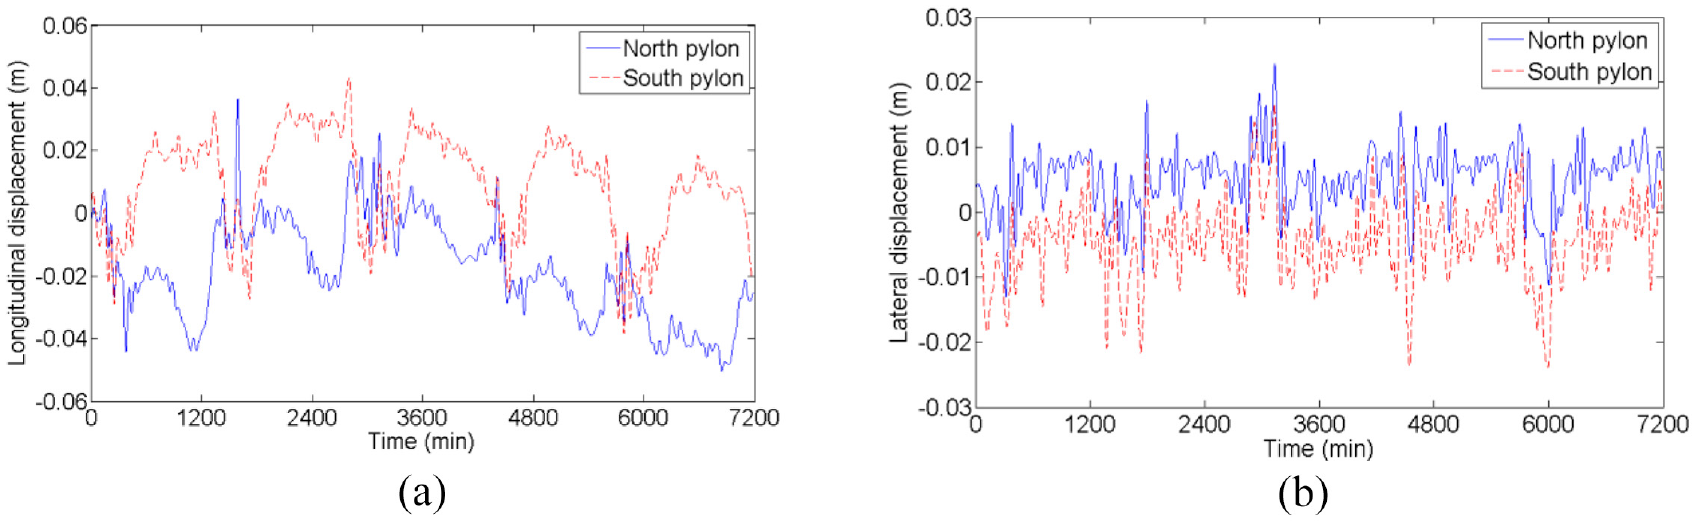
Measured pylon displacement data. (a) Longitudinal displacement. (b) Lateral displacement.
Proposed approach with one-dimensional residual convolutional AE
The proposed approach
The bridge is a complex structural system that receives the environmental and traffic loads and outputs the dynamic responses. The uncertainties and complexities within the system make it difficult to predict the responses with physics-based methods. The SHM system on the bridge records a large amount of in situ data, which contains potential correlations among loads and responses. This study uses a ResAE to construct the correlations and predict the displacement response from measured loads. An overall schematic view of the proposed approach is illustrated in Figure 7. The solid arrow lines represent the essential training steps for the ResAE model, and the dashed arrow lines represent the testing and predicting step with the untrained measured load dataset.

Framework of displacement response prediction with residual autoencoder model.
Before training the ResAE model, the acquired data should be preprocessed with the denoising and normalizing method to eliminate the effects of random noise and value range. Noises contained in the measured load data and response data are required to be removed with time-domain or frequency-domain noise reduction methods. It is difficult and unnecessary to predict the response with noise-contaminated load data or to predict the noise in the measured response. After that, the purified data is normalized with the Z-score strategy 56 to transfer the different ranges of fluctuation values to a similar scale. The Z-score normalization function is shown in Equation (2). The total dataset is randomly split into training, validation, and test dataset to train the model and determine the prediction model with the best performance. The final selected model can use load data from an untrained test dataset to predict accurate structural responses.
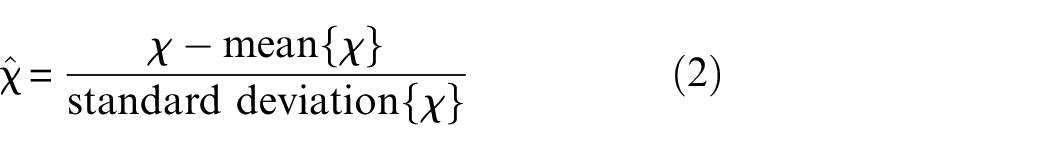
where
ResAE belongs to a surrogate model that can reconstruct or predict the structural responses of the measured bridge under the implemented loads. The overall ResAE method is shown in Figure 8, which sequentially contains a convolutional layer, two residual encoding blocks, two residual decoding blocks, and a transposed convolutional layer. All the layers designed in this architecture are one dimensional. Critical
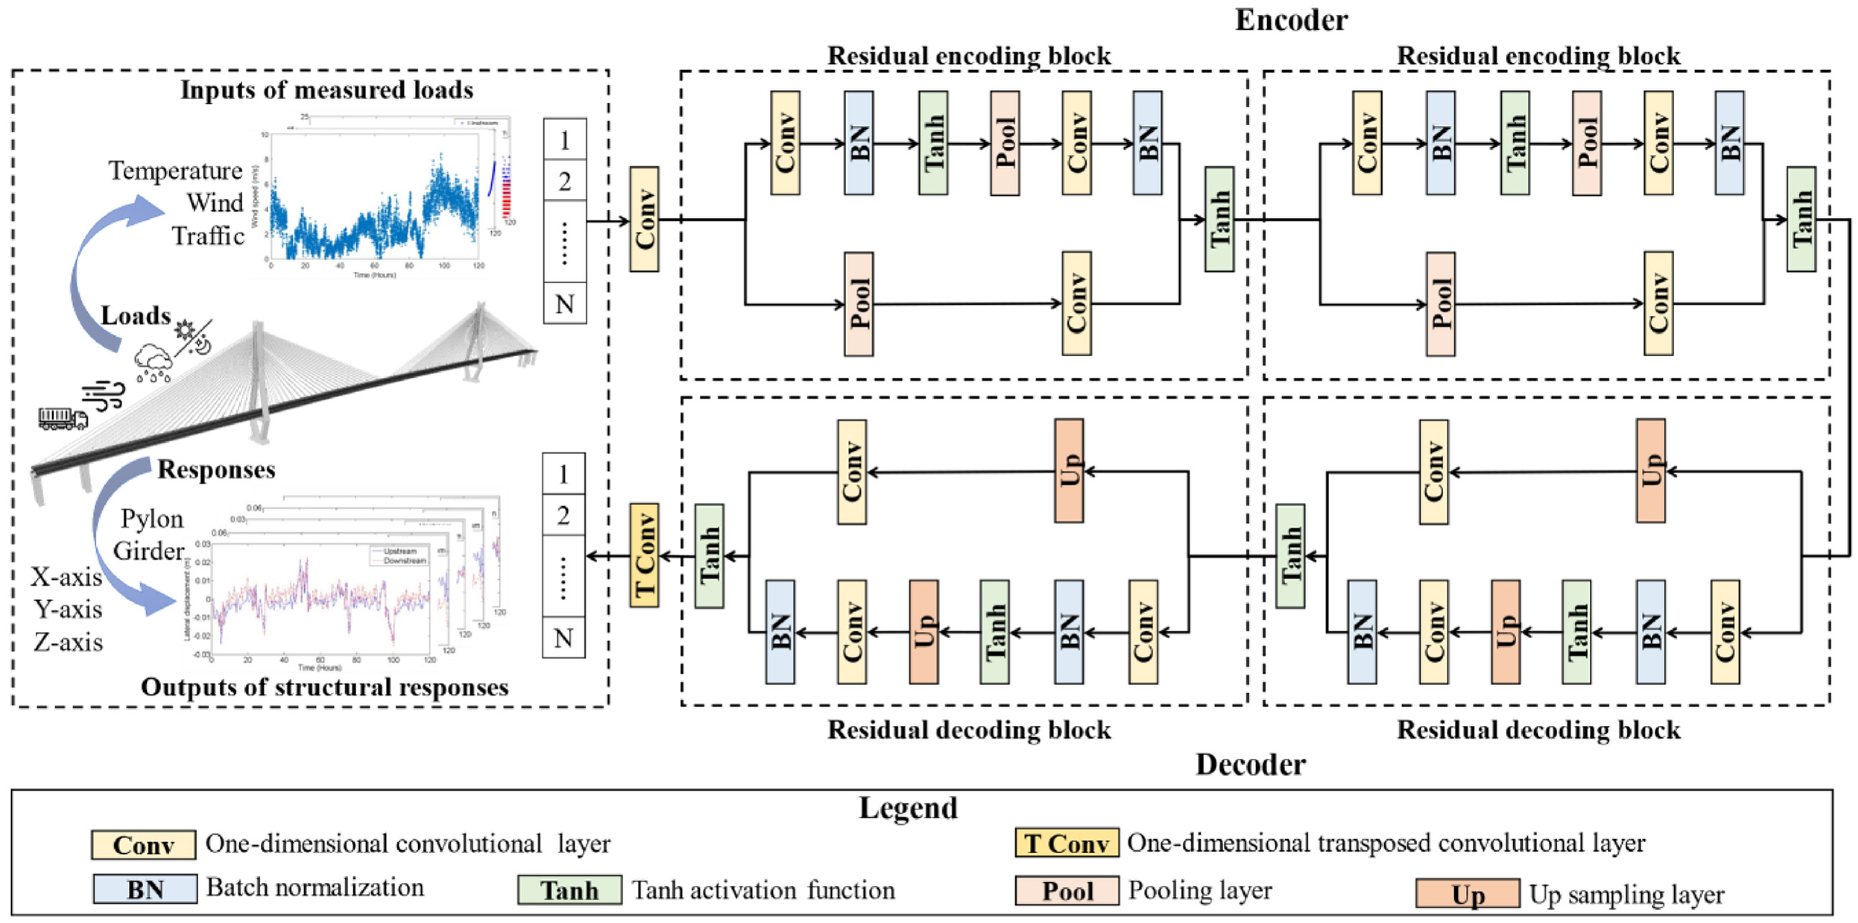
The one-dimensional residual convolutional autoencoder method.
AE contains an encoder–decoder structure
57
to reconstruct the data in an unsupervised manner. The encoder section is a contracting path, while the decoder section is a symmetric expanding path. The encoder receives the input measured loads and extracts latent features among the multisource data. It acts as a function


where
The best behavior of AE achieves the adaptions on
The residual encoding and decoding blocks are important parts of the designed architecture. One of the main reasons for using residual learning is to train a very deep CNN. 58 This is because when the network aims to add many layers, the accuracy and network performance will tend to be saturated due to the problem of gradient vanishing. During the backpropagation, the gradient of the loss function concerning the weights of each layer is determined and flowed back through the neural network. Due to repeated convolution with small weights, the gradient tends to be ineffectively small in the earlier layers. Under such circumstances, the network performance inevitably degrades.
The residual connection in this architecture is not the same as the original. The original residual connection accepts an input
In the residual encoding block and decoding residual block, the convolutional kernels in convolutional layers play the role of feature extractions with different scales. Thus, it can catch hidden features in different spatial dimensions. A batch normalizing layer and an activation layer follow each convolutional layer. The batch normalization is an adaptive reparameterization approach to overcome the problem of gradients vanishing and exploding caused by mini-batch training.
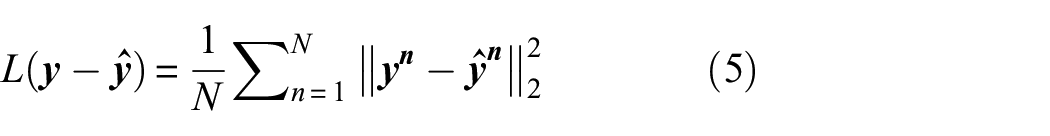
Model performance metrics
Statistical key performance indicators can be used to determine the model performance. The prediction errors are presented in the forms of the coefficient of determination (
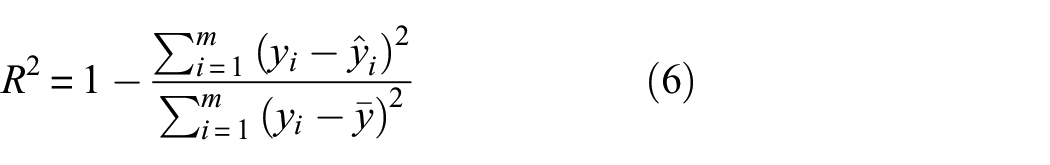
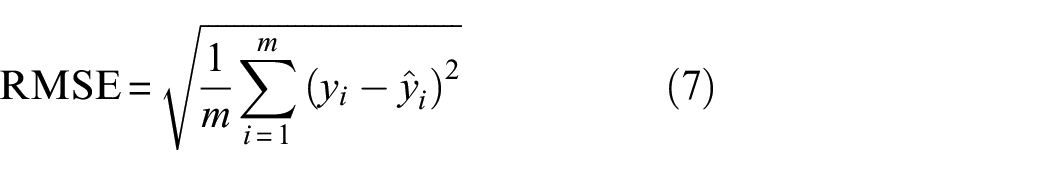
where
Prediction implementation and discussion
Model training and prediction
To implement the prediction of the displacements, it is essential to characterize the traffic, temperature, and wind loads with well-selected input variables. A total of 10 loads and 10 displacement responses were selected as the input and output variables, respectively. And they are verified to have captured the characterization of the loads. The detailed input and output variables, including the abbreviations, are shown in Figure 9.
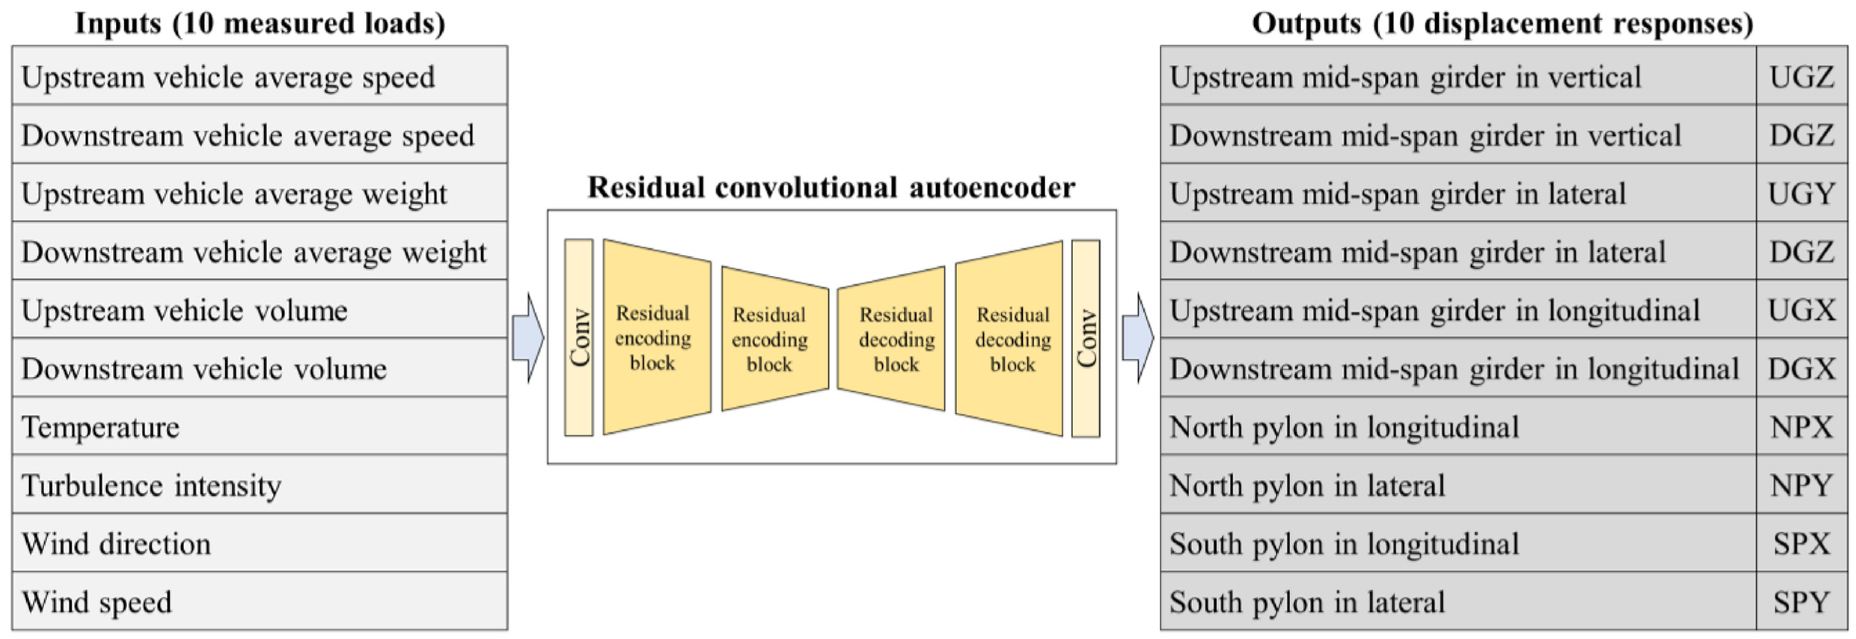
Application with 10 inputs and 10 outputs.
The ResAE model is built and trained in Python 3.7 and associated libraries (Sklearn, Pytorch, etc.). It is designed to predict 10 displacement responses simultaneously. The optimal training parameters are determined with parametric studies. The one-dimensional input and output of the ResAE model are set to 10 × 1, and the convolution kernel size, stride size, and padding size of all the convolutional layers are set to 3, 1, and 1, respectively. The scale factor of the pooling layers and up-sampling layers is set to 2. The training epoch, batch size, and initial learning rate are 1000, 32, and 0.01, respectively. An epoch means training the surrogate model with all the training dataset for one cycle, and an epoch is made up of one or more batches. The learning rate is changed to 1/10 of the previous value when the epoch reaches 1/2 and 3/4 of the total epoch number to keep the network stable.
As mentioned above, the dataset is randomly split into three datasets to train the ResAE model. The training, validation, and test datasets are set as 60%, 20%, and 20% of the total dataset, respectively. The ResAE model is trained with the training dataset to reduce prediction error. The validation dataset is used to determine the best weights, while the test dataset is used to determine the model efficiency. The ideal trained models should predict the structural responses accurately and have good generalization performance.
Figure 10(a) presents the training and validation loss value concerning the training epoch. It can be seen that the loss values in both the training and validation datasets are rapidly reduced at the beginning of the training and stabled at a lower value at the end of the training. Although the final validation loss is slightly higher than the training loss, the selected model also holds a good prediction performance. During the model training process, the model that produces the lowest validation loss is determined as the most optimal surrogate model. Figure 10(b) presents the coefficient of determination (
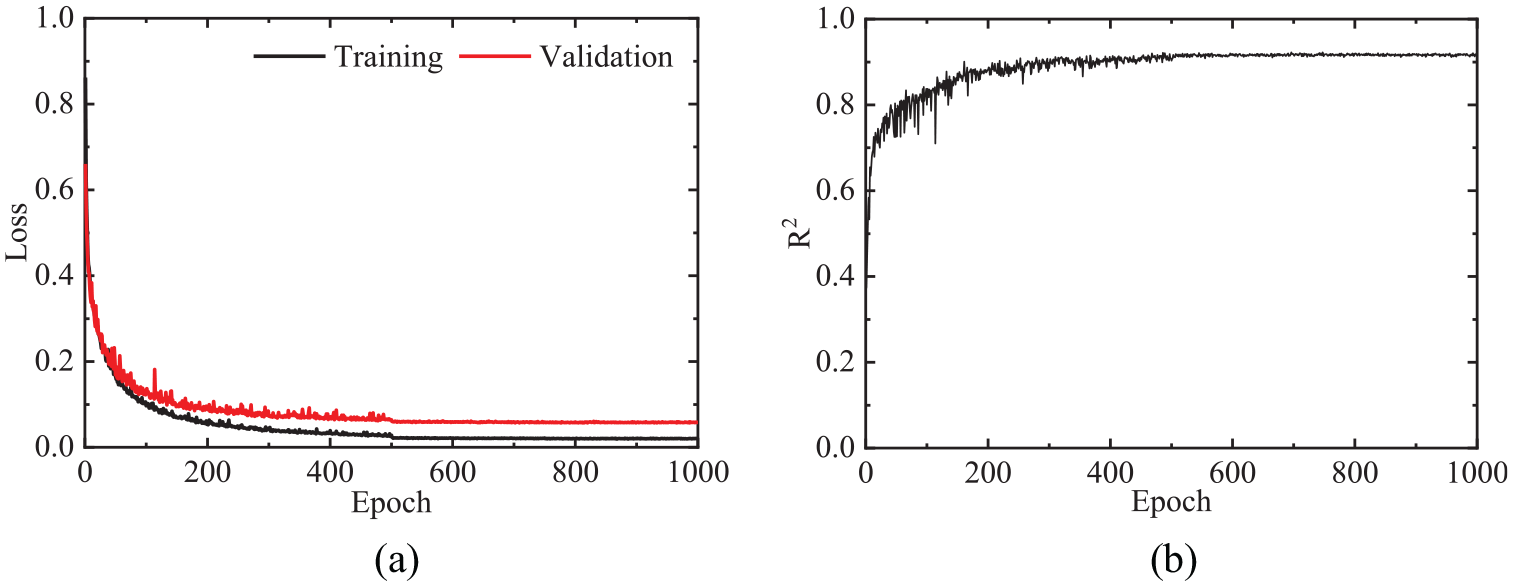
Loss and accuracy in each training epoch. (a) Loss. (b) Accuracy.
The predicted values and ground truth for all 10 displacement responses are compared visually in the time domain in Figure 11. Ten displacement responses are predicted using one ResAE model. Each sub-figure shows the response comparison in training, validation, and test dataset with the final ResAE model. Good agreement between real signals and predicted signals is observed. The trend and amplitude in the time domain are well reconstructed, which indicate the effectiveness of the proposed response prediction method. Although the six displacement sensors recorded diverse structural responses at the upstream and downstream sides from three directions, the trained ResAE model captured their fluctuations well. Similar results also could be found in the responses of two pylons. The surrogate data-driven model accurately outputs bridge displacement responses after receiving the measured critical load values.
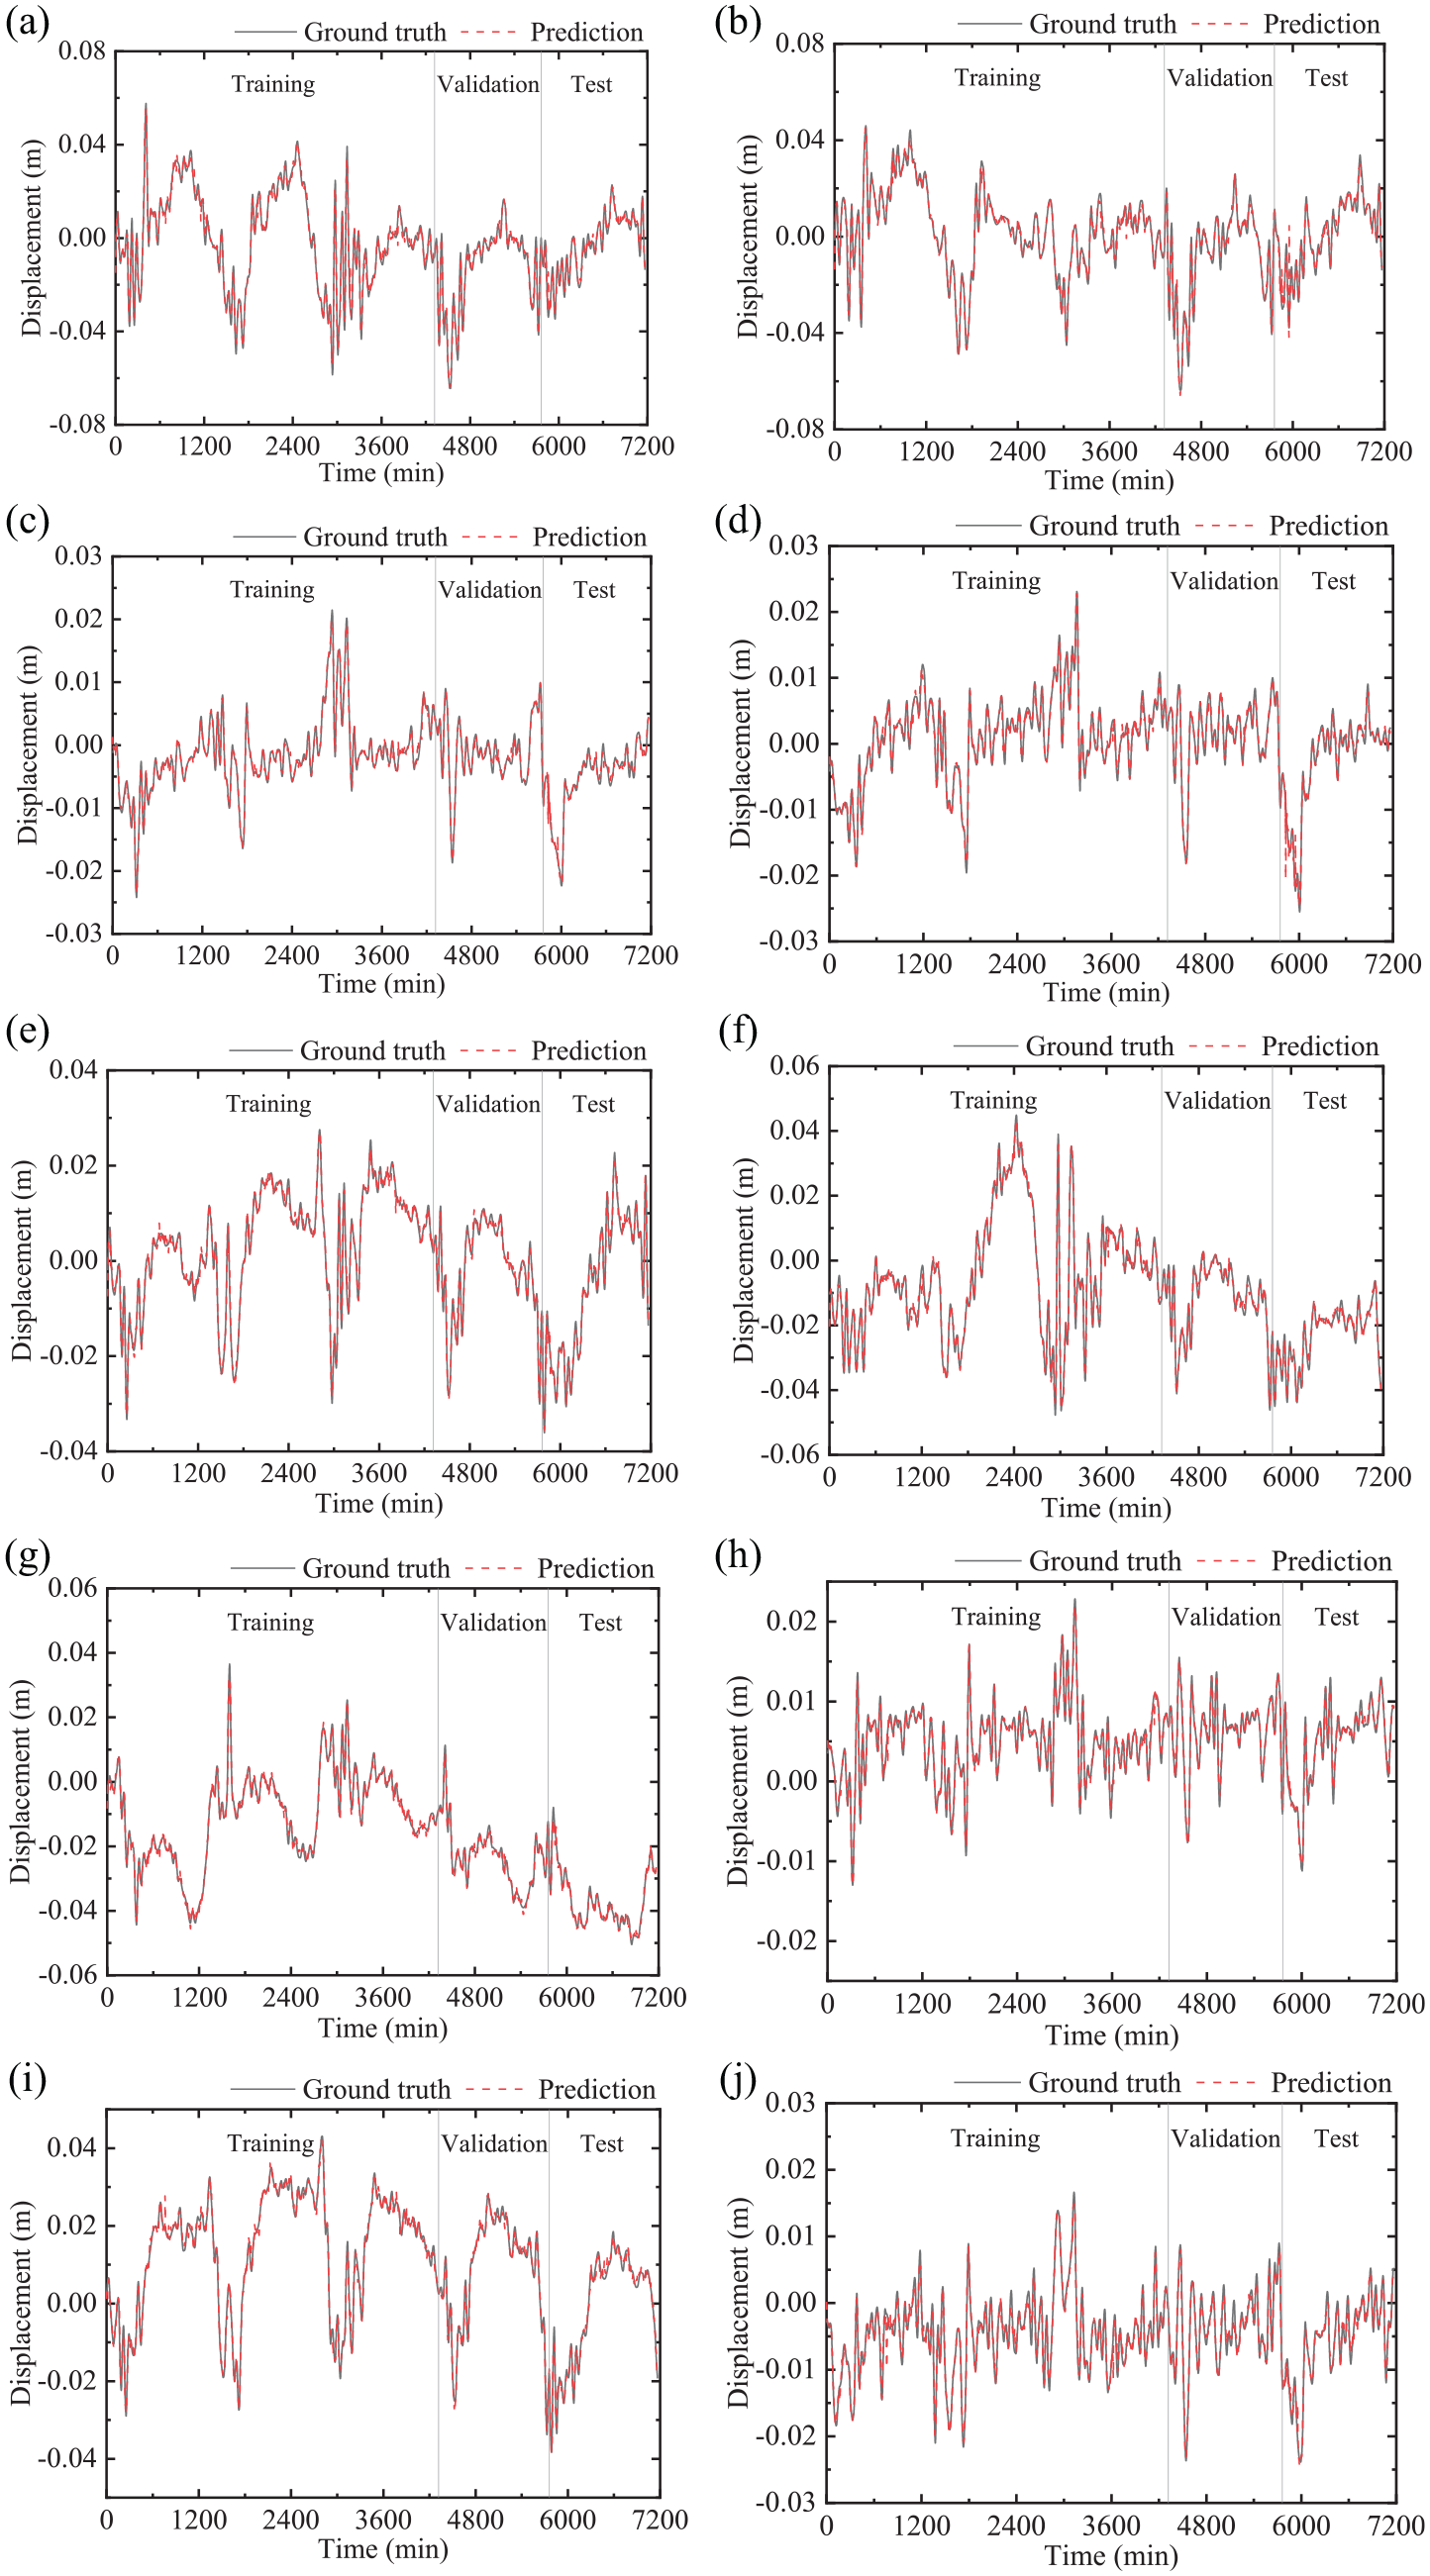
Comparison of predicted and measured values for each type of displacement. (a) UGZ. (b) DGZ. (c) UGY. (d) DGY. (e) UGX. (f) DGX. (g) NPX. (h) NPY. (i) SPX. (j) SPY.
Figure 12 depicts 10 displacement response prediction performances with the aforementioned indicators. All these 10 responses have a high
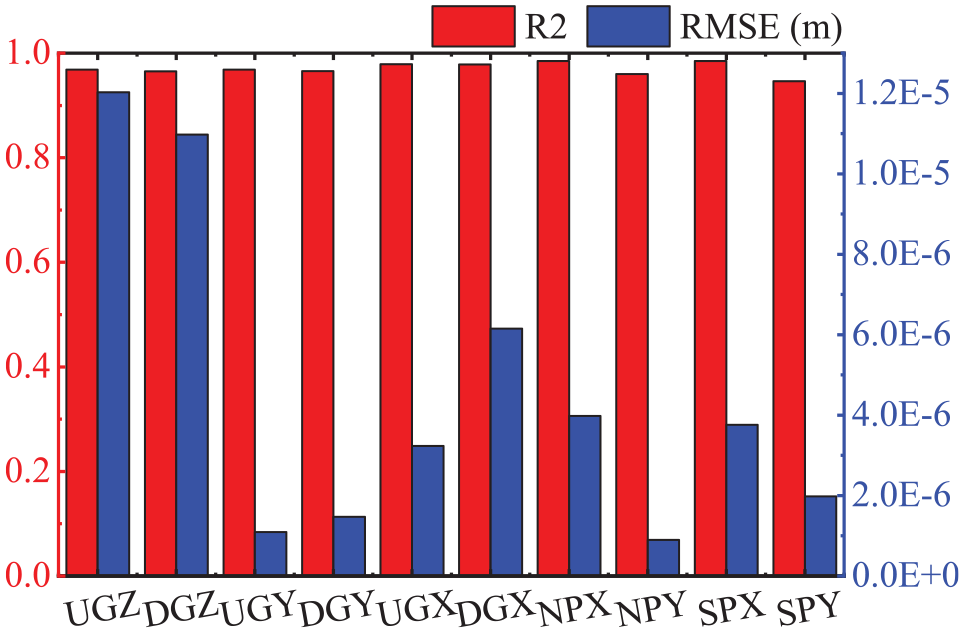
Performance indicators for each displacement responses.
For the traffic and wind loads, this study investigates the impact of different types of input on the model training and prediction performance. Three representative parameters of the traffic loads are vehicle volume, vehicle average speed, and vehicle average weight. They can be calculated on upstream and downstream sides or further decomposed on each traffic lane. When using the decomposed traffic data on each lane instead of the above upstream and downstream traffic data, the overall
Discussion
Effects of different types of loads
In this section, the contribution of the three different types of loads to the displacement response is investigated. During the service stage, traffic loads, temperature loads, and wind loads contribute differently to the overall response of the structure.
Each type of load will be excluded separately in the input variables to investigate their influences. Therefore, the first six traffic-related load information, the seventh temperature-related information, and the last three wind load-related information as shown in Figure 9 will be excluded in turn when training the ResAE model. They are denoted as NoTrafficLoad, NoTempLoad, NoWindLoad, respectively, in Figure 13. Suppose the accuracy of structural response prediction significantly decreases when the information of a load is excluded. In that case, it indicates that this type of load greatly influences the displacement response.
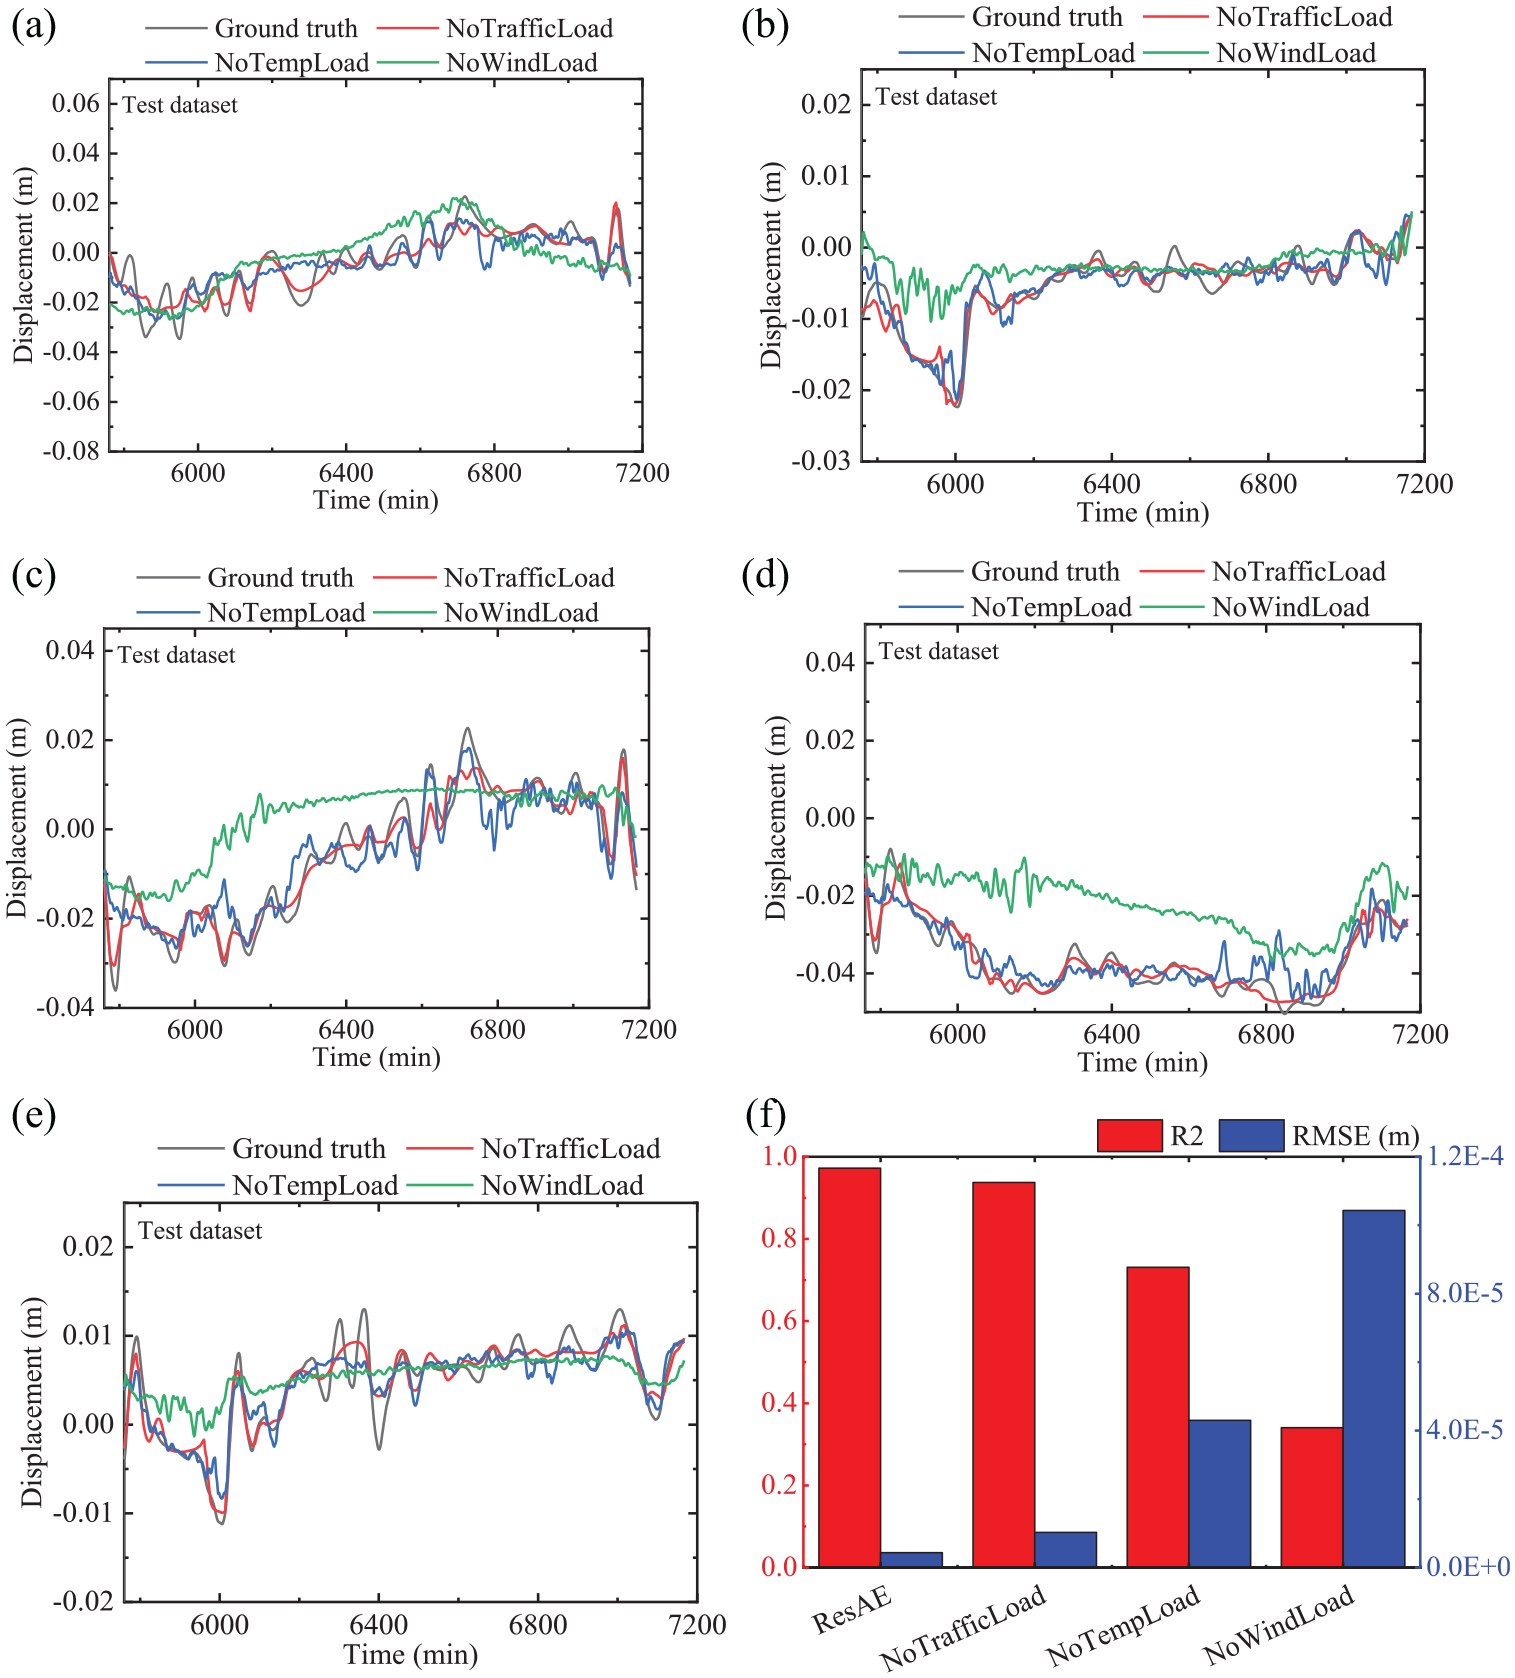
Effect of each type of load on predicting the structural displacement. (a) UGZ. (b) UGY. (c) UGX. (d) NPX. (e) NPY. (f) Integrated performance indicators.
Figure 13(a) and (e) compares the ground truth and three trained models excluding each type of load in the input variables. Five representative responses are selected, including the displacements of the main girder in three directions and the displacements of the north pylon in two horizontal directions. It can be seen that when wind data are missing, the general trend of the predicted response in the vertical and lateral displacements of the main girder and the lateral displacements of the pylons are in general consistent with the contour of ground truth, but the detailed vibration information is lost. The trends and vibration details differed significantly in the bridge longitudinal displacements of both the main girder and the pylons. The effect of wind speed on the response of the cable-stayed bridge is proved to be significant. The details of the response predictions slightly deviate when traffic load or temperature load data are missing. It is the fact that the daily traffic volume is relatively low in the cable-stayed bridge. In Figure 13(f), the integrated performance indicators, that is,
Comparison with other deep learning methods
Deep learning outperforms machine learning in terms of feature extraction and output prediction. Except for the convolutional models, the recurrent models are also good at regressing and forecasting the time series data. LSTM networks are special kinds of recurrent neural networks that are capable of learning both short-term and long-term dependencies. There are three gates designed in LSTM cell to memorize the short-term and long-term features of the input time series sequence. Gates contain sigmoid activations. The first forget gate decides what information should be thrown away or kept. The second input gate decides the extent of values that should be updated. The third output gate take the output from the input gate and do a pointwise addition which updates the cell state to new values that the neural network finds relevant. For the brevity of the article, more details on LSTM network can be found in literature.59,60
Thus, this section compares the prediction performance of ResAE with one-layer LSTM (LSTM-1) and two-layer LSTM (LSTM-2). The sequence length is set to 5, and the input and output sizes are set to 10 in both LSTM models. It means using 10 types of load data from the previous five moments to predict 10 structural responses under the current moment. In the LSTM block, this study designs 20 hidden neurons to memorize the time-series features. The dropout rate is set as 0.2. A dropout on the input means that for a given probability, the data on the input connection to each LSTM block will be excluded from node activation and weight updates. In addition, the LSTM-1 model and LSTM-2 model are trained with the above same dataset. Other training parameters are set as the same as the ResAE model.
Figure 14 shows the comparison of the ground truth and the predictions of three deep learning in the test dataset. The vertical displacement responses of the main girder and lateral displacement responses of the north pylon are selected as the representatives. The black solid lines (ground truth) are covered by the red dashed lines (ResAE model), and this overlapping issue can be identified from the scaled subfigures in Figure 14. This also proves that the ResAE model has a better prediction performance. By contrast, the prediction performance results of the two LSTM models differed significantly from the ground truth. The general trend of the response can be roughly presented, but the detailed features and the overall deviation are large. LSTM model exhibits high performance in establishing the input–output relationship between temperature and temperature-induced displacement 60 . But it does not work well when employing multiple loads to forecast multiple responses. Table 1 lists the performance of the three models. It can be seen that the prediction performance of the ResAE model is better than that of the two LSTM models, and it also holds computational efficiency.
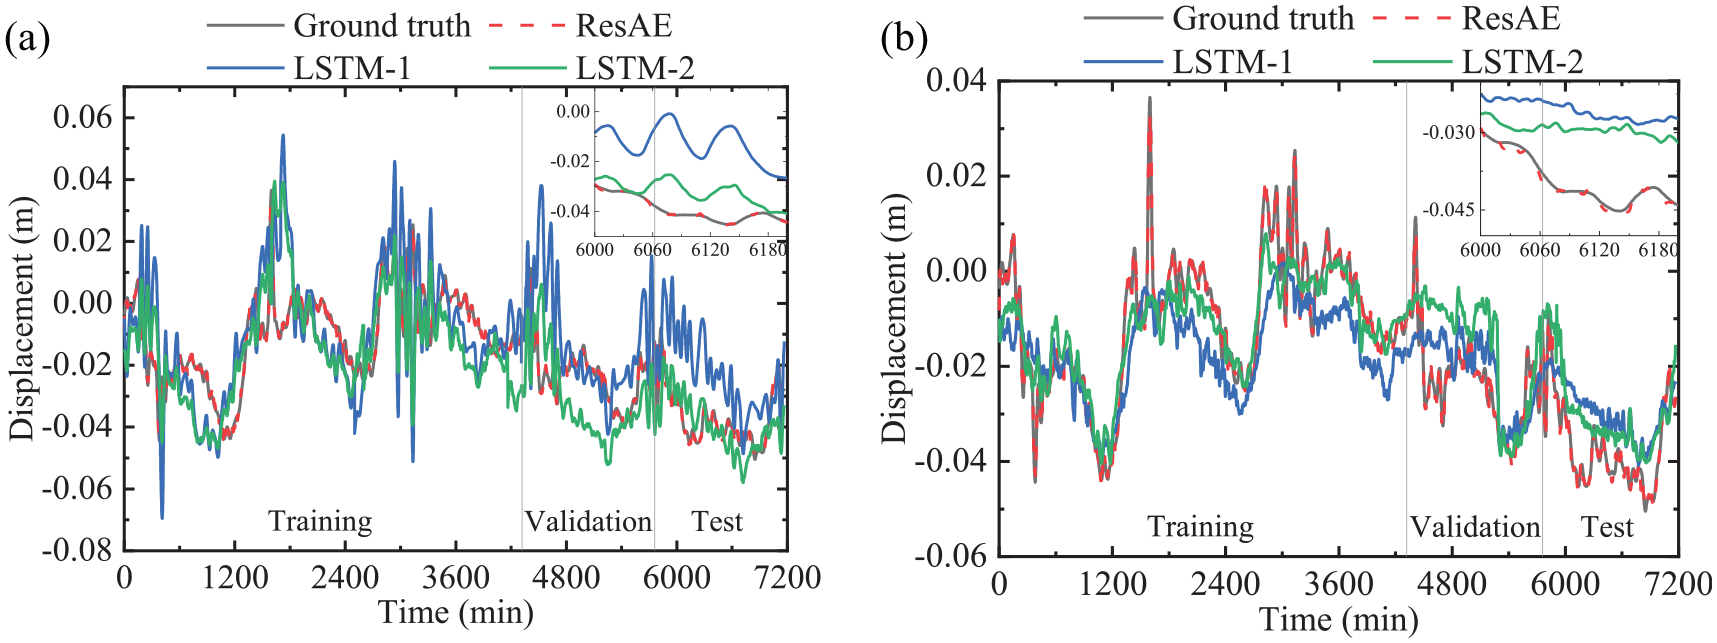
Comparison of different deep learning models in the test dataset. (a) UGZ. (b) NPX.
Prediction performance of different deep learning models.
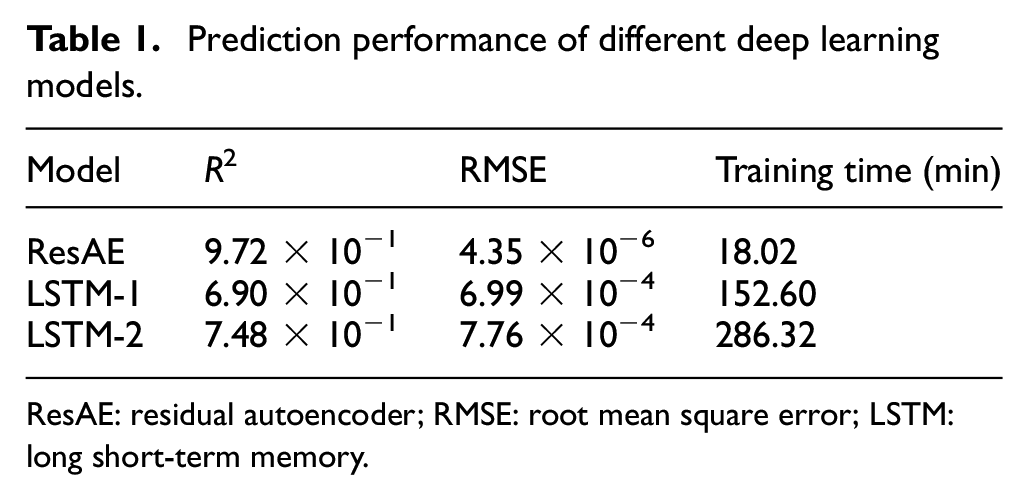
ResAE: residual autoencoder; RMSE: root mean square error; LSTM: long short-term memory.
Multistep ahead prediction
In the above study, we have addressed predicting the structural displacements using load data in the same period. A more important task is to make predictions on future structural responses based on current load data. To comprehensively evaluate the predicting performance of the ResAE model, both one-step ahead and multistep ahead predictions are explored. Note that one-step ahead means 1-min ahead in this study. It is also designed to simultaneously predict the future response of 10 types of structural displacements. The training parameters of each surrogate model are the same as the above ResAE model. The prediction models with one-step ahead, three-step ahead, and five-step ahead are represented by the surrogate models ResAE-1, ResAE-3, and ResAE-5, respectively. They are trained separately with the same dataset and training parameters as the ResAE model.
Figure 15 compares the prediction performance for the models in the test dataset at different prediction steps. The multistep ahead surrogate models provide highly comparable and reasonable patterns, whether in the main girder or pylon displacement responses. It can also be seen that there exists the lag effect in the multistep ahead prediction. As the time ahead rises, the lag effect becomes more noticeable, and the accuracy drops for both the main girders and the bridge pylons. Figure 16 shows a comparison of the
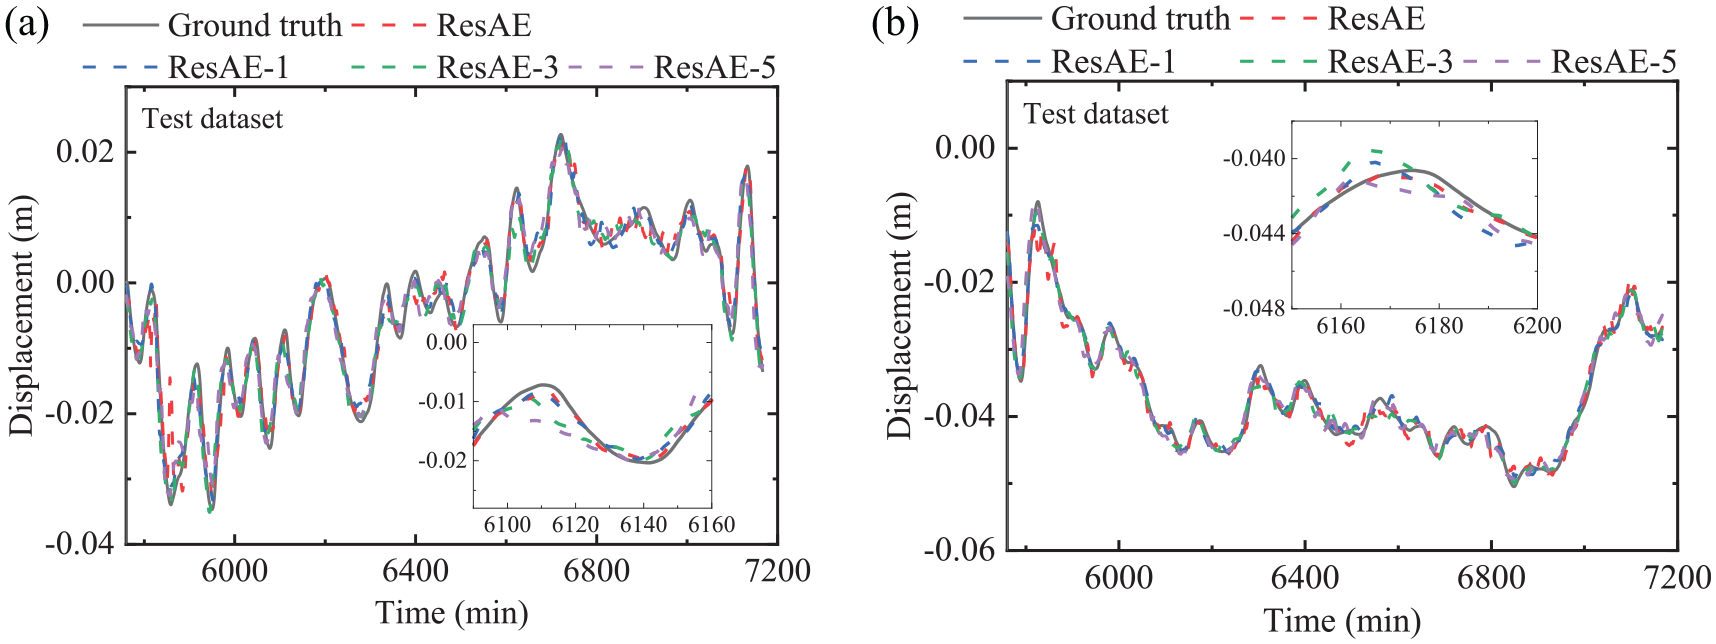
Comparison of predicted and measured values with different step ahead prediction models. (a) UGZ. (b) NPX.
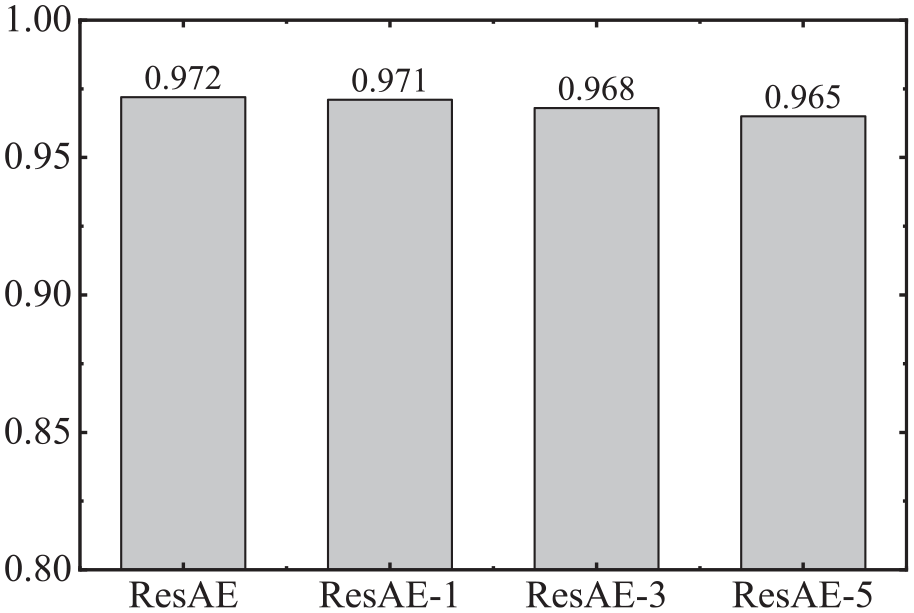
Coefficient of determination (
Conclusions
This study investigates an approach for predicting bridge displacement response under temperature, wind, and vehicle loads using a one-dimensional residual convolutional AE (ResAE). Multiple convolutional residual encoding and decoding blocks are used in the ResAE to adapt to various load and response characteristics. The effectiveness and efficiency of the proposed approach were demonstrated with a cable-stayed bridge. The relevance of load significance, model performance, and multihead prediction are discussed. The conclusions drawn from this study are summarized as follows.
(1) The proposed approach can accurately and efficiently predict a variety of displacement responses with multiple critical loads as inputs at the same time. The designed residual blocks solve the issue of gradient vanishing and assist in feature extraction and dimension matching tasks. An accuracy higher than 95% is achieved in the case study.
(2) Wind loads have the most substantial influence on structural displacement responses of cable-stayed bridges compared to traffic and temperature loads. The overall trend of the predicted response is generally compatible with the contour of ground truth when wind data is excluded, but particular vibration information is lost. When it comes to traffic or temperature loads, their exclusions only create minor differences from the expected response.
(3) The ResAE model outperformed the LSTM model in the task of the prediction of the displacement response in terms of both computational accuracy and efficiency. The general trend of the predicted response of the LSTM model can be roughly presented, but the details are missing, and the overall deviation is large.
(4) The proposed approach can complete highly accurate multistep ahead prediction on the displacement responses. As the prediction step increases, the difference between the real and predicted responses gradually increases. The prediction of structural displacement could benefit the bridge operator for online early warning of potential malfunction.
Footnotes
Acknowledgements
The kind support from the inspection company of the case-study bridge is acknowledged. The conclusions and opinions in this article are of the authors, which do not necessarily reflect that of the bridge operator or the inspection company.
Declaration of conflicting interests
The author(s) declared no potential conflicts of interest with respect to the research, authorship, and/or publication of this article.
Funding
The author(s) disclosed receipt of the following financial support for the research, authorship, and/or publication of this article: The authors would like to acknowledge financial supports from the FCT Project SAFESUSPENSE (reference POCI-01-0145-FEDER-031054). The second author acknowledges the support from JSPS grant-in-Aid Kakenhi C no. 18K04320 and Taisei Foundation for application of Machine Learning in this research.