
Abstract
The functional performance of concrete structures degrades over time as a result of continuous loads, stress fatigue, and external environmental changes. Thus, periodic diagnoses and inspections are essential because such conditions can eventually lead to disaster. Hence, the detection of cracks in concrete is a key component of structural management. In recent years, deep-learning-based computer vision technologies have emerged as a promising trend and have been actively used for crack detection. Unfortunately, the performance of existing crack detection technologies decreases under environmental conditions that vary widely. To resolve this issue, we propose a new deep neural network that applies an optimal mixing ratio of training data to improve recognition performance alongside an adversarial learning-based balanced ensemble discriminator network. Furthermore, a method to reconstruct the 3-dimensional shape of cracks is proposed using a stereo-vision-based triangulation measurement technique that determines the size of detected cracks. Experimental results show that the proposed algorithm achieved a crack detection performance with a mean intersection-over-union of 84.53% and an F1 score of 82.91%. The proposed inspection technology for concrete structures is expected to be implemented in the future in connection with various automation techniques.
Introduction
As concrete structures age, cracks naturally occur. The main factors include periodic loads, external force fatigue, and prolonged exposure to extreme environments. These conditions lead to structural deterioration, which reduces life expectancy. If such conditions persist, accidents and/or disasters may occur. Hence, it is desirable to prevent these degradations (McCrea et al., 2002). 1 Depending on the location and shape of the structural deficiencies, the potential risk can be evaluated differently based upon the technology applied. Therefore, accurate and timely diagnoses and evaluations of structural integrity can ensure safety. Recently, technologies designed to inspect, detect, and repair defects 2 have been rapidly advancing in scope owing to the increasingly wide variety of shapes and sizes of concrete structures constructed.
To address these issues, automated vision-based inspection technologies have been proffered.3–6 These studies aim to detect structural damage while emphasizing the use of imagery for crack detection. In contrast to the classical method of having an operator use a crack ruler and a microscope to directly evaluate and diagnose structural damage, vision-based inspection technologies have the advantage of improving the objectivity of measurement data. However, their biggest disadvantage is that their performance degrades depending on the unexpected types of cracks and shooting conditions encountered on-site. Nevertheless, the measurement and inspection capability of civil engineering methods have been improved by the application of deep-learning computer vision methods. 7
Despite such rapid advancements, considerable room for improvement of crack detection technologies remains. For example, recognition performance decreases when trained deep neural network models are applied to new sites. Generally, greater numbers of training data can improve the performance of deep-learning algorithm. This also applies to crack detection algorithms. In particular, training data that include various types of crack images have a better effect on crack detection performance than those including images consisting of similar shapes. To secure a wide variety of images, it is necessary to collect data at the actual site. For example, cracks in an outer wall of a building differ greatly from cracks in the lining of a tunnel, even with similar concrete fabrication. Additionally, cracks occurring in the same building may differ in shape depending on wall-paint deterioration. This includes cracks that vary according to differing environmental conditions. In practice, it is impossible to collect all of these various crack image data. Thus, when a deep-learning model trained with crack images is applied to new and different environments, recognition performance is significantly reduced. 8 To prevent this, new photos should be taken any time a crack occurs in a new environment, and corresponding labeled images should be secured. Furthermore, the deep neural network model must be newly trained with this data. However, this process requires a great deal of time and is expensive, which is a major limitation to the expanded application of deep-learning algorithms. Therefore, we propose a semi-supervised learning technique that minimizes the decrease in recognition performance with improved neural network structure when applied to a new environment.
There is also a need for a method to measure and analyze the physical sizes of cracks. Image processing technologies that use deep-learning are very effective in detecting pixel level crack areas. However, to actually diagnose structural conditions, physical information about the length and width of cracks is required in millimeters rather than pixels. For this purpose, it is necessary to input scale information into the detected crack area. For this purpose, a technique for reconstructing a 3-dimensional (3D) crack shape and expressing it in the form of a point cloud at a realistic scale is proposed.
This study intends to solve two problems. First, recognition performance deteriorates when the crack detection deep-learning algorithm is applied to a new environment. Second, information on the physical size of cracks is required for accurate diagnosis of the structure. The proposed approaches to accomplish this include a method for improving the structure of a deep neural network, a method for using semi-supervised learning and a method for 3D reconstruction at the actual scale of the crack. Therefore, this study has three key contributions. First, the deep neural network structure was efficiently improved to accurately detect cracks generated in a new environment, and the amount of computation of the deep neural network for crack detection was reduced, improving the detection performance for new crack images. Furthermore, the ensemble structure was applied to semi-supervised learning to improve the detection performance by adding crack images without label images. Second, when various types of crack images are used for semi-supervised learning, a method for configuring training data is proposed. Therefore, an optimal mixing ratio between the existing and new crack image data was suggested to improve the recognition performance. Third, a method for reconstructing the 3D crack shape was developed. We measured the size of the cracks to reconstruct their 3D shapes. By combining a stereo-vision-based triangulation measurement technique with a deep-learning algorithm for crack detection, the shapes of the cracks were restored to the actual scale.
The remainder of this study is organized as follows. In Section 2 of this paper, research on related technologies is described. In Section 3, a data configuration for developing crack detection and shape restoration technologies is described. Section 4 describes a new deep neural network that leverages an adversarial learning technique for crack detection. Section 5 presents a stereo vision technology that restores the shape of a crack. Finally, experimental results are presented and discussed in Sections 5 and 6. A conclusion is presented in Section 7.
Literature review
Image sensor-based detection
Imaging technologies used to detect cracks rely on three main steps: data acquisition, image processing, and measurement. The most common method of data acquisition uses a high-resolution camera. Lins and Givigi (2016) 9 proposed a method of detecting and measuring cracks using a single camera. They introduced an algorithm that took a series of images as input, classified the crack shape, and measured its length and width. After applying this algorithm to a high-resolution image, they showed that the measurement error was reduced to 5.27% with an uncertainty of ±1.97%. Jahanshahi and Masri (2012) 10 applied a 3D shape restoration technique that could detect cracks in concrete structures. They applied a segmentation technique to extract the area of the crack and further measured its thickness. Consequently, a technique that could detect cracks in an entire bridge structure by measuring down to the 0.4-mm level was proposed. Yang et al. (2018a) 11 proposed an algorithm that detected cracks and spalling to manage structural damage from images. To this end, they developed an inspection-net method consisting of 37 neural network layers. Moreover, from a map created by the application of a visualization simultaneous localization-and-mapping technique to several images, the shape and damage information of the structure was simultaneously provided via 3D registration. To detect cracks in a structure, the authors of Torok et al. (2014) 12 installed a camera on a mobile robot to capture images while moving around a cracked target. A 3D structural shape was then generated from these images. By applying the crack detection algorithm to the restored 3D model, it was possible to estimate the location and shape of the crack. The authors of Liu et al. (2020b) 13 captured images using an unmanned aerial vehicle (UAV) to detect cracks in concrete structures. Several images were taken while turning the cracks generated at high positions on the structure. Using these images, a 3D restoration technique and a crack detection algorithm were applied to detect and evaluate the cracks along bridge piers.
Owing to the advent of deep-learning techniques, several methods have been introduced to detect structural damage from imagery. Algorithms to detect cracks using images are largely divided into two types: classification and segmentation. First, a study to detect cracks using a classification method is introduced. Cha et al. (2017) 14 applied a sliding window technique to a high-resolution image of cracks. An algorithm that could determine the existence of cracks in a 256×256 window was applied. As a result, an algorithm that could detect the location of a crack within a single image was proposed, attaining an accuracy of more than 98%. Xu et al. (2018) 15 and Xu et al. (2019) 16 conducted a study to detect the cracks in an infrastructure using a consumer-grade camera. They proposed a deep-learning algorithm that could determine the existence of cracks in a sub-image cropped from a large image. In addition, their method has the advantage of accurately detecting cracks in the presence of disturbances, such as handwriting. Xu et al. (2021) 17 conducted a study by applying few-shot learning. Various types of damages can occur in concrete structures, but the data available on them are limited. They addressed this problem by classifying concrete damage into 10 types and applying a classification algorithm. The method achieved an overall accuracy of 93.5%. Wang et al. (2020) 18 reported a study to improve recognition performance by applying the active learning technique to a dataset wherein the number of intact and damaged images was unbalanced. They developed an algorithm to determine whether the cropped image is damaged by applying the sliding window technique.
Regarding the segmentation method like Appendix, Yang et al. (2018b) 19 utilized convolution operations to detect cracks. From this, a technique for segmenting the crack regions in an image using a fully convolutional network was proposed. Morphological features were applied to calculate the thickness and length of the cracks. Liu et al. (2019b) 20 created hierarchical features to detect cracks in images. Additionally, five-sided sub-outputs were generated from these features, and the crack area was finally localized from their combination. Hence, the mean intersection-over-union was 85.9%, and the F1 score was 86.5%. Kang et al. (2020) 21 developed a crack detection method that combined a faster region-based (R) convolutional neural network (CNN) (Ren et al., 2015) 22 method with a segmentation method. The crack area was recognized using Faster R-CNN, an object detection technology, and the image-enhancement algorithm was applied to segment the crack area to an 83% accuracy. Kim and Cho, (2019) 23 applied Mask R-CNN (He et al., 2017) 24 technique to detect the cracks. First, the crack in the image was regarded as an object and was detected in the form of a bounding box. Then, a technique was used that could accurately measure cracks up to 0.1 mm by performing binarization in the inner area of the box. Li et al. (2020) 25 adopted adversarial learning to segment the road cracks in images. They suggested a segmentation neural network developed using DenseNets and applied dense connectivity to the discriminator neural network to create a confidence map. Finally, their algorithm performance exceeded approximately 93%. Shim et al. (2020) 26 also applied adversarial learning, which used semi-supervised learning to detect concrete cracks. They proposed segmentation and discriminator deep neural networks to develop a method of improving recognition performance when the number of label images was insufficient, and recorded results showing a pixel accuracy of 98.176%, a mean intersection-over-union of 88.936%, a frequency weighted intersection-over-union of 96.525%, and an F1 score of 88.789%.
3D sensor-based detection
Rodriguez-Martin et al. (2016) 27 measured the direction, thickness, and length of a crack by applying a thermographic method to data obtained from an infrared (IR) camera. Their algorithm detected toe and longitudinal cracks by measuring defects on the metal surface. Hence, the cracks were measured, and a measurement method with an error of at least 0.03 mm was obtained. Brooks et al. (2015) 28 used a triangulation technique with an IR source. A measurement system was installed on a conveyor belt to measure the cracks present on solar-cell surfaces. As the measuring system passed the solar cells, crack formations on the surface were measured.
Rabah et al. (2013) 29 proposed a method of measuring concrete cracks via laser scanning. They first removed the noise generated via shading from the original image, and they detected cracks using the denoised image. Then, a 3D shape of the object to be measured was created, and crack information was expressed. This measurement performance showed less than 38-mm errors compared with the total station. Sun et al. (2012) 30 used a laser vision system to detect cracks along road pavement. This method illuminated the road surface with a laser and recorded images of the reflected light using a camera. The obtained images took the form of a profile from which an algorithm was developed.
Meksen et al. (2010) 31 used the time-of-flight diffraction (TOFD) method to detect cracks on the surfaces of steel products. The Hough transformation and split-spectrum processing techniques were applied to crack detection using an automated system. Merazi-Meksen et al. (2014) 32 proposed a similar algorithm that was used to detect discontinuous sections by applying a mathematical morphology operation and a pattern recognition technique. Additionally, the region of interest was determined using a watershed technique, and the shape of cracks was accurately detected using a skeletonization technique.
Shan et al. (2016) 33 used stereo vision to measure the thickness of cracks. Camera parameters were extracted using a camera calibration technique, and the 3D information of cracks was generated using these parameters. The authors developed a measurement technique with a maximum relative error of 5.4% compared with the width of the crack measured using Vernier calipers. Ziqiang et al. (2017) 34 used stereo vision to measure cracks in bridges. They applied various filtering and image-enhancement techniques to detect them. Then, the lengths of cracks were calculated using camera triangulation.
When examining the research trends of image processing-based algorithms, it was found that many studies used deep-learning because crack detection recognition performance was improved. However, such algorithms have an inherent issue in that their recognition performance decreases when detecting cracks generated in environmental conditions other than those originally considered. Therefore, we conducted a study to solve this matter. Furthermore, as a result of measuring the physical size of cracks, stereo vision was selected from the various methods reviewed. Laser vision is accurate, but it can only be used in dedicated systems, such as conveyor belts or vehicles moving in a straight line. Additionally, the IR method uses an auxiliary light source for pictures, and its recognition performance was easily affected by the interference of outdoor sunlight. Because most concrete structures are exposed to the outdoors, IR cameras are not suitable for high performance. Moreover, the TOFD method is used to reconstruct a 2-dimensional (2D) image in 3D by adding another type of sensor. This method uses different sensors simultaneously and has potential out-of-sync error factors. However, stereo vision can be applied outdoors by shooting in complete synchronization using sunlight as a light source. Therefore, we propose a semi-supervised learning method and stereo-vision-based 3D crack measurement for application in arbitrary outdoor environments.
Concrete crack data
Assumption of data categorization
The purpose of this study is to increase the recognition performance that is otherwise reduced when a deep-learning model is applied to a new imaging task. To achieve this, data are first obtained from various environmental conditions and are classified into three groups. The first group contains concrete crack images reflecting existing environmental conditions for the development of a crack detection algorithm. These comprise crack images taken at a concrete building at the Middle East Technology University (Özgenel, Ç. F. and Sorguç, A. G., 2018)
35
and images provided by Utah State University (Dorafshan et al., 2018).
36
Figure 1(a) presents these “O-Images.” The second group contains concrete images provided by Liu et al., (2019a)
37
who secured 11,300 images by integrating more than 10 different datasets. Among them, some images were randomly selected and regarded as new environmental crack images for this study. Figure 1(b) presents these “N-Images.” The third group contains image data for the development of a crack restoration algorithm. The images were taken with a stereo camera by the authors from concrete cracks occurring at a real site. The targets include cracks in concrete linings and walls. Figure 1(c) presents these “S-Images.” Crack images from different environmental conditions: (a) O-Images; (b) N-Images; and (c) S-Images.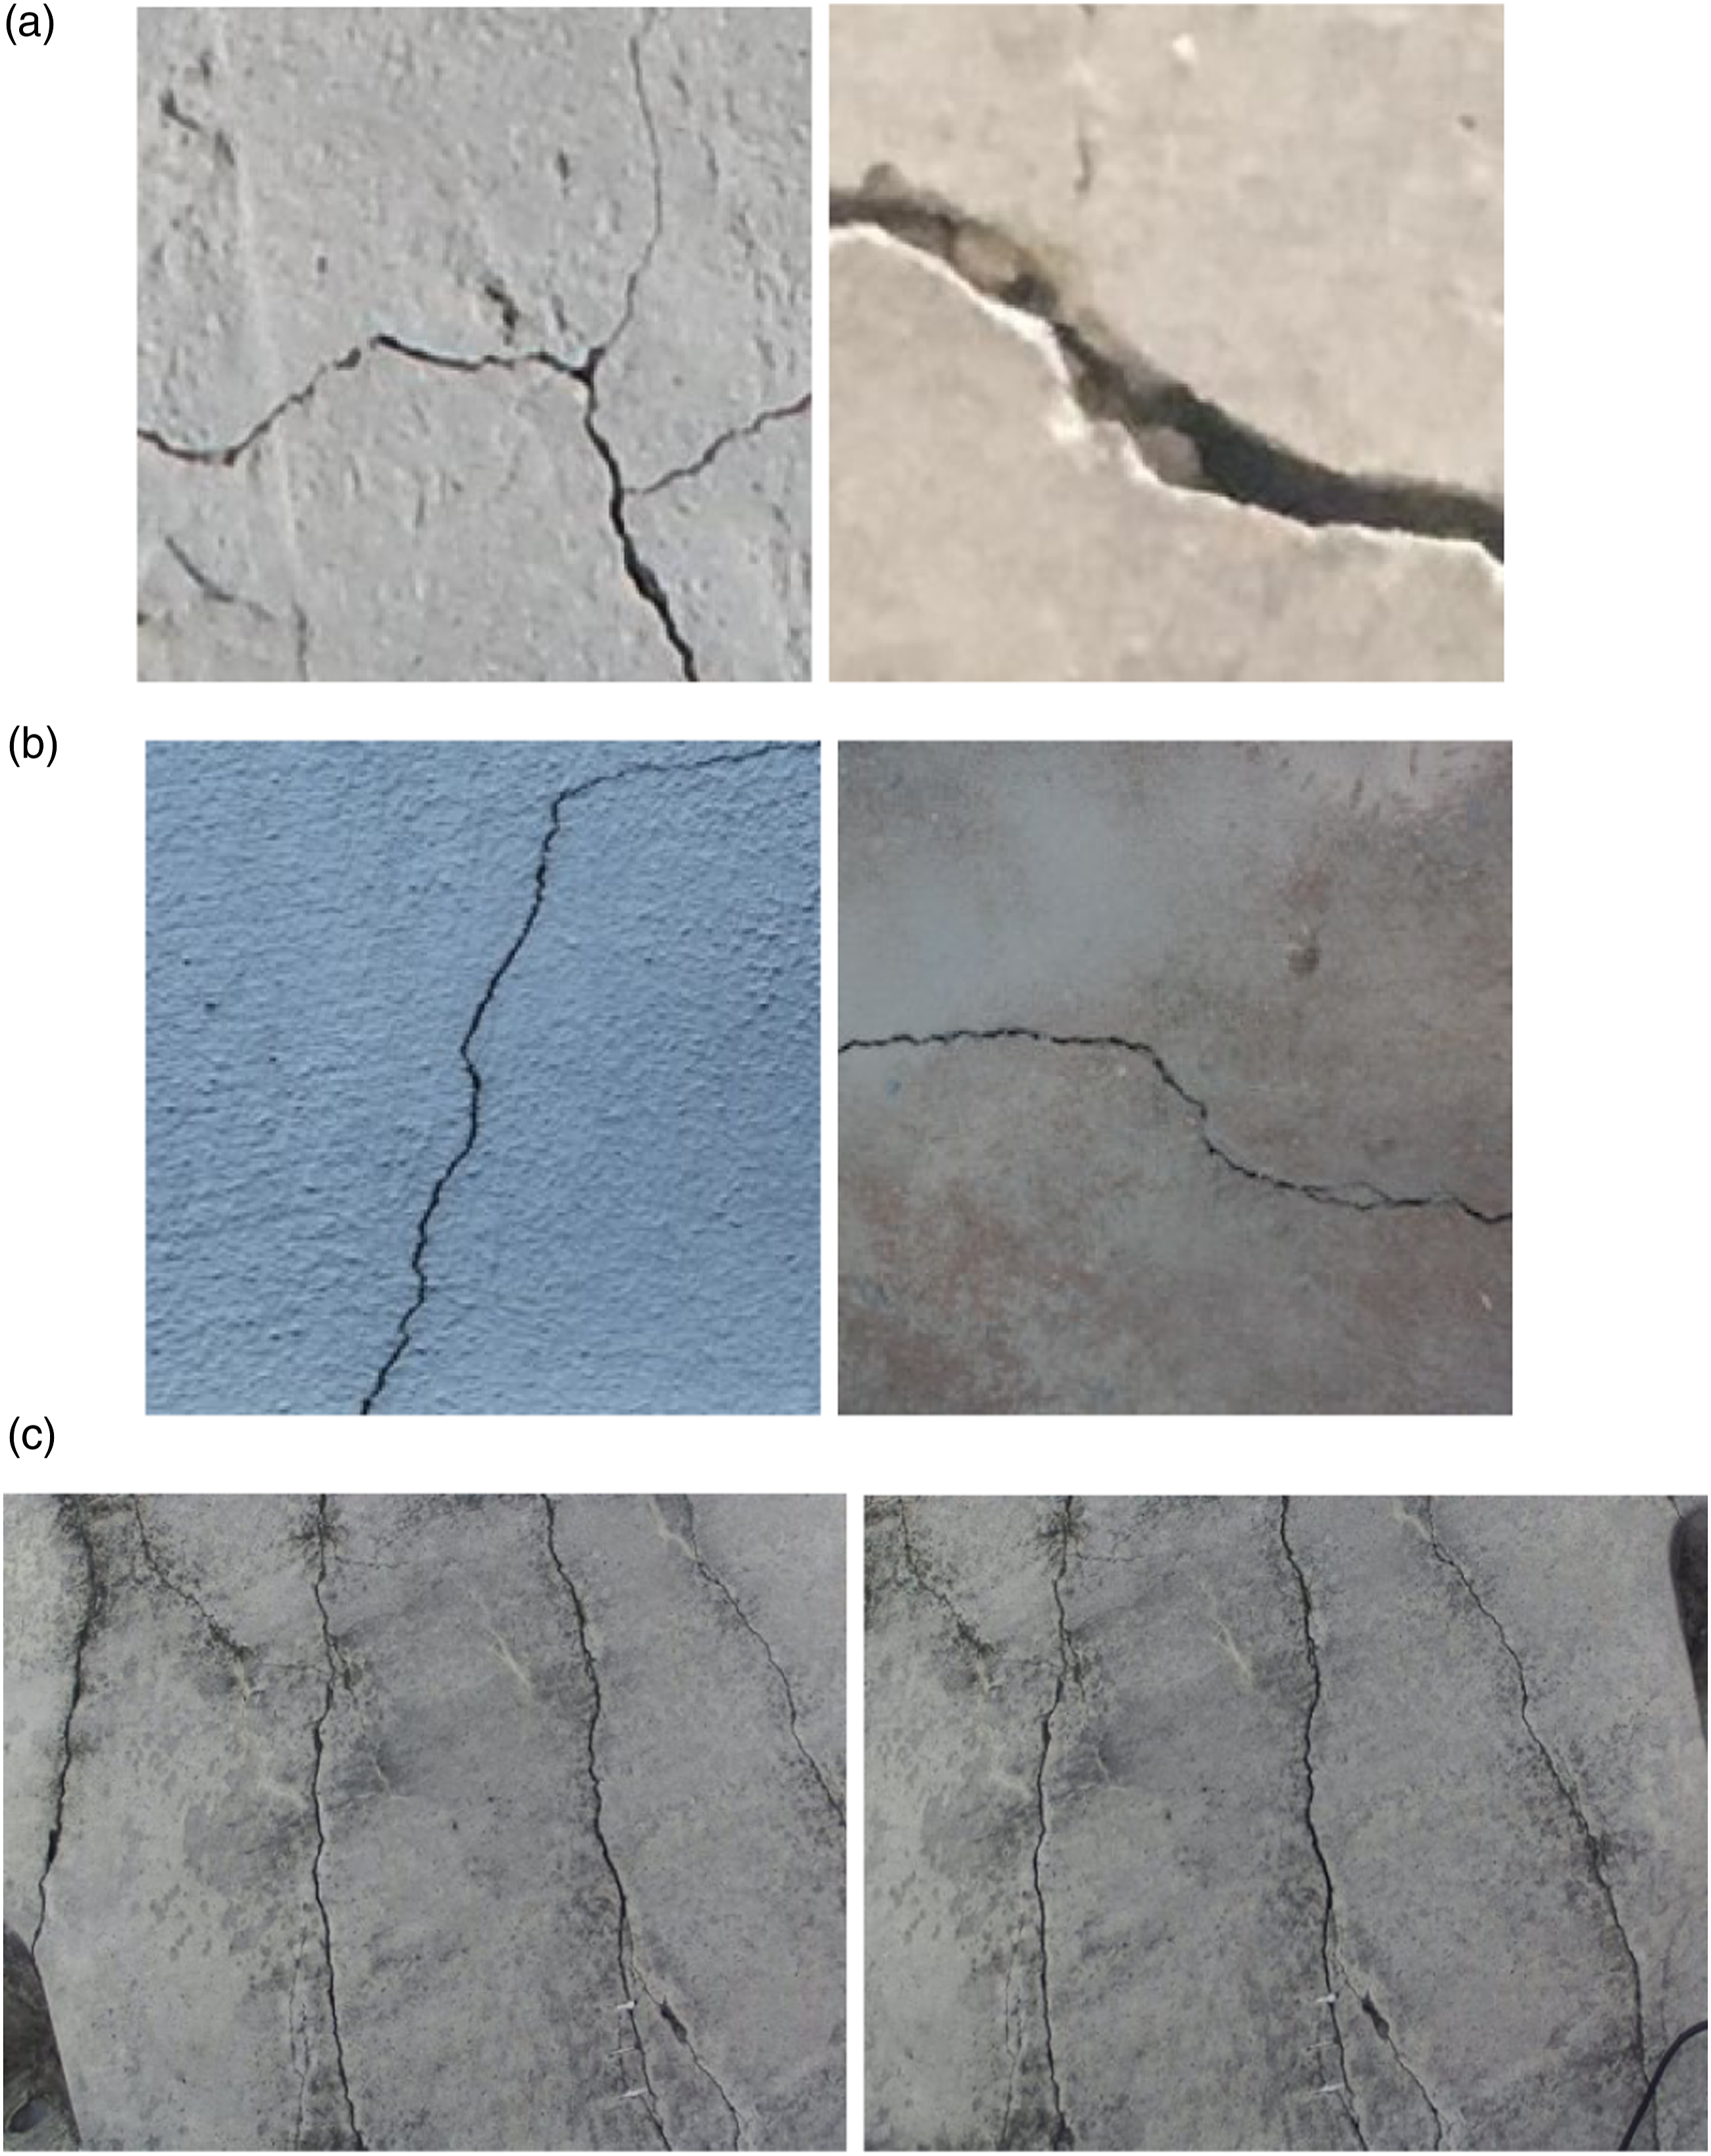
In this study, concrete crack images are classified into O-Images, N-Images, and S-Images to develop our algorithms. When examining the O- and N-Images, we note that the concrete surface states differ based on the surface colors, degrees of deterioration, and roughness. Based on this, we developed the crack detection algorithm by comparing the influences of the existing environmental conditions and those of new ones. Furthermore, the S-Images have different properties from O- and N-Images because those image data were collected from yet another environmental condition. Using the collection of images, the deep neural network model trained by our proposed method was tested to evaluate how accurately crack shapes are represented. Then, the applicability of our new method to new environments and its recognition performance was analyzed.
Crack data configuration for deep-learning
Data configuration.
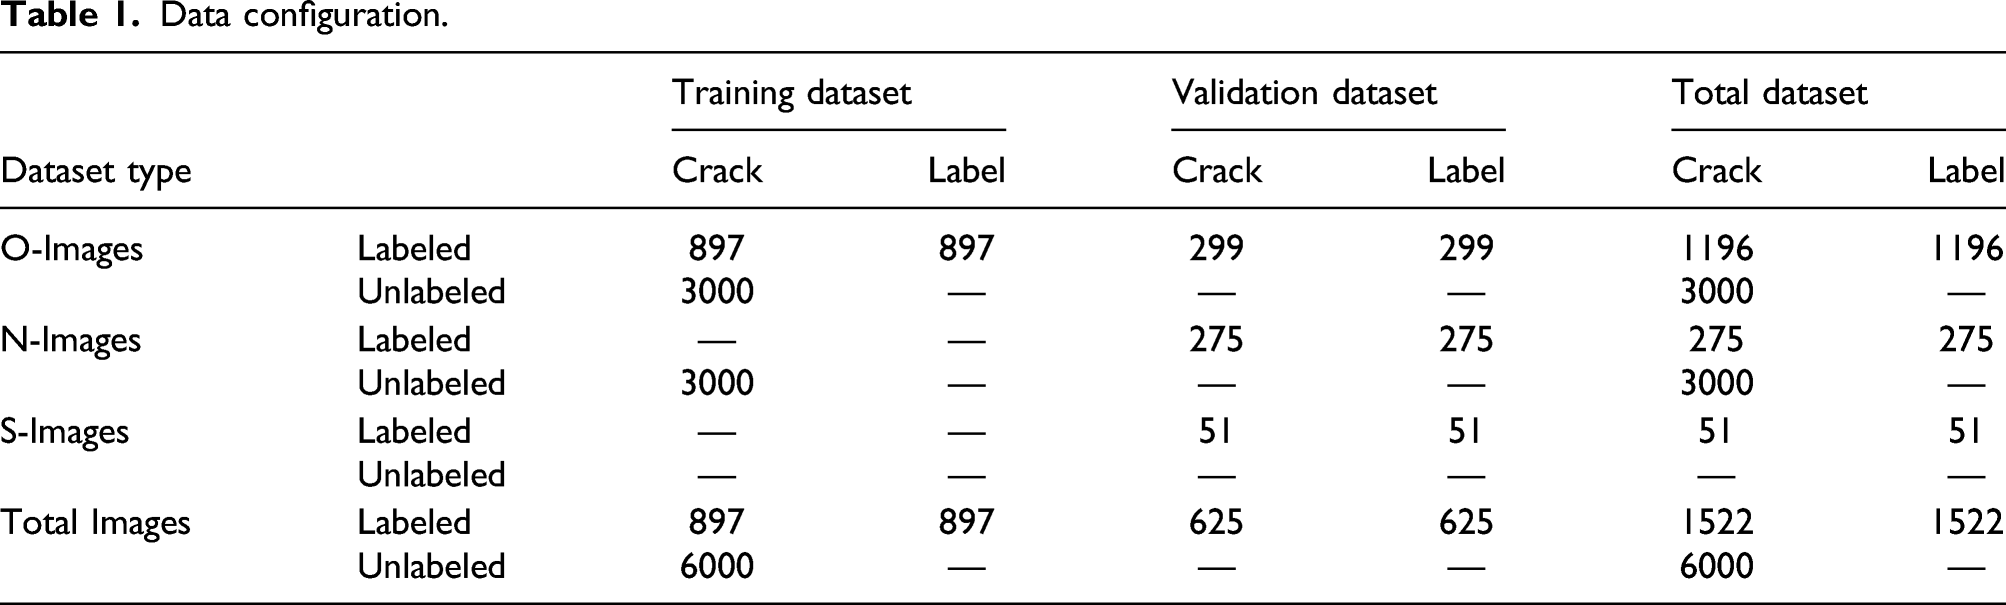
Next, a validation dataset was constructed to evaluate the performance of the trained deep neural network. This dataset consisted of 299 O-Images, 275 N-Images, and 51 S-Images. Among them, the S-Images were captured with a fully high definition camera, unlike the other images. Stereo images were always paired via their left and right shots, and the overall size was 3840×1080. This validation dataset was labeled and had the same number of label images as crack images. We adopted this dataset to evaluate the recognition performance of the proposed deep-learning model by applying it to both existing and new environmental conditions.
Deep-learning-based crack detection
In this study, adversarial learning, a method of semi-supervised learning, was applied to develop an algorithm capable of detecting cracks in new environmental conditions. As shown in Figure 2, adversarial learning methods were divided into labeled and unlabeled types depending on whether label images are used. Adversarial learning is characterized by applying these two learning datasets simultaneously. Labeled-dataset-based learning updates the weights of the segmentation network using both crack and label images. This updates the weights of the deep neural network such that the predicted image generated by the segmentation network is identical to the label image. Therefore, the recognition performance is affected by the structure of the segmentation network. Next, the unlabeled dataset uses only crack images and creates a confidence map using a discriminator network to update the weights of the segmentation network. Even without label images, the discriminator network trains the segmentation network by building a confidence map like real label image. Therefore, the more similar the confidence map to the label image, the better the recognition performance. This shows the motivation for the proposed improved segmentation network structure and ensemble discriminator network method. Adversarial learning for crack detection.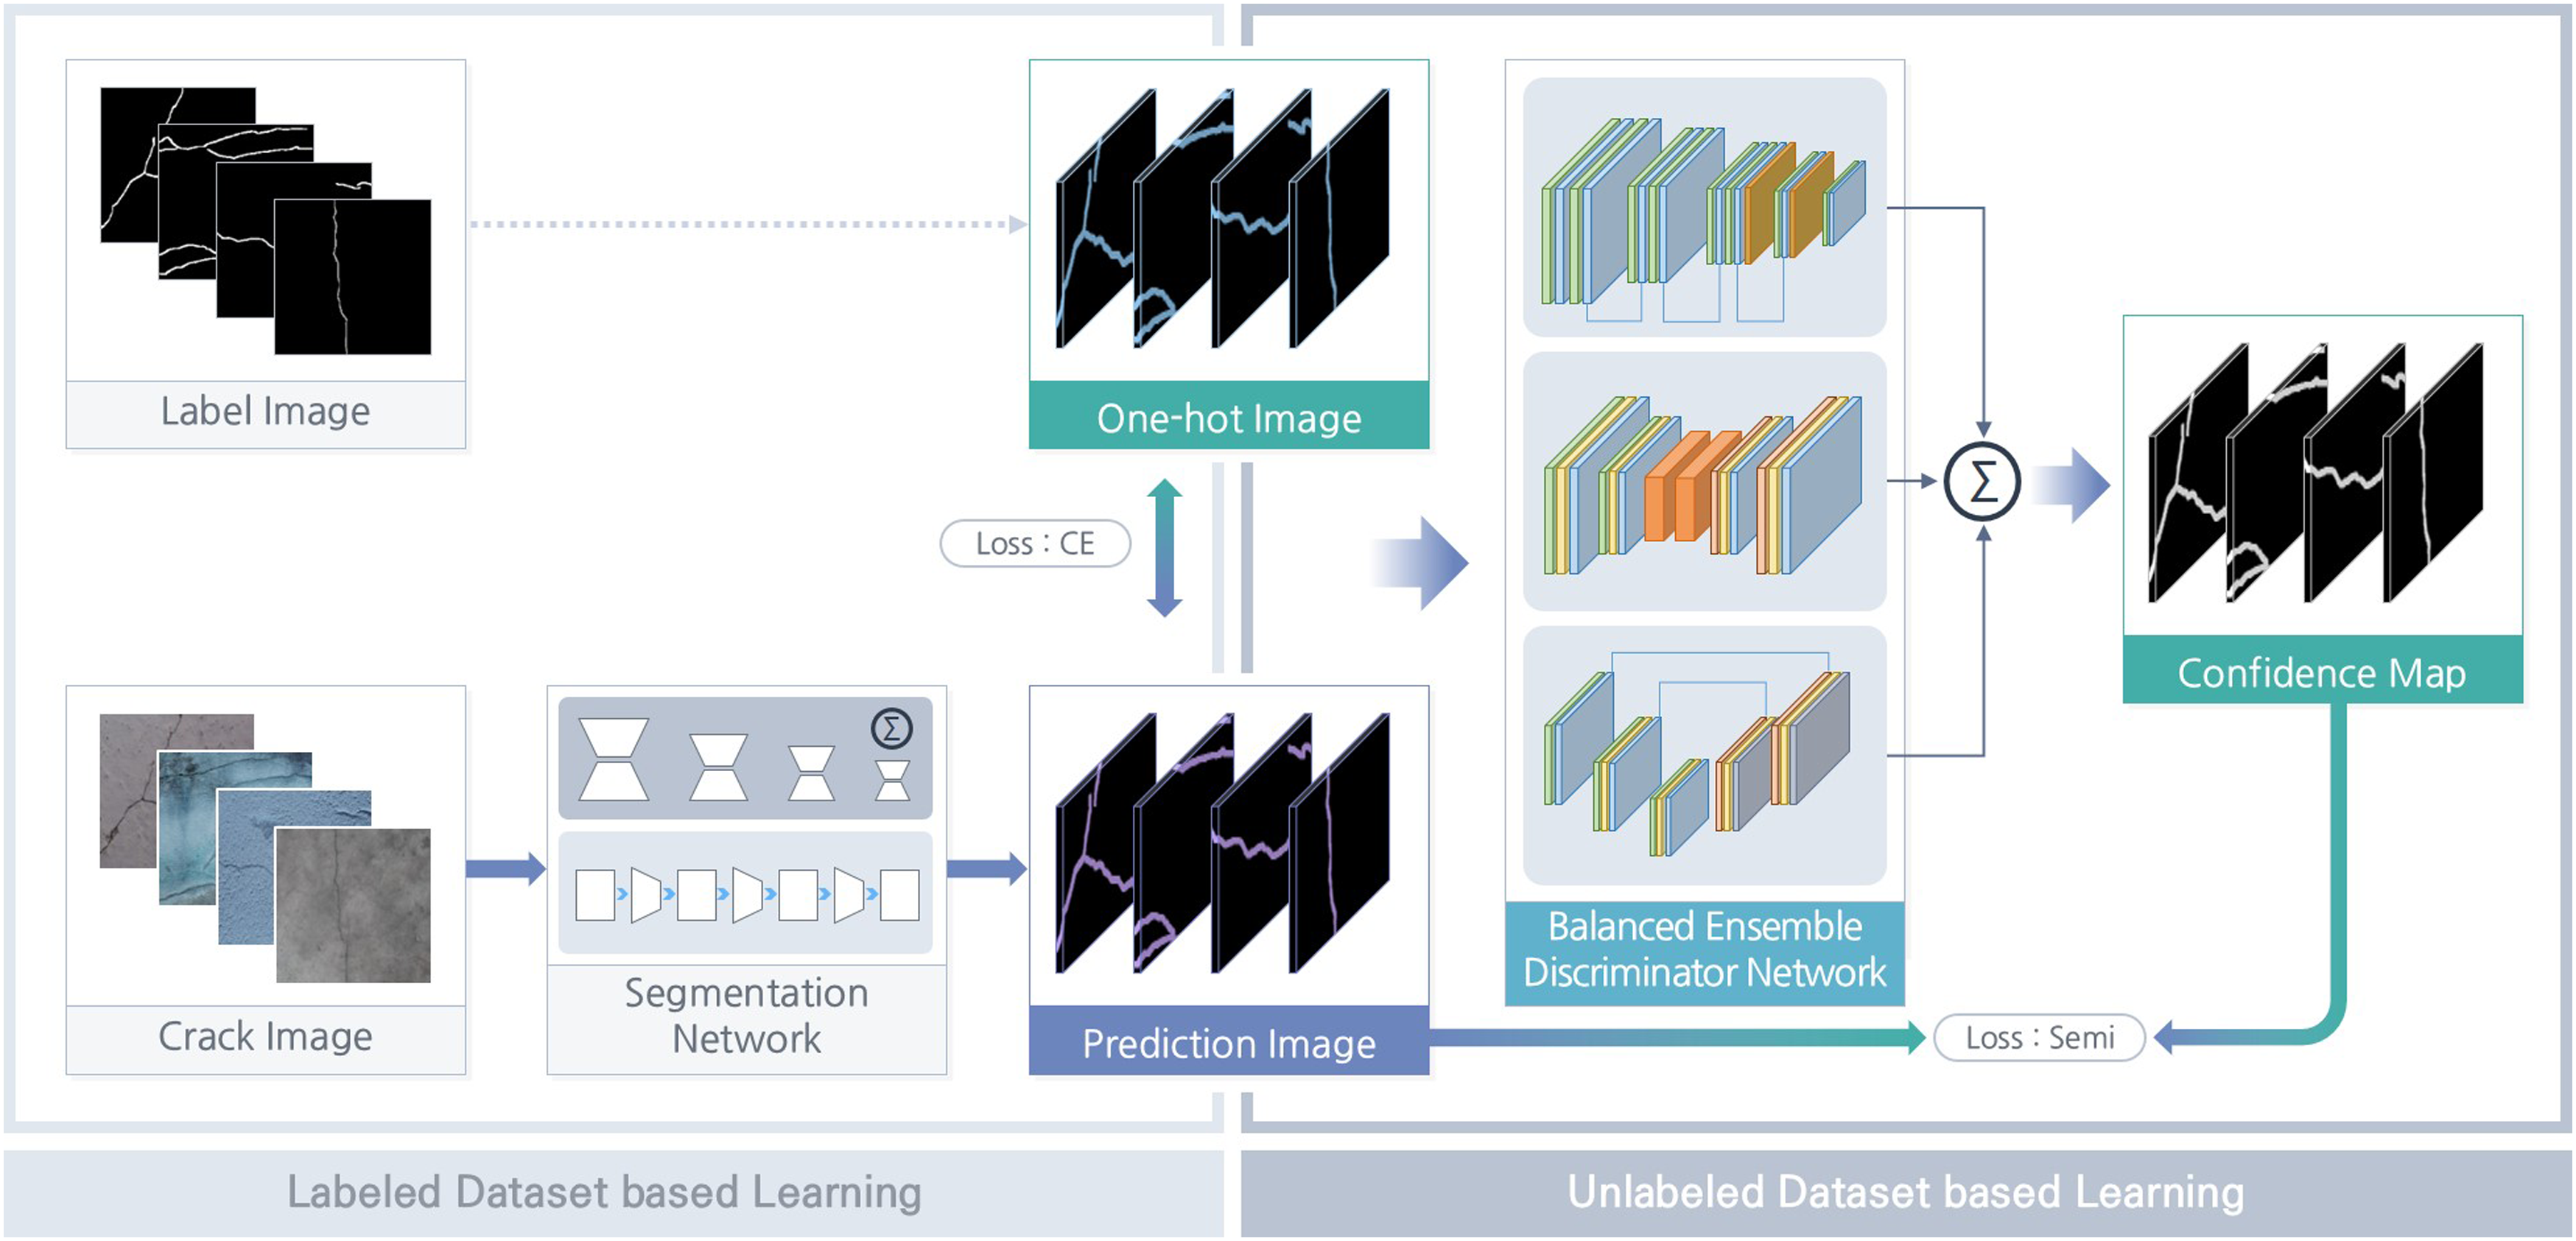
Improved semantic segmentation network
The structure of the deep neural network used to detect cracks in this study is developed from the form applied by Shim et al., (2020). 26 Because this deep neural network comprises a convolutional neural network, it has the advantage of being able to detect multiscale cracks. Our segmentation networks both consists of feature and localization stages. Moreover, the feature stage comprises four dense blocks, and the localization stage is an auto-encoder type. In this method, the parameters used in the original dense block are improved. First, the depth number of the initial feature of the dense block is changed from 16 to 8, and the growth rate is changed from 8 to 4. Accordingly, the number of depths of features input to the localization stage is reduced. The number of features depths in the original deep neural network is 48, 48, 40, and 28 for Blocks 1, 2, 3, and 4, respectively. However, in this study, the deep neural network is improved more lightly by modifying them to 24, 24, 20, and 14.
Balanced ensemble discriminator network
In this study, a balanced ensemble discriminator network is used to improve the performance of adversarial learning. Three deep neural networks are simultaneously used to implement the ensemble shown in Figure 3. A fully convolutional network (FCN) discriminator network, a ResNet discriminator network, and a UNet discriminator network are employed to update the weights of deep neural network, and two loss functions are equally applied. The first is utilized for real learning with a labeled dataset in which a crack and labeled images are paired. The second other is used for fake learning using an unlabeled dataset consisting of only crack images without labels. Taking the FCN discriminator network as an example, real learning uses a one-hot image and a prediction image that is an output from the segmentation network. The outputs of these images passing through the FCN discriminator network are considered to be true and false, respectively, and the loss function is called Loss1:D. Next, fake learning uses a prediction image that is output from the segmentation network when applying the crack image. Additionally, the output obtained after passing through the FCN discriminator network and being regarded as true. The loss function is called Loss1:adv. The same learning mechanism is applied when training the ResNet and UNet discriminator networks, and the weights are updated with the loss functions. In summary, the prediction image is trained once as true and again as false so that the weights of the discriminator network are updated competitively by applying opposite learning methods at the same time. Structure of balanced ensemble discriminator network.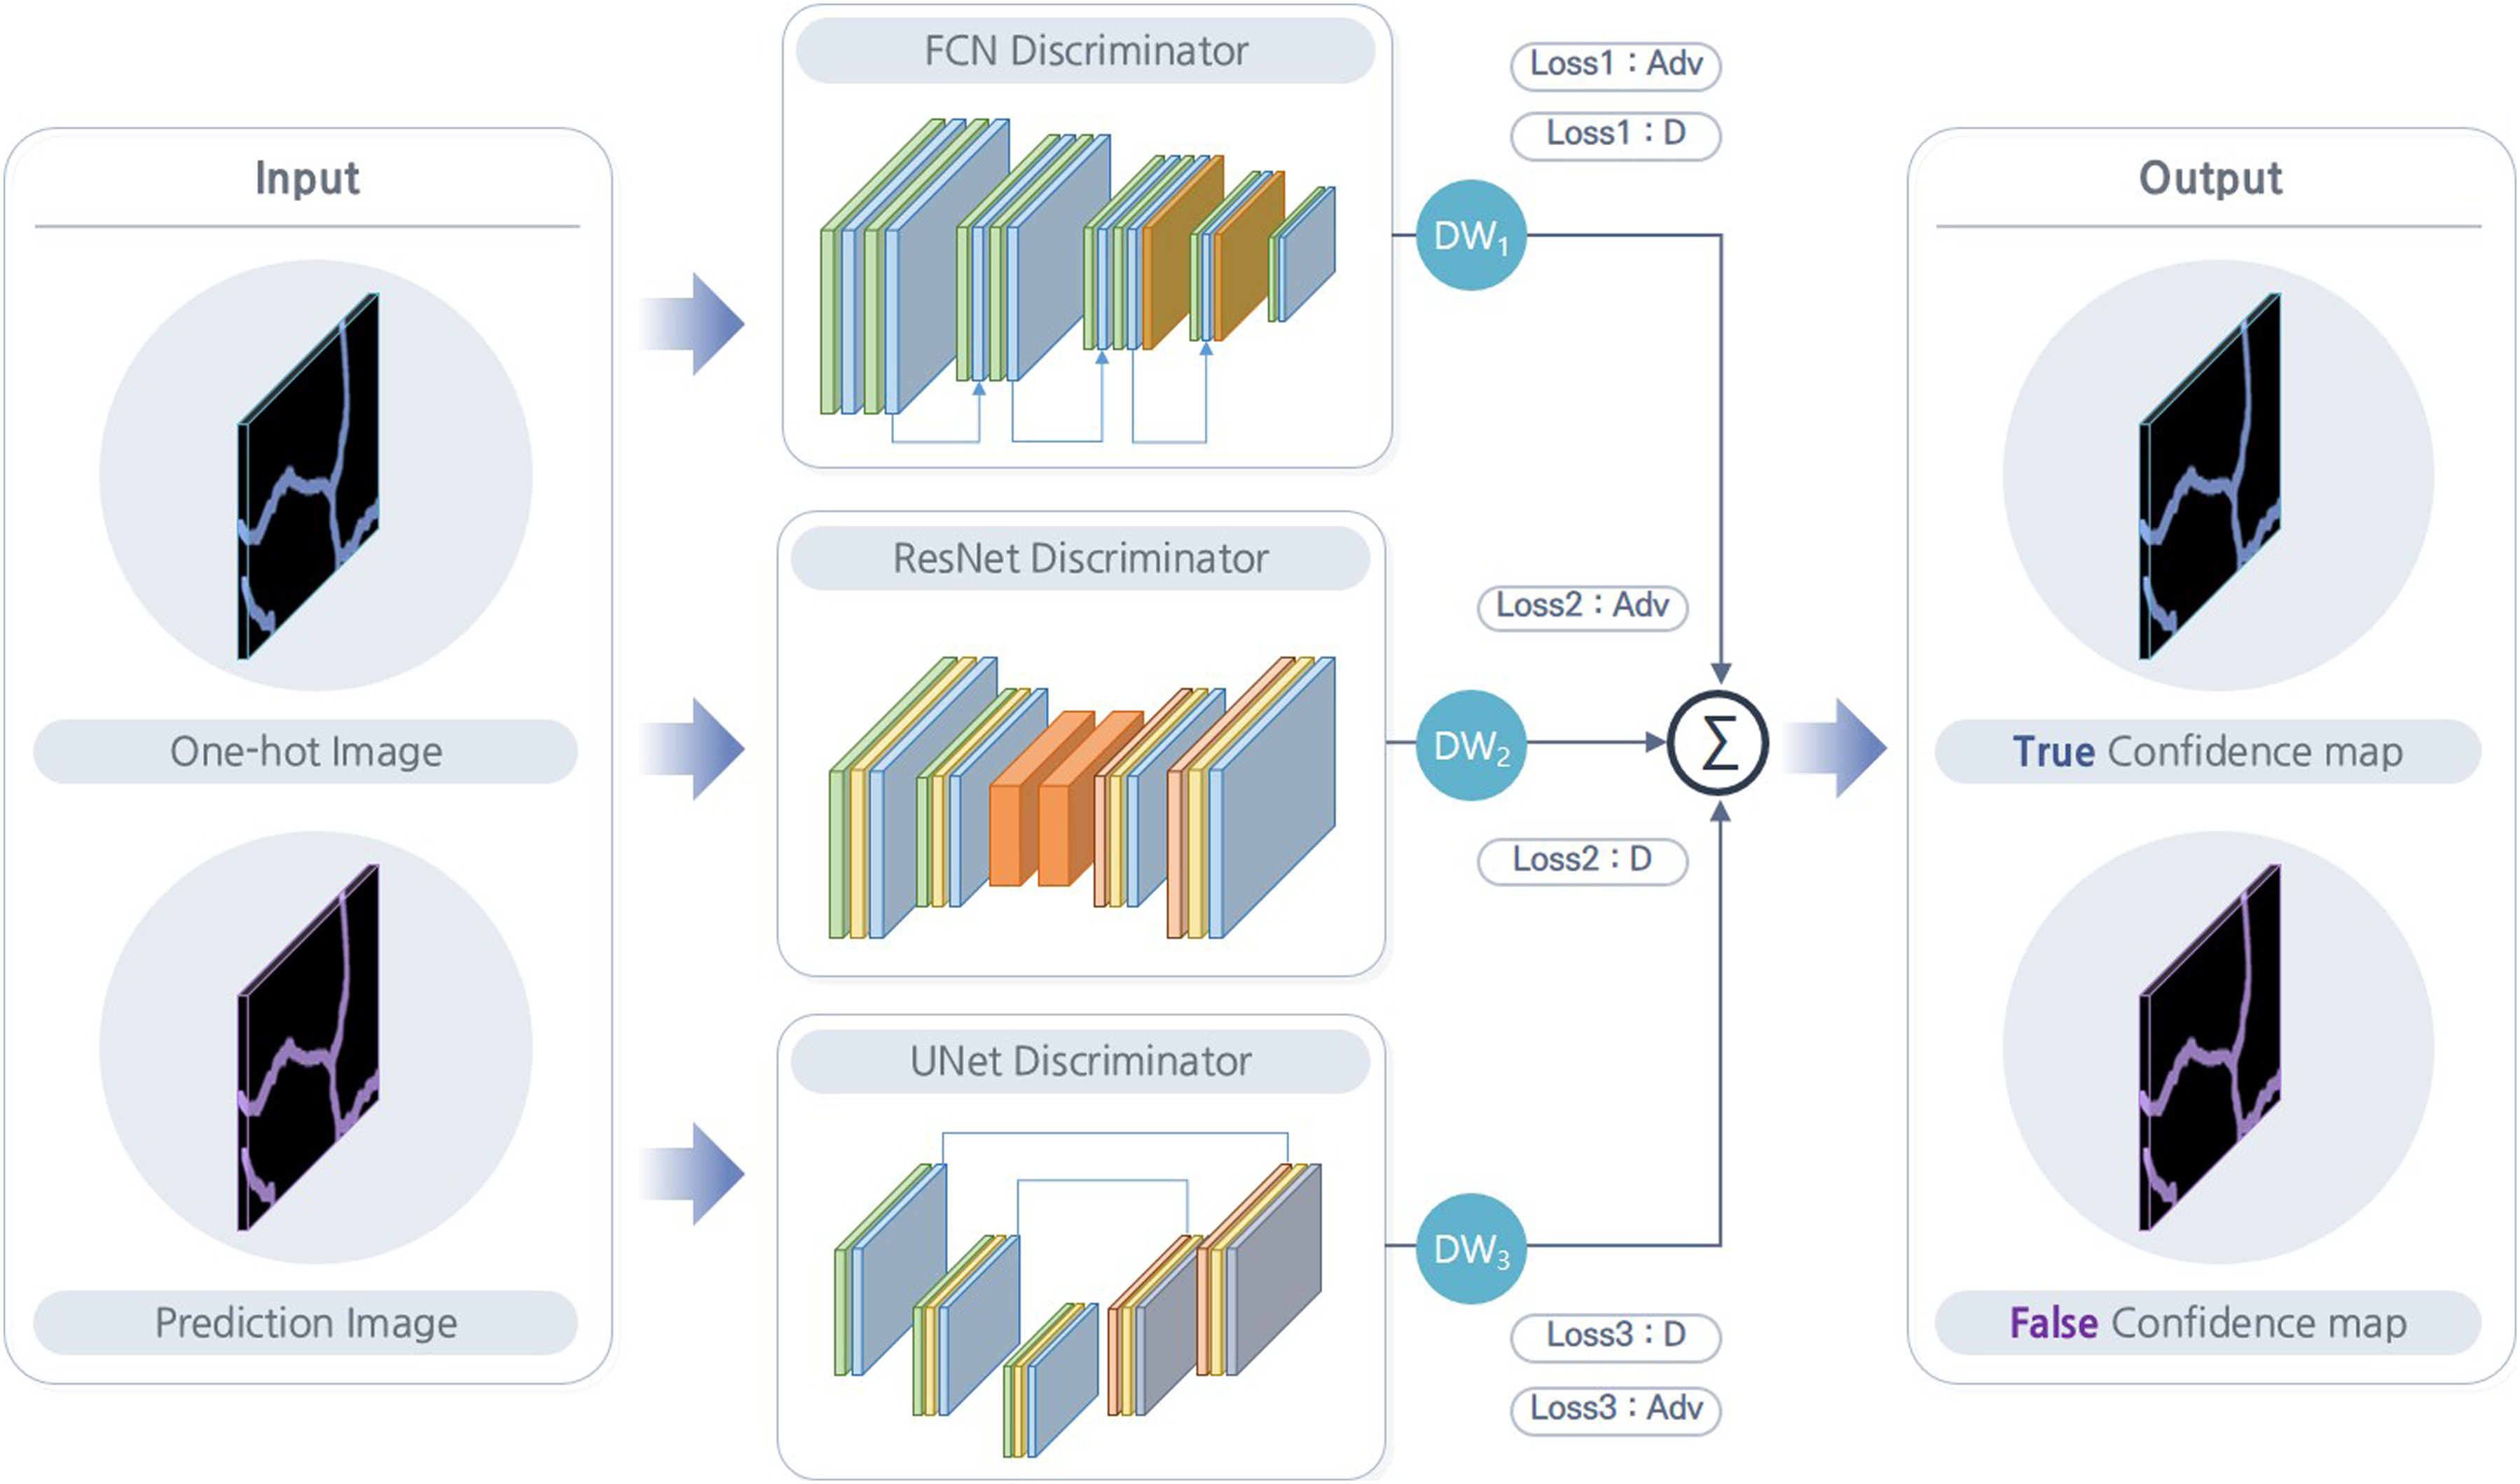
We apply the optimal balance between discriminator networks as with competitive learning. The three discriminator networks perform the same function. However, because the structure of each discriminator network is different, the generated results are also different. For example, even if one discriminator network produces correct results, another discriminator network may produce incorrect results. In a situation where different results are mixed, the discriminator networks are required to be balanced in order to finally produce the correct result. To this end, in this paper, the output of each discriminator network is multiplied by balanced weights (DW1, DW2, DW3). Then, the final result is obtained by averaging the results of the three discriminator networks.
The output obtained by applying the balanced ensemble method to the three discriminator networks is a confidence map. When a one-hot image passes through a discriminator network, it becomes a true confidence map. On the other hand, when the prediction image is used as an input to the discriminator network, the result is a false confidence map. As mentioned, this discriminator network is trained competitively by applying real and fake learning at the same time. As a result, it finally converges to a state in which the true and false confidence maps are indistinguishable. Therefore, the confidence map obtained by passing the prediction image through the discriminator network is very similar to that obtained by the one-hot image. Therefore, we obtain a prediction image from the crack image of the unlabeled dataset and pass it through the discriminator network again to obtain a false confidence map that looks like a true one. Finally, this confidence map is binarized to train the segmentation network to improve recognition performance.
The ensemble discriminator comprises three discriminator networks. An FCN discriminator network is an encoder type, used in Shim et al. (2020), 26 and it is characterized by applying dense connectivity. Additionally, because this deep neural network comprises an FCN, it is defined as an FCN discriminator network in this paper.
The second discriminator network (i.e., ResNet (Zhu et al., 2017))
38
is shown in Figure 4 as an auto-encoder. Specifically, this deep neural network consists of an encoder stage, a residual stage, and a decoder stage. The encoder stage consists of a combination of a convolution (Conv.) operations, a batch normalization (B-Norm.) operation, and a rectified linear unit (ReLU) operation. The second and third Conv. operations include a size reduction operation, so that when an image of size 256×256 is input, an output size of 64×64 is produced. Additionally, an operation to increase the number of filters twice by doubling is included to generate a 256× 64×64 feature matrix as an output. The generated feature matrix is used as an input to the residual stage, which consists of six residual networks with skip connections (He et al., 2016).
39
There, the same operation is performed without changing the size of the feature matrix. Thus, by increasing the number of layers, the neural network is deepened to generate more meaningful features. In the last decoder stage, the reduced size is restored to its original state. Then, a transposed convolution (TransConv.) is applied as an operation to restore the size (Dumoulin and Visin, 2016).
40
The size that was reduced by the previous two times is restored twice again. Additionally, the number of filters is set to 128 and 64 to generate a 64× 256×256 feature matrix as an output. After passing all three stages, the feature matrix connects the Conv. operation and the hyperbolic tangent operation to generate an output with a size of 1× 256×256 and pixel values between zero and one. Structure of ResNet discriminator network.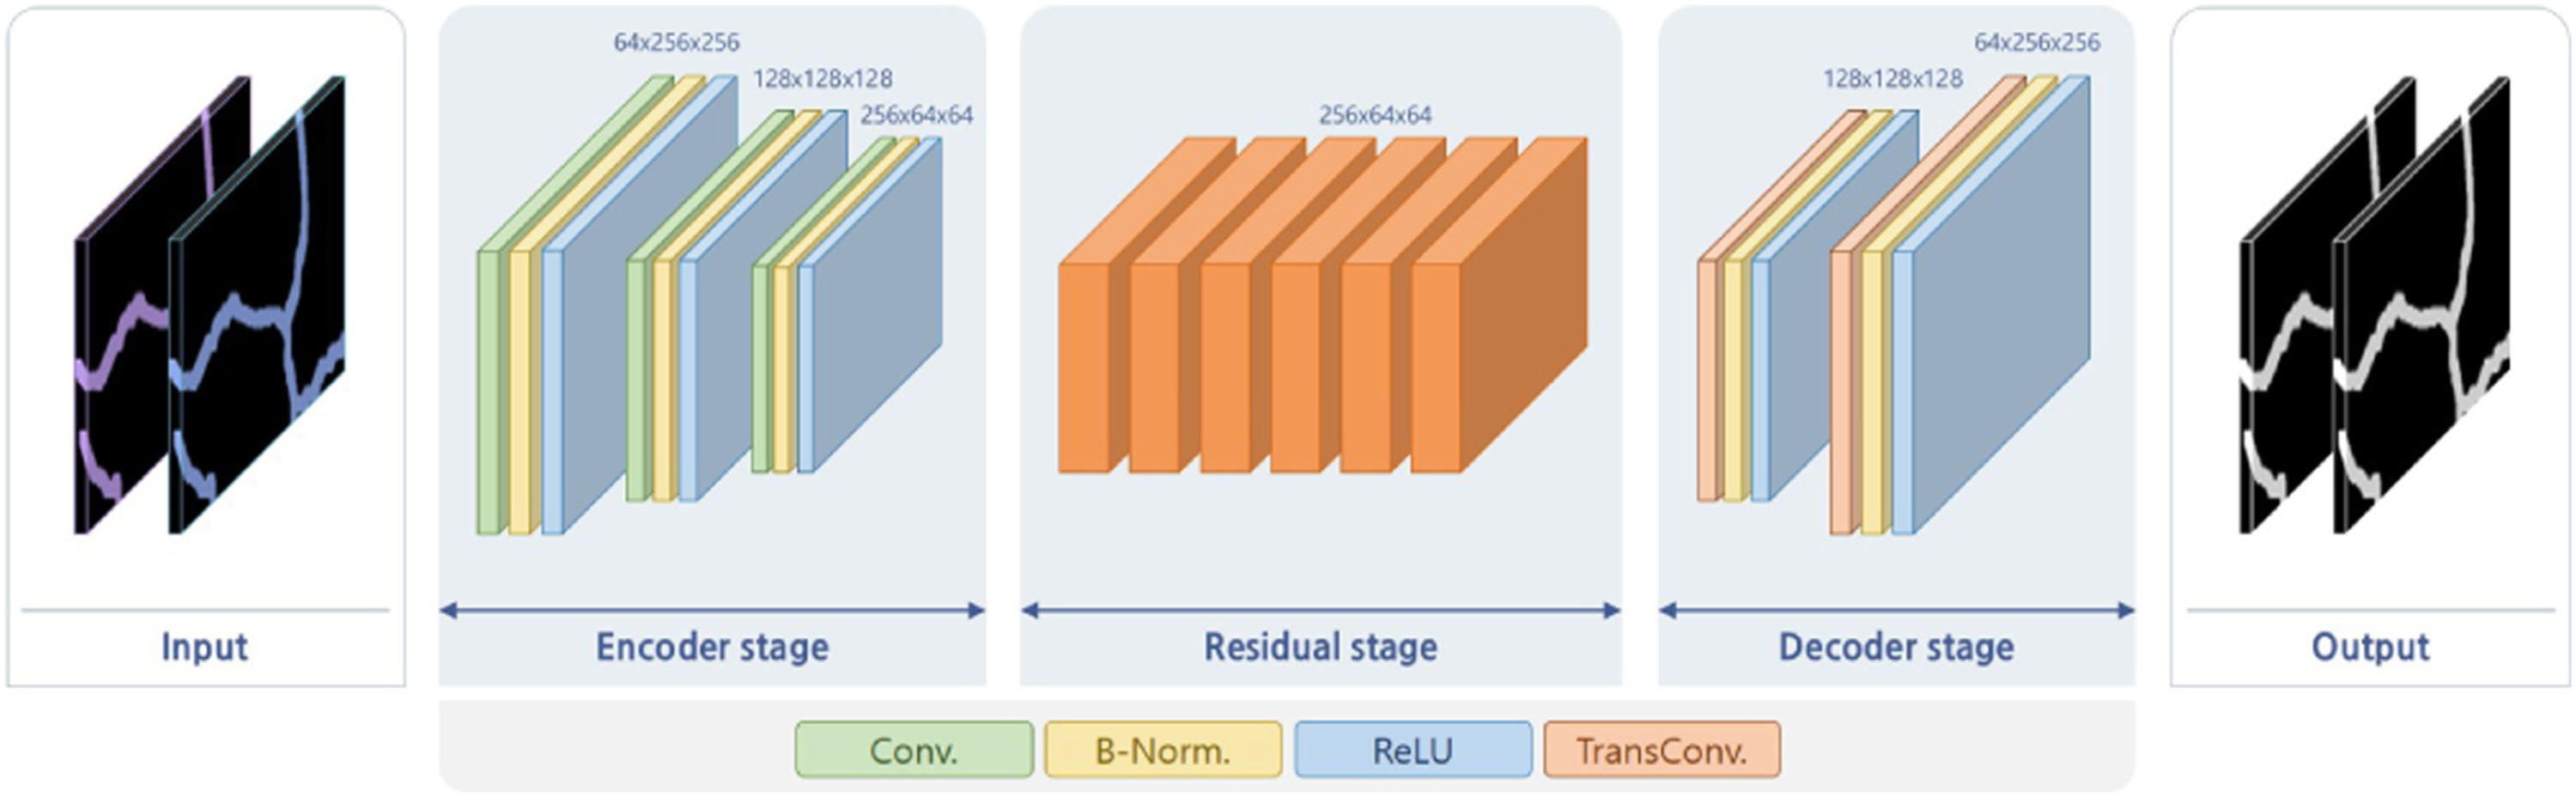
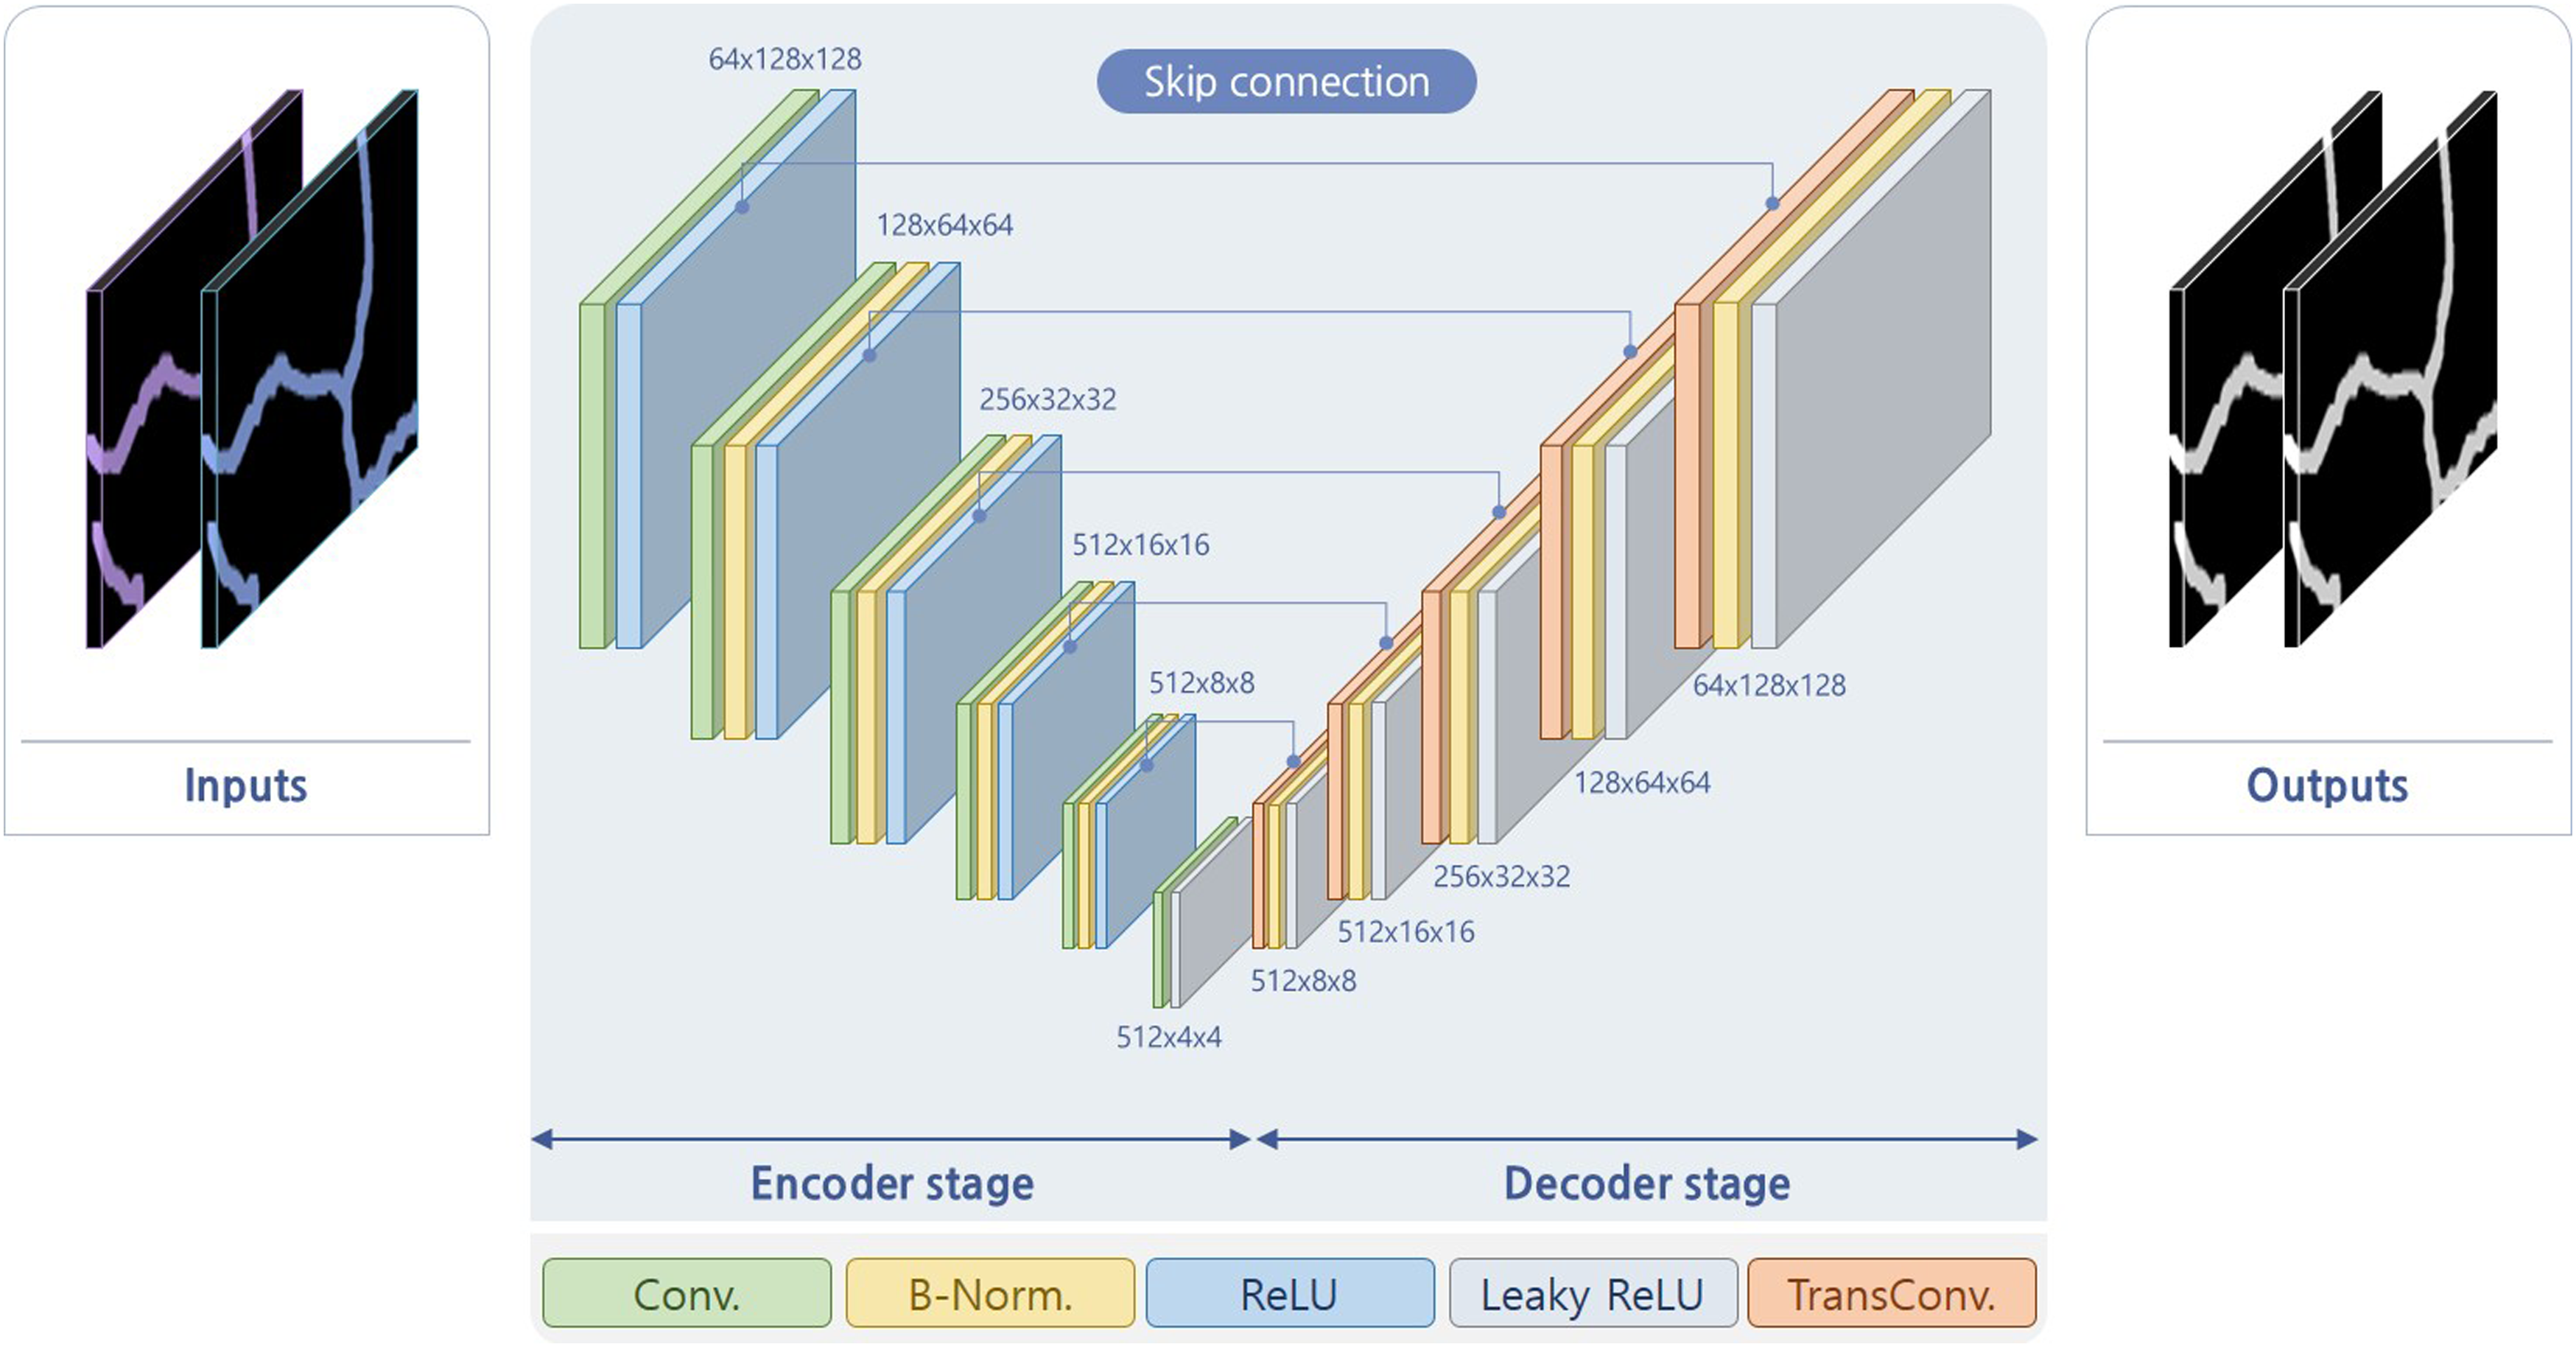
The third discriminator network is the UNet shown in Figure 5 (Isola et al., 2017).
41
This network also uses an auto-encoder and comprises a combination of Conv., B-Norm., ReLU, and TransConv. operations. There are two differences between the UNet discriminator network and the ResNet discriminator network. The first difference is that a leaky ReLU is used as the computation method (Xu et al., 2015).
42
See equation (1). This is used to solve the dying ReLU problem, which is a disadvantage of the original function in which when a negative value emerges during learning; hence, the neuron value becomes zero and no longer changes. To resolve this problem, a linear function with a slope of 0.2 is applied so that the neuron value does not reach zero. Hence, it is continuously updated as the learning progresses. The second difference is the structure of the discriminator network. The UNet-based discriminator network consists of encoder and decoder stages that are symmetrical. In the encoder stage, the size is reduced six times to create a feature matrix of size 512× 4×4. In contrast, during the decoder stage, the size is restored to the original size six times in the same way, and an output having a size of 1× 256×256 is generated again. Additionally, because this structure is symmetrical, skip connection operations are applied between feature matrices having the same size. Thus, the weights obtained from the encoder stage are directly connected to the decoder stage. As a result, although the deep neural network is quite deep, the input information can convey to the output without being lost Structure of UNet discriminator network.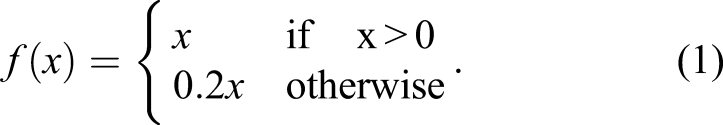
Stereo-vision-based 3D crack reconstruction
After a crack is detected, its 3D shape is reconstructed using triangulation based on stereo vision to determine its physical size. Stereo vision acquires both depth and 3D shape information by simultaneously photographing an object with two cameras. In performing crack measurement, the shape of the crack is expressed in the form of a 3D point cloud. If the structural distance between the two cameras is used as a scale value, the 3D point cloud data appear on a real scale. In this work, this method was implemented in three steps. First, a camera projection matrix that defined a geometric relationship between two cameras was used. Second, a homography matrix was obtained to convert the viewpoint between two captured images. Finally, the 3D shape of the crack was restored by applying the triangulation technique to stereo vision. As a result, a sensor technology capable of diagnosing the condition of concrete structures in a non-contact manner is provided to enable the physical size information of cracks to be obtained.
Camera projection matrix
Camera calibration involves finding the rules of how to convert 3D information into 2D information. When capturing images with a camera, the target object exists in 3D space, and after being photographed, it remains in a 2D space. Hence, one dimension is lost. The conversion occurs when the projection matrix multiplies the 3D point of the object. This matrix consists of an intrinsic parameter and an extrinsic parameter, which are defined as equation (2). In this equation, (X, Y, Z) denotes an arbitrary 3D point in the world coordinate system, whereas (x, y) denotes the corresponding 2D point in the image coordinates. In simple terms, it is expressed as A[R|t], where A is the intrinsic parameter, and [R|t] is the extrinsic parameter. A is composed of focal lengths, f
x
and f
y
, center points, c
x
and c
y
, and skew, which is an asymmetric coefficient. On the contrary, the extrinsic parameters consist of a rotation matrix and a translation matrix, and they represent the posture and position information between the multiple cameras, respectively. For example, when two cameras are used simultaneously, if the 3D coordinate system of one camera is used as the reference, [R|t] is the matrix that defines the relationship to the 3D coordinate system of the other camera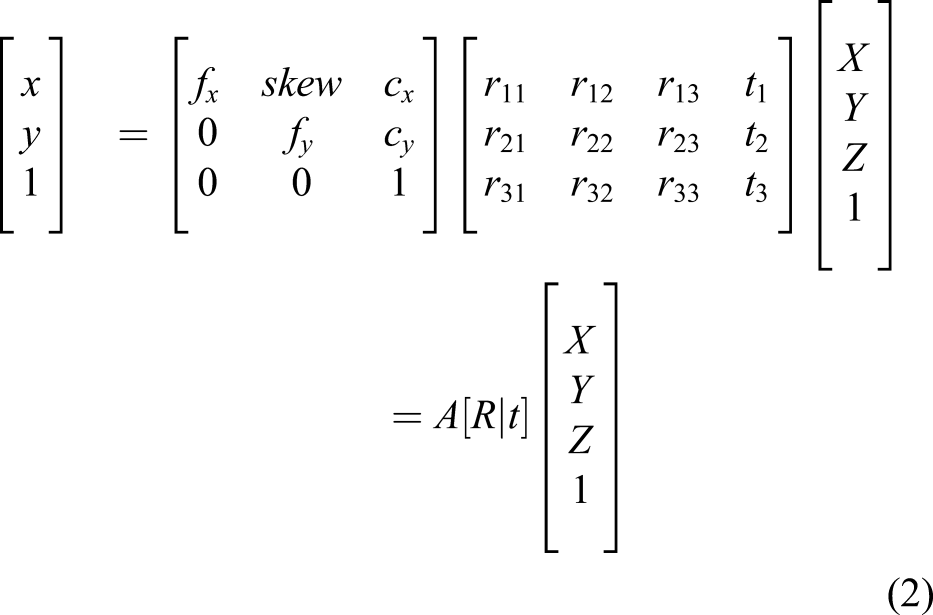
In this study, because a ZED stereo camera was used, we used the intrinsic and extrinsic parameters provided by the manufacturer. The focal length and center point of the camera were used in the calculation of the intrinsic parameters, and the extrinsic parameters were used to calculate the crack size for triangulation measurement.
Crack detection using homography matrix
The homography matrix is obtained through a scale invariant feature transformation (SIFT) algorithm with random sample consensus (RANSAC) (Lowe, 2004 43 ; Fischler and Bolles, 1981). 44 After taking pictures from two cameras, a SIFT algorithm is applied to the images, wherein several feature points are extracted from, and matching points are selected among them by comparing the discriminators of the SIFT features. Next, using RANSAC, the outliers are removed from the matching points, and an optimal homography matrix is obtained.
Using the homography matrix obtained in this fashion, the crack area is applied as shown in Figure 6. Figure 6(a) presents the left and right images obtained via stereo vision. The corrected image is made by applying the intrinsic parameters and radial distortion correction, as shown in Figure 6(b). Next, by applying the crack detection algorithm, only the crack area is predicted, as shown in Figure 6(c). Finally, the homography matrix obtained from the two crack images is applied to both the corrected and predicted images, and the left image is converted into the right image and overlapped. Then, the overlapped prediction image and the overlapped crack image appear as shown in Figure 6(d). The red region highlights the crack region obtained from stereo vision. Crack detection method using stereo vision.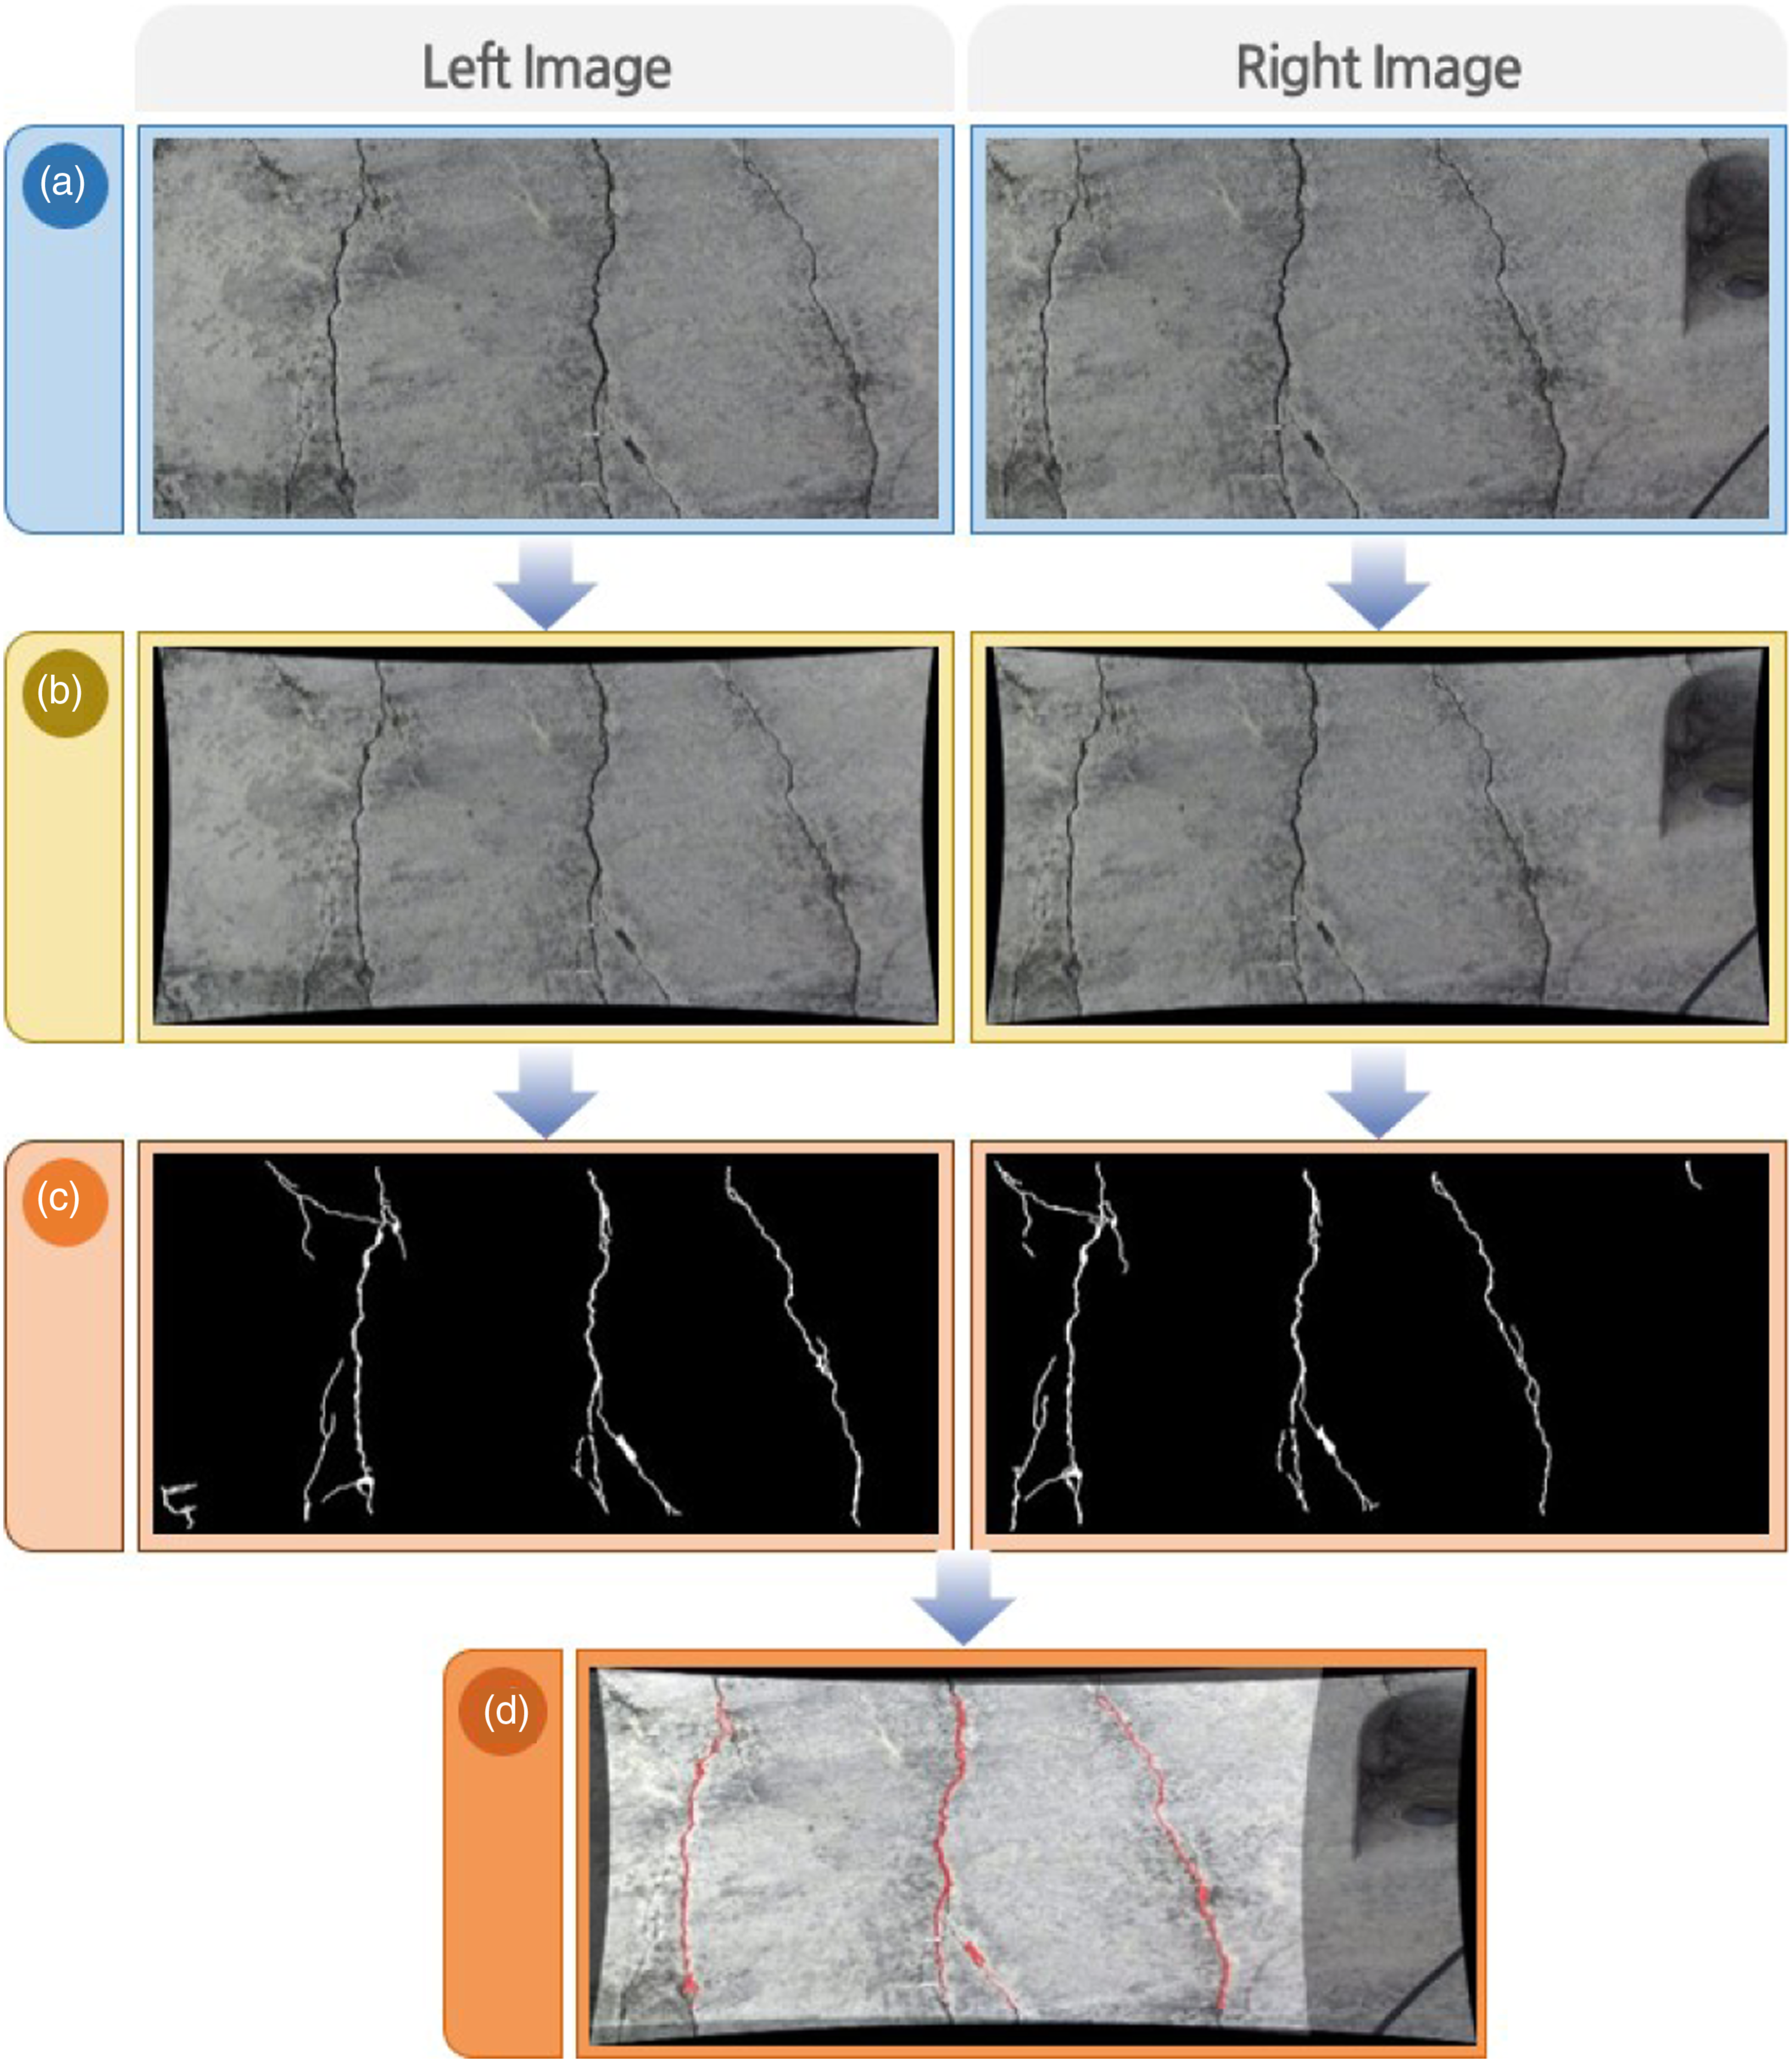
Triangular measurement with stereo vision
A stereo camera is a device that uses two cameras at the same time. It is assumed that the parameters for the two cameras are precisely calibrated. Therefore, the intrinsic parameter, A, and the extrinsic parameter, [R|t], are defined in advance. [R|t] is used to transform the coordinate system of O − x
L
y
L
z
L
into the coordinate system of O − x
R
y
R
z
R
. Under this condition, assuming that all 3D points (patch area, PA3D) within an arbitrary area are projected to the left and right images as shown in Figure 7, each area is denoted as PA
L
and PA
R
. These points are originally in the 3D space and exist in different coordinate systems as points captured by cameras from different angles. Therefore, assuming that all points in PA
L
and PA
R
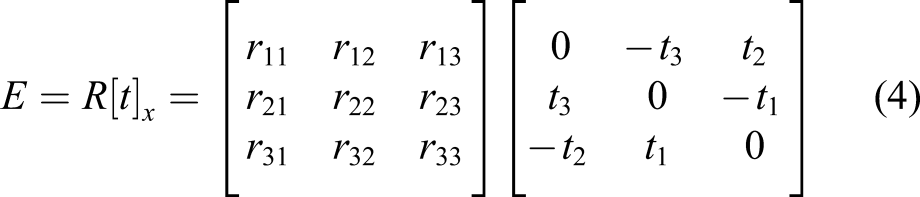
are on the normal plane, their relationship is defined as equation (3), and the E matrix is 3×3, which becomes the essential matrix. This matrix can be obtained with equation (4) through the camera extrinsic parameters, R and t. By using the E matrix thus obtained, the distance of the target object can be determined from the stereo camera images (Longuet-Higgins, 1981).
45
When the relationship between points in images is clearly defined wherein the 3D point is projected and the actual length of the baseline is known, the location of the 3D point can be determined using triangulation Stereo camera geometry.
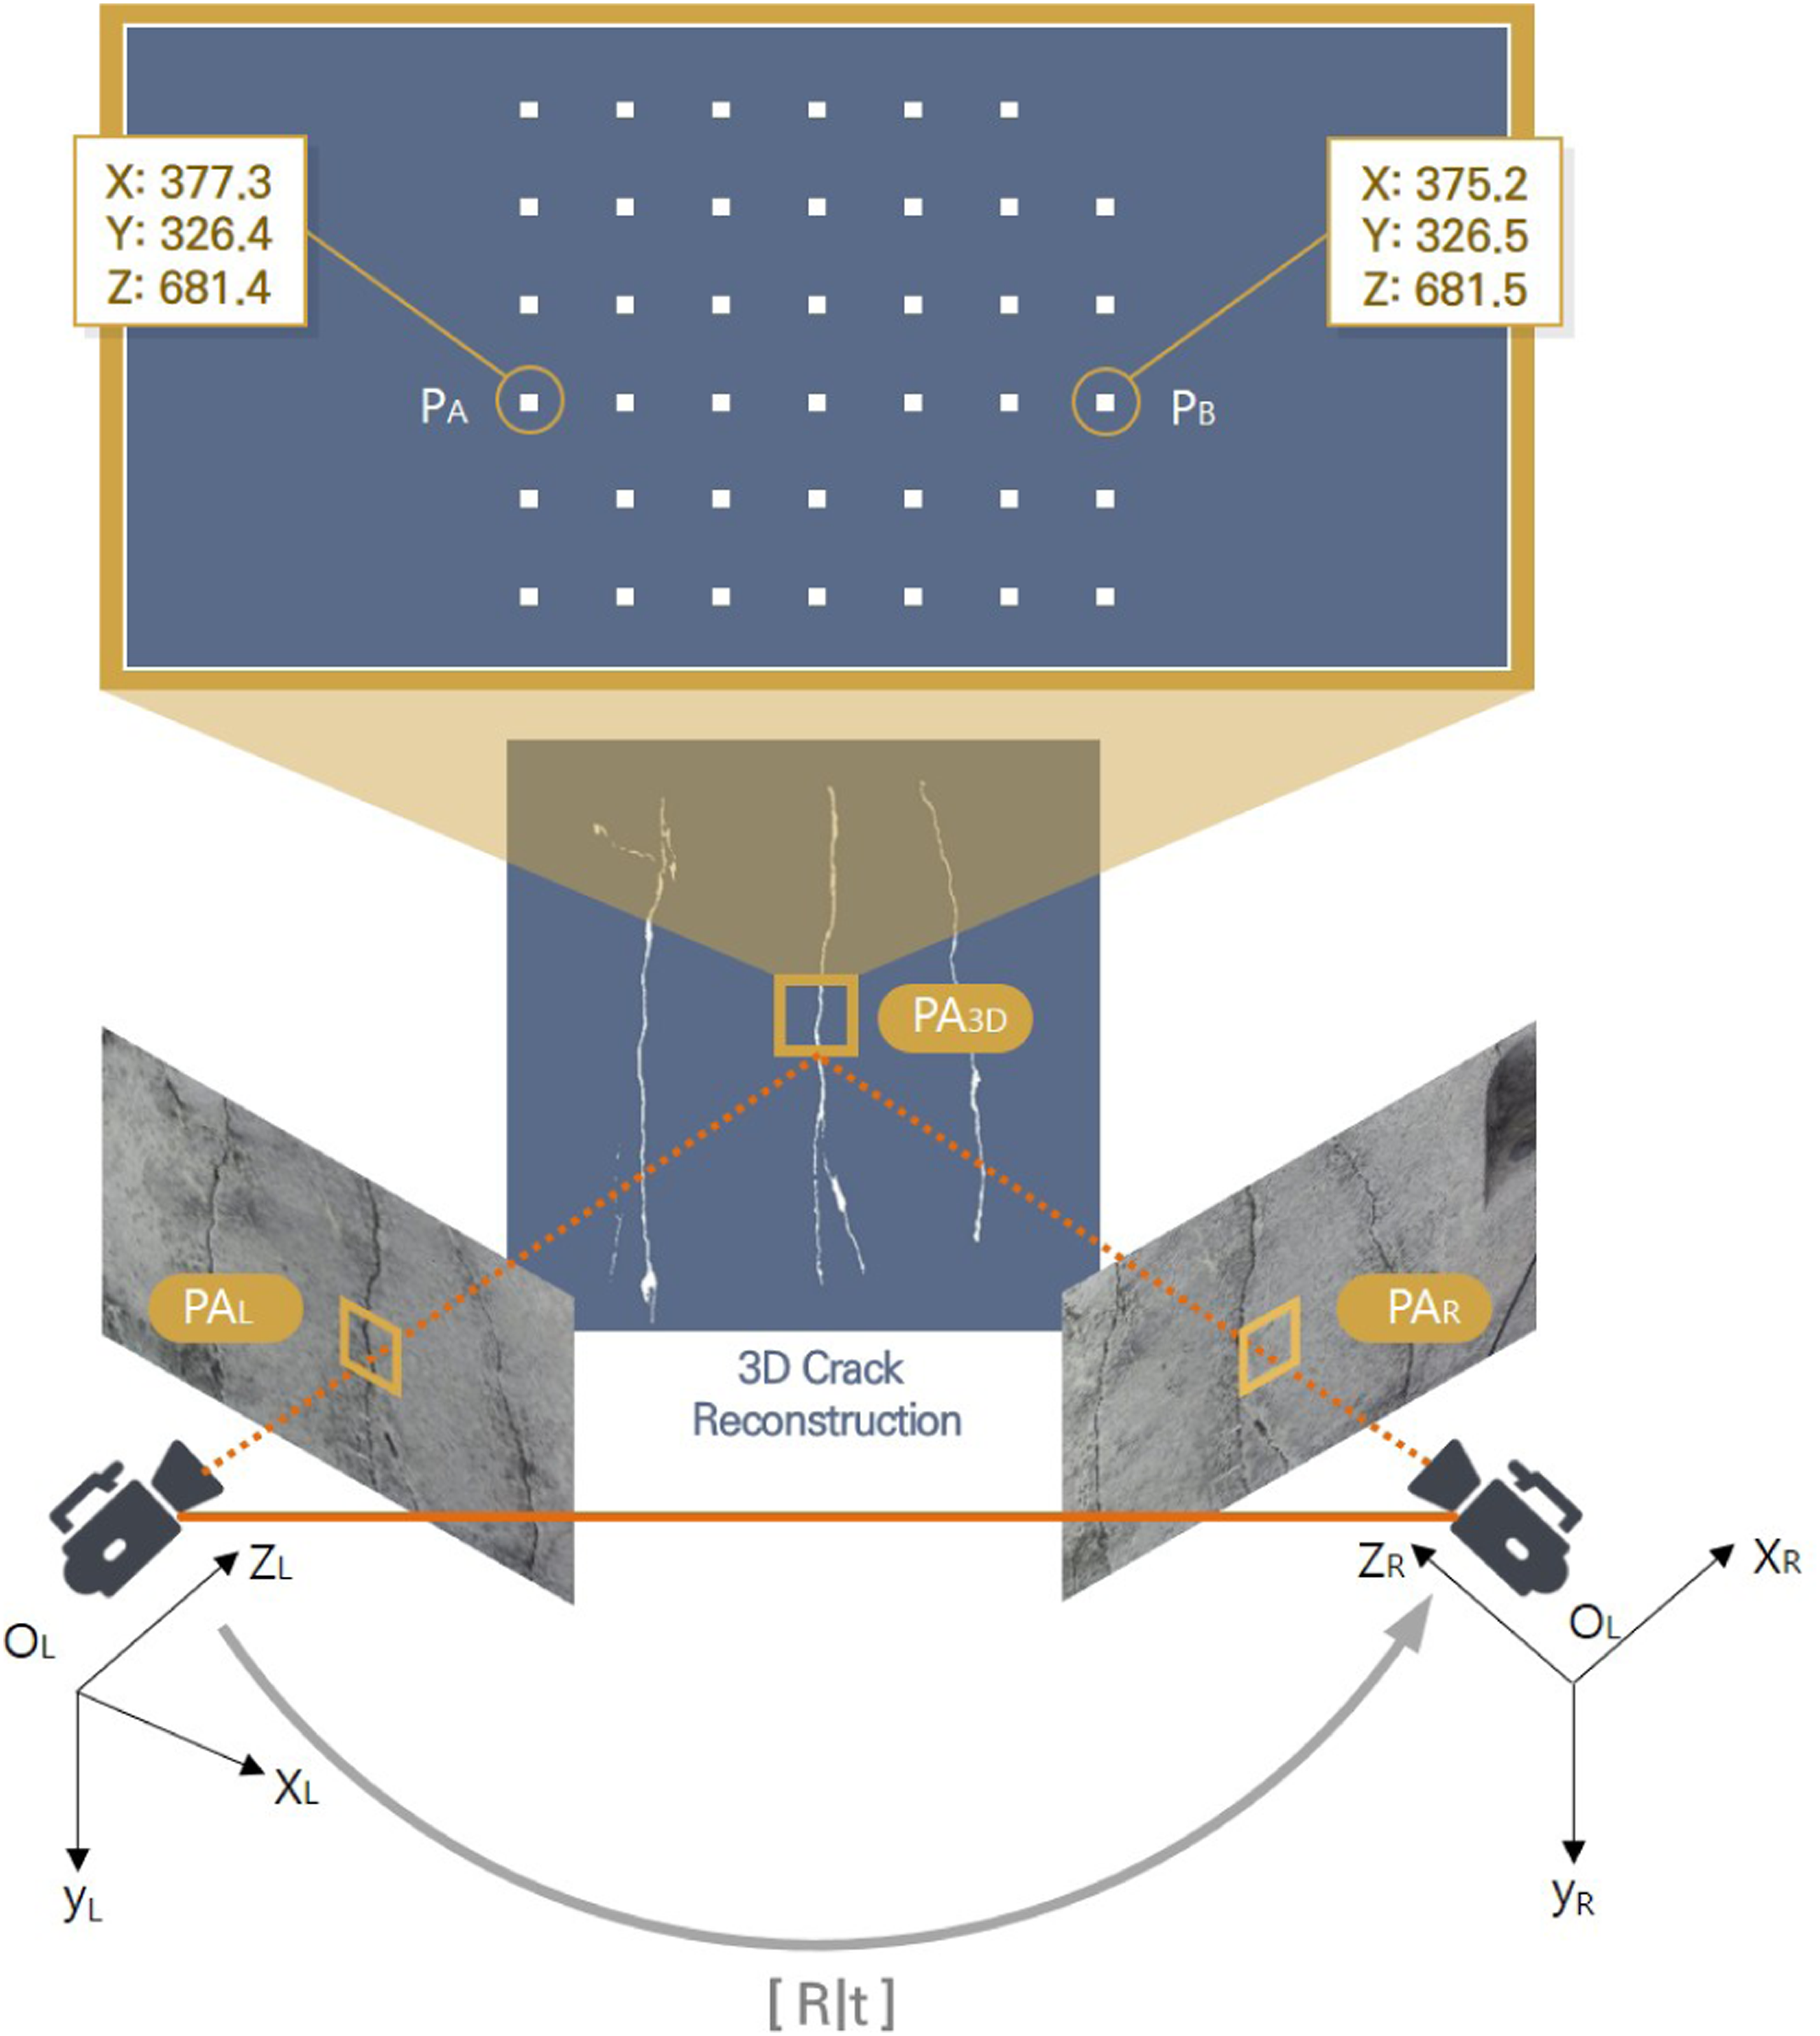
Using this principle, 3D information of cracks is obtained. All points in the PA L and PA R are expressed as 3D points, as are all points in the overlapped prediction image. Hence, the area recognized as a crack appears as a 3D point cloud after 3D crack restoration is completed. When the actual length of the baseline applies the point cloud, the distances among points represent the real distance. Therefore, the distance between the points is expressed in millimeters, and it can be confirmed that it has a thickness of several millimeters when selecting and measuring an arbitrary point. For example, if two arbitrary points are chosen as P A and P B in Figure 7, they are expressed in the form of 3D points. Then, it can be seen that the distance between two points is about 2.1 mm. As a result, it is possible to diagnose crack conditions more accurately by restoring their shapes to their actual sizes in 3D.
Experimental results
Experimental setup and method
Two major experiments were carried out. The first experiment compared crack detection performances, and the second experiment compared crack shape restoration. In the first experiment, we tried to understand the effects of the proposed method using O- and N-Images. When a model trained by the O-Images was applied to N-Images, the recognition performance decreased significantly. To improve upon this, we measured the degree of performance change by applying the proposed method using validation datasets from O- and N-Images. In the second experiment, we tried to understand the effects of the proposed method on the crack shape restoration performance. The shape of a 3D crack was restored using the stereo vision method on S-Images, and the effects of the proposed method were analyzed.
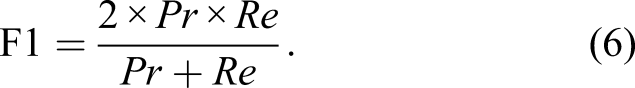
To measure the degree of improvement in crack detection performance, three experiments were performed. The first experiment set the segmentation network used in Shim et al. (2020) 26 as a baseline and compared the recognition performance to the new segmentation network. From this, we observed the change in recognition performance according to the change in the structure of the deep neural network. Supervised learning was performed by applying the labeled dataset to the two deep neural network models as the same training data. The recognition performance of the model was measured using the validation dataset of O- and N-Images.
The second experiment measured the effects of adversarial learning for improving the reduced recognition performance when a deep neural network model is trained in O-Images and applied to N-Images. Two types of unlabeled datasets were used. The adversarial learning method by Shim et al. (2020) 26 used an unlabeled dataset from O-Images. However, an unlabeled dataset from N-Images was used for our experiment. Training was performed by mixing two types of unlabeled datasets at various ratios. The first ratio was 0:100 with training using only 3000 crack images from N-Images, excluding crack images from O-Images. The second accomplished learning using 750 crack images from O-Images and 2250 from N-Images at a 25:75 ratio. Third, 1500 crack images from O-Images and 1500 from N-Images were used, and a 50:50 ratio was applied. The fourth was trained using 2250 crack images from O-Images and 750 from N-Images at a ratio of 75:25. Finally, when training using only crack images from O-Images, the ratio went to 100:0. Therefore, through five data mixing ratio experiments, we demonstrated the optimal ratio of applying data under different environmental conditions for semi-supervised learning.
The third experiment observed the effects of the ensemble technique in the discriminator network used to increase recognition performance. Adversarial learning was performed using three discriminator networks. Because each discriminator network had a different structure and characteristics, the calculated results also differed. Even in this situation, the ensemble method aims to obtain the most accurate value by averaging several result values. However, when these ensemble methods are applied to the discriminator networks, the recognition performance is affected, owing to the imbalance among them. To improve upon this, we observed the change in recognition performance by applying an optimal balanced weight.
An experiment to evaluate the crack shape restoration performance compared the shape of the crack restored through stereo vision. For this experiment, overlapped crack images and overlapped label images were used as shown in Figure 8: one in the validation dataset of S-Images. By comparing the overlapped label image obtained in this fashion with the overlapped prediction image obtained from the segmentation network, the crack shape restoration performance was evaluated quantitatively. Additionally, the effect of the proposed method on crack restoration performance was analyzed using the restored results. Stereo vision data: (a) overlapped crack image; and (b) 3D reconstructed label shape.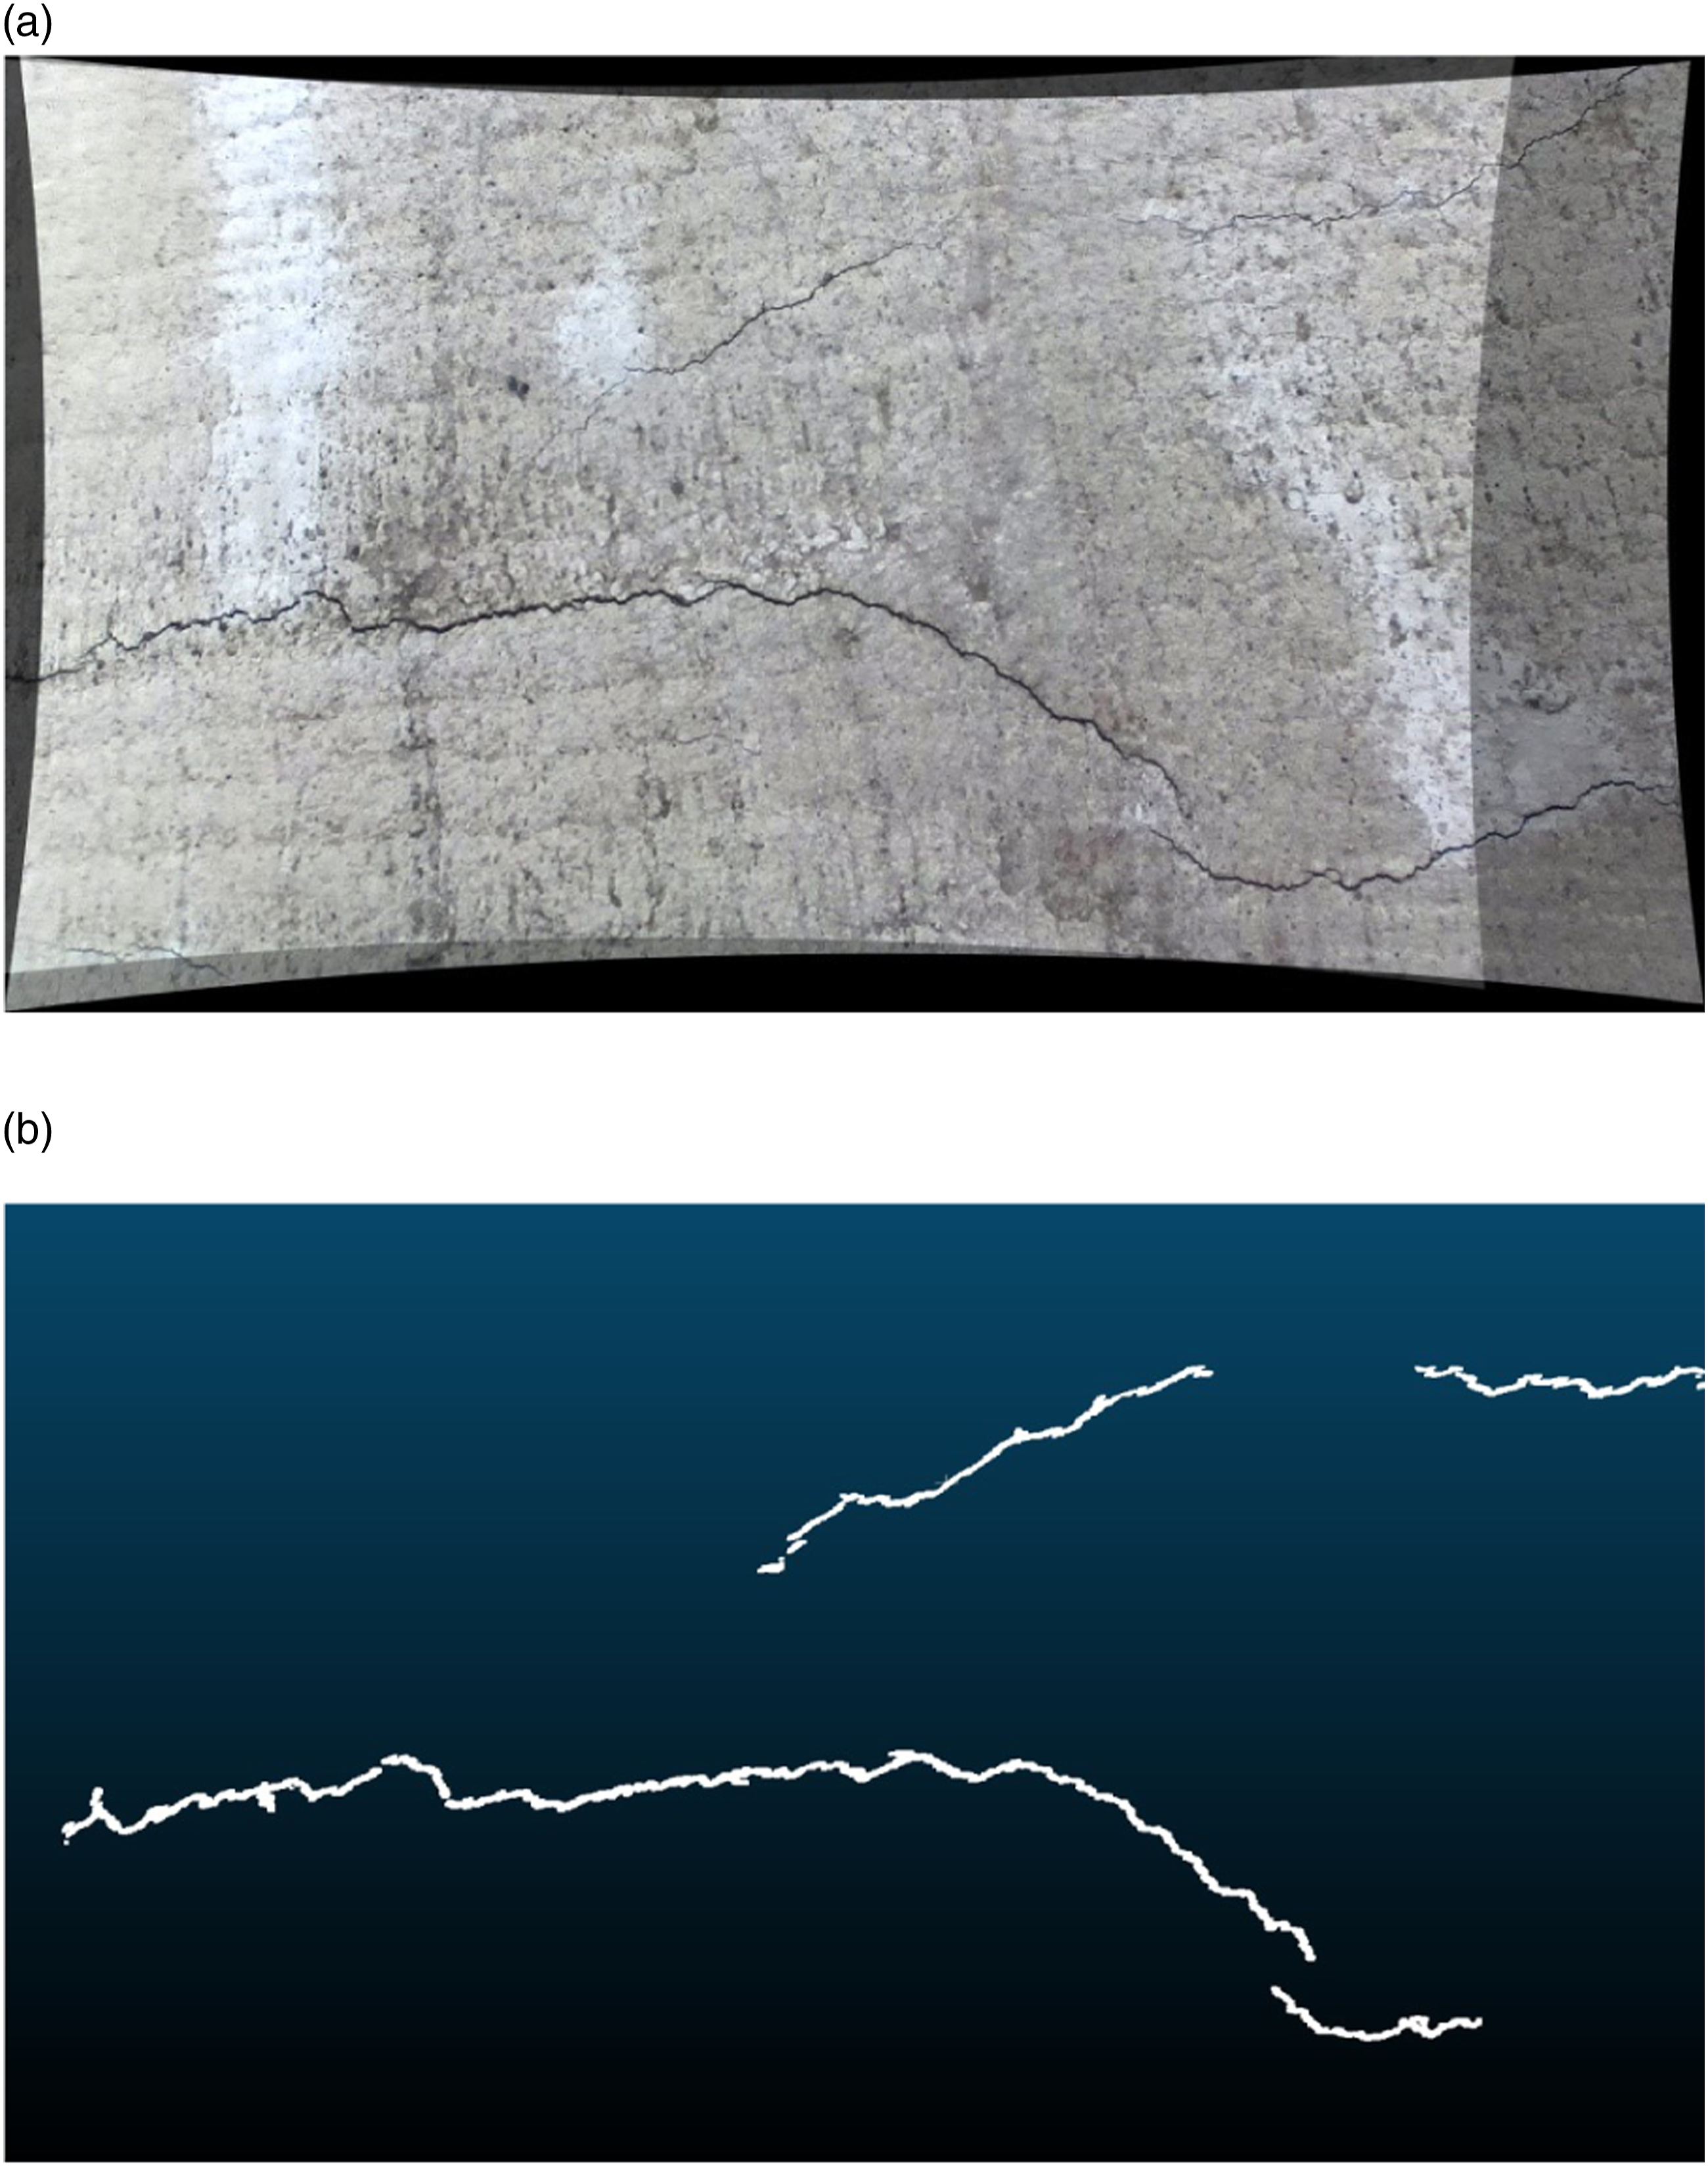
For training, all optimization functions used ADAM. The parameters used here included the learning rate, beta-1, and beta-2, and 0.001, 0.9, and 0.999 were used, respectively. The batch size was set to four. For supervised learning only, the total number of iterations was set to 500, and for adversarial learning, the total number of iterations was set to 50,000. The hardware used to develop the deep neural network included an Intel Xeon 6226R 2.9-GHz, 320-GB RAM, and an NVIDIA Quadro 8000. Pytorch was used to develop deep-learning algorithms on the Ubuntu 18.04 operating system.
Evaluation index
Two evaluation indicators were used to compare crack detection and 3D reconstruction performance. These evaluation indicators are mean intersection-over-union (m-IoU) and F1 score (F1). The m-IoU is an index that measures the degree of overlap between the ground truth area and the prediction area. Next, F1 represents the harmonic average of precision (Pr) and recall (Re). They are defined by equations (5) and (6), respectively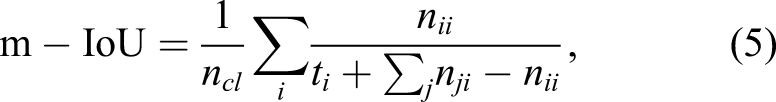
In equation (5), n ij represents the number of all pixels for class i predicted to belong to class j. Moreover, n cl denotes the number of classes, and t i denotes the number of all pixels belonging to class i.
Comparison
Results of crack detection for supervised learning.
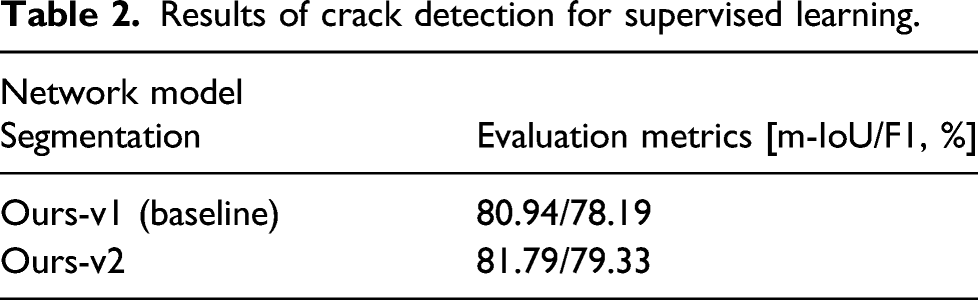
Results of crack detection for adversarial learning.
In-depth analysis was performed to clarify the reason for the highest performance when the mixing ratio of the training data was 75:25. The model obtained through the combination of the segmentation network of Ours-v2 and the ensemble discriminator network was applied to the validation datasets of O- and N-Images, respectively. Results are shown in the “Validation” row in Table 3. The experimental results using O-Images for validation show that recognition performance is the highest at a ratio of 75:25. In contrast, in the experiment using N-Images, recognition performance was the highest at a ratio of 50:50. However, the performance changing rates when the mixing ratios of N-Images are 25:75 and 75:25 show that the maximum performance can be achieved between 50:50 and 75:25. Through this, it can be seen that both O- and N-Images for validation have similar performance tendencies. Based on these facts, the first conclusion is that when the proportion of O-Images in the training data is larger than that of N-Images, the overall recognition performance increases. The second conclusion is that mixing O- and N-Images helps in increasing the diversity of the training data. If training is performed using only N-Images, the similarity between the labeled and unlabeled data decreases and complexity increases. Conversely, if only O-Image is used for training, the similarity in the training data increases and diversity decreases. Therefore, when an appropriate ratio between O- and N-Images is applied, the diversity of the training data can be secured, and recognition performance can be improved.
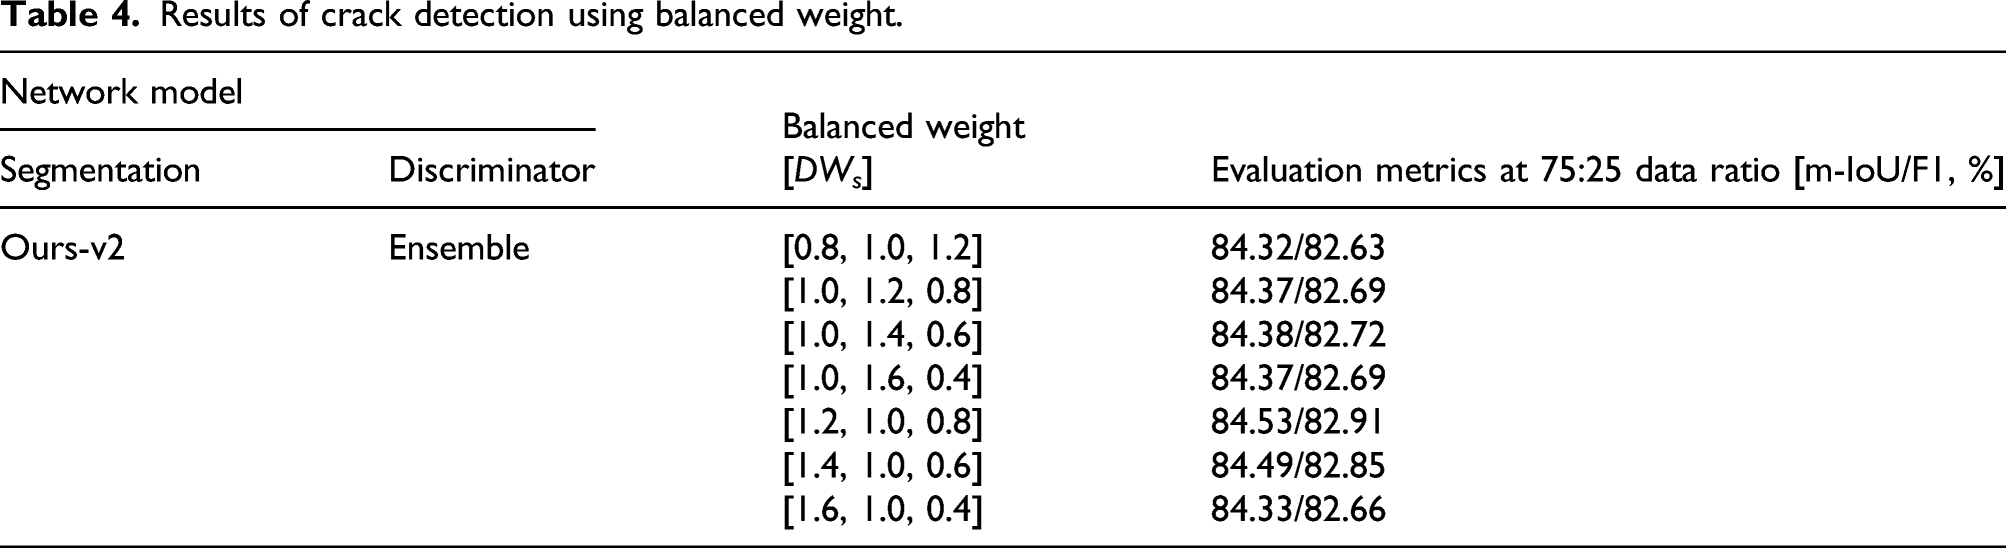
Results of crack detection using balanced weight.
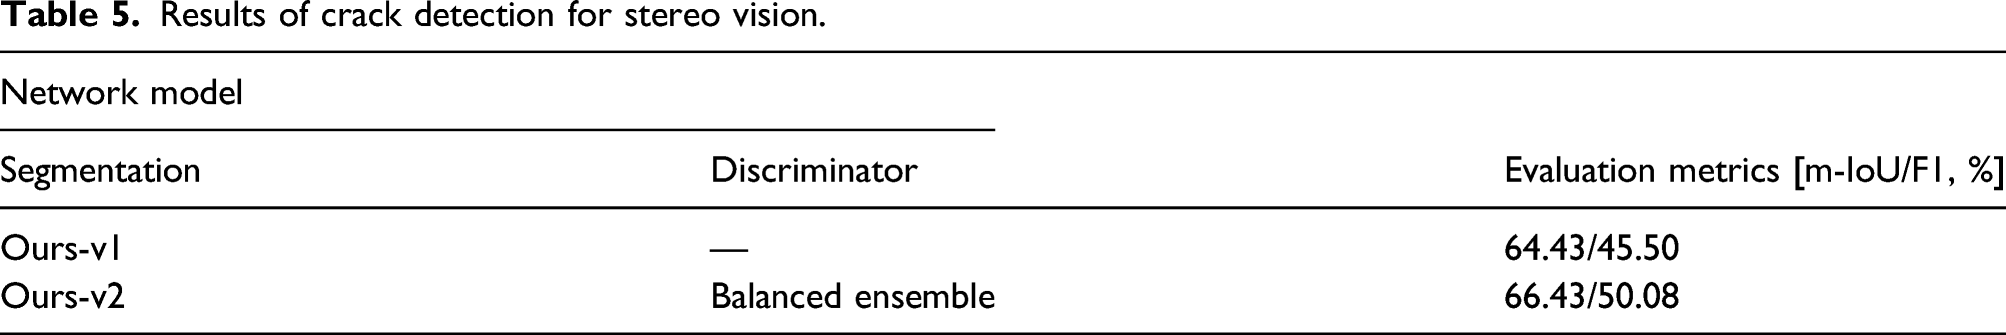
Results of crack detection for stereo vision.
3D crack reconstruction results
Figure 9 shows the results of restoring the shape of cracks using stereo vision. Figure 9(a) shows the overlapped crack image of the left and right images taken with a stereo camera, and (b) shows the restored shape by applying the triangulation technique to the overlapped label image indicating the crack area. Figure 9(c) and (d) show the results of shape restoration by applying triangulation to the overlapped prediction images detected by Ours-v1 and Ours-v2 with the balanced ensemble discriminator network, respectively. In Figure 9 (b), (c), and (d), the area inside the yellow bounding box is enlarged and displayed to accurately compare the restored results. First, in the first row, it may be observed that the shape of (d) is more similar to the shape of (b) compared with the shape of (c). Next, looking at the shape of (c) in the second and third rows, a discontinued spot appears in the restored shape despite the continuous crack. In contrast, it may be observed that the shape of (d) appears as a continuous crack similar to the shape of (b) was more accurately restored. In the fourth row, the shape of (d) detected severely damaged area precisely compared with the shape of (b). However, in the shape of (c), the detected shape is smaller than that of (d). Finally, in the fifth row, the shape of (c) includes more non-crack area than that of (d). Hence, the false positives were small. As a result, when the performance of Ours-v2 with the balanced ensemble discriminator network was compared with that of Ours-v1, it was concluded that the crack shape reconstruction accuracy of Ours-v2 with the balanced ensemble discriminator network was high, and it was robust to noise. Results of crack reconstruction: (a) overlapped crack image; (b) 3D reconstructed label shape; (C) 3D reconstructed prediction shape using Ours-v1; and (d) 3D reconstructed prediction shape using Ours-v2 with balanced ensemble discriminator network.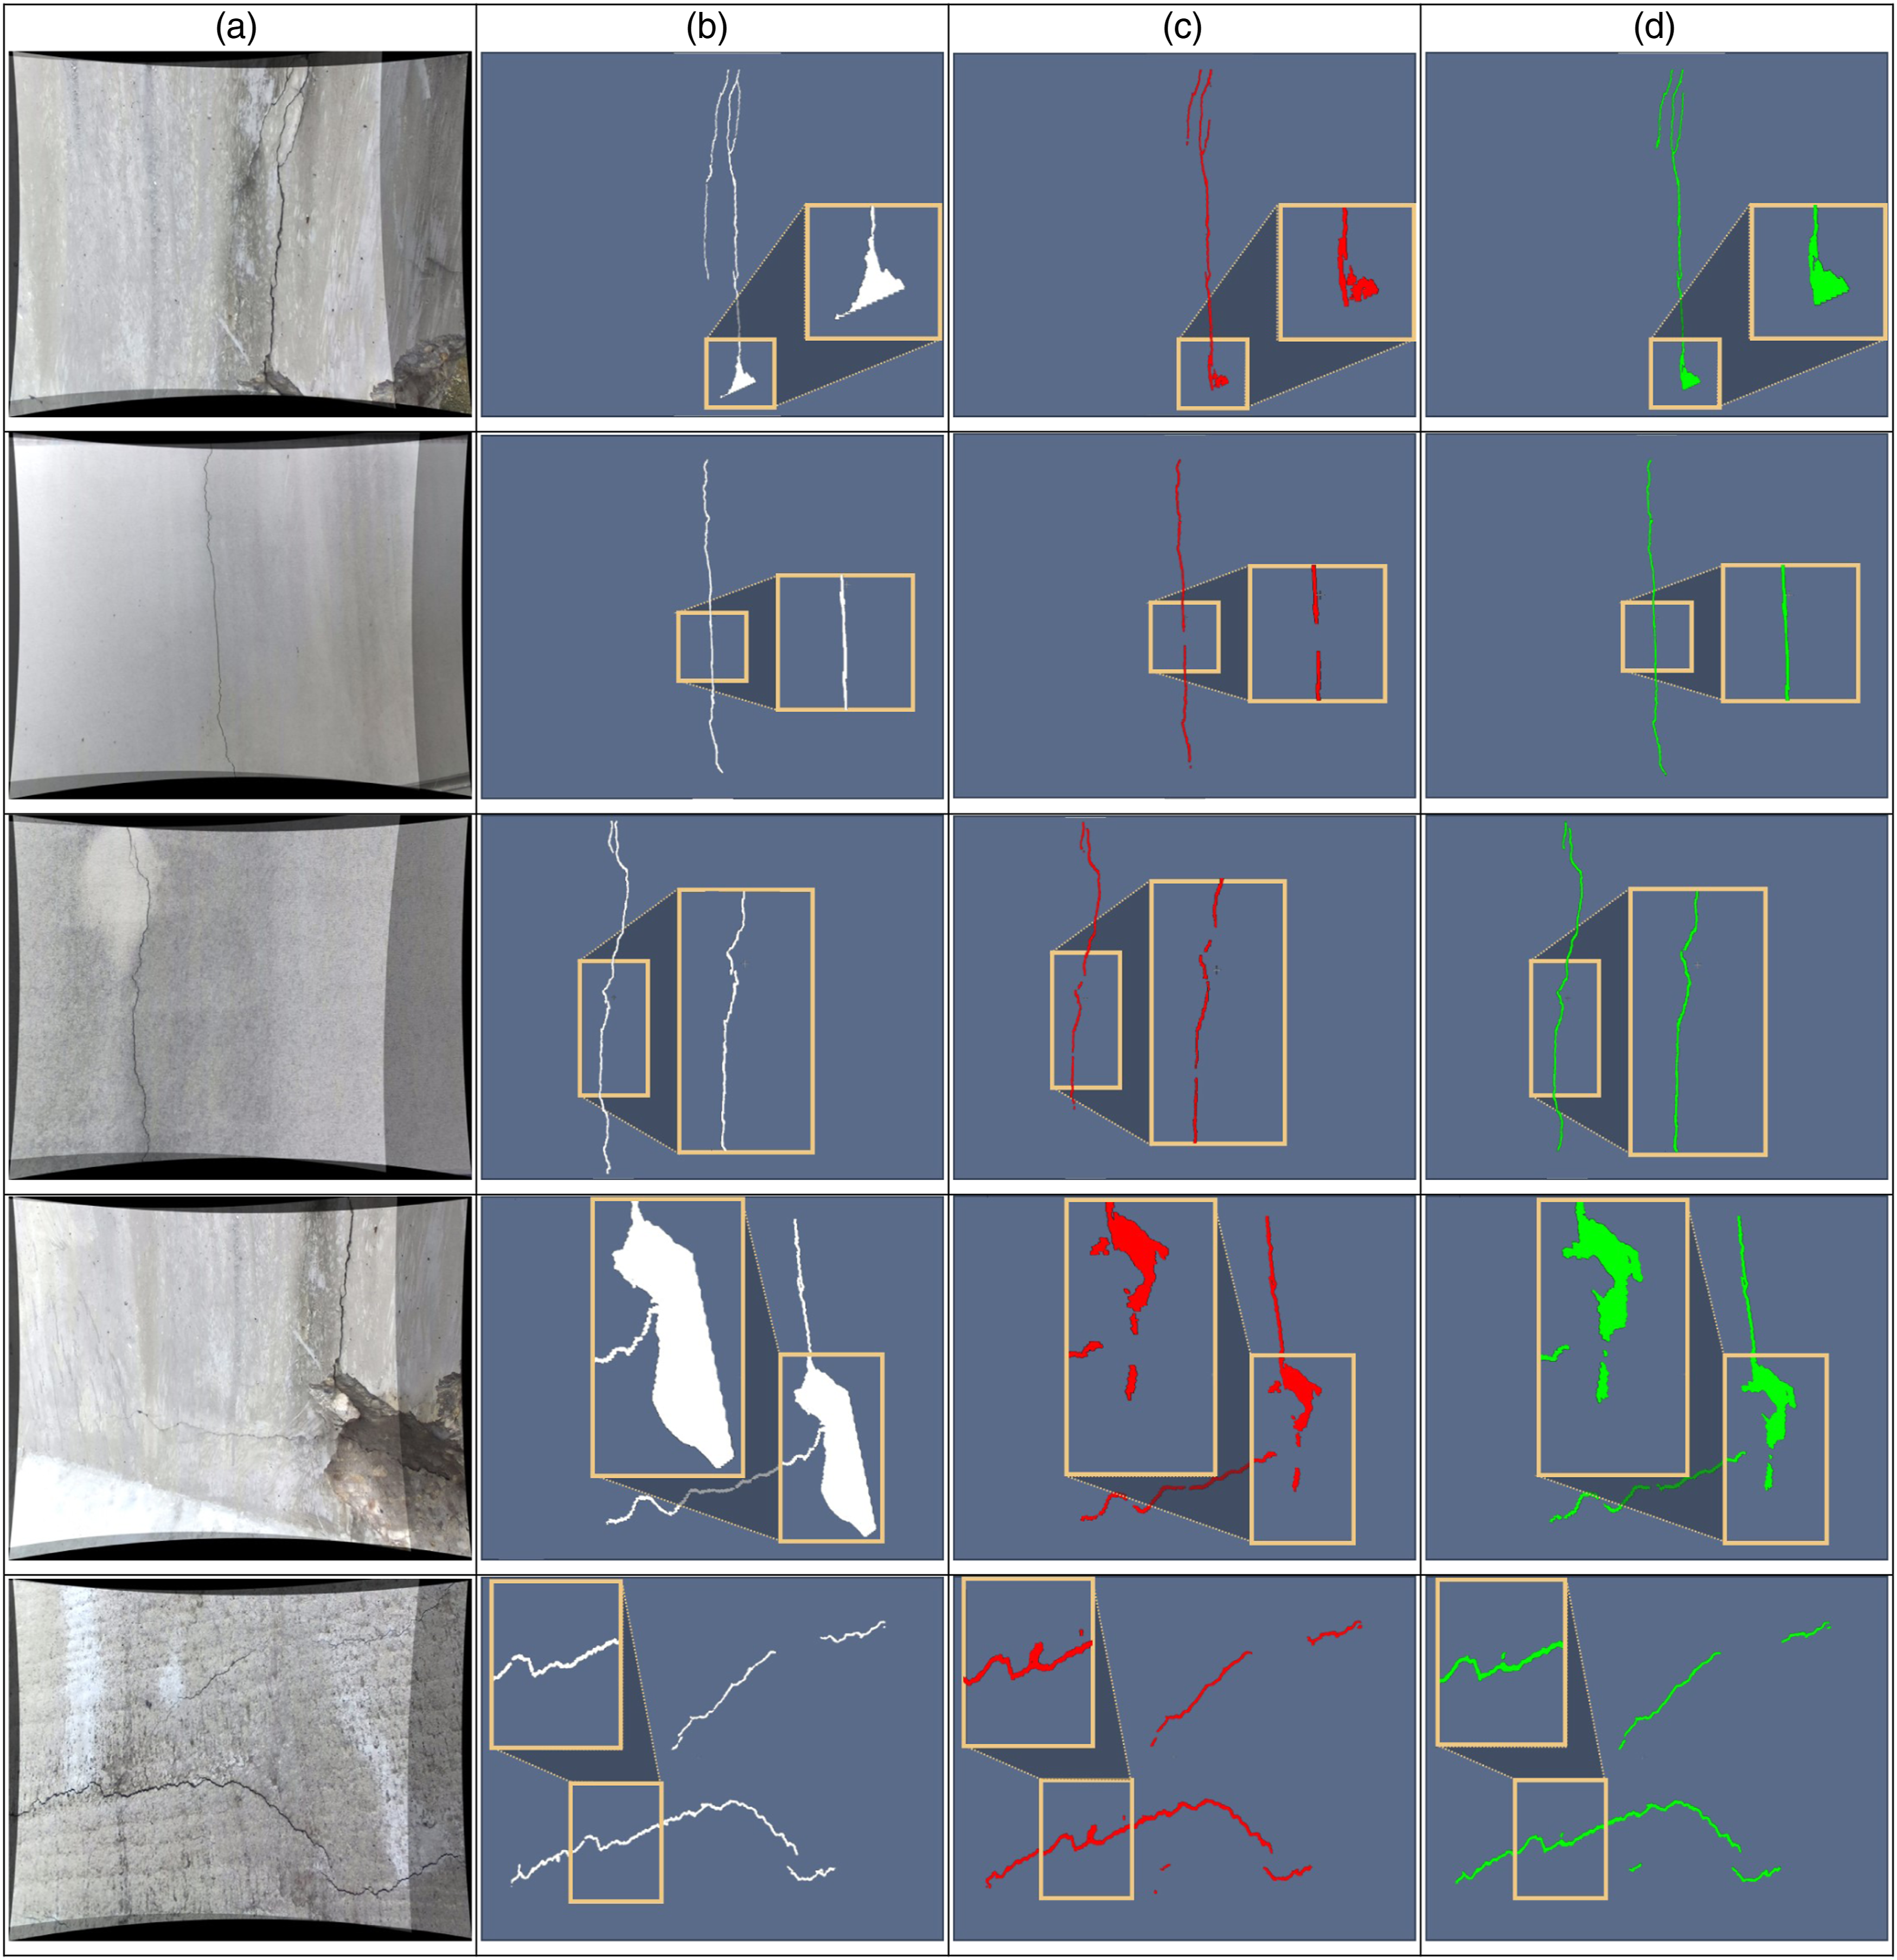
Discussion
Ours-v2 was proposed in this paper to develop a segmentation network. Compared with Ours-v1, not only was the recognition performance improved, but the computational complexity was also reduced because of Ours-v2 (Shim et al., 2020). 26 To evaluate the complexity, multiply-and-accumulate (MAC) and model parameter indicators were used (Sze et al., (2017). 47 These indicators measure the computational complexity of a deep-learning model; thus, the simpler the model, the smaller the indicator values. As a result of comparing the two models, Ours-v1 had 12.19-million model parameters and 10.73-billion MACs, and Ours-v2 had 11.83-million model parameter and 5.82-billion MACs. Therefore, model parameter decreased by 2.95%, and MACs decreased by 45.76%. In contrast, when only supervised learning was considered, the recognition performance of Ours-v2 was found to be higher than that of Ours-v1. Hence, we conclude that Ours-v2 achieved higher recognition despite having lower computational complexity. A higher number of model parameters and MACs indicates extensive computation, which requires considerable computational resources, thus increasing the cost of computational equipment. Therefore, it is important to reduce the number of model parameters and MACs. However, as the number decreases, the recognition performance generally decreases, which implies a trade-off relationship. Therefore, the proposed Ours-v2 exhibited more efficiency than other deep neural networks.
A single stereo image was used instead of several to restore the crack shape. Generally, the algorithm for reconstructing a 3D shape through stereo vision increases the accuracy of the reconstruction when more images are used. The same applies to the 3D restoration accuracy of a crack shape. To accurately restore its shape, it is necessary to take many images from various angles. Prior to that, the accuracy for crack shape reconstructed by single stereo image must be considered because the more accurate the crack reconstruction in a single stereo image, the more accurate the result with multiple stereo images. Hence, the accuracy of the crack shape that can be restored by single stereo image was analyzed, concluding that the proposed methods enhanced the 3D reconstruction accuracy of crack shapes applying single stereo images.
In this study, various techniques were considered for improving the recognition performance for crack images obtained under new environmental conditions. Among them, a method was selected to determine the optimal parameters. Specifically, this method considers the mixing ratio of the original and new crack data and the balanced weight among the ensemble discriminator neural networks. These parameters can be considered as a type of hyperparameter determined when developing a deep-learning model. Typically, a large number of new label images should be secured when applying a detection algorithm to cracks in new environmental conditions using supervised learning. However, if the method proposed in this study is applied, the mixing ratio and the balanced weight can be determined with only a small number of label images, and a detection algorithm can be realized. Therefore, it is possible to save the time required for acquiring a large number of label images; consequently, the detection algorithm can be efficiently developed.
The method of 3D measurement using conventional stereo vision comprises 4 steps—crack image capturing, 3D reconstruction with crack images, application of the detection algorithm, and generation of 3D point cloud (Guan et al., 2021 48 ; Sarker et al., 2017). 49 This method extracts the features from multiple inputs and restores the 3D shapes based on them. Next, the 3D shape of the entire input image is restored and the damaged area is detected by applying a deep-learning algorithm. However, in this study, the detection algorithm was first applied, and the 3D shape was restored based on the detection result. In other words, first, a deep-learning detection algorithm is simultaneously applied to two images captured using stereo vision. Next, the shape is restored in 3D by applying the triangulation technique from the result image detected as a crack area. This method has two advantages. First, detection is possible with higher accuracy because only the area detected as a crack in two input images at the same time is restored to a three-dimensional shape. Second, because only the homography matrix and the triangulation technique are applied, the operation is relatively simple. For example, Guan et al. (2021) 48 used a commercial software called PhotoScan, and Sarker et al. (2017) 49 used an additional library provided by ZED. However, the proposed method will be easy to apply to the embedded systems in the future because only the crack area is restored in 3D using only the functions provided by OpenCV library.
To measure the crack three-dimensionally and compare its performance, three types of accuracies should be considered—detection, measurement, and targeting. Detection accuracy is a pixel unit indicator of how accurately the crack area is segmented in the image. Measurement accuracy is an SI unit indicator of how accurately the actual size is measured. Third, targeting accuracy is an indicator for the degree of error that might occur in the method and the procedure when compared with other measurement sensors. The 3D crack reconstruction proposed in this study mainly focused on detection accuracy. We developed a technology to improve performance by applying various techniques to deep-learning algorithms. Next, for measurement, the working distance in this study was set to approximately 50 cm, and photography was performed at FHD resolution. In addition, the calibration parameters provided by the ZED manufacturer were used as received. The analysis of the measurement data showed that the average distance between the points was 0.3 mm. This distance is the resolution of the method proposed in this study, and to reduce it, the above-mentioned three types of accuracies need to be improved. Improving measurement accuracy involves cost; for example, increasing the resolution using an expensive camera and lens. Unlike crack rulers and Vernier calipers, targeting accuracy can be improved using a computer vision triangulation measurement technique, such as the proposed method. Finally, the measurement and targeting accuracies are dependent on cost and methodology. Therefore, detection accuracy contributes the most to the improvement of the performance of 3D crack measurement, and further research is needed for its continuous improvement.
Indices of m-IoU and F1 were used to compare crack shape restoration performance. Specifically, a stereo-based triangulation technique was applied to restore the 3D crack shape. Stereo vision is a triangulation that was used to measure the size of the target object without mathematical errors. It also can precisely measure the size of a crack. However, two assumptions are made. First, the camera calibration parameters must be accurate. Second, the detection accuracy of the measurement target should be 100%. The camera calibration parameters were very accurate in this study because they were provided by the manufacturer. Additionally, the same intrinsic and extrinsic parameters were applied to prediction and label images to restore the 3D shape. Therefore, the camera calibration parameters had little effect on the accuracy of the crack shape restoration. In contrast, the overlapped prediction image that detects the crack area greatly affects 3D shape restoration performance. If the detected crack area is incorrect, the crack shape cannot be restored, which leads to inaccurate measurement. Conversely, if the overlapped prediction image is the same as the overlapped label image, the 3D shape of the crack is the same, and accurate crack measurement is possible. For this reason, the m-IoU and F1 values of the overlapped label image and the overlapped prediction image were compared.
Conclusion
Concrete structures deteriorate with age. As a result, the function and performance of existing structures degrade. If left unattended, accidents may occur. Therefore, continuous attention and maintenance are necessary, which requires a technology capable of accurately diagnosing the current state of a structure. Recently, with the advent of deep-learning and computer vision, sensor technologies for detecting cracks in concrete has been developed. However, deep-learning crack detection has involved a limitation in that the detection performance is significantly reduced when encountering cracks occurring in new environments. In addition, because image processing technology derives detection results in units of pixels, it is impossible to determine the physical size of cracks in these cases. To improve upon these issues, a new segmentation network structure has been proposed. Second, an adversarial learning method using the optimal data mixing ratio and ensemble method has been presented to improve crack detection performance under new environmental conditions. Third, a method for restoring the 3D crack shape using stereo vision for non-contact crack measurement was demonstrated. As a result, we developed a crack detection algorithm with an m-IoU of 84.45% and an F1 score of 82.81%. Additionally, when a crack generated in a new environment was photographed using an FHD camera, a detection algorithm having a 71.23% m-IoU and a 59.91% F1 and another capable of restoring the shape of the crack in 3D were secured. For accurate crack measurement, their shapes must be restored to real scale. For this purpose, the shape restoration performance of cracks through a single stereo image was analyzed. It was concluded that the performance of the crack detection algorithm plays an important role in accurate crack measurement.
In this study, we focused on solving the problem of poor recognition performance when the crack detection deep-learning algorithm learned from the existing data encounters crack images with new environmental conditions. However, the images of the cracks encountered in the real world include inspection handwriting, structural edges, and other objects. In addition, depending on the weather and rough surface conditions, various crack images may be obtained as input and even blurring may appear. Considering this, research that can solve this issue by securing data of greater variety is required in the near future.
Using the technology developed through this study, furthermore, it is expected that future development with robots will become possible. Such a capability may be used to augment facility maintenance with the use of automated equipment installed in unmanned moving objects and robot arms. In particular, when used as an end-effector of a robot arm, cracks occurring in the lining inside a tunnel can be detected and can be extracted into 3D shapes; their physical sizes can also be calculated, which will play an important role in accurate maintenance. Moreover, several stereo images of the damage to the tunnel surface can be obtained via photography using a small vehicle capable of autonomous driving. If the technology from Structure from Motion 50 is applied to these images, the state of the surface on the inside of the entire tunnel can be restored in three dimensions. In addition, by extracting only the damaged area in a simple manner, the tunnel lining condition can be accurately checked and managed. Additionally, devices can be developed that will measure cracks while being carried by an operator using fused embedded system. Until now, workers have measured the size of cracks in structures using crack monitors or gauges and a microscope. However, as this technology can replace conventional equipment, its utilization is expected to be higher.
Footnotes
Funding
The author(s) disclosed receipt of the following financial support for the research, authorship, and/or publication of this article: This work was supported by the National Research Foundation of Korea funded by the Ministry of Science and ICT (MSIT) [grant number 2017R1A5A1014883]