
Abstract
As structural systems approach their end of service life, integrity assessment and condition monitoring during late life becomes necessary in order to identify damage due to age-related issues such as corrosion and fatigue and hence prevent failure. In this paper, a novel method of level 3 damage identification (i.e. detection, localisation and quantification) from local vibration mode pair (LVMP) frequencies is introduced. Detection is achieved by observation of LVMP frequencies within any of the vibration modes investigated while the location of the damage is predicted based on the ranking order of the LVMP frequency ratios and the damage is quantified in terms of material volume loss from pre-established quantification relations. The proposed method which is baseline-free (in the sense that it does not require vibration-based assessment or modal data from the undamaged state of the pipe) and solely frequency-dependent was found to be more than 90% accurate in detecting, locating and quantifying damage through a numerical verification study. It was also successfully assessed using experimental modal data obtained from laboratory tests performed on an aluminium pipe with artificially inflicted corrosion-like damage underscoring a novel concept in vibration-based damage identification for pipes.
Keywords
Introduction
Damage adversely alters the performance of a structural system
1
and if undetected could lead to failure with substantial repercussions; thus, the importance of early damage identification cannot be over-emphasised. Since the early
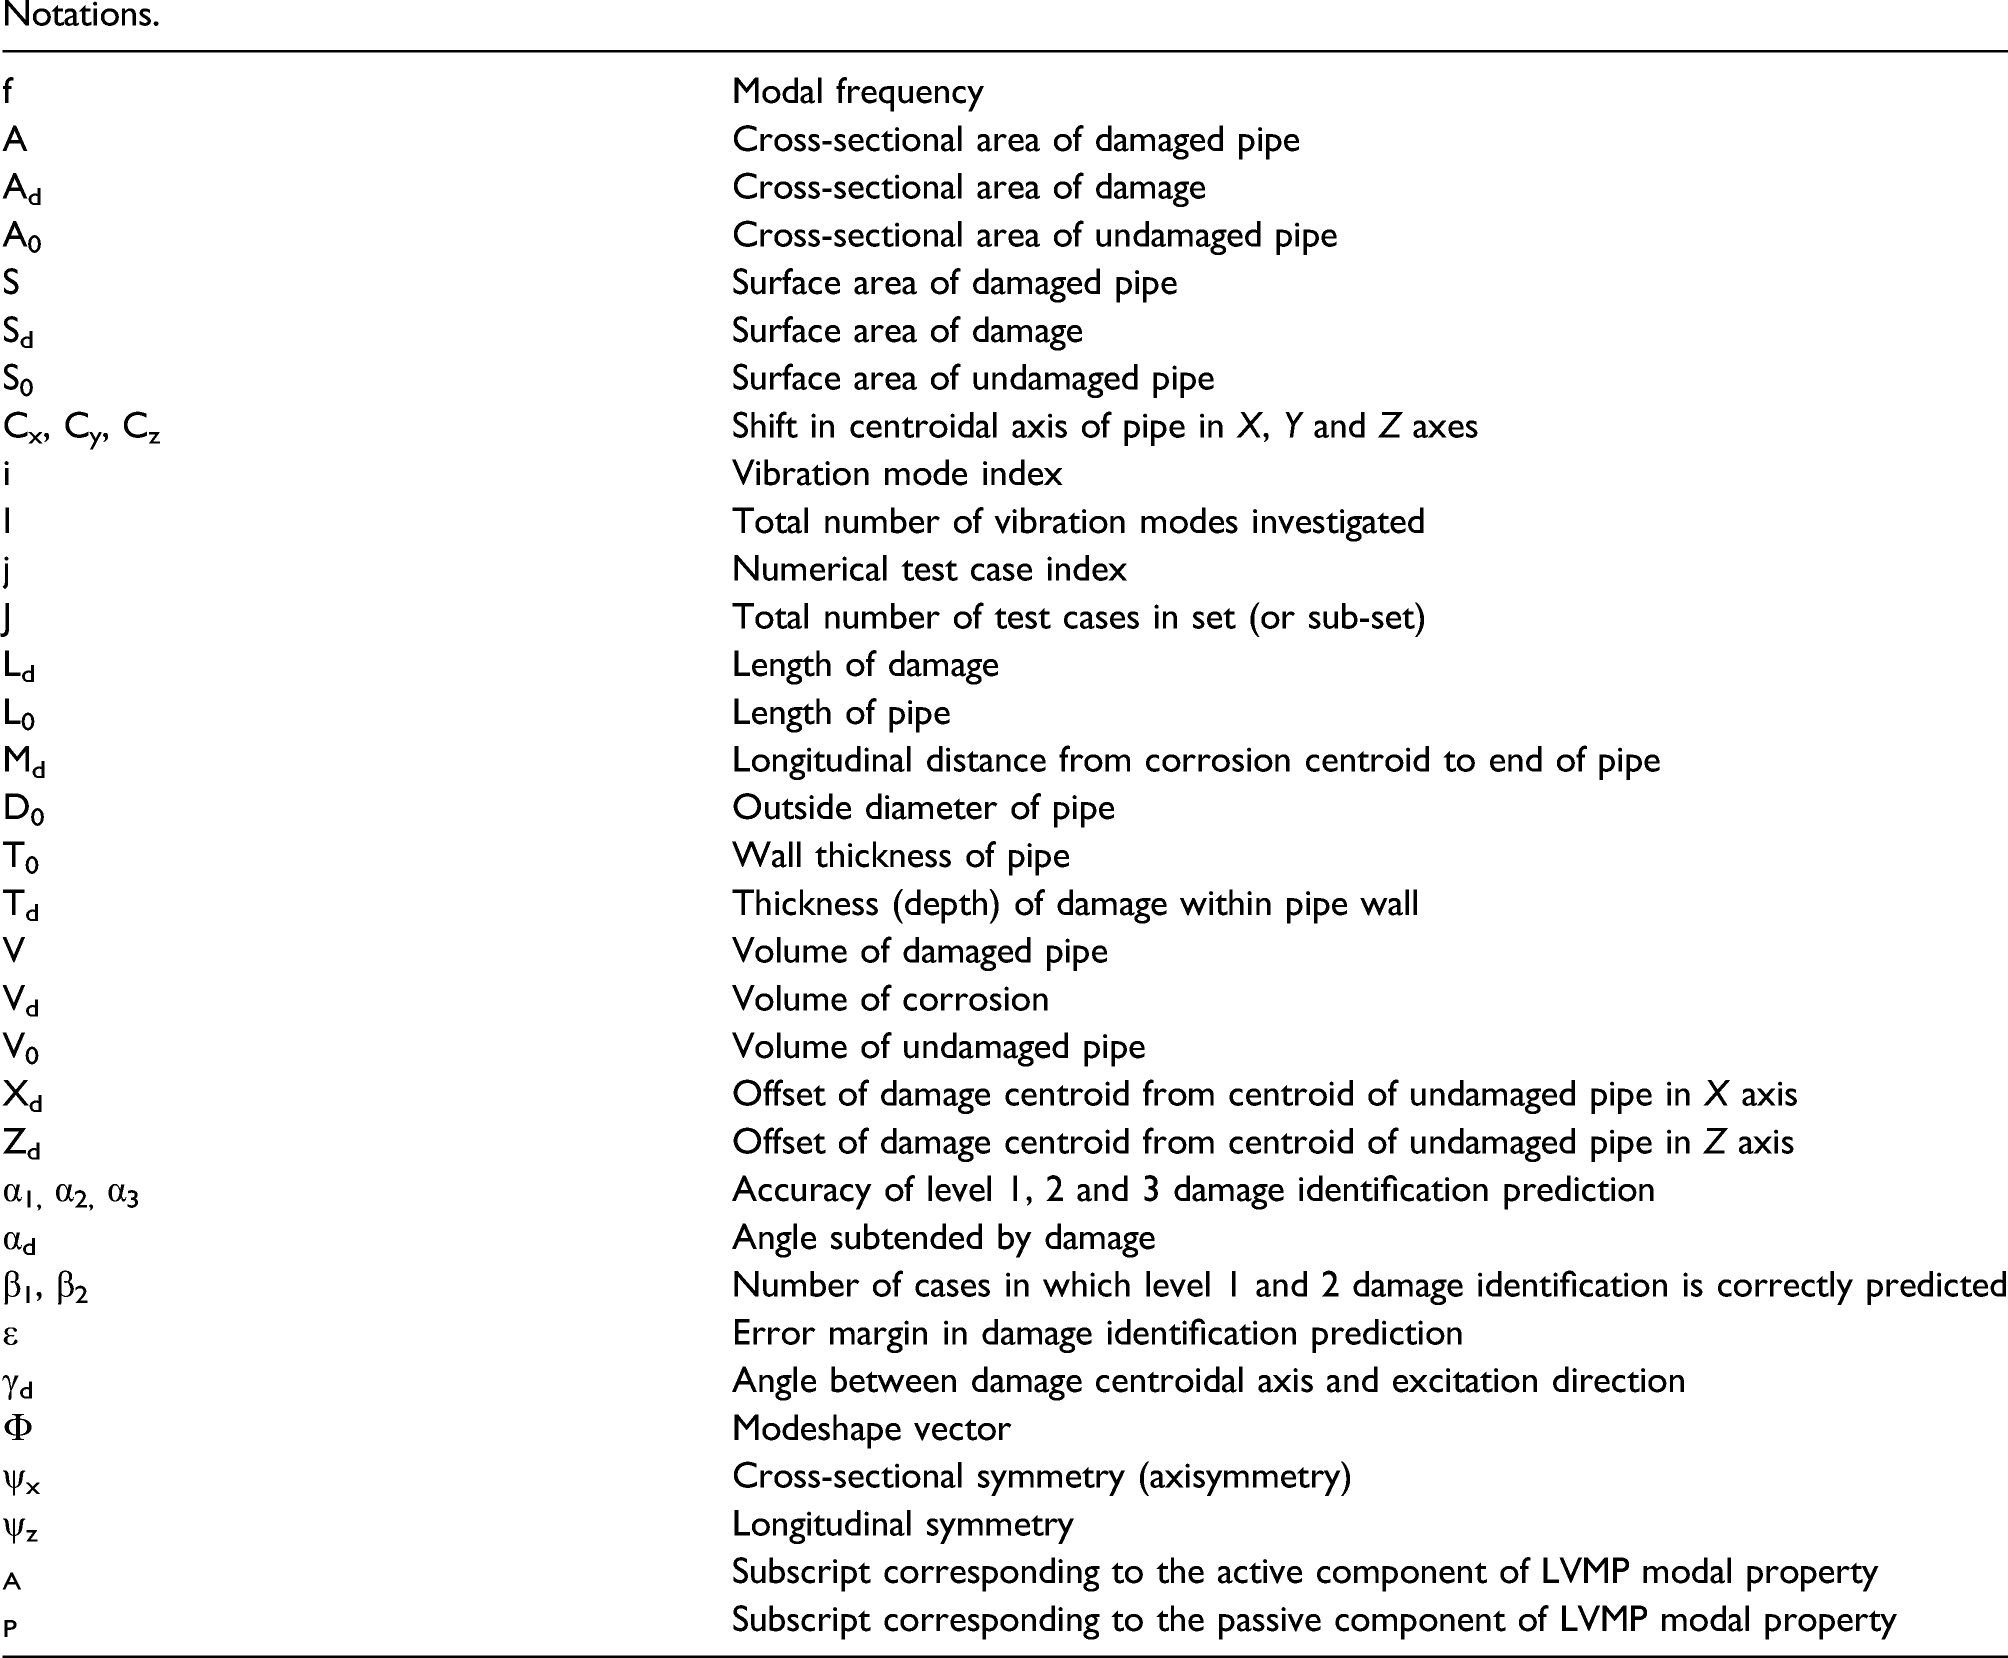
Notations.
This research seeks to overcome these setbacks by developing a baseline-free method capable of level 3 damage identification. The proposed method is based on local vibration mode pairs (LVMPs) which is peculiar to axisymmetric tubular structures subjected to non-axisymmetric damage and was employed in our previous study 27 for detection of corrosion in pipes. Notably, the LVMP concept was inspired by the phenomenon of repeated/split frequencies observed in circular rings due the presence of cracks. 28,29,30,31 Circular rings like pipes are tubular structures and share a common property in axisymmetry; damage perturbs this property and therefore it is assumed that a shift in the measure of axisymmetry is characteristic of damage. Furthermore, it is also conjectured that the degree of axisymmetry perturbation is related to the extent of damage in a tubular structure; therefore, in this research a measure of symmetry was sought in order to verify these assumptions.
Before developing the proposed method, an overview of the LVMP phenomenon is presented. In summary, from previous studies, it was found 27 that the axisymmetry of a tubular structure is perturbed when it is subjected to non-axisymmetric damage; therefore, each valid (real) vibration mode of the damaged structure consists of a pair of LVMP components referred to as Active and Passive.
The LVMP phenomenon is demonstrated in Figure 1 where the frequency response function, FRF of an undamaged (or axisymmetrically damaged) pipe is shown to consist of a single peak per vibration mode, whereas each vibration mode of a non-axisymmetrically damaged pipe is shown to possess twin peaks (one Active and the other Passive). The Active component is markedly sensitive to damage while the Passive component is relatively insensitive to damage. For instance, vibration mode 1 of a non-axisymmetrically damaged pipe consists of frequencies f1A and f1P (and modeshapes Φ1A & Φ1P) where subscripts A and P stand for the Active and Passive components of the pair, respectively. However, for an undamaged (or axisymmetrically damaged) pipe, both LVMP components per vibration mode merge into a single frequency and modeshape, that is, f1A = f1P = f1 and Φ1A = Φ1P = Φ1. Therefore, the existence of a pair of LVMP components in a single vibration mode is characteristic of damage. Example of FRFs from (a) an undamaged pipe showing single peaks per valid vibration mode and (b) a non-axisymmetrically damaged pipe showing twin peaks corresponding to Active and Passive LVMP components (indicated with subscripts 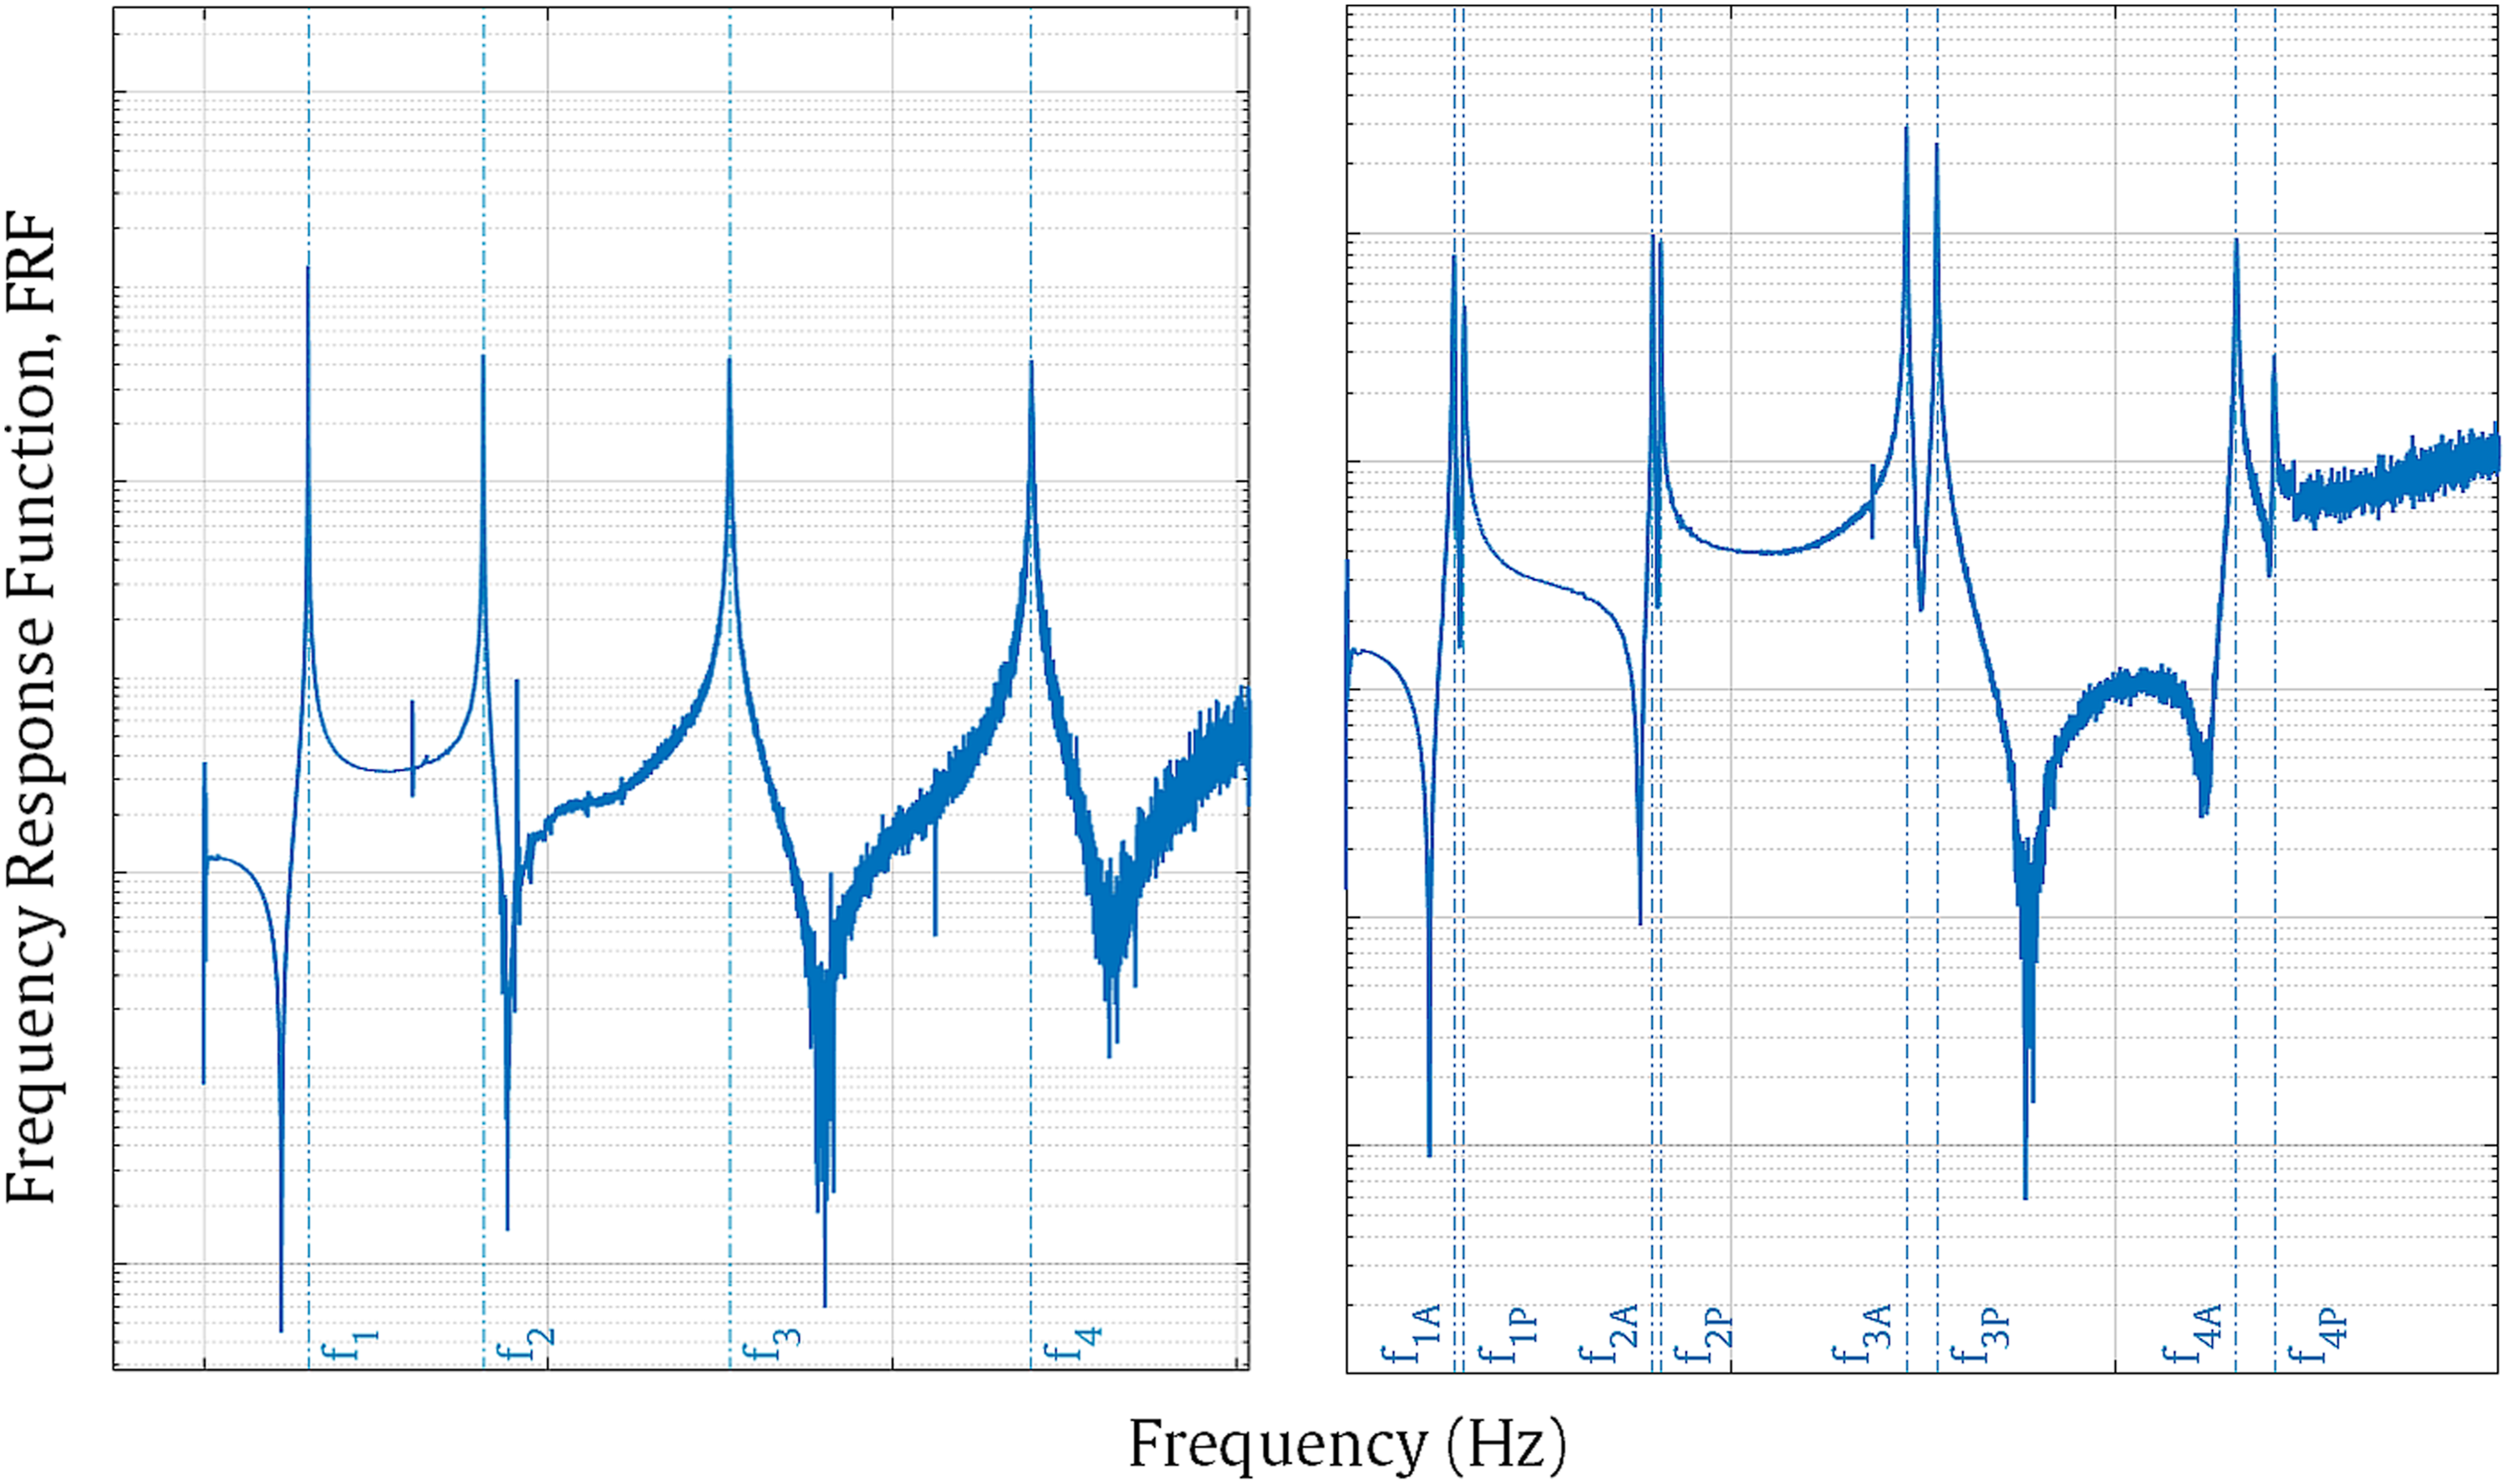
A summary of the properties of LVMPs include: i) LVMPs consist of a pair, one representing an active mode and the other a passive mode. ii) The difference between active and passive modal frequencies is typically less than 10%. iii) The modeshapes of both active and passive local modes are similar and are composed of the same number of half-sine waves. iv) The deviation between LVMP component’s frequencies is related to the spatial characteristics of the damage.
Moreover, for a given vibration mode, i, if the ratio fiA/fiP < 1.0, damage is inferred. With regard to localisation of damage along the pipe
The previous study 27 focuses on the description of the LVMP phenomenon and its formulation as a forward problem. In the present study, a novel LVMP-based damage identification method is proposed, essentially tackling the solution of the inverse problem. The paper proceeds with a description of the LVMP damage identification process (Methodology), followed by a demonstration of how the process was applied in this research (Application of Proposed Method). Finally, the proposed method is validated numerically using 500 test cases (Numerical Verification) and experimentally based on laboratory test data (Experimental Verification) from where it is demonstrated that it yields very promising results in detecting, locating and quantifying damage without baseline modal properties.
Methodology
Overview
The aim of level 3 damage identification is to detect (level 1), locate (level 2) and quantify (level 3) damage in a structure without a priori knowledge of the damage. In other words, the objective is to solve the inverse problem by blindly identifying damage in a purportedly damaged structure merely from vibration-based assessment or modal data of its current state (i.e. without baseline modal data from the structure Flow chart of proposed damage identification method.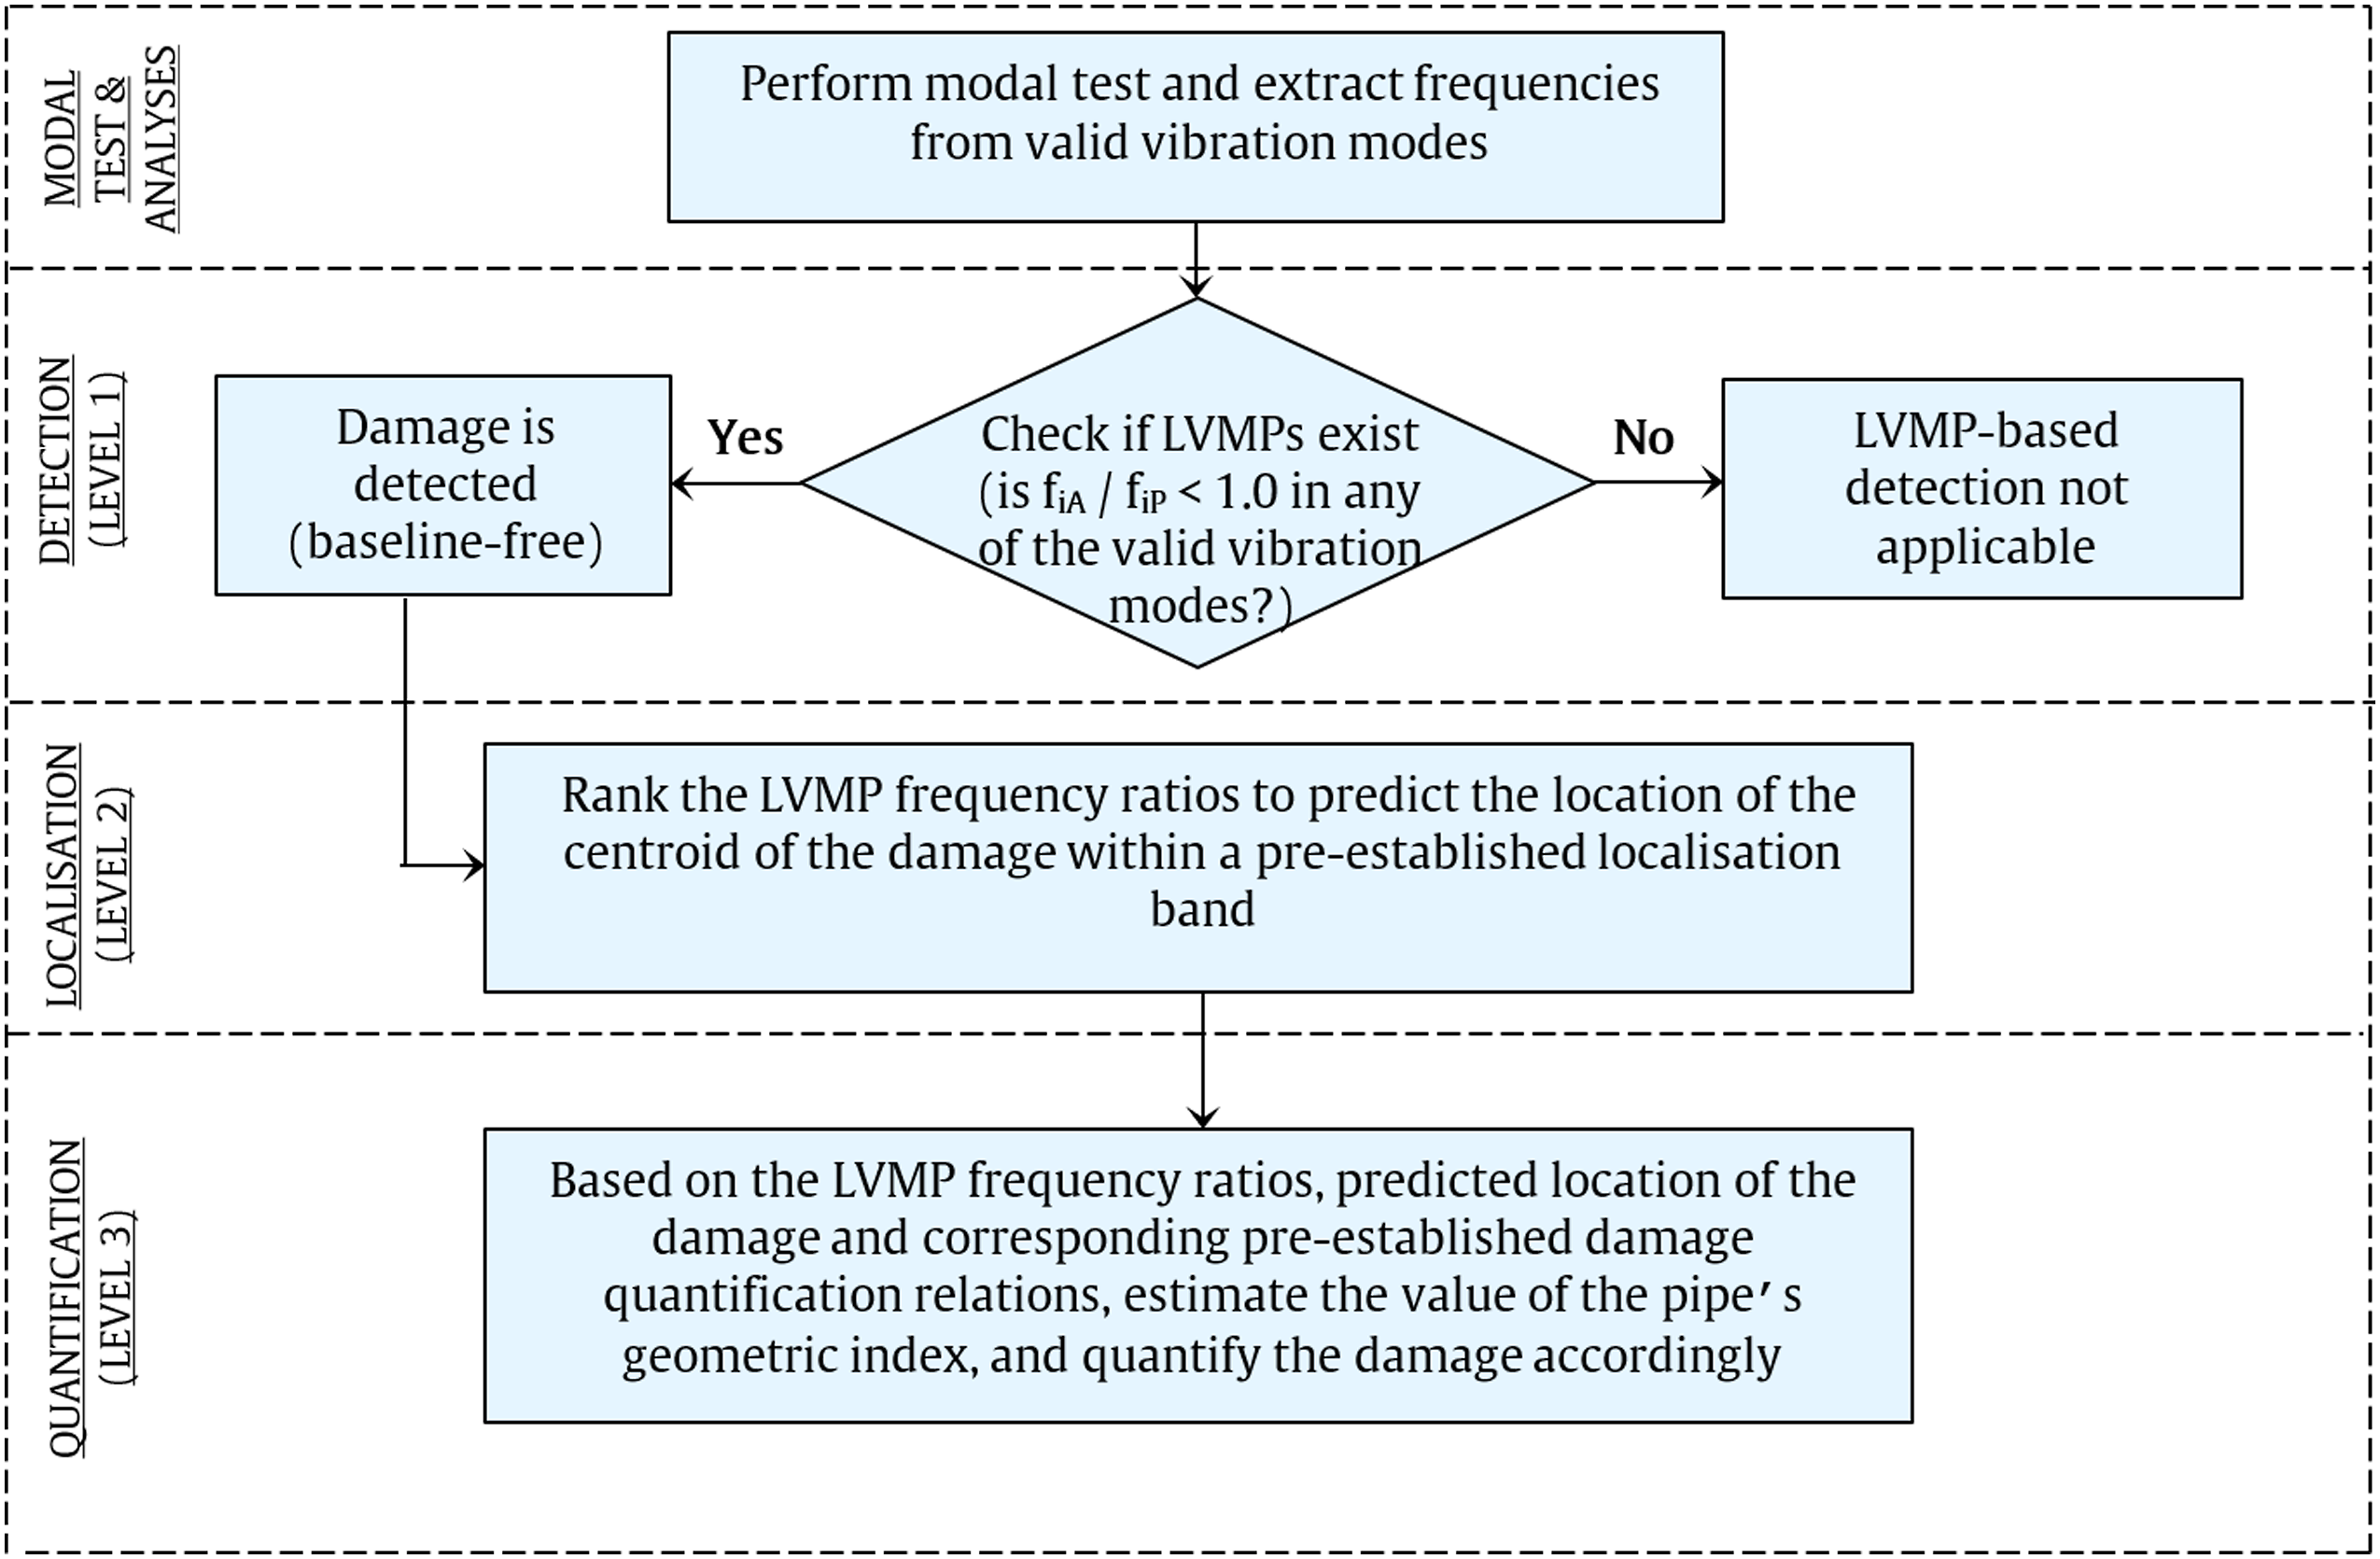
Firstly, damage is detected if LVMPs are observed within any of the investigated modes, i (i.e. if both fiA and fiP exist). Higher levels of damage identification require the development of a numerical database of damage cases for the structure in hand, that is, bearing in mind its geometric and material properties and boundary conditions. The purpose of the database is to provide a set of damage test cases that can be parametrically studied and, through feature extraction, used to define localisation bands (for locating damage) and quantification relations (for quantifying damage). For level 2 identification, the pertinent features are the LVMP frequency ratios, whose ranking order enables the prediction of the location of the damage centroid within localisation bands. Level 3 identification is achieved by relating the same feature, that is, the LVMP frequency ratio for a given vibration mode, to a geometric damage index through quantification relationships that have been developed using the damage test cases contained in the database.
The process of constructing the damage database required for level 2 and 3 damage identification, including development of the LVMP frequency ratio ranking orders, localisation bands and derivation of the geometric damage indices as well as quantification relations employed in the damage identification process are explained in the following sub-sections.
Damage Database
To develop the database, finite element models of the pipe with various single-site damage properties (i.e. dimensions and centroid location) are required. Damage is simulated by removal of the finite elements within the damage site. For example, considering the pipe in Figure 3; the dimensions, Ld, Td and αd which define the damage volume, Vd, as well as the location of the damage centroid, Md, should be varied to create multiple unique test cases for populating the database. An example of variable damage dimensions and centroid location used in creating multiple database test cases for damage identification in a pipe.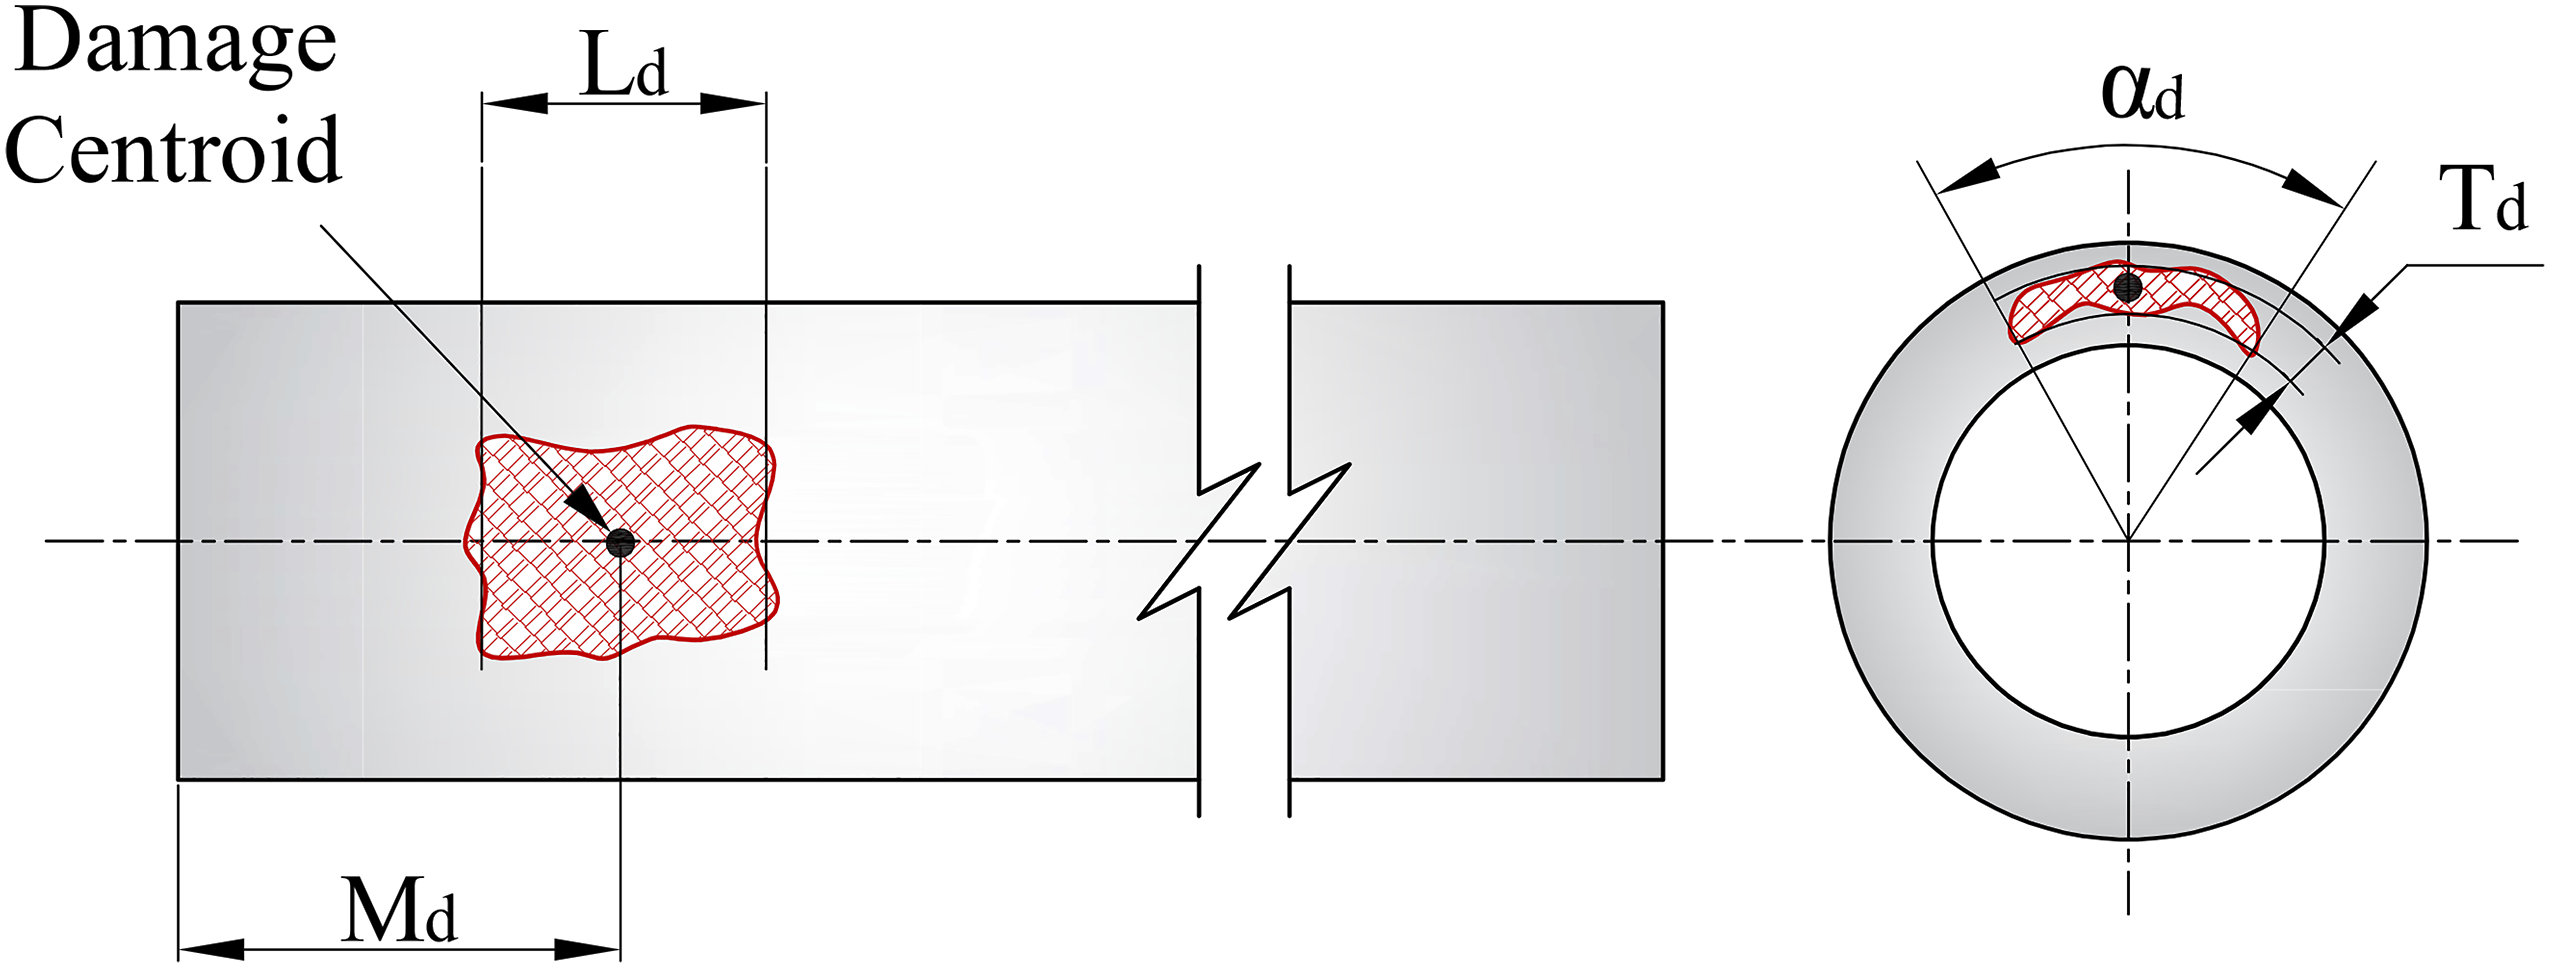
Next, modal analysis is performed on each test case within the database and the modal frequencies for each vibration modes, i, are obtained and investigated for the existence of any LVMPs. Where LVMPs are observed, the ratio fiA/fiP for each vibration mode per test case are calculated and stored in the database.
Based on the given damage properties per test case, geometric indices (defined in Geometric Damage Indices section) are calculated and included in the database. Therefore, each case in the database comprises of its unique damage properties, geometric indices and LVMP frequencies. The geometric indices are plotted against corresponding LVMP frequency ratios for each damage centroid location, Md per vibration mode, i, and trendlines (e.g. based on least-squares linear regression) are derived for each plot as illustrated in Figure for a test series where four vibration modes are investigated (i.e. i = 1–4) and the damage centroid, Md, is varied at three locations (i.e. Md = X, Y and Z).
These trendline equations are referred to as Quantification Relations in this research. Their main function is to enable initialisation of localisation bands (for damage localisation) and estimation of geometric indices (for damage quantification).
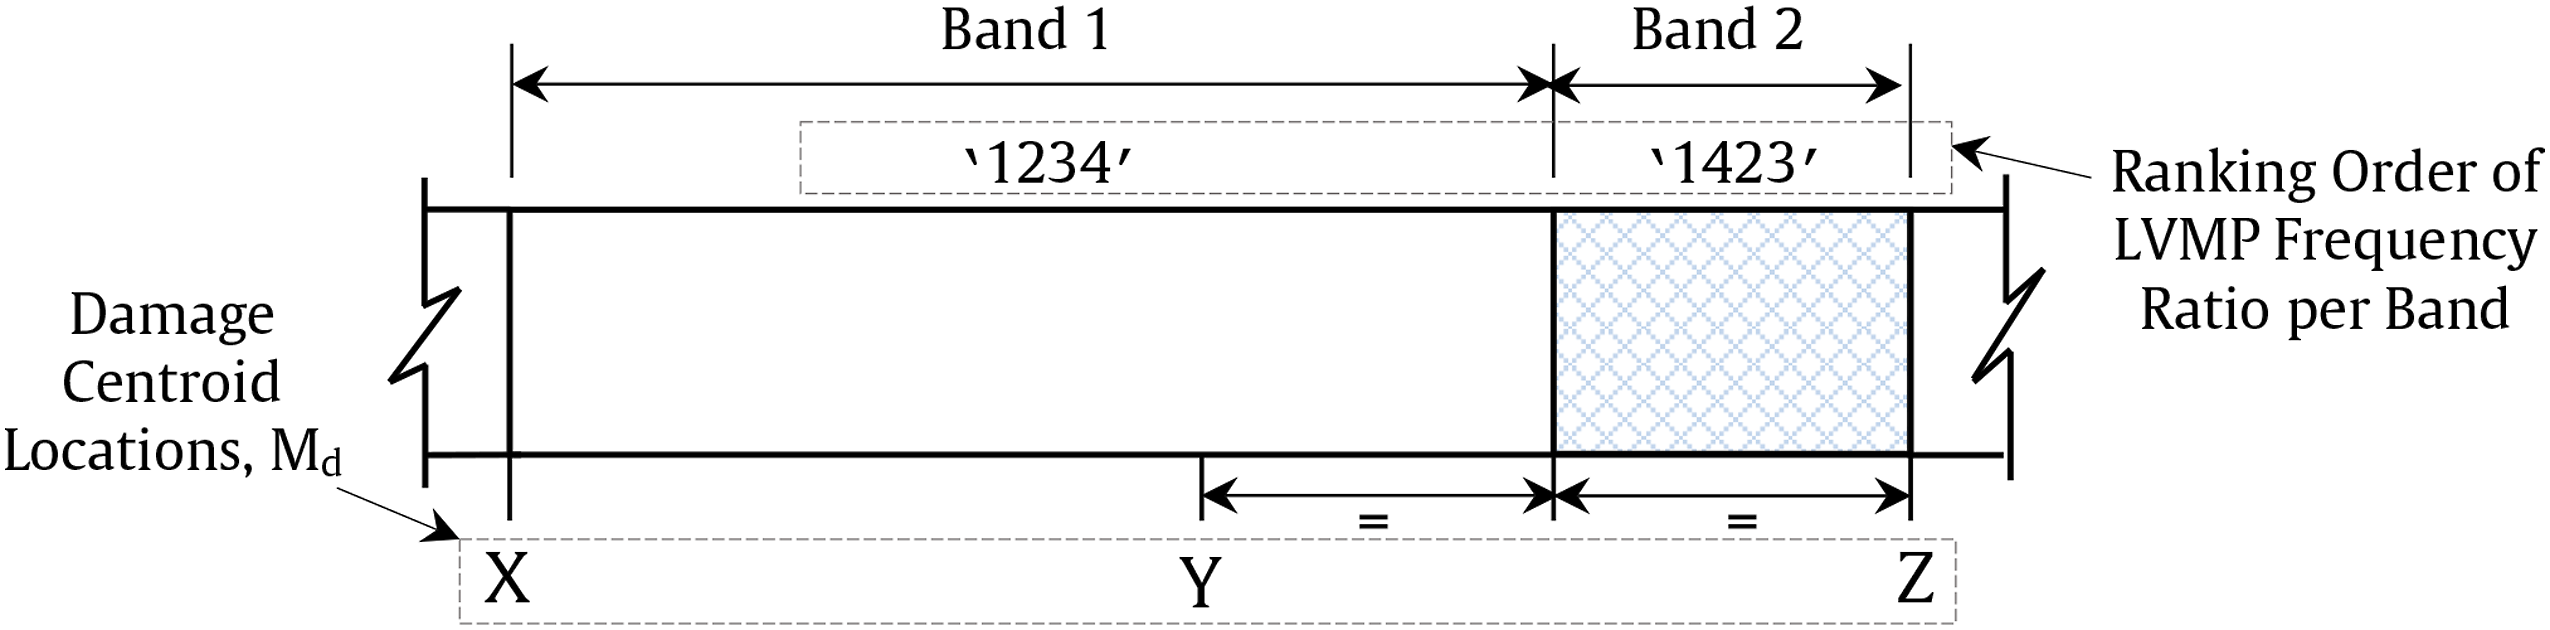
Sub-division of the structure into localisation bands is achievable by ranking the LVMP frequency ratios per test case. For instance, in Figure 4(a) and (b) the slope, m, of the plot for each vibration mode i is in the order m1 < m2 < m3 < m4, implying that the LVMP frequency ratios are likely to be in the order f1A/f1P > f2A/f2P > f3A/f3P > f4A/f4P and hence constitute a ranking order of Example of geometric index versus LVMP frequency ratio per vibration mode, i, for damage centroid, Md at (a) X, (b) Y and (c) Z. Example of pipe sub-divided into two localisation bands.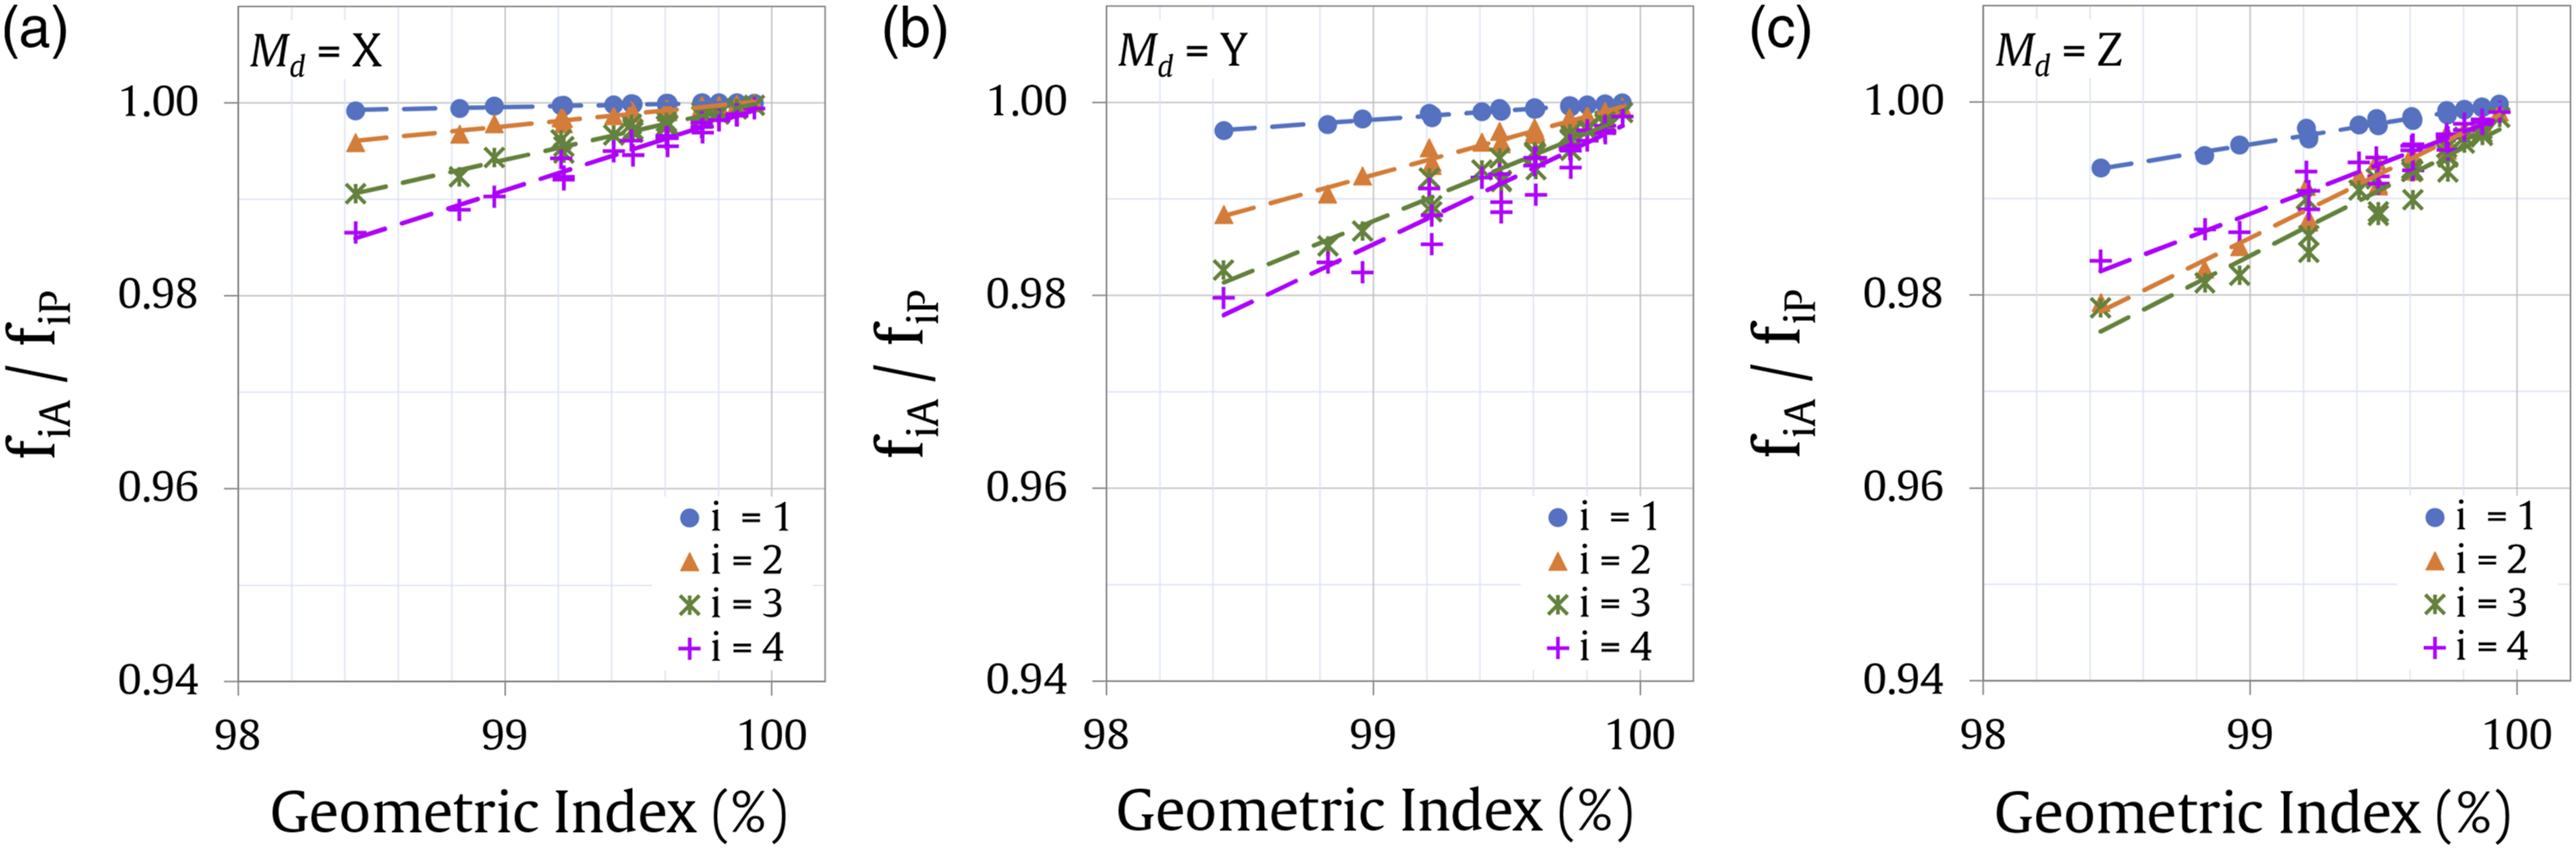
The number of different damage centroids, Md used to develop the geometric index versus LVMP ratio plots dictates the number of localisation bands applicable in a test series. Some plots may have different damage centroid locations but have the same LVMP frequency ranking order; therefore, the bandwidths of each localisation band may not be equal.
It is recommended that a sensitivity analysis is performed to fine-tune the initial bandwidths and their corresponding LVMP frequency ratio ranks so that a high level of localisation accuracy prediction is achieved as demonstrated later in the Localisation Bands and Quantification Relations section. A summary of the procedure for the development of the database for the proposed damage identification method is presented in Figure 6 while details of how the database can be employed in damage identification are given in the Damage Identification Process section. Flow chart for database development procedure.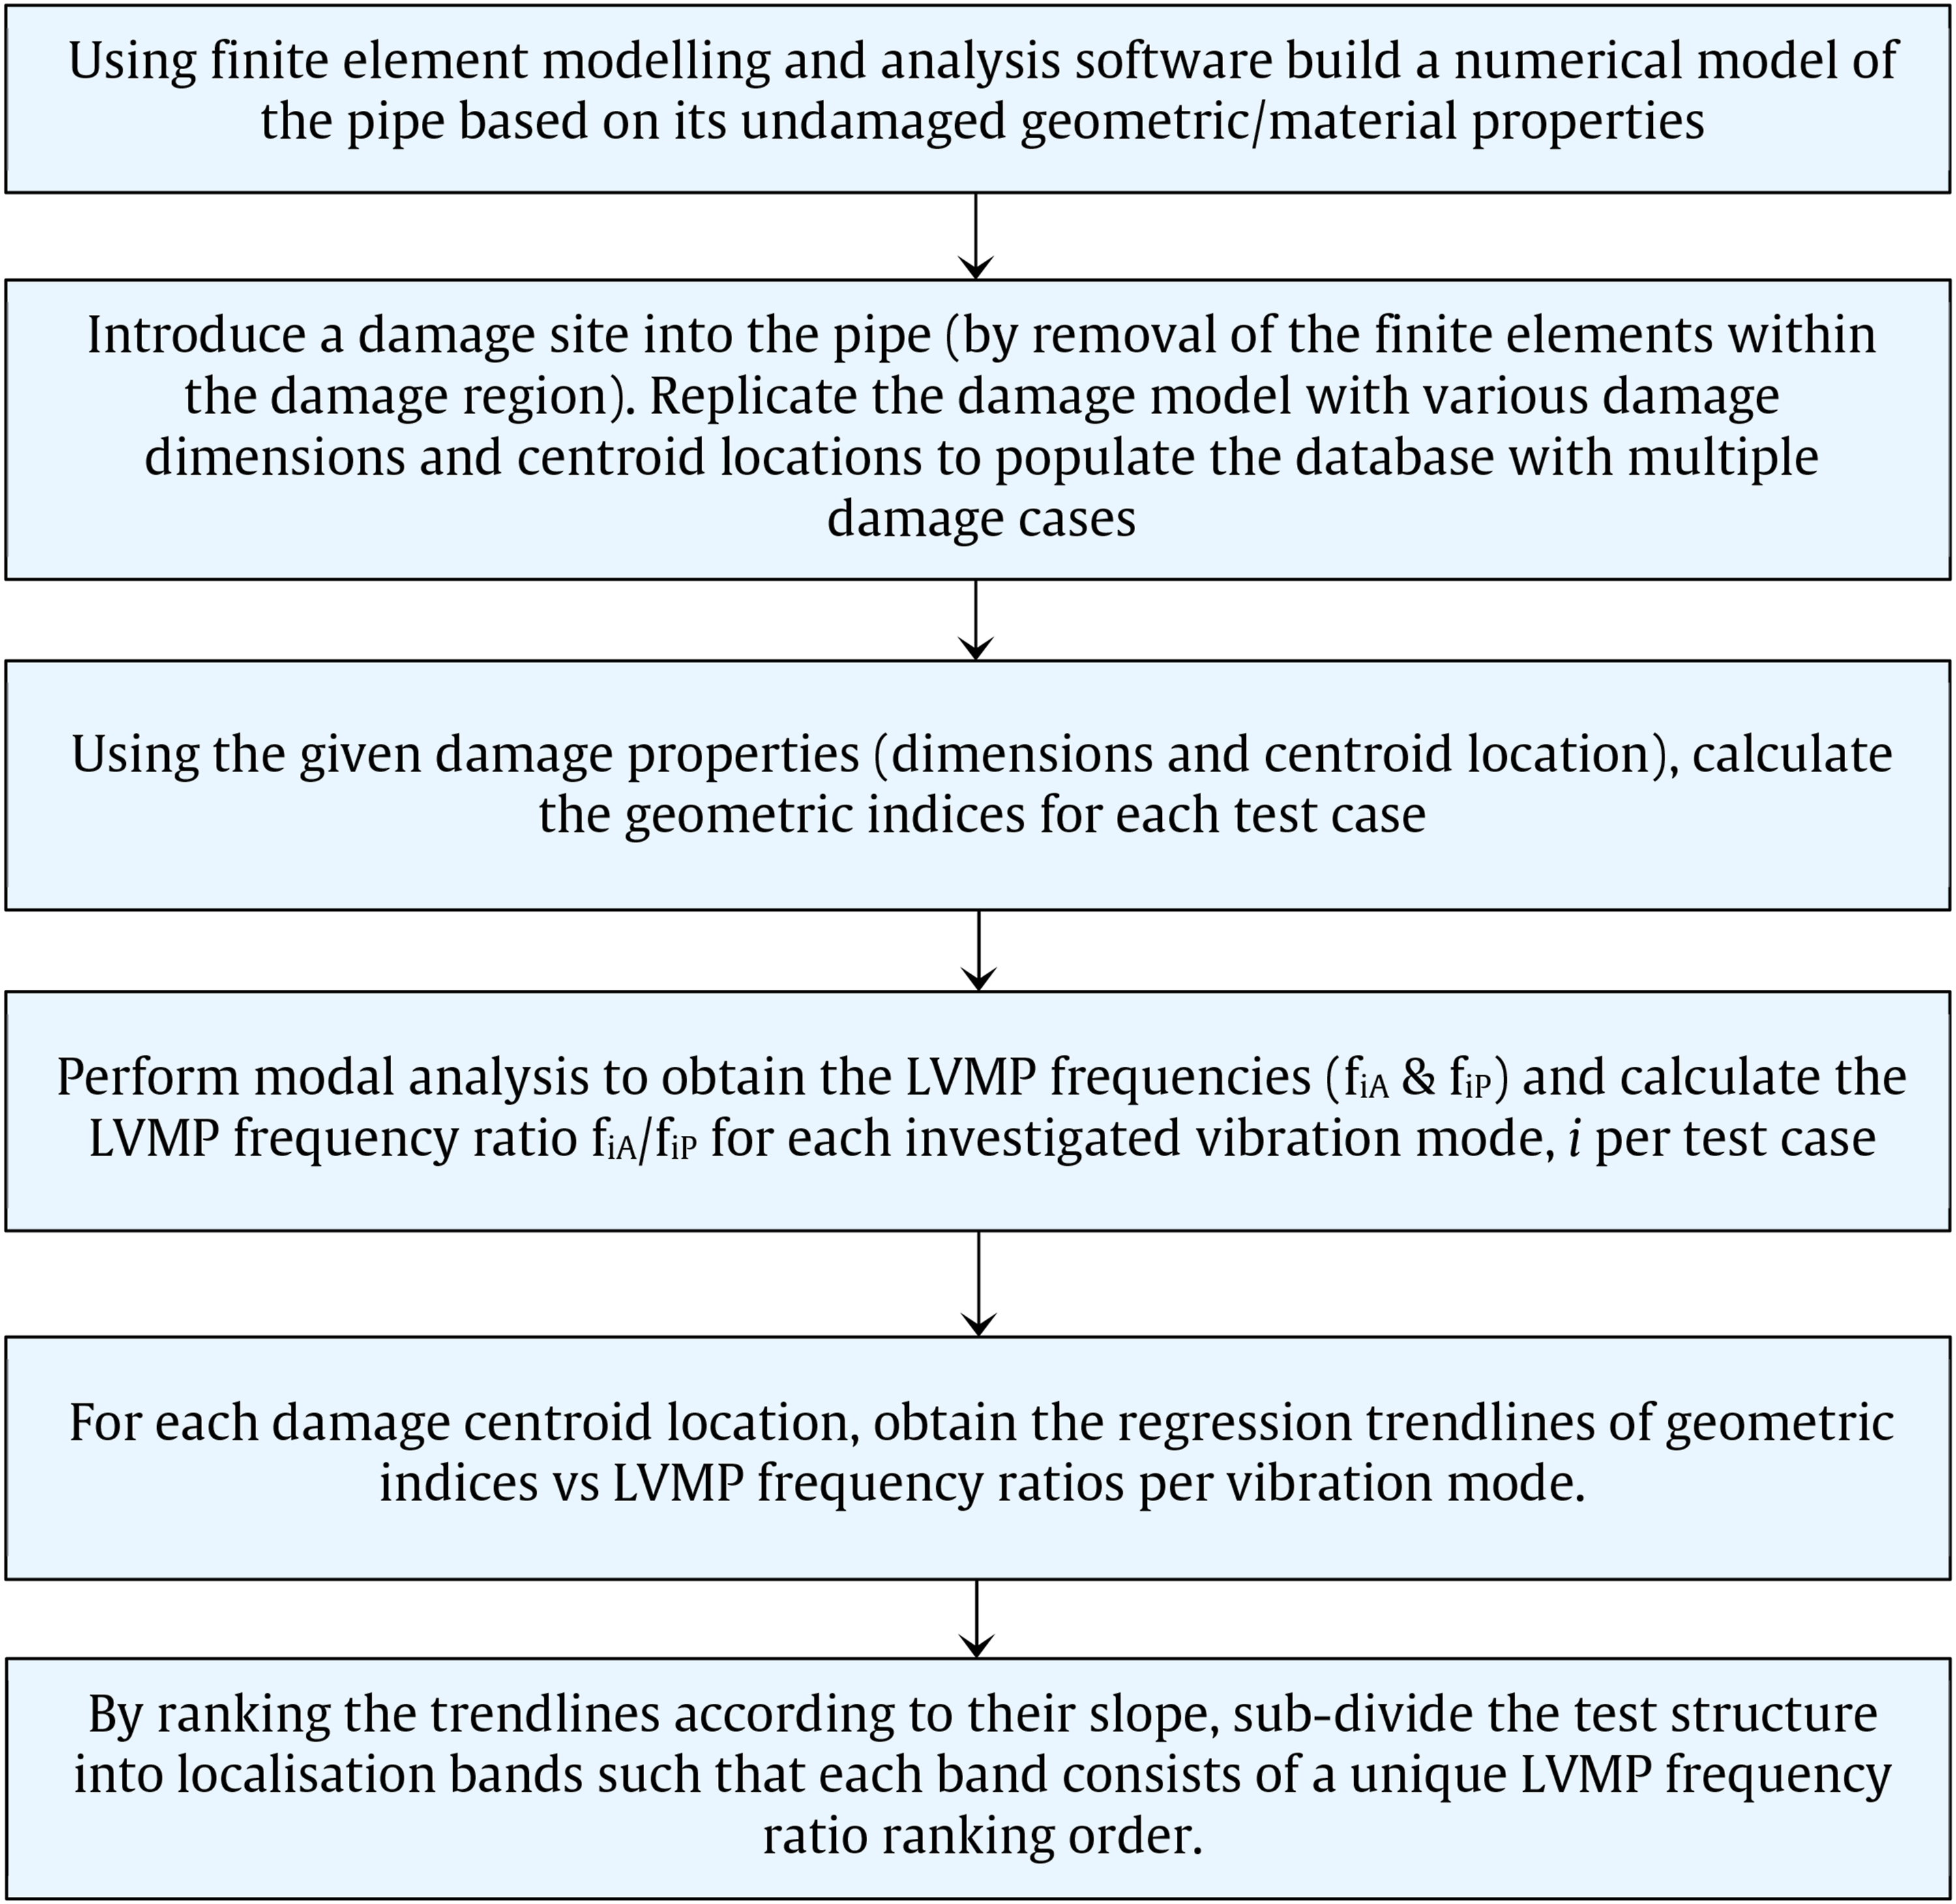
Geometric Damage Indices
In this sub-section, the geometric indices which can be used for damage identification in the proposed method are derived. Given that LVMPs are characteristic of symmetry perturbation, the initial search for geometric indices for damage identification was symmetry driven. As such, the continuous symmetry measure (CSM) 32 which was originally developed for rotational symmetry of N-sided polygons was investigated. It was found that CSM was employed in quantifying the symmetry of the circumferential modeshapes of a corroded pipe section and consequently the loss of symmetry was related to damage existence 33 ; however, CSM cannot be applied to circular cross-sections as it is founded on polygonal shapes. Another method for measuring axisymmetry is directly applicable to fluid flow in vortex rings 34 but found unusable for structural damage identification. Hence, in this research alternative symmetry-based indices were developed alongside conventional geometric indices. These indices, when correlated to corresponding LVMP frequency ratios yield relations that can be used to quantify damage.
A total of five geometric indices for damage identification are defined. The first set of indices correspond to the Volume (V), Cross-Section Area (A) and Surface Area (S) of a damaged pipe according to equations (1), (2) and (3), respectively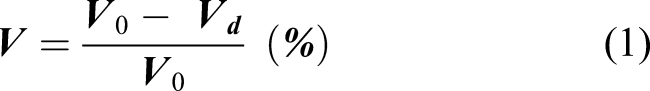
The second set of geometric indices are symmetry-based; ψx relates to axisymmetry (circumferential symmetry) while ψz corresponds to longitudinal symmetry; these provide additional quantification measures in tubular structures. The rationale behind the investigated symmetry-based indices is described below.
Consider an undamaged pipe with outside diameter, D0 and wall thickness, T0 as shown in Figure 7(a). In its undamaged axisymmetric state, the pipe will vibrate, when excited, in arbitrary orthogonal directions, here labelled as axes X and Y. The centroid of the pipe about both axes of vibration coincides with its geometric centre, that is, Cx = Cy = 0. Consequently, for each vibration mode, i, the frequencies and modeshapes obtainable per direction are equal, that is, fi(X) = fi(Y) and Φi(X) = Φi(Y). Geometric properties of pipe (a) undamaged cross-section, (b) damage cross-section and (c) damaged longitudinal section.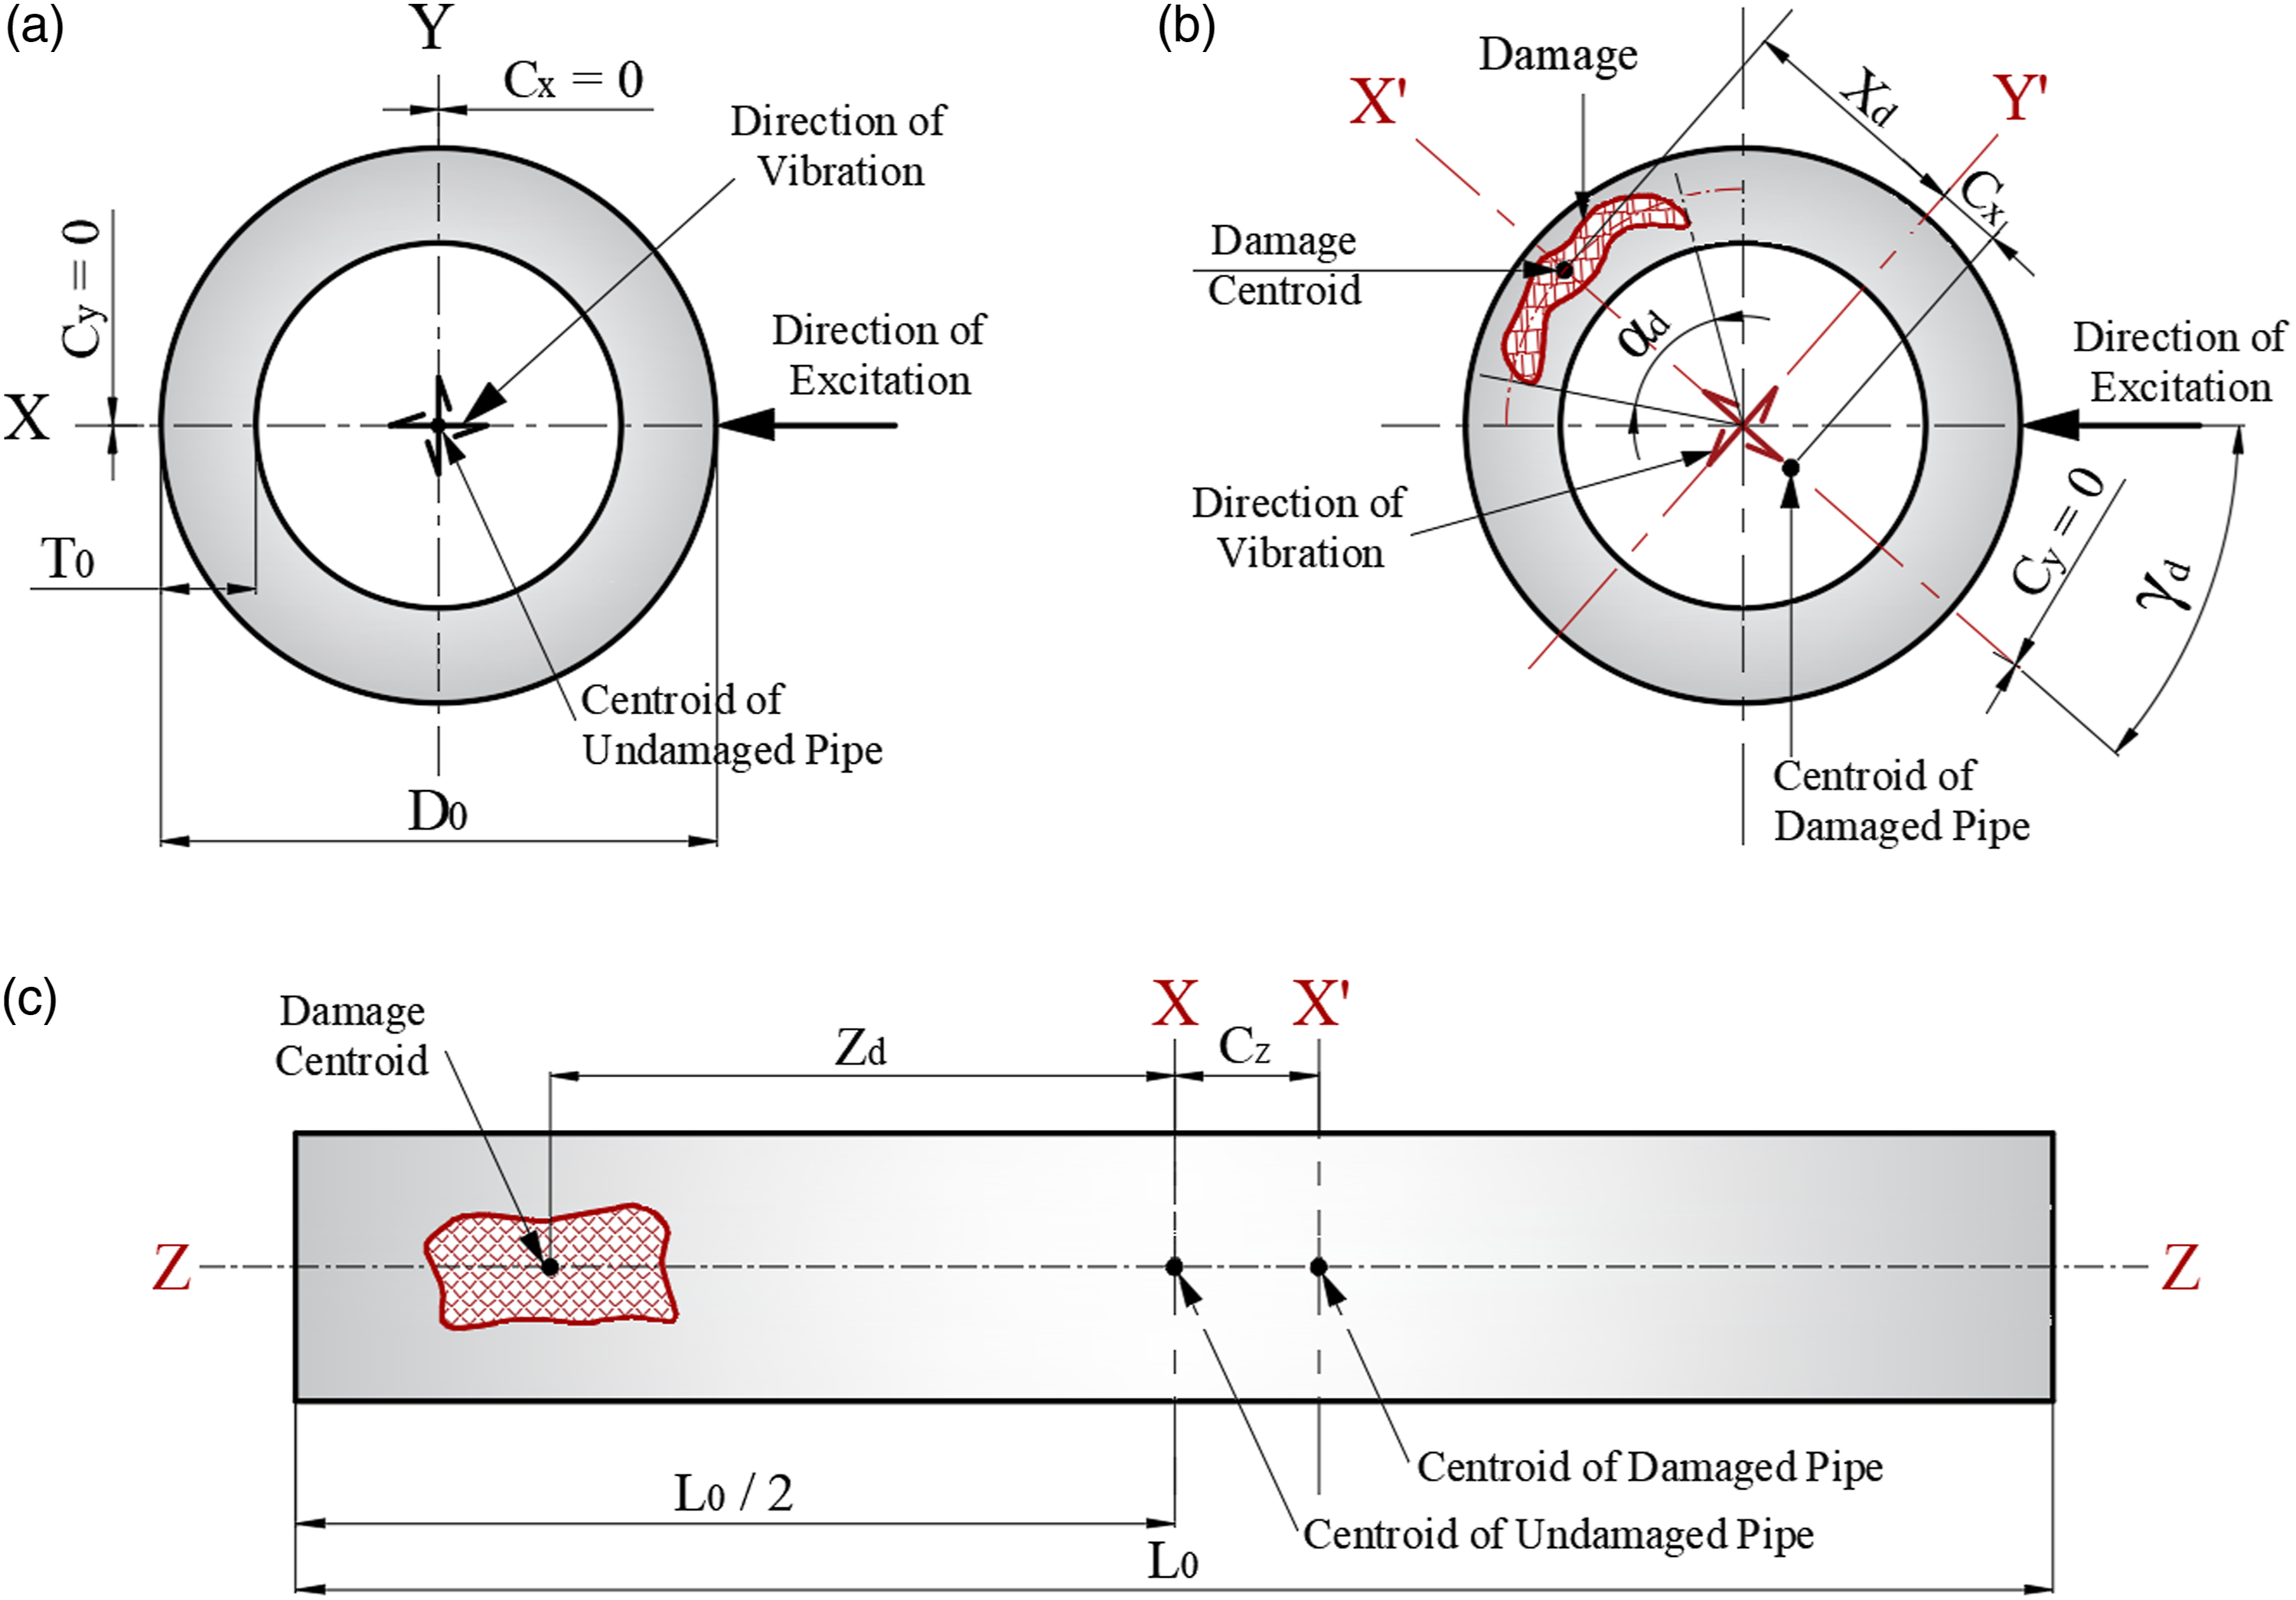
When the pipe is subjected to damage, its axisymmetry over some length of the pipe is perturbed. Upon excitation of the damaged pipe, the principal axis of vibration is defined by a straight line through the centroid of the damage and its geometric centre labelled X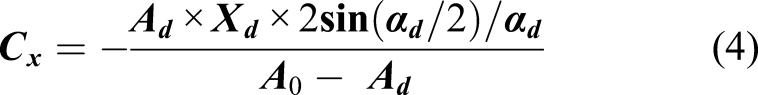
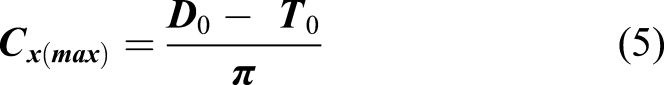
Utilising expressions (4) and (5), the index ψx measures the degree of axisymmetry of a tubular structure with respect to Cx and Cx(max) and ranges from 0 (minimum axisymmetry) to 100 (maximum axisymmetry) according to equation (6)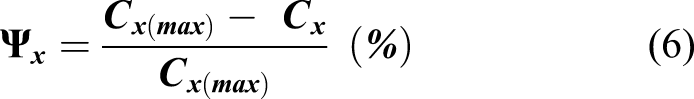
ψz measures the degree of symmetry along the longitudinal axis and is dependent on the parameter Cz depicted in Figure 7(c). For an undamaged pipe, longitudinal symmetry is intact and Cz = 0. However, for a damaged pipe, Cz is calculated according to equation (7)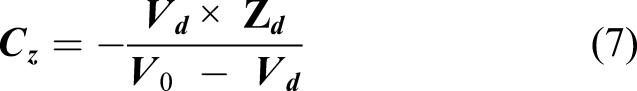
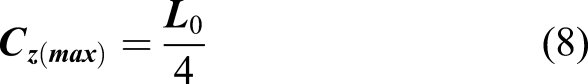
Utilising expressions (6) and (7), the index ψz relates Cz to Cz(max) and ranges from 0 (no symmetry) to 100 (intact symmetry) and is defined as follows:
In the section Application of Proposed Method, the above defined five indices (V, A, S, ψx and ψz) were investigated in terms of possible functional trends between their values and corresponding LVMP frequency ratios in order to develop damage quantification relations.
Damage Identification Process
Following the definition of possible geometric damage indices and the development of a numerical database, damage identification can be performed. The process would commence by conducting modal tests and analysis on a purportedly damaged pipe to obtain its modal frequencies. The existence of LVMP frequencies (fiA and fiP) within any of the investigated vibration modes in such a pipe is characteristic of damage, whereas if LVMP frequencies are not observed, it implies that the pipe is undamaged or axisymmetrically damaged (an unlikely case in practice) and the proposed damage identification method is not applicable. Therefore, it is recommended 27 to investigate multiple vibration modes to increase the chances of observing LVMP frequencies in the damaged test cases. The number of modes investigated in the development of the numerical database for different types of damage would provide an indication to the number of modes that need to be recorded in any particular situation.
Localisation is achieved by ranking of the obtained LVMP frequency ratios. The ranking order is such that the vibration mode with the highest LVMP ratio is ranked 1st, the vibration mode with the second highest ratio is ranked 2nd and so on. Sequel to ranking of the LVMP frequency ratios, the location of the centroid of the damage can be predicted by inversely relating the derived frequency ratio ranking orders to specific pre-established localisation bands. It is worth noting that should the ranking order of the LVMP frequency ratios for a particular case not correspond to any of the pre-established localisation bands, the damage would not be successfully identified by the proposed method. For instance, if the modal test and analysis results yield an LVMP frequency ratio ranking order of
Quantification of the damage can be accomplished by inputting the known LVMP frequency ratio for a specific vibration mode into a corresponding quantification relation (per localisation band) and thus estimate the value of an appropriate geometric damage index. For instance, if the damage centroid was predicted to be within Band 2, then the quantification relations from Figure 4(c) should be used to calculate the corresponding geometric index. The geometric index can then be used to quantify damage in terms of material volume, cross-section area or surface area loss, among others, according to the equations derived in the Geometric Damage Indices section. It is worth noting that if the damage was predicted to be within Band 1 either of the two quantification relations shown in Figure 4(a) and (b) would be applicable. In such cases, it is later shown in the Numerical Verification section that the aggregate (mean) of all the relationships (per vibration mode) within a localisation band can be employed in the damage quantification operation for a prediction that is both accurate and unambiguously estimated.
Application of Proposed Method
Based on the procedure described in the Methodology section, a demonstration of how the preliminary numerical analysis applicable in this research is presented commencing with the development of the numerical database, followed by derivation of the damage quantification relations and localisation bands.
Development of Numerical Database
Properties of test pipe.
Derived geometric properties and modal frequencies of undamaged pipe.
The damage scenarios were simulated by removal of the finite elements defined by respective damage volumes in the numerical model. A 3D view of the numerical model illustrating a typical damage case is presented in Figure 8(a) while the parameters used to define the damage dimensions are depicted in Figure 8(b). The range of values for each dimension is given in Table 3. The location of the centroid of the damage, Md is varied 9 times; the circumferential angle subtended by the damage, Representation of damage parameters: (a) finite element mesh; (b) circumferential and longitudinal sections. Damage dimensions for numerical database.
Based on the damage dimensions in Table 3 and the properties of the pipe in Table 1, geometric indices (V, S, A, ψx and ψz as defined in the Geometric Damage Indices section) and the first three LVMP frequency pairs (from modal analyses) for each of the damage cases were derived and stored in the database for development of the quantification relations and localisation bands. The database is presented in Appendix A.
Localisation Bands and Quantification Relations
For each of the damage cases in the database, the individual geometric indices when plotted against corresponding LVMP frequency ratios (fiA/fiP), per damage centroid location, Md yielded trendline expressions based on least-squares linear regression. The analysis proved that the most useful and consistent index is V which relates to the volume of the damage. Graphical representations of index V versus LVMP frequency ratios per vibration mode, i, for the different damage centroid locations are depicted in Figure 9 while the trendline equations (quantification relations) for i = 1 and 2 for each plot are included in Table 4. Quantification relations for estimating volume of damage per vibration mode, i, for damage centroid located at (a) Md = 0.1, (b) Md = 0.15, (c) Md = 0.2, (d) Md = 0.25, (e) Md = 0.3, (f) Md = 0.35, (g) Md = 0.4, (h) Md = 0.45 and (i) Md = 0.5L0. Fine-tuned damage localisation bands and quantification relations.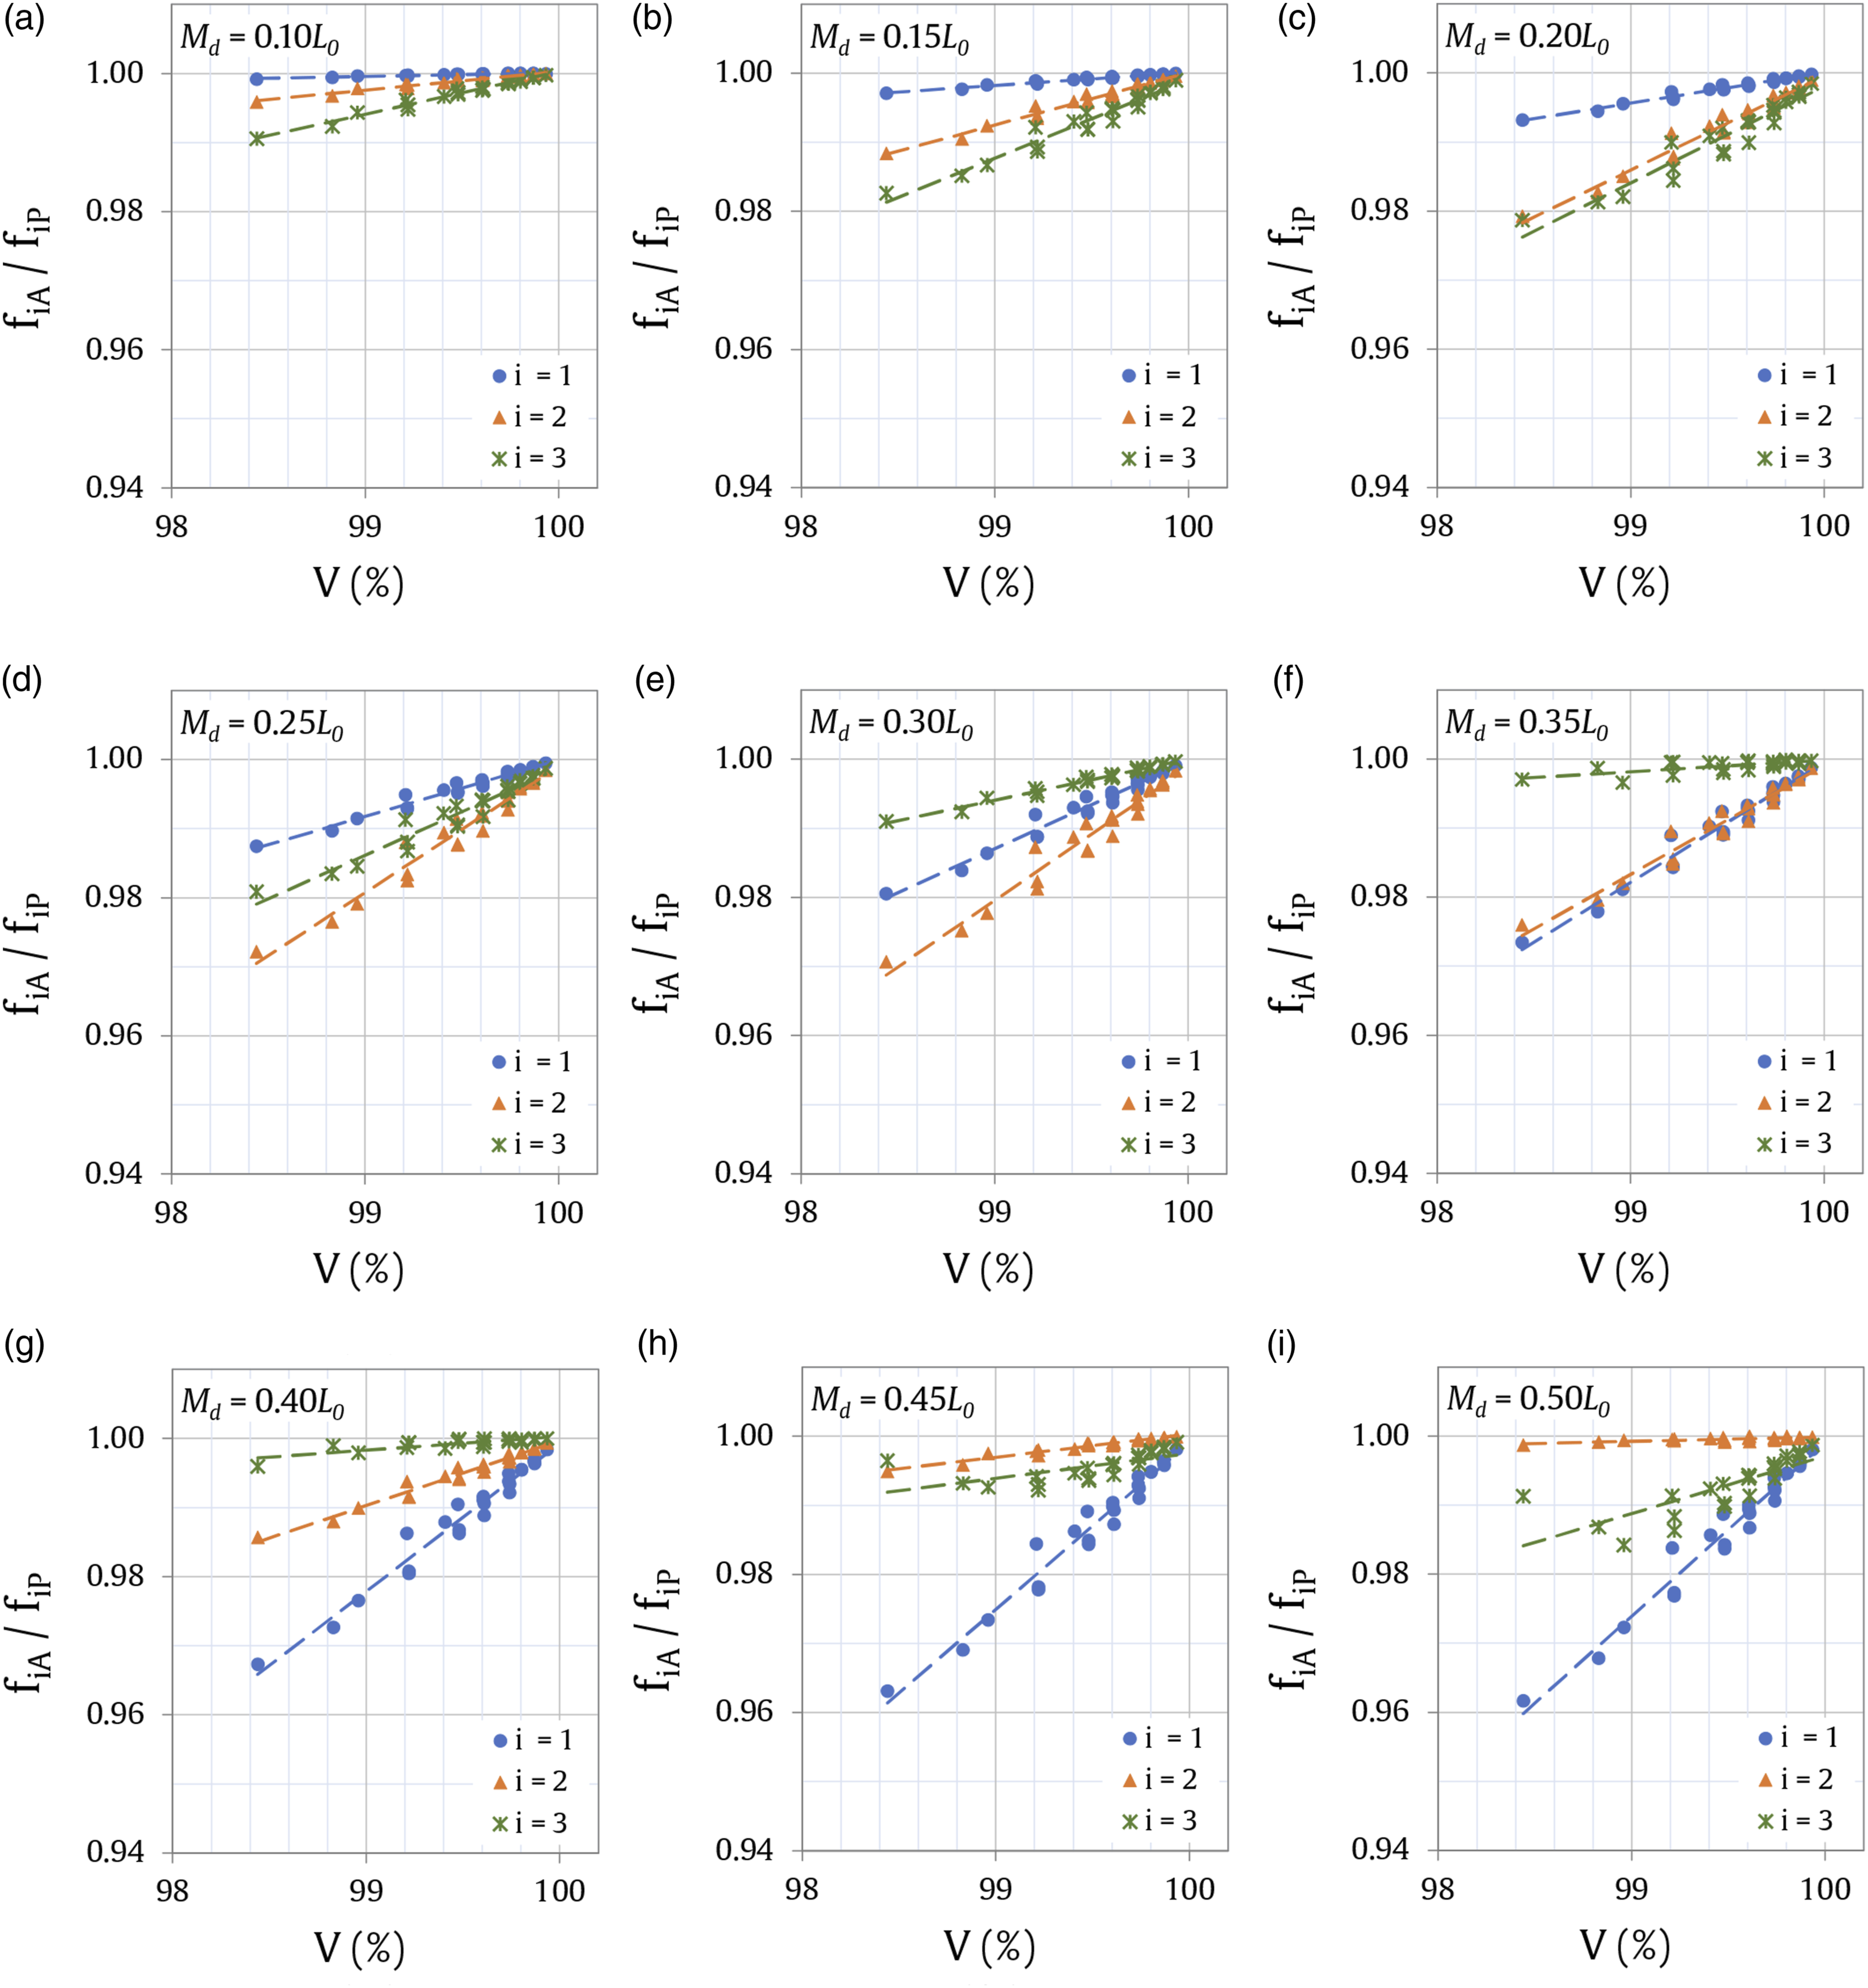
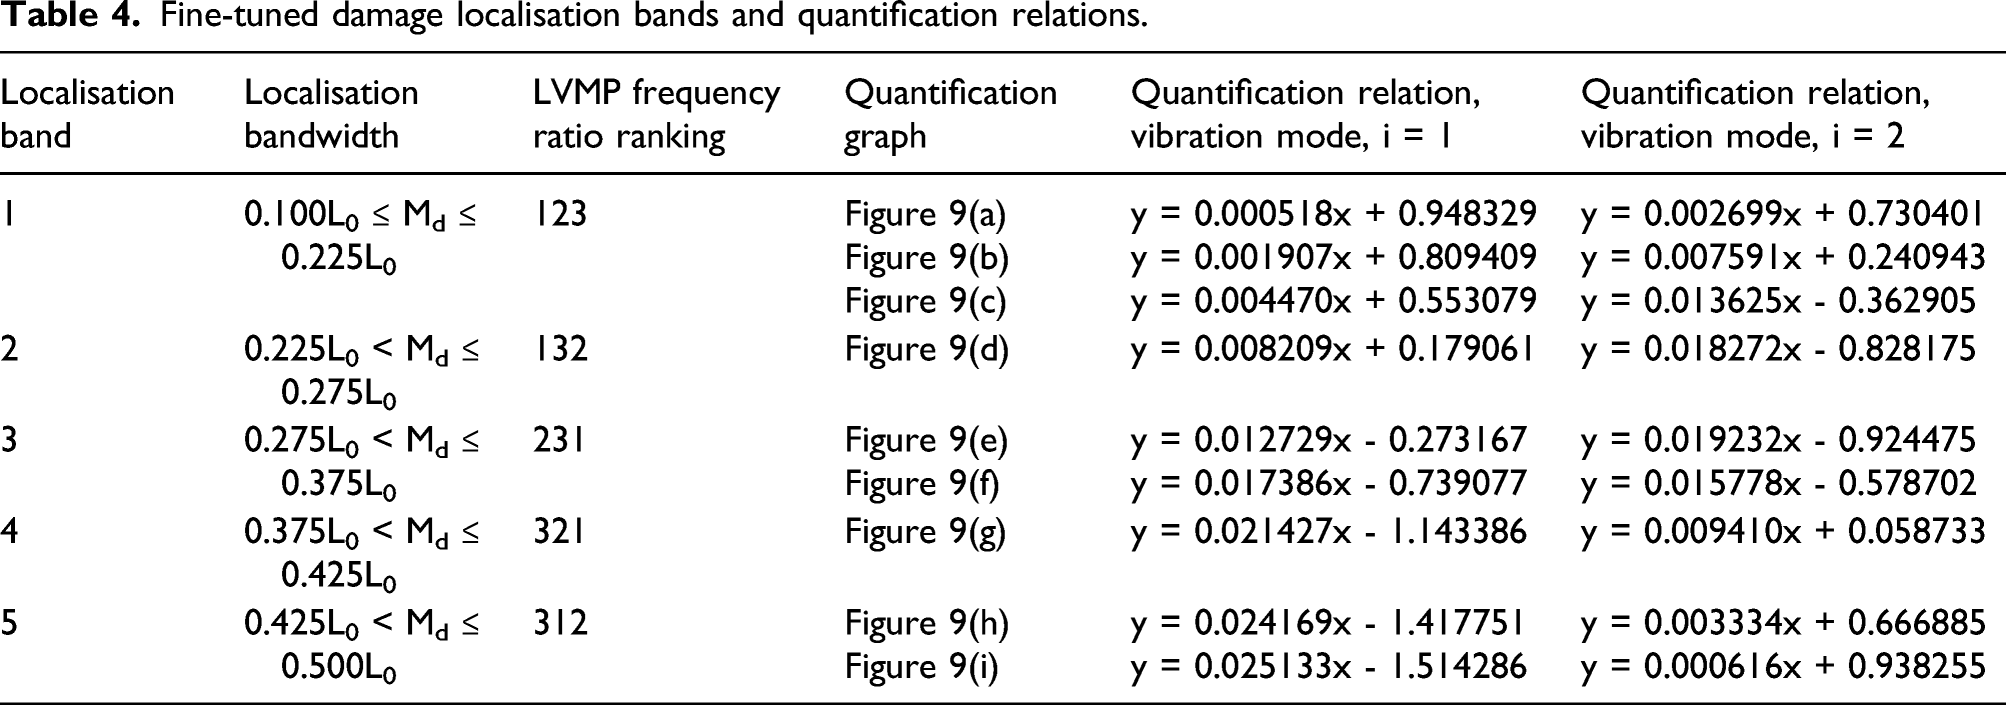
Sub-division of the pipe into five localisation bands (with initial bandwidths) was achieved following the procedure described in the Damage Database section. In this research, the first 100 (of 500 numerical test cases used for verification of the method in the Numerical Verification section) were used in fine-tuning the initial bandwidths, until the damage in at least 90% of the cases was successfully localised (banded). During the sensitivity analysis, it was observed that the initial LVMP frequency ranking order for Band 3 was Damage localisation bands and corresponding LVMP frequency ratio ranking orders.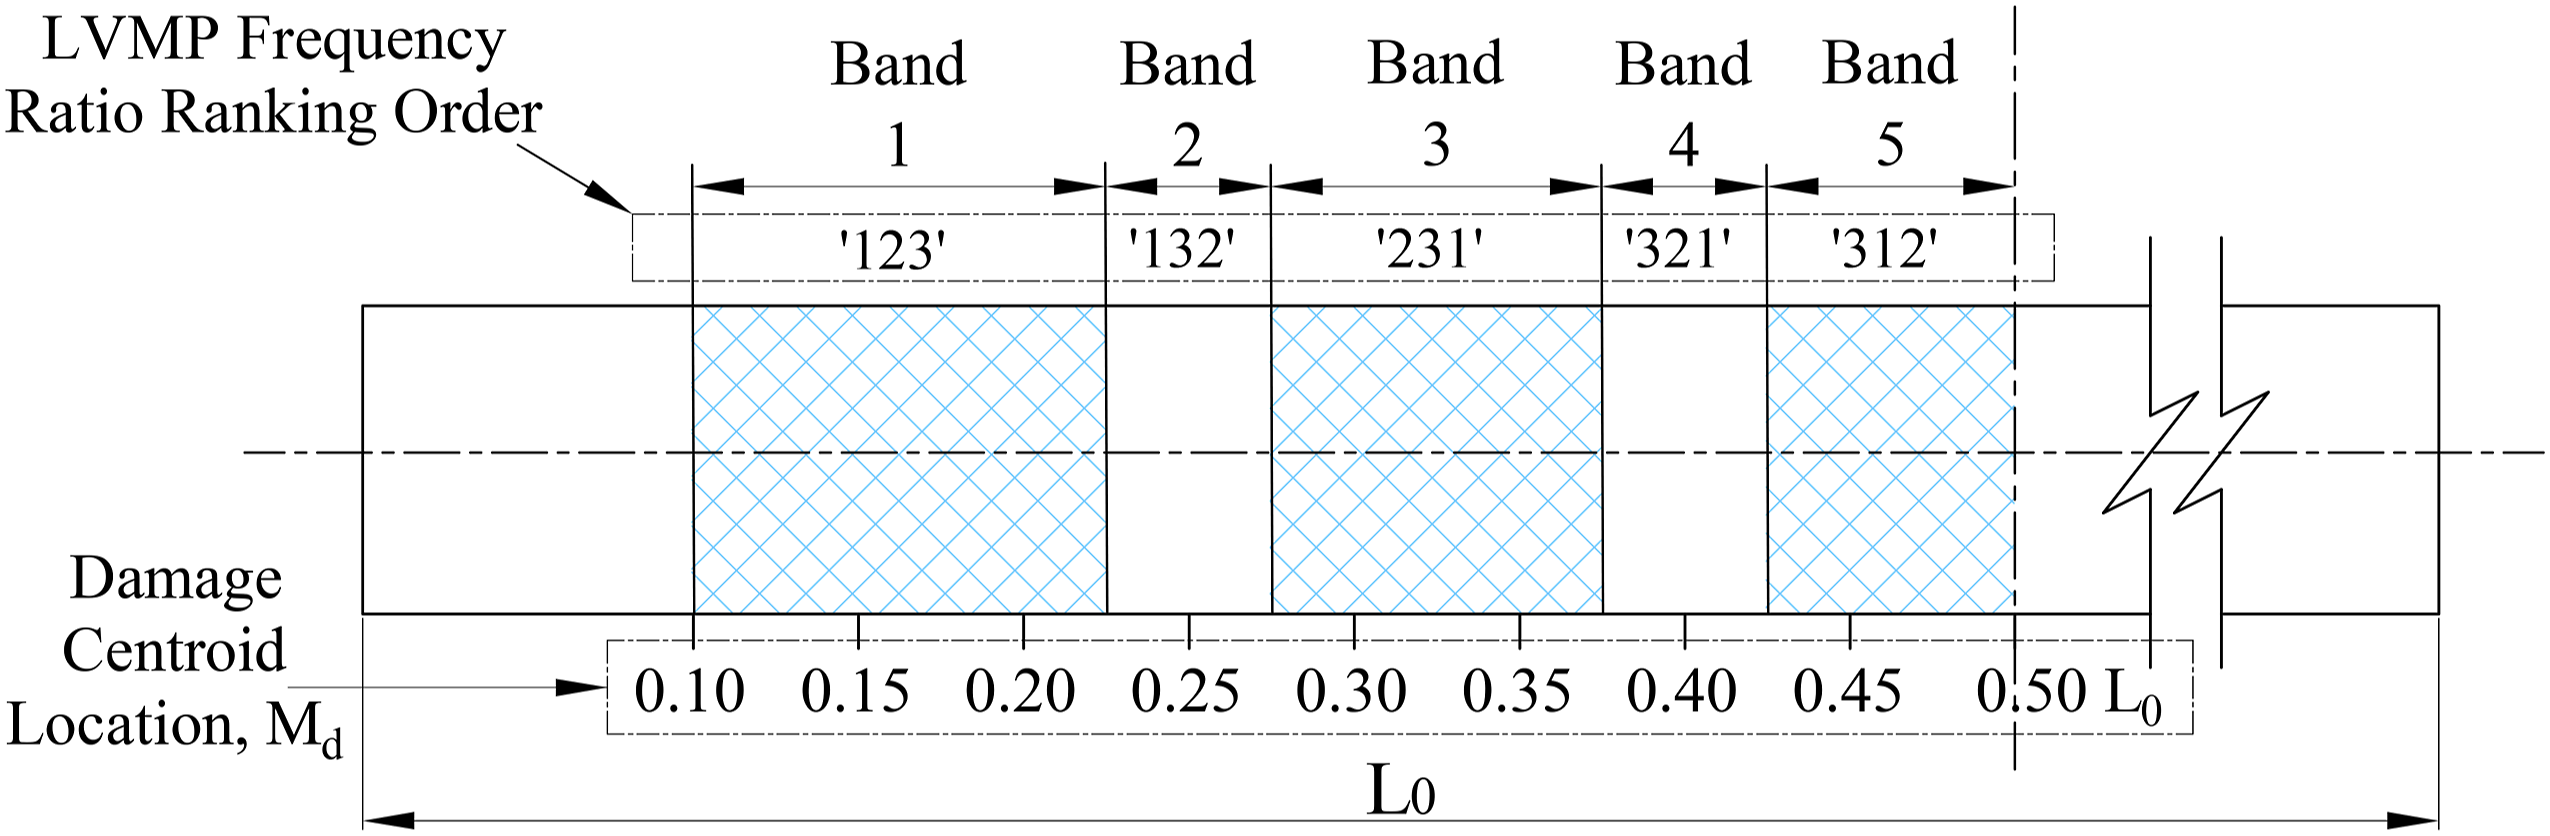
Relations for the other indices (S, A, ψx and ψz) versus LVMP frequency ratios for each damage case in the database per damage location were also evaluated. However, it was found that the goodness-of-fit properties of the linear regression equations for cross-sectional area, A and axisymmetry, ψx were not as correlated as those obtained for V versus LVMP frequency ratio as illustrated for damage at Md = 0.25L0 in Figure 11(a) and (c) respectively. Also, the plot of surface area, S versus LVMP frequency ratio yielded poor relations as indicated in Figure 11(b); however, the longitudinal symmetry, ψz versus LVMP frequency ratio plot in Figure 11(d) shows a consistent relationship implying that longitudinal symmetry can be estimated for a given set of LVMP frequencies, and therefore it is possible to estimate the shift in the pipe Plot of Geometric indices versus LVMP frequency ratios, per vibration mode, i, for damage centroid located at Md = 0.25L0: (a) Cross-Sectional Area Index, A; (b) Surface Area Index, S; (c) Axisymmetry Index, ψx; (d) Longitudinal Symmetry Index, ψz.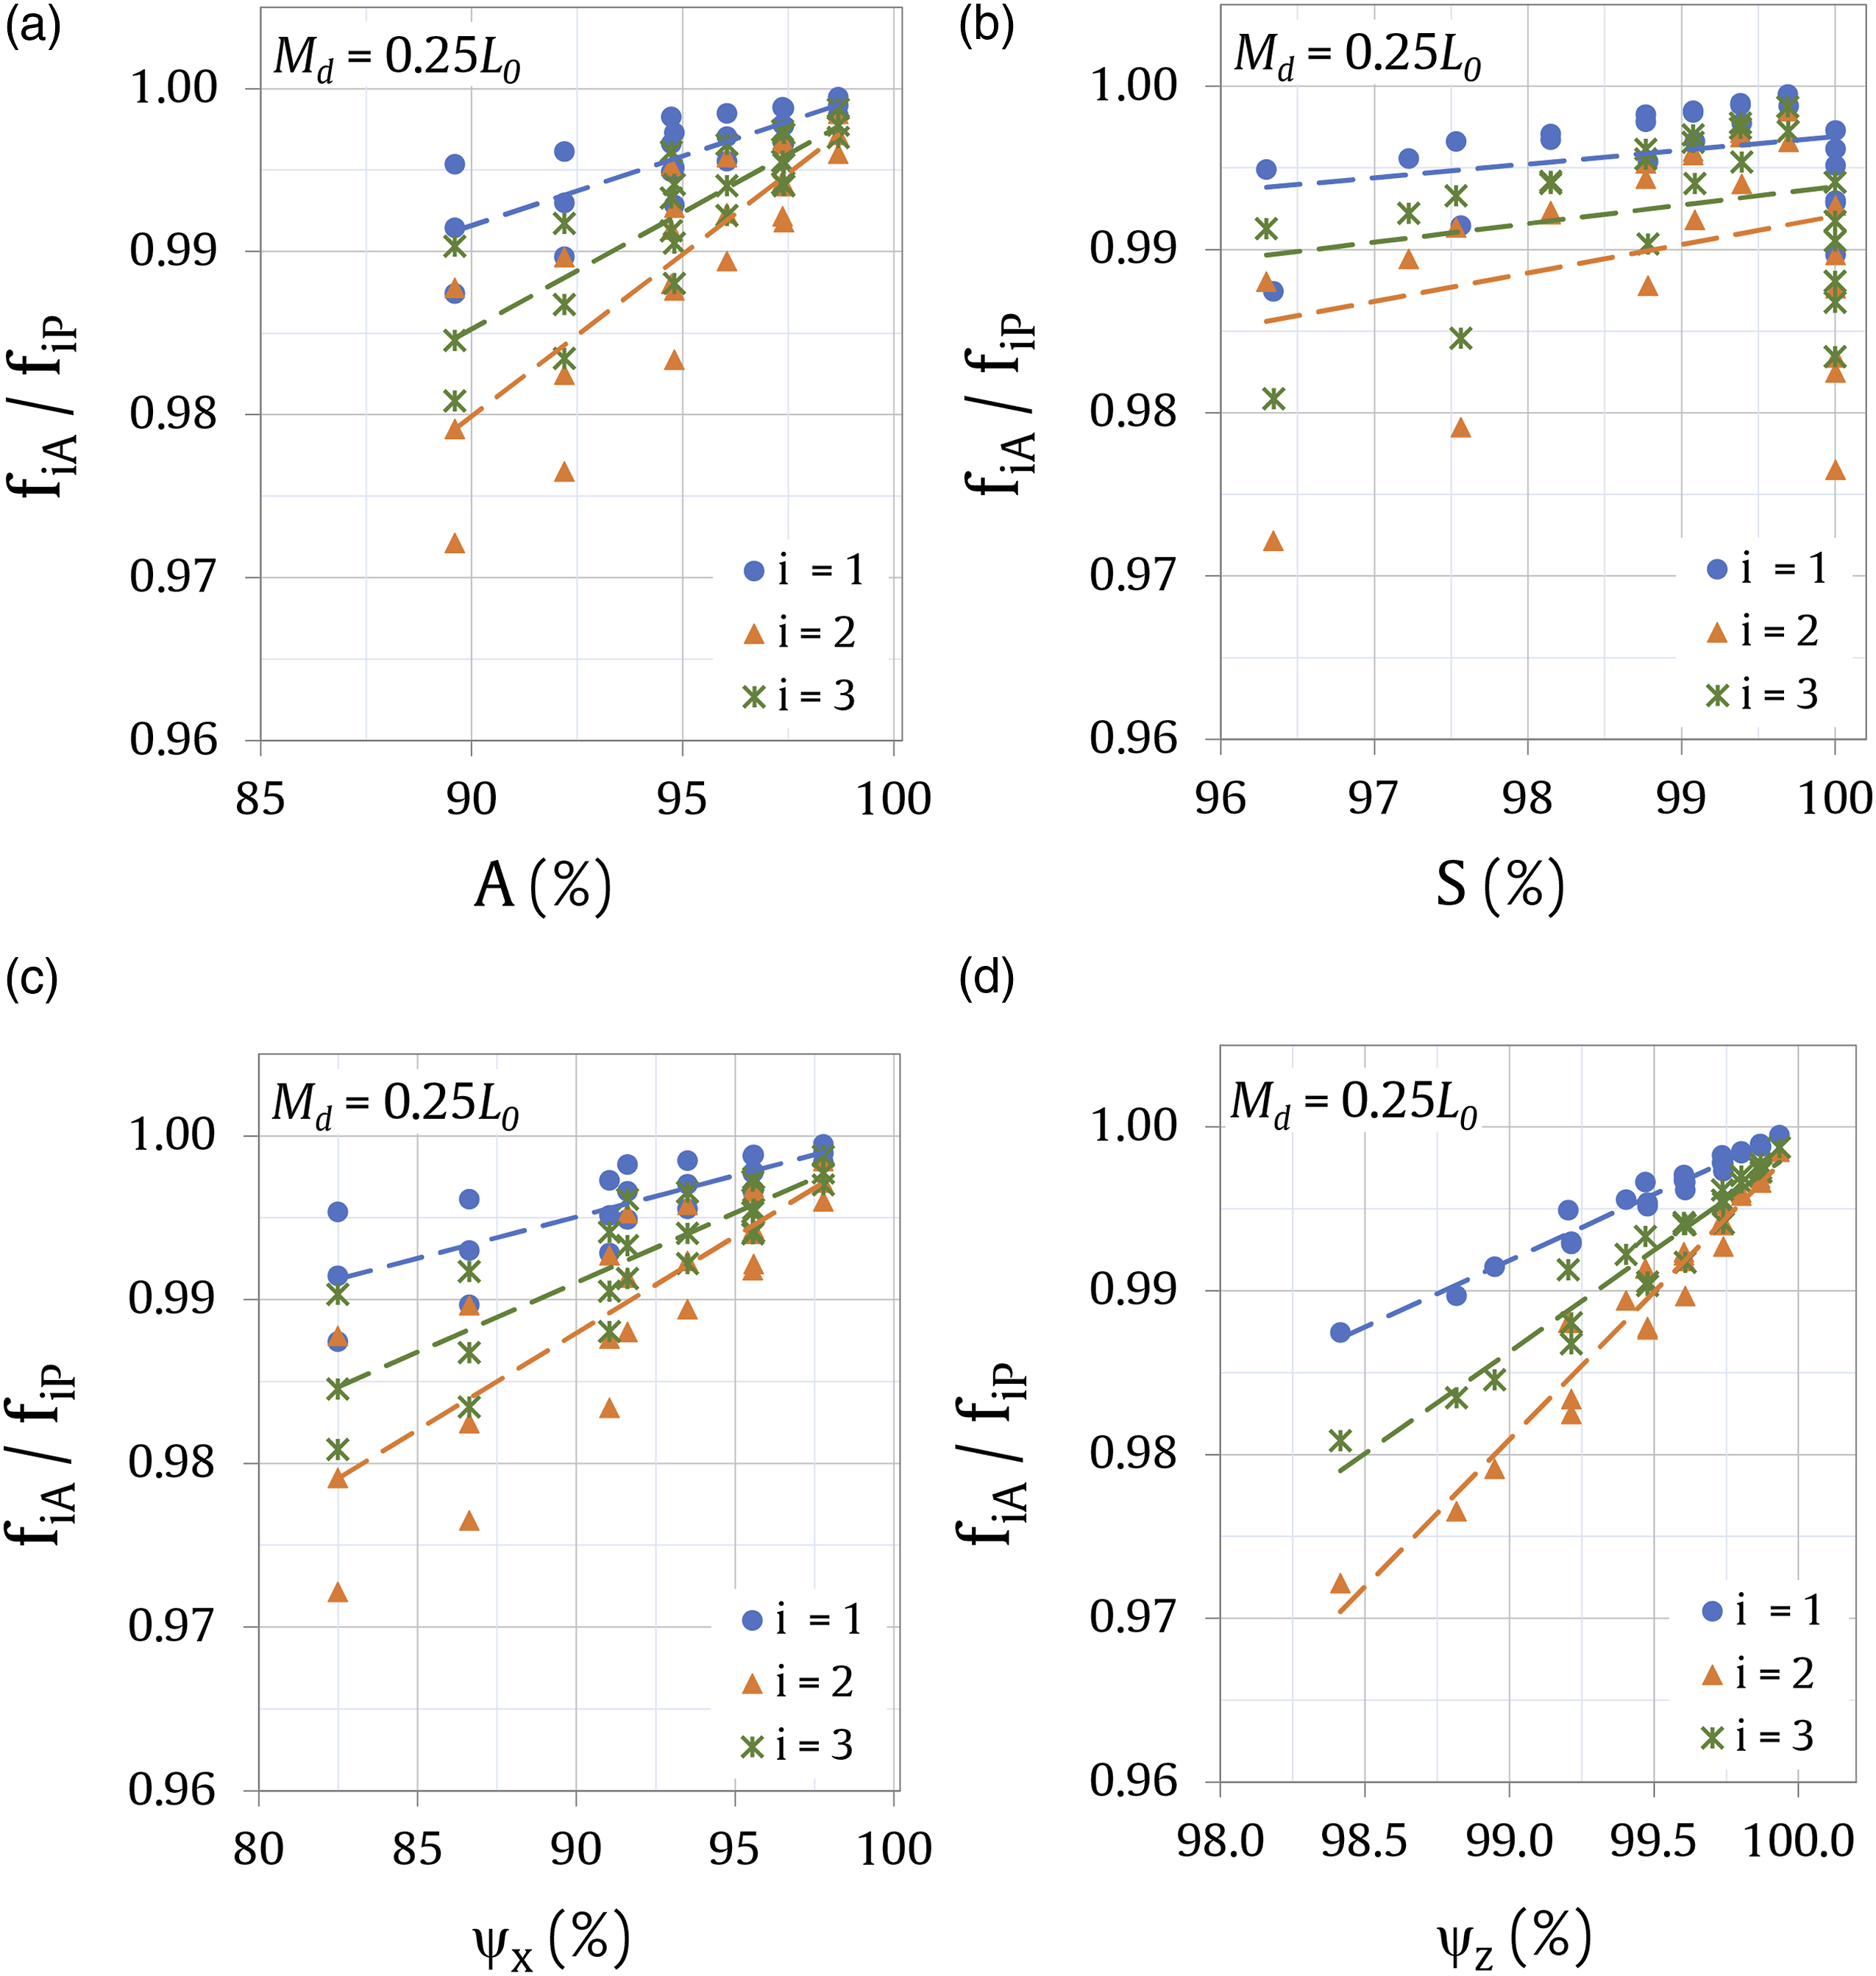
In summary, it is demonstrated that for a set damage test cases, a database of the damage properties, derived geometric indices and LVMP frequencies can be developed. The geometric indices for each case when plotted against corresponding LVMP frequency ratios yield trendline equations (quantification relations) which can be used to initialise damage localisation bands for prediction of the location of the damage centroid and can also be used to quantify the damage. It is also shown that of all the 5 geometric indices, the indices V (related to volume of damage) and ψz (longitudinal symmetry) yielded the most consistent relationship with LVMP frequency ratios. However, in the context of this paper, the main geometric index employed is V which when determined can be used to evaluate the volume of material lost, Vd (from equation (1)), within a previously predicted localisation band as verified numerically and experimentally in the following sections.
Numerical Verification
Test Cases
Boundary limits for random damage variable selection.
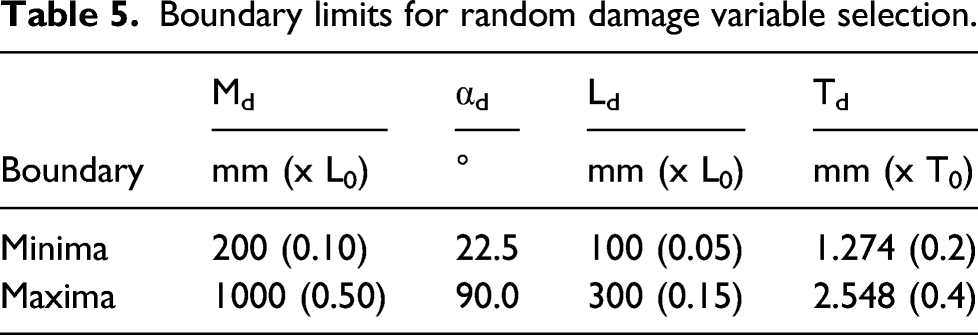
Modal analysis was performed using Abaqus Version 2018 and the output from the analysis comprised of the first three LVMP frequency pairs (i.e. fiA and fiP for i = 1,2,3); these frequencies together with the randomly selected variables for each of the 5 × 100 cases are included in Appendix B. For each case, LVMP frequency ratios were calculated and ranked as described in the Geometric damage indices section. Also, the actual location of the damage centroid, Md, and actual volume of the damaged pipe, V, in each case were derived from the randomly selected variables in each case for comparison with the predicted values.
Numerical Damage Identification
All of the 500 cases were employed in the verification exercise with the aid of the localisation bands and quantification relations pre-established in the Application of Proposed Method section. The full set of verification results (i.e. detection, localisation and quantification accuracies) including the derived quantities for each case are included in Appendix B.
Level 1(Detection)
The accuracy of the method in level 1 identification denoted α1 is determined according to equation (10)
Level 2 (Localisation)
Damage localisation verification results.
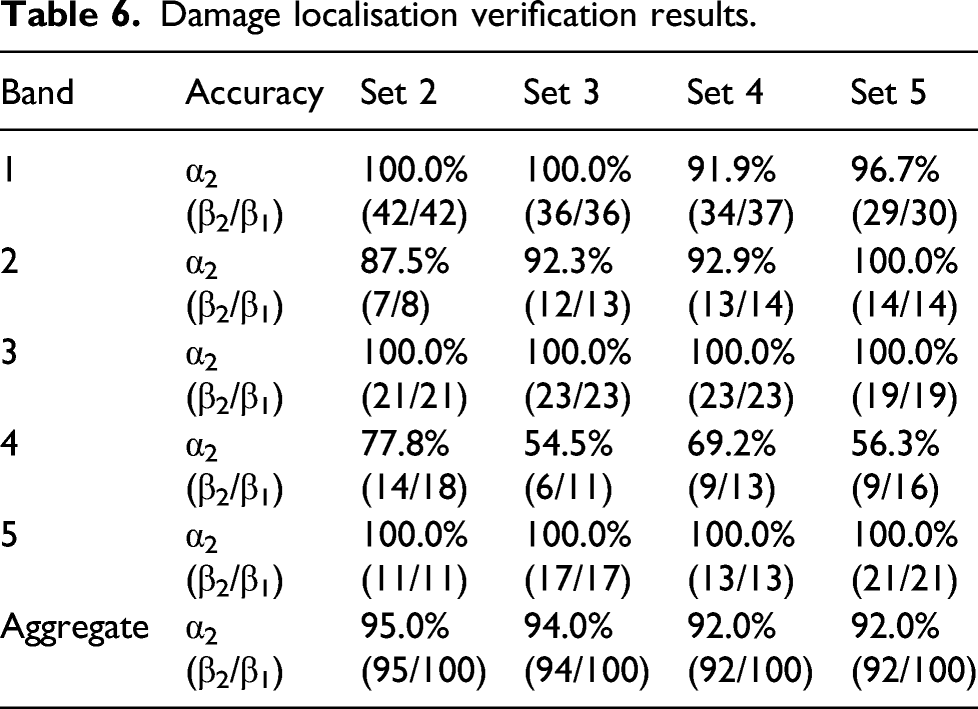
In Table 6, it obvious that the localisation results for Bands 2 and 4 are less accurate than the other bands. This is because their bandwidths are relatively narrower than the bandwidths of other localisation bands (see Table 4). In cases where localisation failed, such as in Band 4, the method incorrectly predicted the damage centroid to fall within a neighbouring band (i.e. 3 or 5) which have broader bandwidths or the frequency ratio ranking order obtained could not be related to any of the pre-established localisation bands.
Level 3 (Quantification)
To verify the method Plots of actual versus predicted volume of damaged pipe per localisation band. (a) Band 1, Md = 0.10L0, (b) Band 1, Md = 0.15L0 (c) Band 1, Md = 0.20L0, (d) Band 2, Md = 0.25L0, (e) Band 3, Md = 0.30L0 (f) Band 3, Md = 0.35L0 (g) Band 4, Md = 0.40L0 (h) Band 5, Md = 0.45L0 and (i) Band 5, Md = 0.50L0.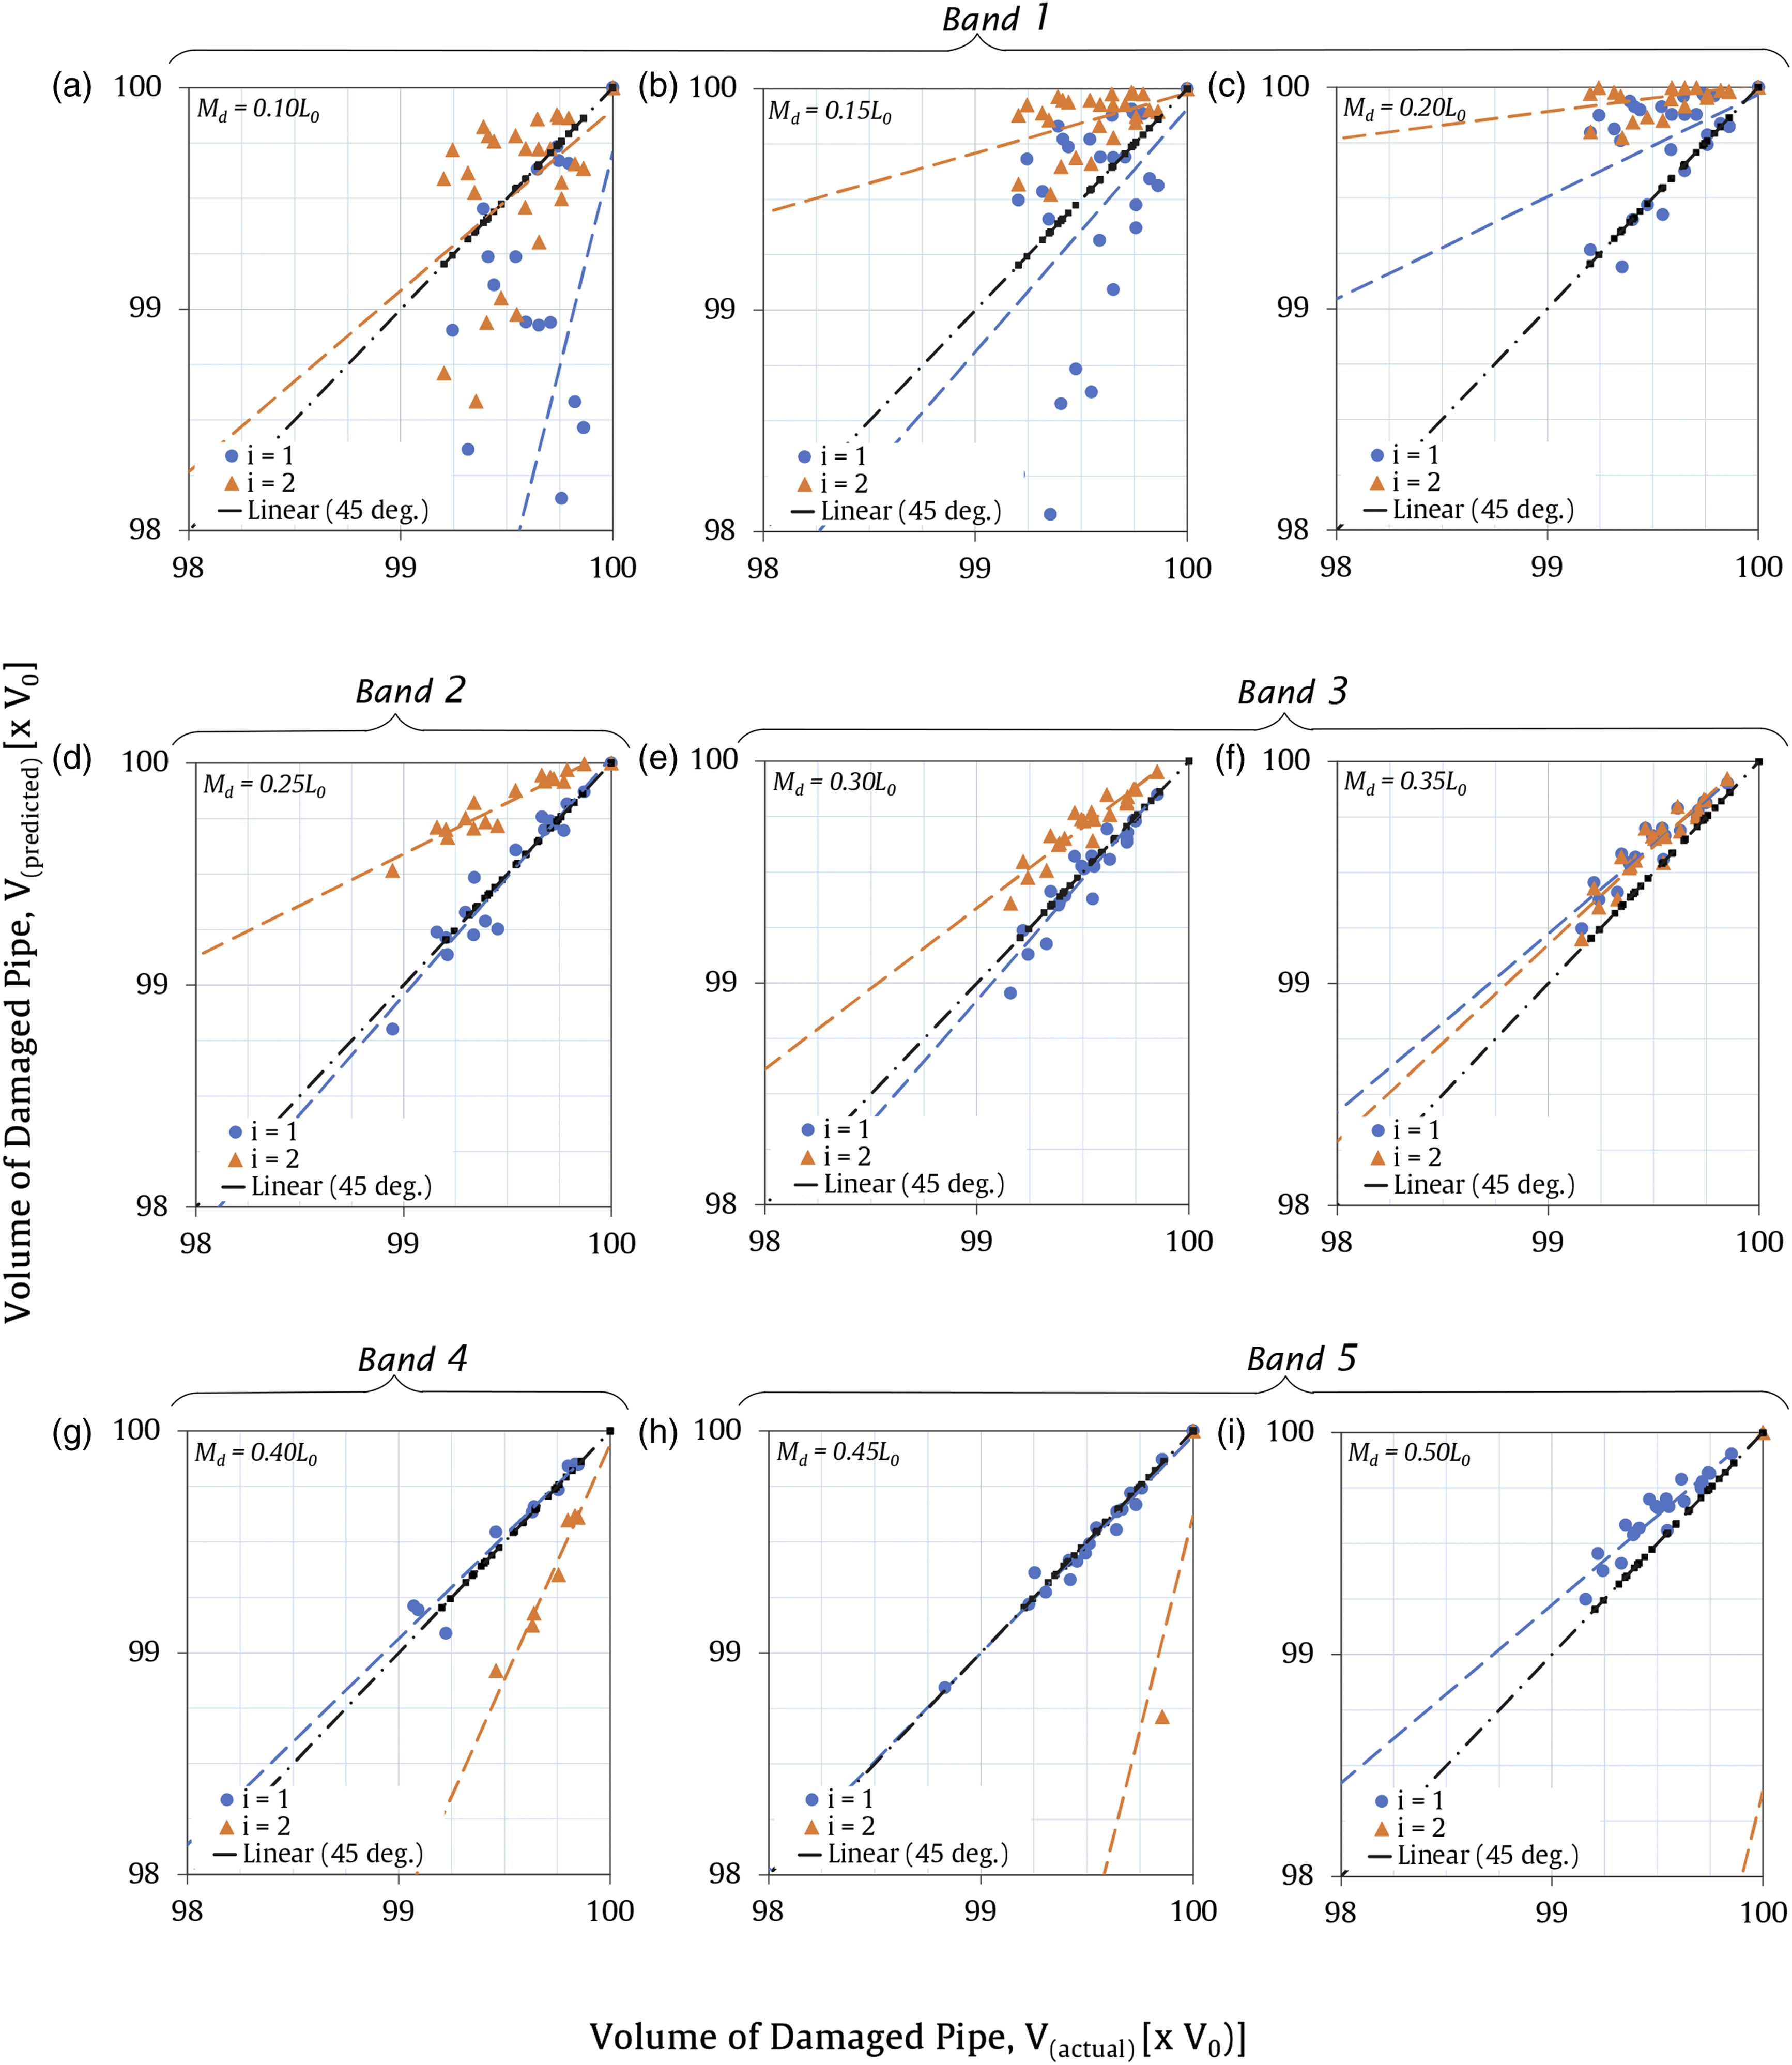
In most bands, it was found that the plots for vibration mode 1 were more closely related to the 45-degree line than the plots corresponding to vibration mode 2, implying that vibration mode 1 is likely to yield more accurate quantification results. Thus, it was decided that only vibration mode 1 is employed for quantification and in localisation bands with multiple relations/plots, the aggregate (average) of all relations within the band were adopted.
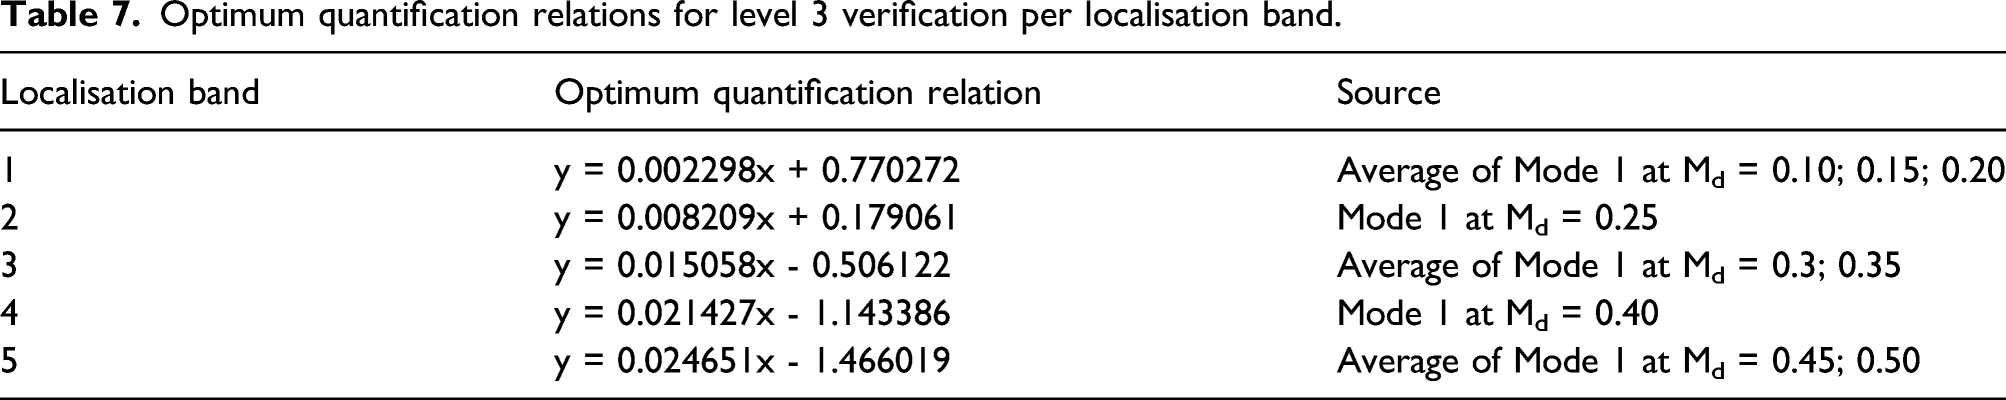
Therefore, from the sensitivity analysis, the final set of quantification graphs and relations which were deemed likely to provide the optimum quantification estimates per localisation band are presented in Figure 13 and listed in Table 7, respectively. These graphs/relations are employed in verification of the proposed method for level 3 identification (in the remaining 4 sets of 100 test cases). Optimum quantification graphs for level 3 verification for damage located at (a) Band 1, (b) Band 2, (c) Band 3, (d) Band 4 and (e) Band 5 Optimum quantification relations for level 3 verification per localisation band.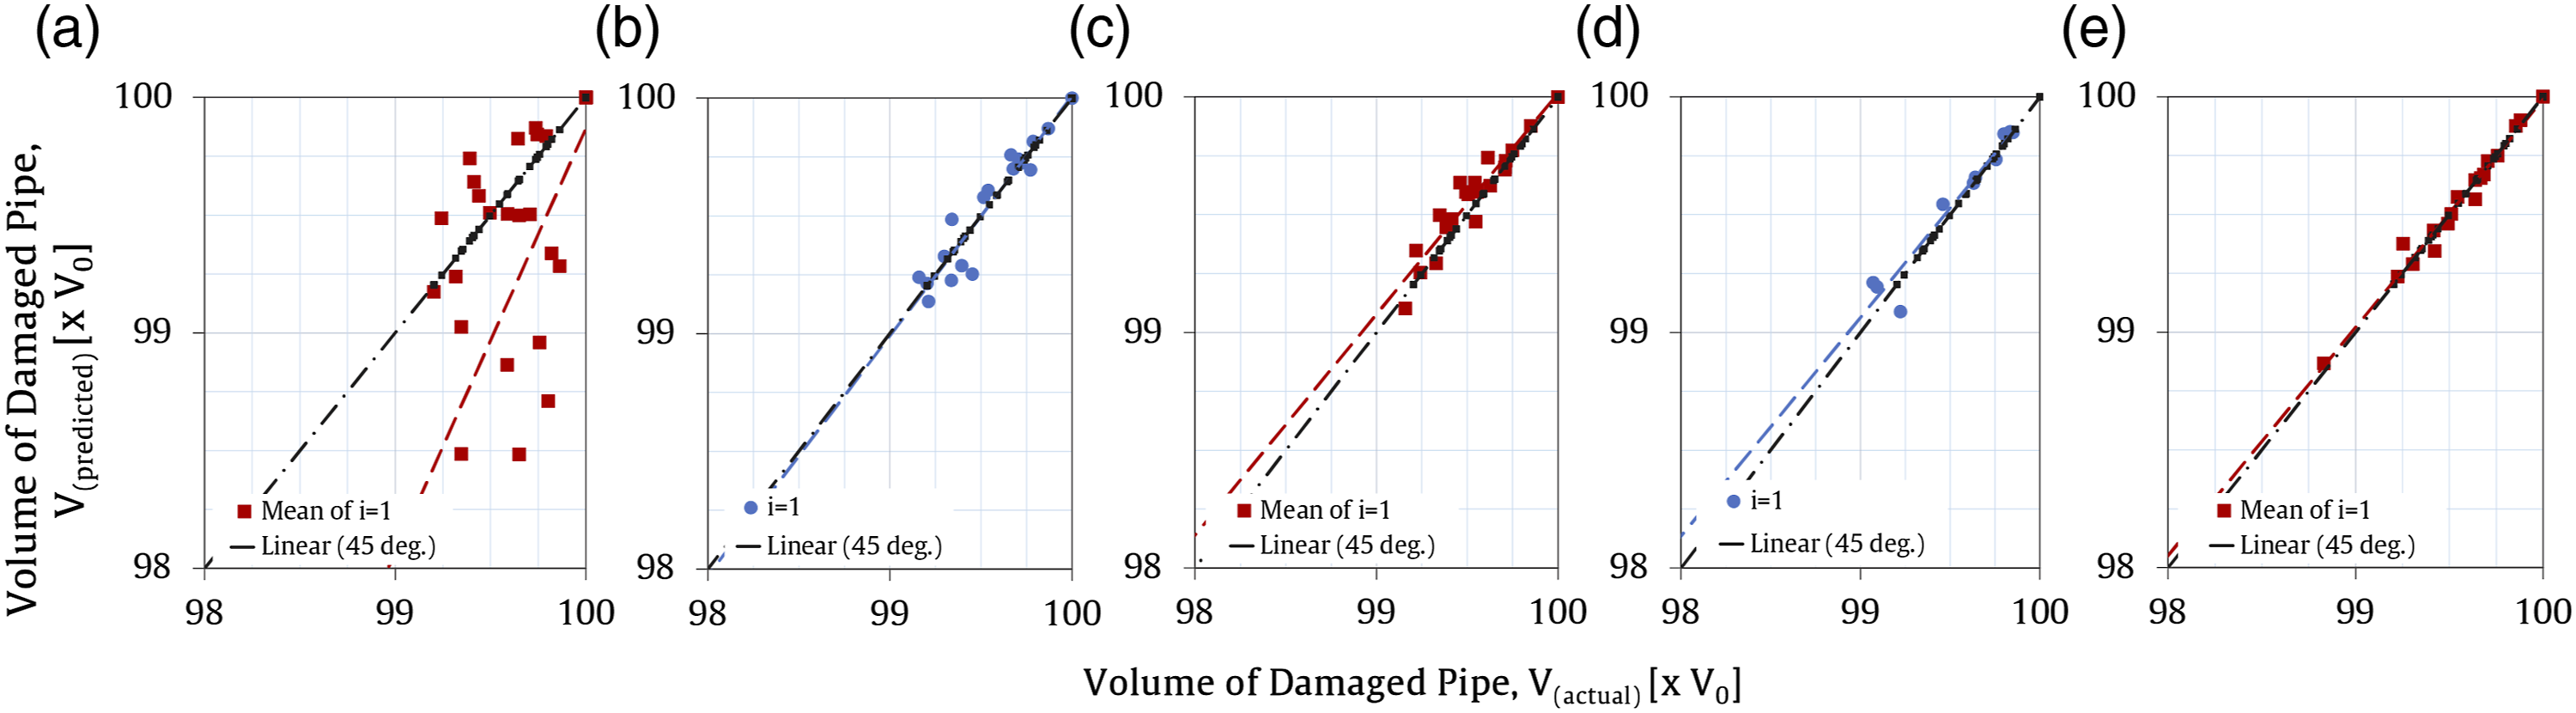
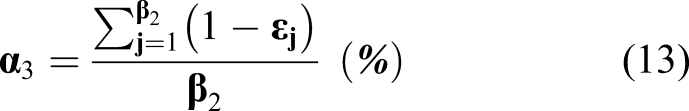
To estimate the degree of accuracy of the method in level 3 identification, the error margin, ε per case, j is first calculated according to equation (12)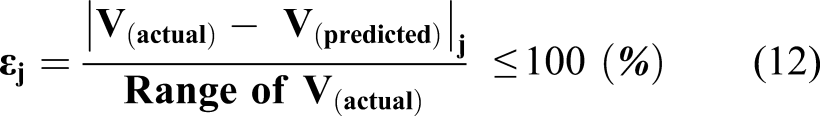
Damage quantification verification results.
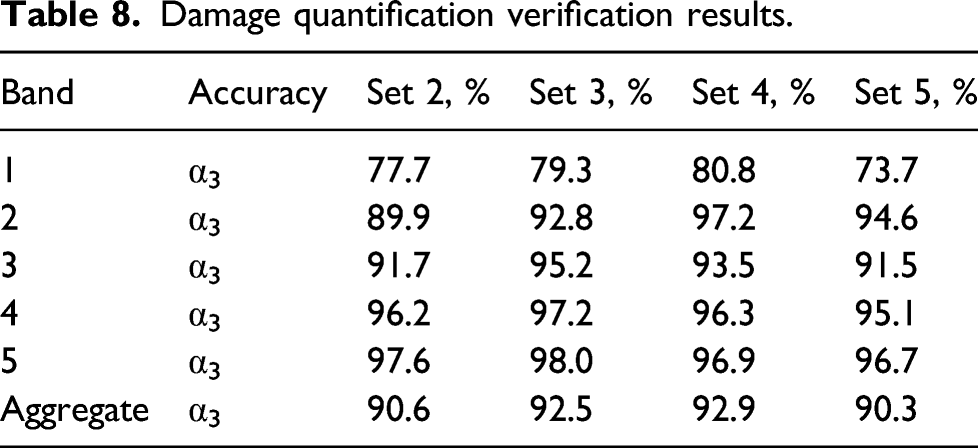
As expected, the quantification accuracy for damage within Band 1 is slightly less than within other bands which concurs with Figure 13, evidently due to the optimum relation for Band 1 in Figure 13(a) being less correlated to the actual damage quantity as compared to other bands in Figures 13(b)–(e).
Experimental Verification
Test Specimen
In this section, the proposed method is verified using experimental data from a previous study. 27 The specimen, test details and modal analysis results are briefly described before performing the damage identification in accordance to procedure described in Damage database sub-section and based on the pre-established localisation bands and the derived optimum quantification relations (from Figure 10 and Table 7, respectively).
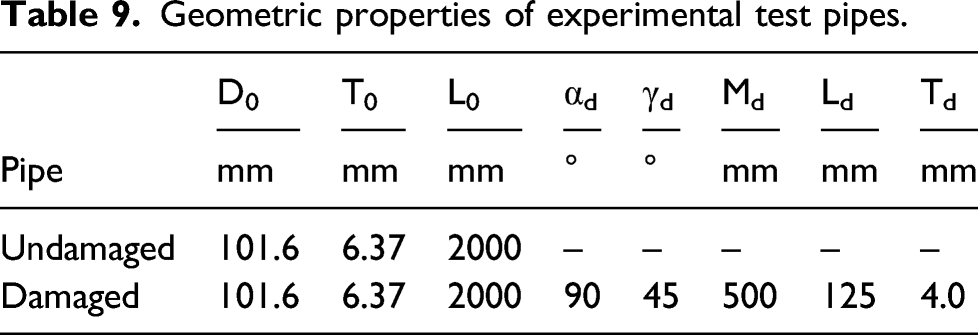
Geometric properties of experimental test pipes.
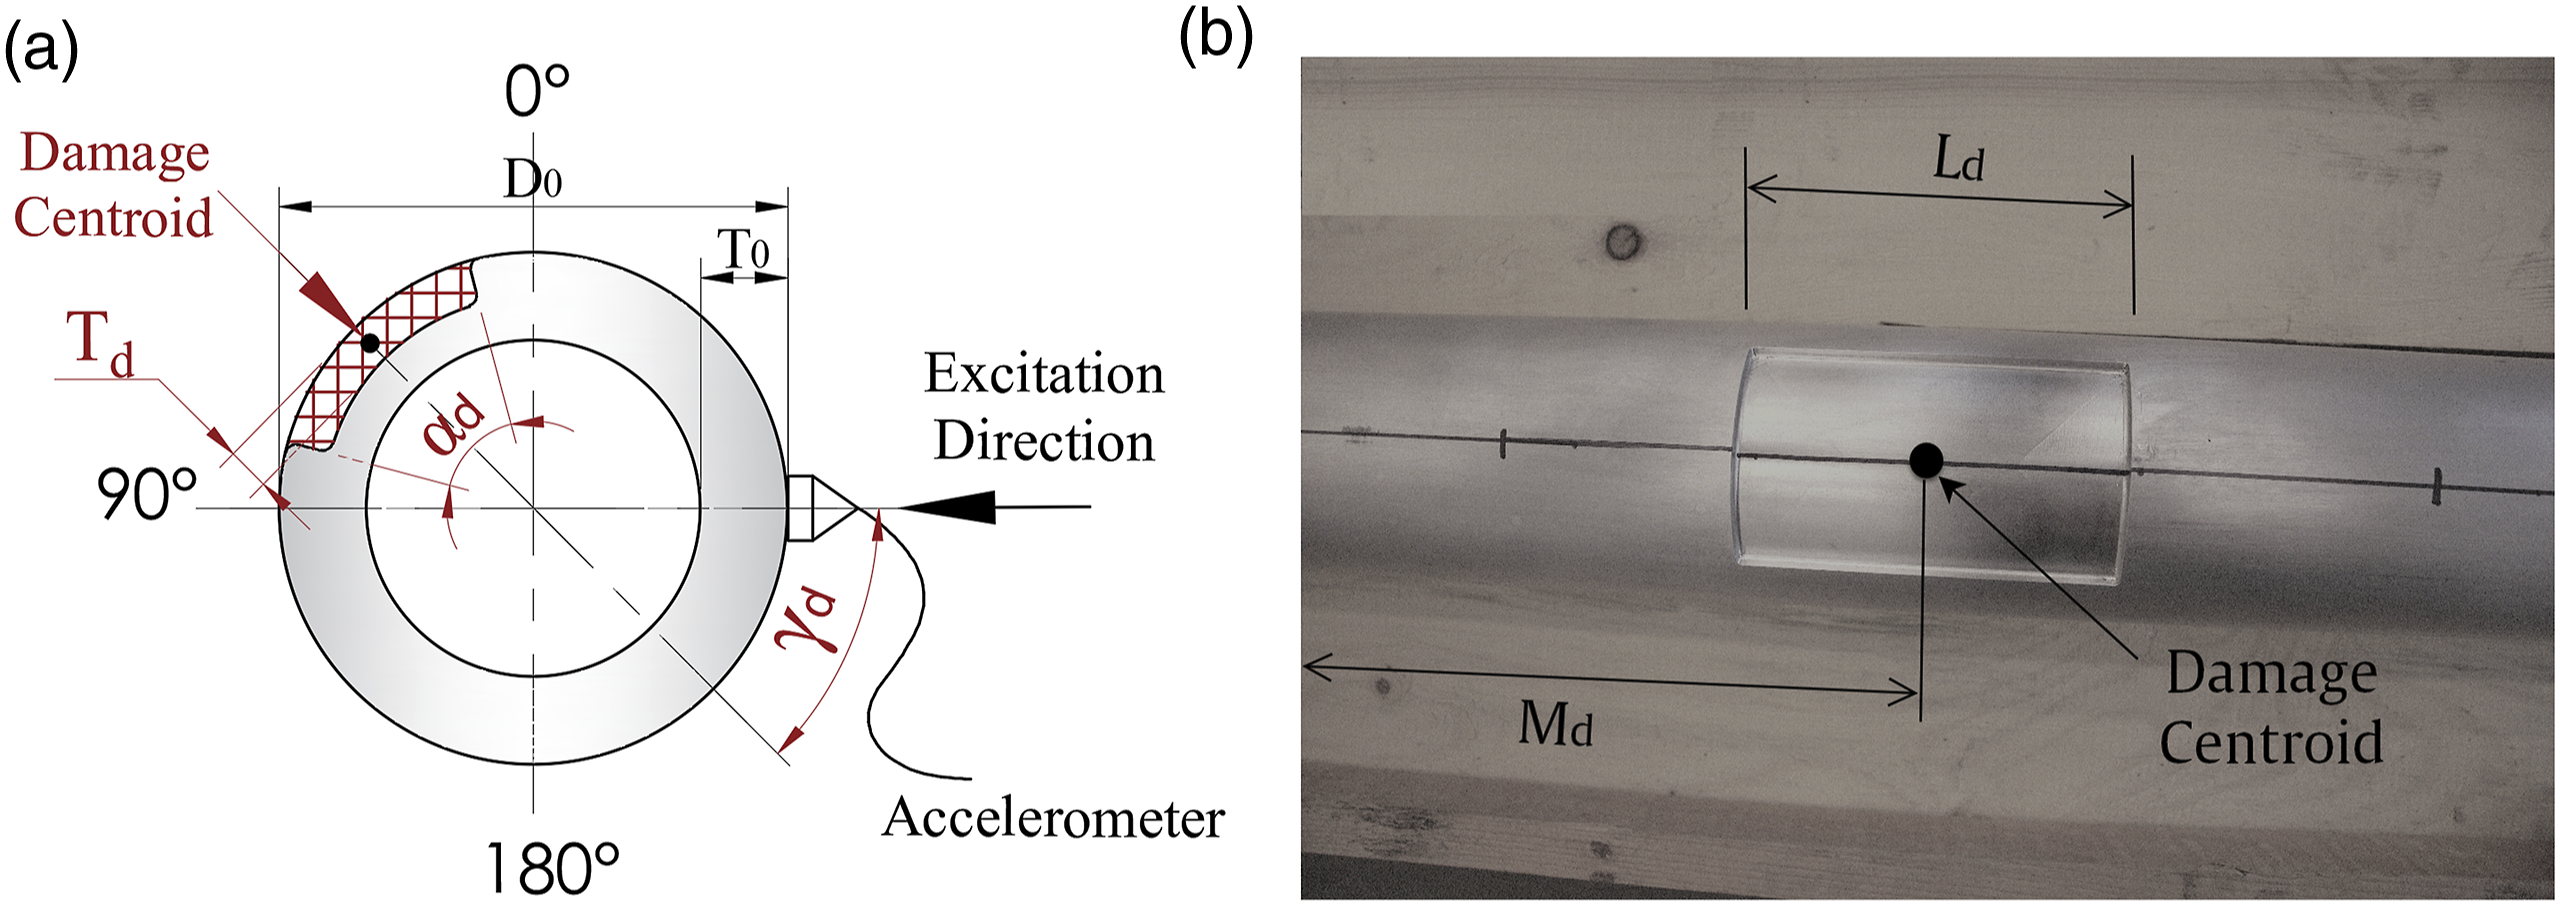
Experimental test pipe: (a) cross-Sectional damage dimensions and excitation details; (b) artificially inflicted corrosion-like damage and its longitudinal dimensions.
Test Setup and Procedure
The test data acquisition system comprised of seven uniaxial accelerometers, Model 256-100 by Endevco, USA (Figure 15(a)), which were attached to the pipe at distances 5, 340, 640, 1000, 1360, 1660 and 1995 mm from the left end of the pipe. The other ends of the accelerometers were connected to seven channels of Chassis cDAQ-9178 by National Instruments, USA (Figure 15(b)). One channel of the Chassis was reserved for connection of the modal hammer, No. 2304 by Endevco, USA (Figure 15(c)). Data acquisition system: (a) accelerometer, (b) chassis and (c) modal hammer.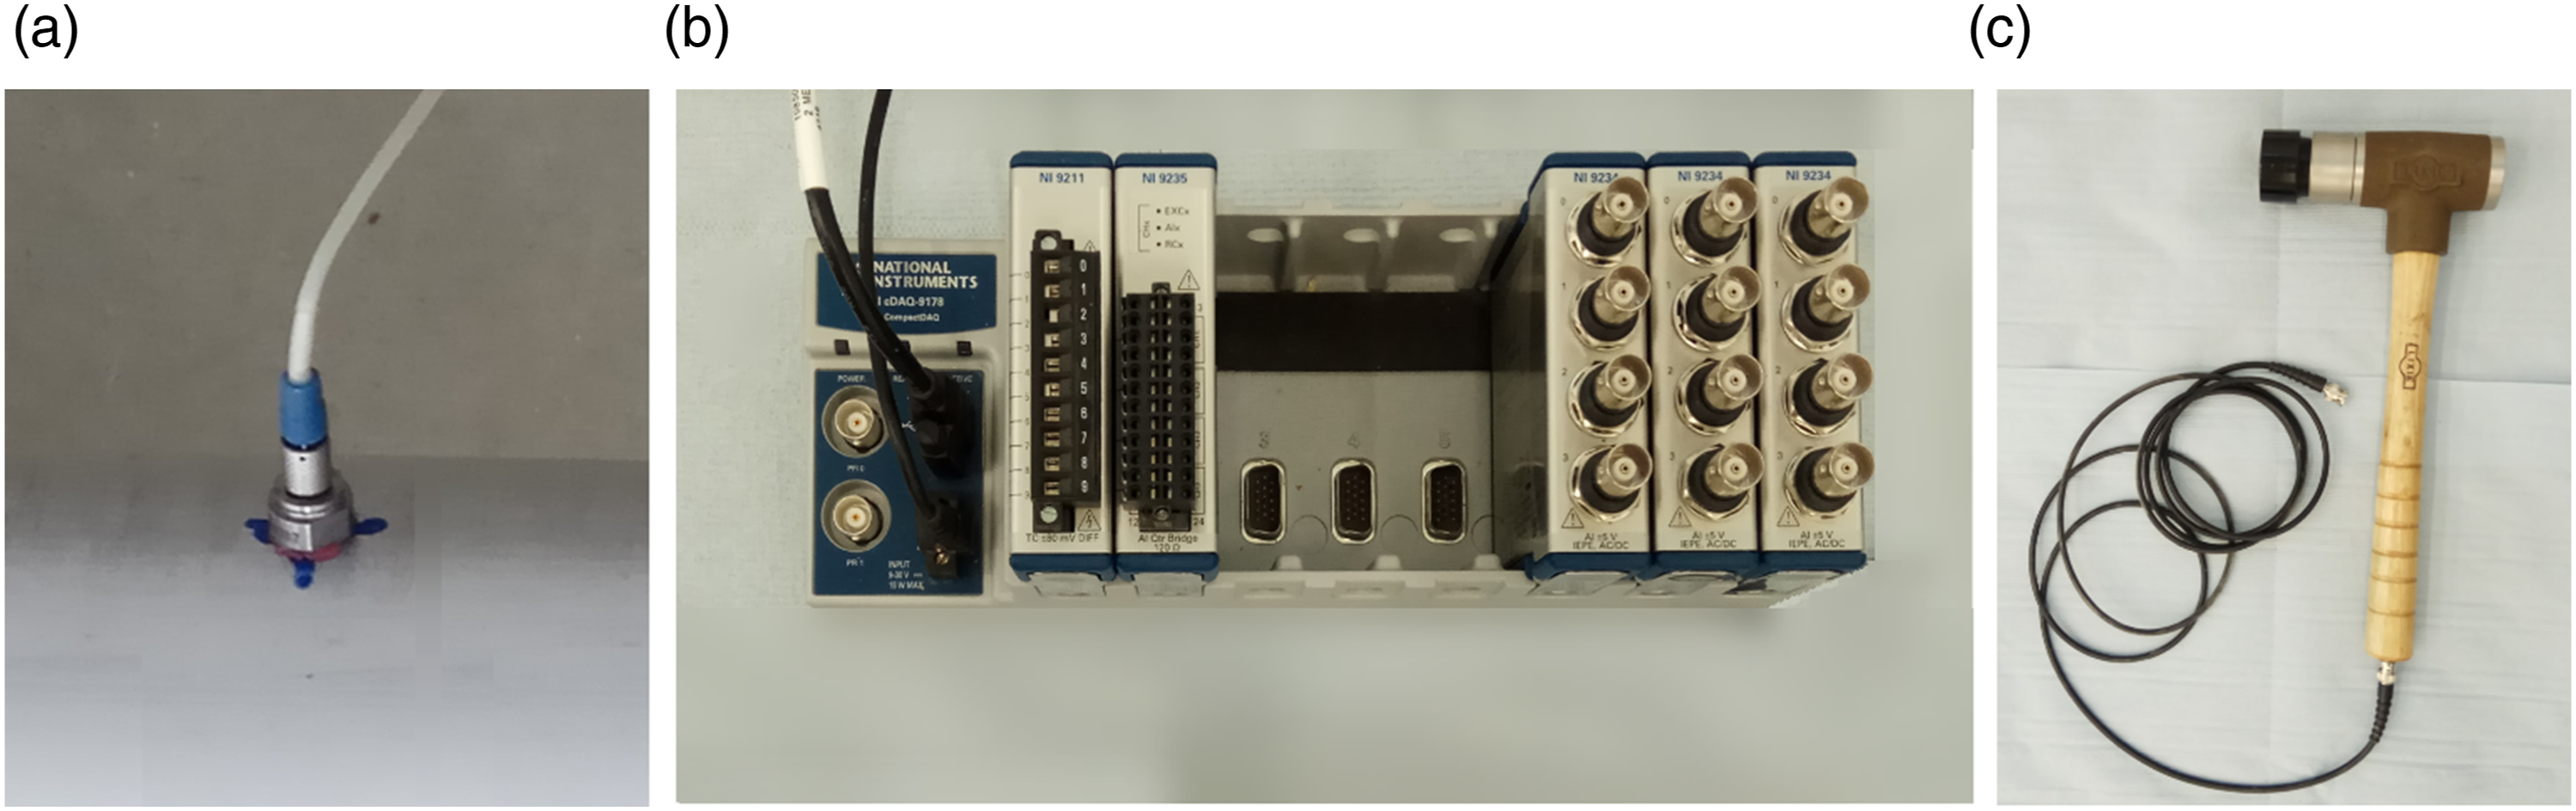
Each specimen was suspended by tension springs (LE 075 × 104 S by Lee Springs, UK) to simulate free-free boundary conditions as shown in Figure 16. Excitation of the pipe was performed in the 270–90° direction circumferentially with respect to Figure 14(a) and around the centre of the pipe longitudinally. For each pipe, the excitation was performed seven times and the acquired signals were analysed. Details of the modal test and analysis including sampling data, hammer hit intensity, FRF aggregation, vibration mode validation, and noise minimisation techniques are discussed in the source article.
27
Experimental test setup showing location of accelerometers along the damaged pipe which is suspended with free-free boundary conditions.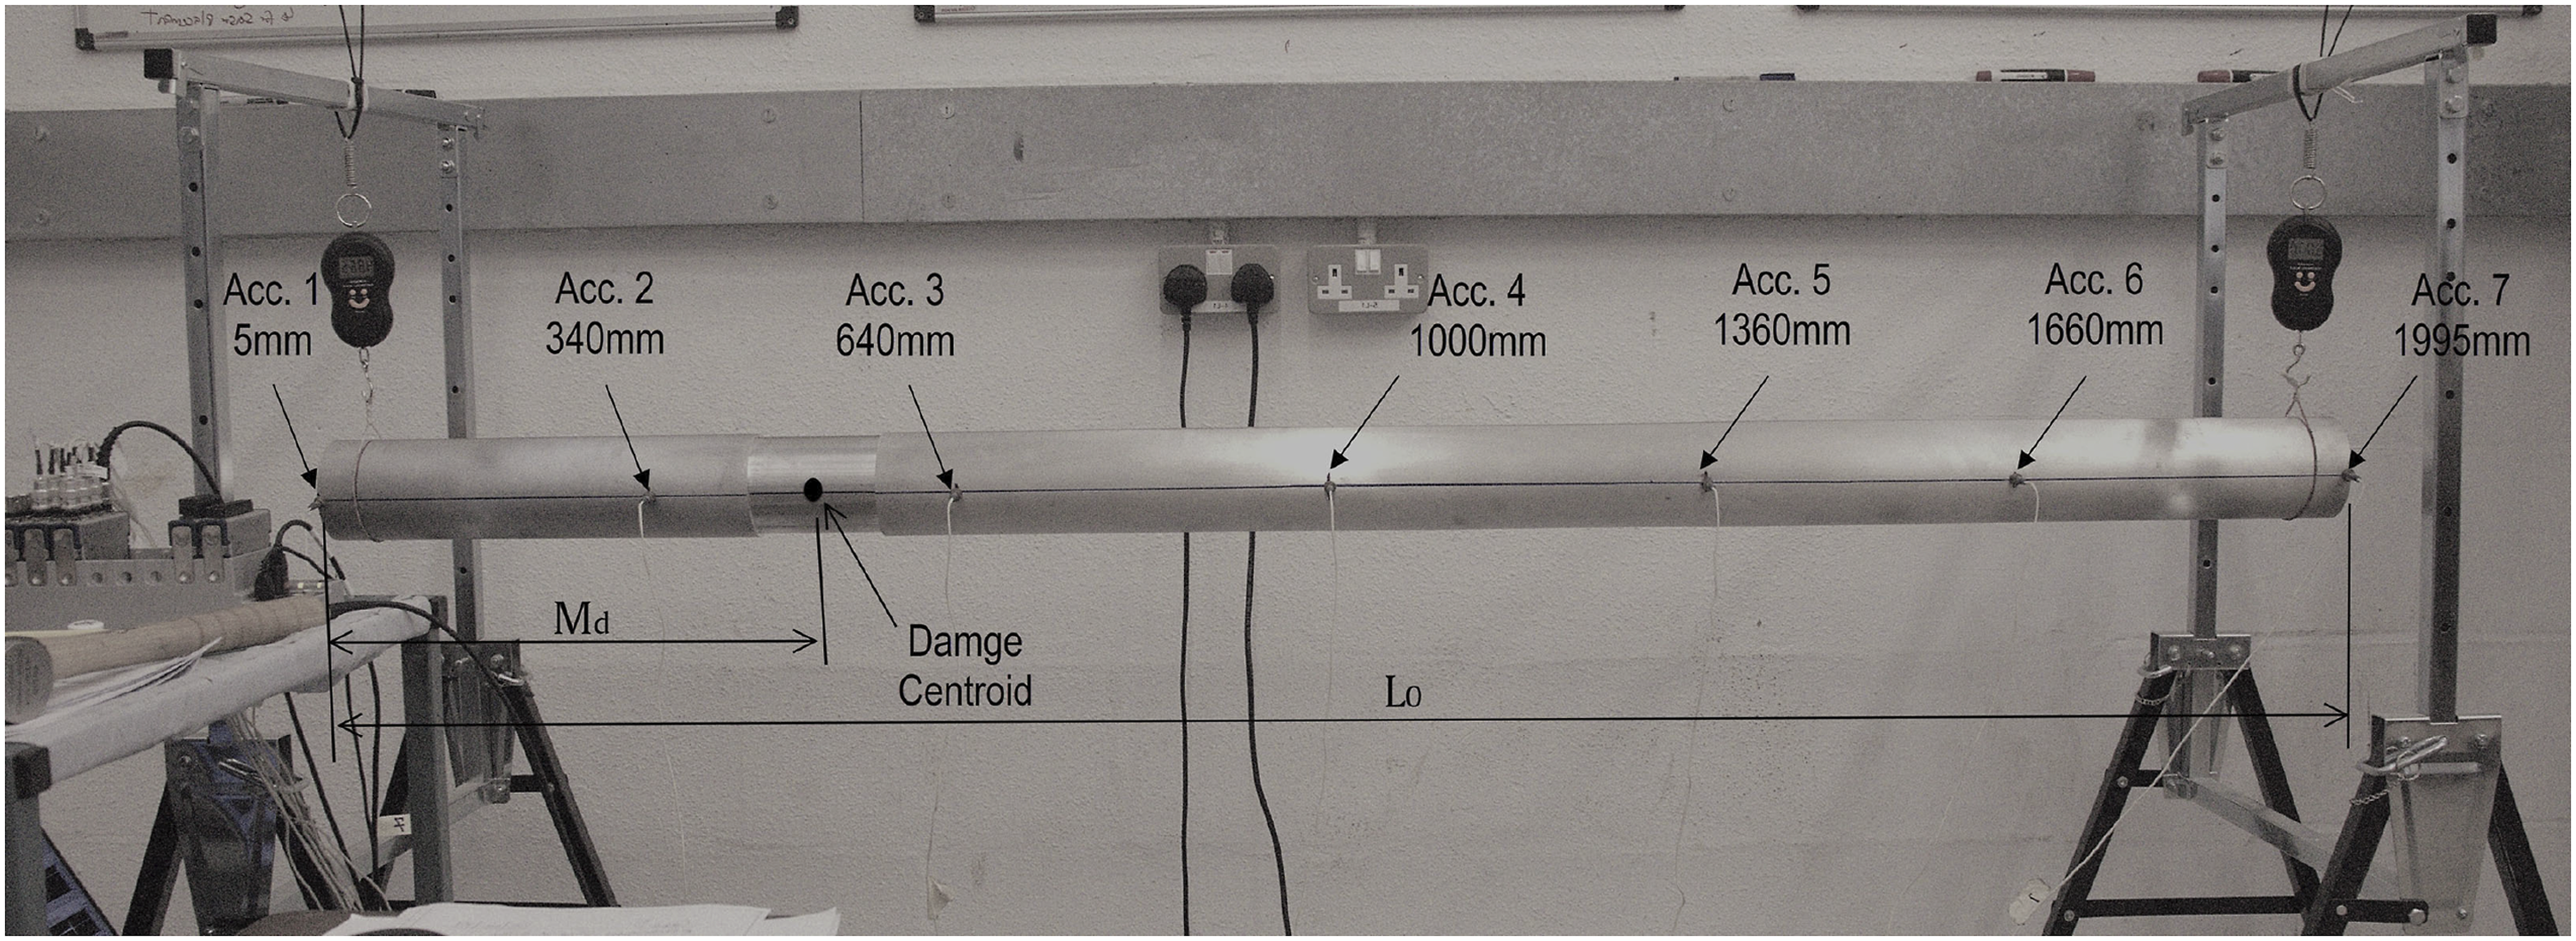
Modal Analysis Results
The frequency response functions obtained from analysis of the test data are shown in Figure 17 where it is obvious that only a single peak exists in the first two vibration modes of the undamaged Pipe (Figure 17(a)). Frequency response functions from (a) undamaged pipe and (b) damaged pipe.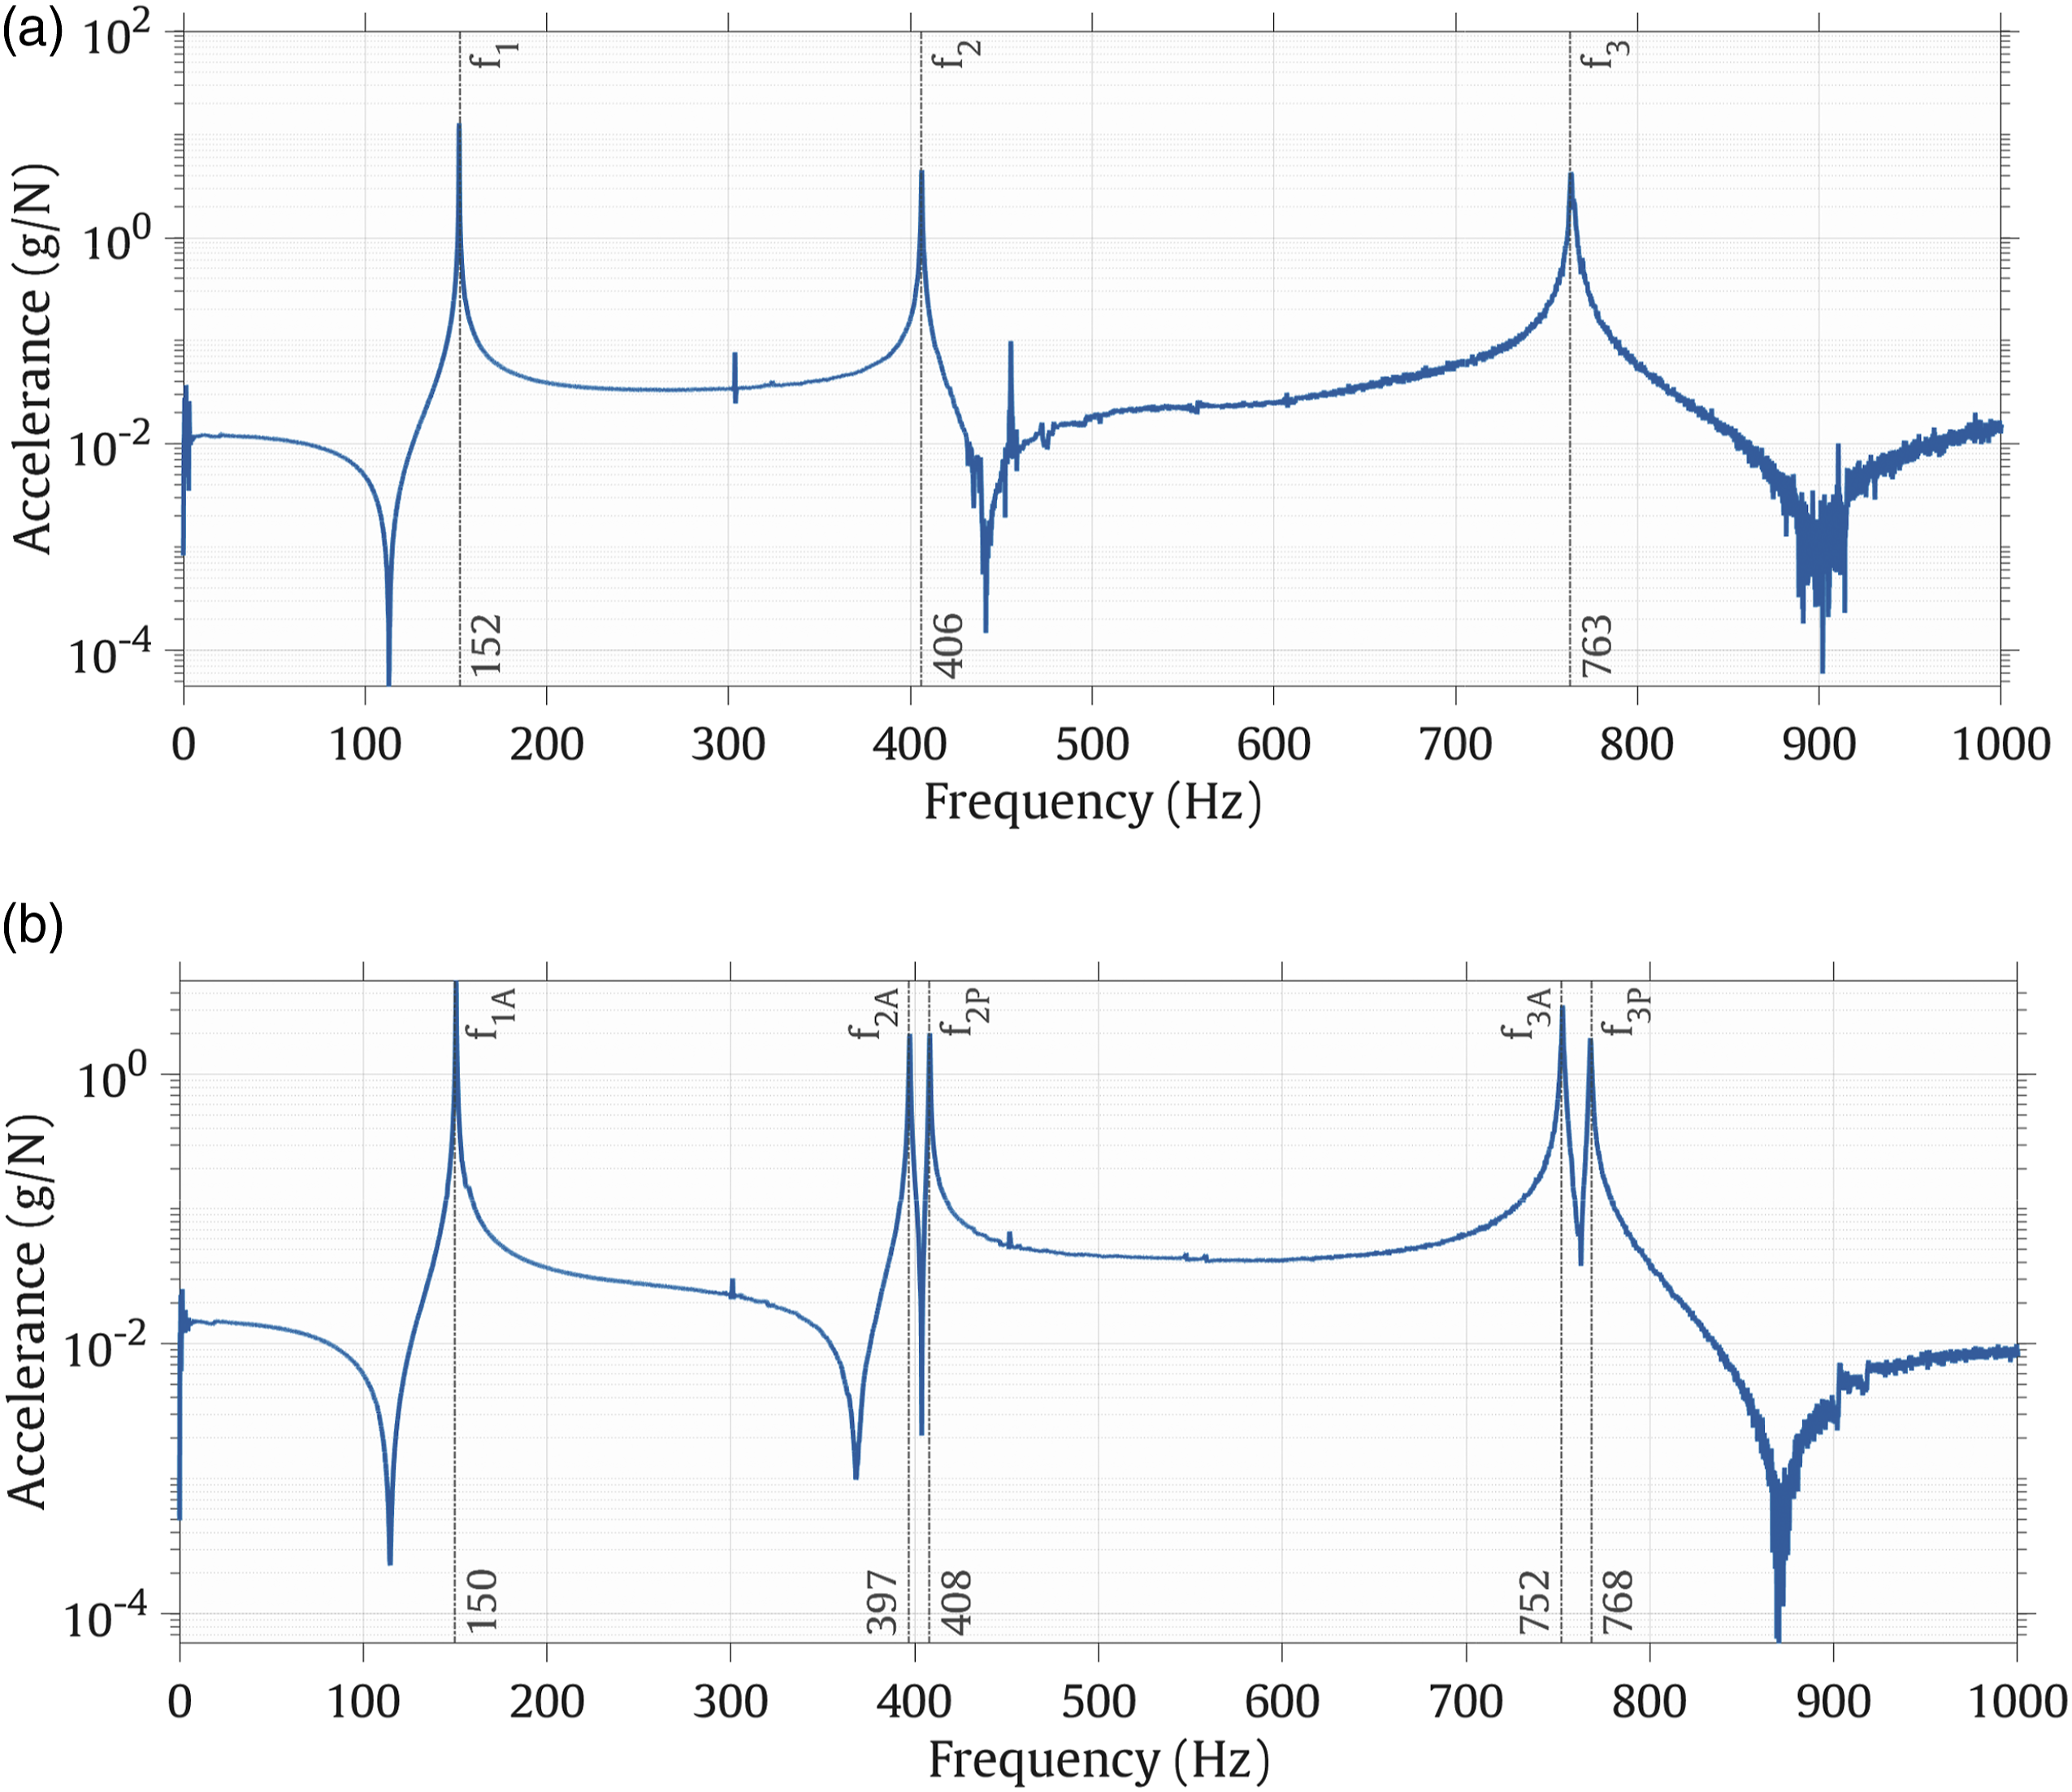
Experimental modal frequencies and LVMP frequency ratios.
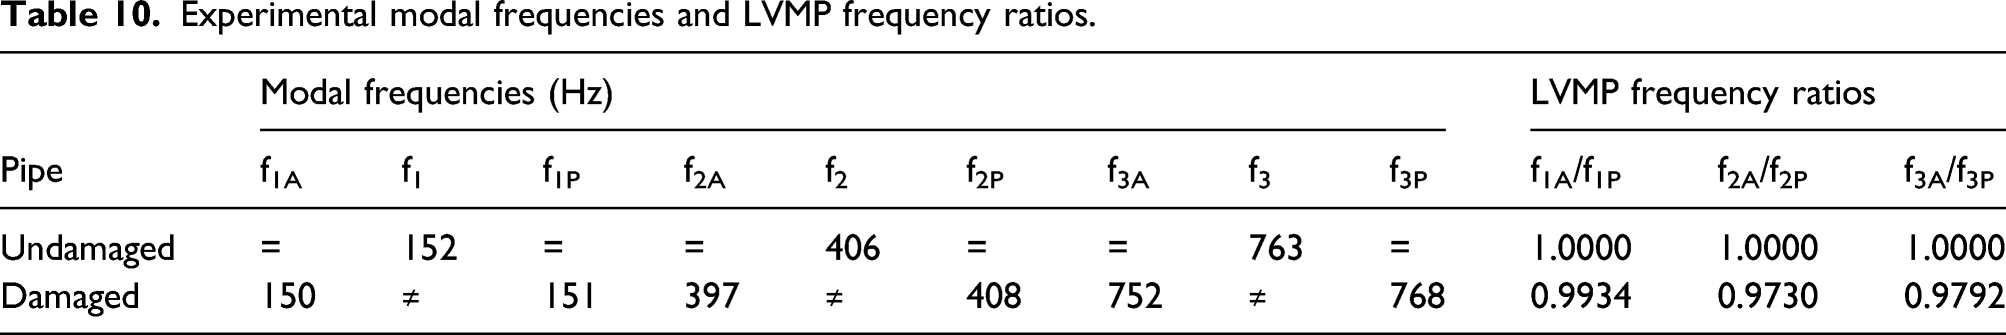
The numerical modal frequencies of the undamaged pipe, that is, 151, 404, and 761 Hz (Table 2), are almost identical to their experimental counterparts 152, 406, and 763 Hz (Table 10), implying that the numerical and experimental processes yield consistent results and can therefore be entrusted.
Experimental Damage Identification
From Table 10, it is obvious that damage is detected in the damaged pipe given that the fiA/fiP ratios are less than 1.00 in at least one of the vibration modes. Furthermore, it can be seen that the passive LVMP frequencies are very close to the undamaged frequencies which concurs with the previous presumption that passive LVMP modal properties are relatively insensitive to damage and can therefore be used in lieu of undamaged modal properties for baseline-free identification.
For localisation, the LVMP frequency ratios of the damaged pipe given in Table 10 are assigned the ranking order
To quantify the damage in terms of volume of material lost, reference is made to Table 7 for the optimum quantification relation corresponding to Band 2. The equation is identified as
It is important to note that the depth (thickness) of the damage in the pipe is 4.0 mm which is beyond the 2.5 mm limit of Td in the database (see Table 3); nonetheless, the quantification prediction was still accurate which demonstrates the capability of the method in quantifying damage even when the damage properties are beyond the limits of the properties used in developing the database.
Appraisal
Based on the verification results, we summarise the study by highlighting the advantages of the proposed damage identification method, discussing some of its limitations and identifying areas which can be investigated further to enhance its applicability.
Advantages: • The method is baseline-free; that is, it does not require modal properties of the undamaged structure for damage identification. • The numerical database needed for the proposed methodology uses physics-based features of the damaged scenarios, in contrast to data-driven methods which normally use data-driven features.36,37 Therefore, the feature extraction step of the proposed method is more consistent (not affected by available data/scenarios). • Detection, localisation and quantification of damage (level 3 identification) is achievable to a high degree of accuracy. • The method can be incorporated into a practical condition monitoring scheme for pipes due to its relative simplicity. Following development of a numerical database for the derivation of quantification relations, only frequencies of the test structure are required for damage identification. • Although the method has been demonstrated using a pipe segment, it is envisaged that it can be applied to damage identification in other axisymmetric structures that exhibit LVMPs.
Limitations and future works: • The method requires measurement of modal frequencies to a high level of precision. Therefore, it is recommended that sensors and analysis techniques capable of measuring modal frequencies (in Hz) of at least the first three global vibration modes to a high level of precision (i.e. to at least two decimal places) are employed in order to increase the chances of observing both Passive and Active LVMP components for damage identification. • Ideal boundary conditions (free-free) were modelled. However, it is envisaged that the method can be applied in practise to tubular structures with more realistic boundary conditions as other studies38 have shown that LVMPs are also obtainable in structures with alternative boundaries such as fixed-fixed and free-free. Given the variety of boundary conditions that may be encountered in practice, the proposed method would need to undergo a similar verification to that adopted herein for other combinations, such as partially fixed/free. • It has been demonstrated that the index V can be used to quantify damage in terms of material volume loss at a given damage location. It also appears that the index, ψz, can be used to measure the shift in a pipe’s longitudinal axis. • The concept has been tested on pipe segments containing a single damage site; further research is required to confirm the applicability of the method to pipes with multiple damage locations. • The proposed method has been exemplified via a linear regression approach to achieve circa 90% accuracy in damage identification predictions. Other techniques such as deep learning algorithms could be linked with the method to explore whether more accurate/robust damage identification predictions are possible. • In operational conditions, temperature variations can affect modal frequencies and hence may influence the performance of any frequency-dependent method for damage identification. However, in the proposed method, the temperature effects can be minimised by including any likely temperature variations in the development of the numerical damage database. • The method requires creation of a damage database for each different pipe to be investigated implying that it is not an unsupervised damage detection method. Through future research it might be possible to establish trends for different pipe sizes in which case a unique database would not be required for each specific pipe.
Conclusion
This research developed a novel baseline-free method of damage identification and has demonstrated it can be used to detect, locate and quantify damage in tubular structures such as pipes from LVMP frequencies. It is demonstrated here that the existence of LVMPs is characteristic of damage and the damage can be located through ranking of the LVMP frequency ratios. Geometric indices have been developed which when correlated with LVMP frequency ratios can be used to quantify structural damage. The proposed method was verified using 500 numerical test cases from where it was shown that the method detected damage in 100% of all 500 cases, located damage in 93% of cases and successfully quantified damage to an accuracy of 92%. Finally, the method was verified using experimental data obtained from laboratory tests performed on an artificially corroded pipe and the results show that the method successfully detected and located the damage and quantified the volume of the corrosion pit to an accuracy of 99.8%. Given the high level of accuracy in the obtained results, the proposed method offers a potential solution to the industrially important problem of damage identification in tubular structures and can also be explored for application in other types of axisymmetric structures.
Footnotes
Funding
The author(s) disclosed receipt of the following financial support for the research, authorship, and/or publication of this article: Obukho E. Esu would like to express appreciation to Niger Delta Development Commission, NDDC of The Federal Government of Nigeria for part-sponsorship of this research [grant No.: NDDC/DEHSS/2016PGFS/AKS/PhD/006].
Author contributions
Obukho E. Esu: conceptualisation, methodology, investigation, software, formal analysis, writing – original draft, writing – review and editing, data curation and visualisation. Ying Wang: validation, writing – review and editing and resources. Marios K. Chryssanthopoulos supervision, writing – review and editing and funding acquisition