
Abstract
Conducting damage diagnostics on stiffened panels is commonly performed using a single SHM technique. However, each SHM technique has both its strengths and limitations. Rather than straining the expansion of single SHM techniques going beyond their intrinsic capacities, these strengths and limitations should instead be considered in their application. In this work, we propose a novel fusion-based methodology between data from two SHM techniques in order to surpass the capabilities of a single SHM technique. The aim is to show that by considering data fusion, a synergy can be obtained, resulting in a comprehensive damage assessment, not possible using a single SHM technique. For this purpose, three single-stiffener carbon–epoxy panels were subjected to fatigue compression after impact tests. Two SHM techniques monitored damage growth under the applied fatigue loads: acoustic emission and distributed fiber optic strain sensing. Four acoustic emission sensors were placed on each panel, thereby allowing for damage detection, localization, type identification (delamination), and severity assessment. The optical fibers were adhered to the stiffener feet’ surface, and its strain measurements were used for damage detection, disbond localization, damage type identification (stiffness degradation and disbond growth), and severity assessment. Different fusion techniques are presented in order to integrate the acoustic emission and strain data. For damage detection and severity assessment, a hybrid health indicator is obtained by feature-level fusion while a complementary and cooperative fusion of the diagnostic results is developed for damage localization and type identification. We show that damage growth can be monitored up until final failure, thereby performing a simultaneous damage assessment on all four SHM levels. In this manner, we demonstrate that by proposing a fusion-based approach toward SHM of composite structures, the intrinsic capacity of each SHM technique can be utilized, leading to synergistic effects for damage diagnostics.
Keywords
Introduction
Stiffened composite panels are commonly used in the aerospace industry in which they are subjected to a variety of loads when used in-service, including fatigue loads and unexpected events such as foreign object impacts. When an impact occurs, the subsequent damage in the panel does not necessarily have a severe influence on its structural integrity. However, under the present fatigue loads, the damage caused by the impact can grow, posing a risk for the structural integrity of the panel. Therefore, it is of interest to have the capability of monitoring the damage growth by placing structural health monitoring (SHM) sensors on the panel and using its measurements for damage diagnostics. Implementing such a diagnostic monitoring system allows one to perform online damage diagnostics, which can aid in maintenance planning decisions and ultimately lead to the implementation of a condition-based maintenance (CBM) scheme in the aerospace industry.
When considering damage diagnostics, one can evaluate it at four SHM levels: (1) damage detection, (2) damage localization, (3) damage type, and (4) damage severity. In order to obtain a comprehensive image of the damage in a panel, an assessment on all four SHM levels is needed. The latter is especially of importance when considering CBM: one not only wants to know whether damage is present (level 1) but also have information on its location (level 2): for example, is the damage located in a primary structure or high-risk area? In addition, the type of damage (level 3) is of interest when considering composites: does the damage solely consists of matrix cracking or is there a disbond present between a stiffener and a skin panel? Finally, information on the damage severity (level 4) is required to assess the health state of the panel: is the present damage severe and are maintenance actions required? Here, a base can be formed for the step after diagnostics, that is, prognostics, in which the remaining useful life of the structure is assessed.
To address the different SHM levels, a variety of SHM techniques is available, including, but not limited to, acoustic emission (AE),1,2 guided waves,3–5 strain sensing,6,7 vibration-based methods,8–10 eddy currents,11–13 and electrical impedance tomography.14–16 Each technique has its own strengths and the selection of SHM techniques should rely on its application purposes. For example, vibration-based methods can be employed for anomaly detection, but are not suitable for precise damage characterization due to their inherent global approach. Furthermore, static strain sensing using optical fibers (OFs) can provide precise damage localization information because it measures the strains directly at the location of the OF; however, this makes it blind to damage located further from the OF. Contrarily, AE can be used to globally monitor a larger area, but shows poorer performance for precise damage localization in composites.
In this work, focus lies on the fusion of two SHM techniques, namely, AE and distributed fiber optic strain sensing (DFOS). These two techniques are selected based on the considered application: the diagnostic assessment on all four SHM levels of stiffened composite panels, containing impact-induced damage and subjected to fatigue compression loads. On the one hand, AE can be used to monitor the entire panel, thereby providing information on the initiation and propagation of damage, including approximate locations, indications of the type of damage, as well as a severity assessment. On the other hand, DFOS can be used to closely monitor damage growth near the stiffener, which can pose high risks for the structural integrity of the entire panel, by providing precise damage localization and an assessment of the damage severity. In this manner, it is hypothesized that the two techniques are complementary in terms of damage assessment. To illustrate and further understand the strength of the AE and DFOS techniques in addressing the different SHM levels, applications of each technique are discussed next, with focus on studies considering stiffened composite panels.
AE
AE has long been used for SHM of a variety of structures, including for composite structures. 17 Damage assessment of composites has been studied on all four SHM levels and prognostics, as shown by recent review studies,1,2 and their applications to stiffened composite panels are discussed in the following. Yet, we must first shortly discuss the power and considerations of the AE measurements, as these diagnostic and prognostic algorithms rely on the recorded AE data. AE data can be considered quite powerful as it has been used to, among others, detect damage initiation,18,19 distinguish different damage types,20,21 and to predict residual strength22,23 and remaining useful life.24,25 Yet, a great challenge with implementing AE technique is that its measurements are influenced by a variety of factors, such as sensor type, placement, and coupling. 26 As the selected AE features are consequently used as input to diagnostic and prognostics models, such factors can alter conclusions made on damage progression. Moreover, the selection of AE features must be performed carefully, as each shows different performance in terms of describing damage initiation and propagation.26,27 In this regard, the benefits of employing multiple AE features should not be overlooked as it can improve the robustness of damage assessments with respect to the use of single features. 27 Finally, one must consider the relation with the damage state of a structure, especially in larger structures: what does the detection of an AE source mean for the actual integrity of a structure? 28
For AE source localization, multiple AE sensors must be placed onto the panel, with a minimum of three sensors for planar localization. Employing these AE sensors in a cooperative fusion setting combined with a localization algorithm allows for localization of damage. A commonly applied localization method is the time-of-arrival method that assumes a constant wave velocity and uninterrupted wave propagation path. In a composite panel, the acoustic wave is affected by the anisotropy of the composite panel, causing differences in the propagation in different directions, including impacts on its wave velocity. Therefore, an appropriate method for the time-of-arrival determination must be selected, for example, using waveform modal analyses, as it will result in more accurate source localization. 29 Yet, such approaches are not always practical, for example, in cases with long-running tests under fatigue loading with a large number of hits being recorded, such as the ones considered in this work. In such cases, when applying the time-of-arrival technique, the first crossing of the threshold is considered and the analysis of the wave mode is neglected. The application of such a time-of-arrival method and assumption of constant wave velocity can then potentially introduce errors in the obtained localization results. When applying such an approach for larger and complex structures, these errors can be mitigated by, for example, only considering zonal localization. 30 In addition, several other localization methods have been proposed that take into account the direction-dependency of the wave velocity. For example, the Delta T-Mapping method was introduced that uses a localization algorithm trained with artificial Hsu–Nielsen sources. 31 The method was applied to different composite structures containing assembly details,32,33 and several studies have shown the improvements with respect to the time-of-arrival method in terms of localization accuracy for composite structures.34–36 Even though the Delta T-Mapping method addresses the localization errors, its artificial mapping approach introduces disadvantages: the trained localization algorithm is both structure- and lay-up-dependent. Moreover, manual mapping makes its application user-intensive, which can be infeasible for larger structures. To mitigate the need for manual mapping while simultaneously considering the direction-dependency of the wave velocity, a localization method relying on sensor placement was introduced.37,38 This approach provides several advantages and can show a high accuracy (e.g. on average a 3-mm error for impact source localization in a composite panel); 37 however, a higher number of AE sensors is required (a minimum of four). 39
Besides localization, AE data can be employed for damage type identification by clustering its feature data sets, after which each cluster is related to a damage type.2,40,41 These approaches are often considered when assessing coupons and are less common for structural components such as stiffened panels; a few studies have been conducted in which the damage type is identified in (stiffened) composite panels. One study employed AE feature data recorded during the quasi-static compression of a single-stiffener carbon fiber skin panel in (post-)buckling and manually categorized it into four groups based on their peak frequency values. 42 Each group is subsequently related to a type of damage, namely: (1) matrix cracking, (2) fiber/matrix de-bonding, (3) delamination, and (4) fiber breakage. Damage type identification by applying clustering methods is shown for two stiffened carbon fiber skin panels subjected to quasi-static compressive and fatigue loads, 43 where disbond growth is monitored by clustering AE data into four clusters using the k-means method. Subsequently, the feature values of each cluster were evaluated, as well as their time of occurrence during the fatigue cycle. Contrary to the previously discussed study, the four clusters were not all related to a damage type; instead, only the corresponding damage type of one cluster was identified, namely, that related to disbond growth. A final example of applying clustering methods for AE damage type identification in composite panels is seen for a carbon fiber panel subjected to buckling loads. 44 The AE data are clustered into two groups using both the k-means and Fuzzy C-means methods. Subsequently, a complementary fusion of the clustering results is performed by combining them with localization results obtained using a Delta T-Mapping approach. The localized and clustered AE data are then reviewed in a time-based assessment, resulting in the correlation of the two clusters to (1) matrix cracking and (2) delamination.
DFOS
OF-based strain measurements have been used for the damage monitoring of various structures.45–47 The technique has been employed for the assessment of several SHM levels, and several applications for the diagnostics of composite structures are discussed in the following. Before diving into these diagnostic algorithms, the concept behind OF-based diagnostics must be discussed. OFs can be used to measure strain at the location of the fiber. The presence of damage in a structure causes a change in the strain fields, and with developed diagnostic algorithms, these changes can be associated with damage. Hence, if one wants to use OFs for damage diagnostics, the selection of OF technique and fiber topology is of importance.6,48 Fiber Bragg Gratings (FBGs) are often employed, which provide point strain sensing at the location of the FBG. Moreover, multiple FBGs can be combined in a single fiber to provide multi-point sensing. Meanwhile, DFOS provides distributed strain measurements along the entire length of the OF with a spatial resolution as low as 0.65 mm. 49 A last consideration is that measured strain values are not only affected by the presence of damage, but they are also affected by other factors such as changing load and temperature conditions. In order to be able to employ the strain measurements for damage monitoring, the effects of the damage on the strain values must be distinguished from those caused by applied loads, noise, vibrations, and environmental variations. 7 Several studies have been conducted toward using strain measurements for damage monitoring and its applications for composite structures, which are discussed next. Here, we place focus on Rayleigh-backscattering–based distributed fiber optic sensing, which is considered in this work as the selected technique for damage monitoring along the stiffener foot.
A straightforward manner of monitoring damage growth using strain measurements is by comparing a strain measurement with a previously obtained baseline measurement. When keeping all conditions constant, that is, loading and environmental conditions, and by minimizing noise levels, any difference in the strain measurements can be attributed to damage. Following this approach, a composite-based unmanned aerial vehicle (UAV) was monitored using DFOS and subsequent strain measurements were compared for anomaly detection, although it was concluded that no changes occurred in time. 50 Likewise, impact damages can be detected in a multi-stiffener panel subjected to quasi-static compression by comparing strain measurements along different stiffener feet: the presence of an impact damage will cause the corresponding strain measurement to be different from the others. 51 Delaminations caused by an impact can also be detected in a composite panel by embedding OFs and comparing the strain measurement before and after impact. 52 The presented strain measurements in the latter study additionally show indications that the location of impact-induced delaminations can be extracted. This potential for localization creates options to perform damage growth tracking. Specifically for double cantilever beam (DCB) specimens, it has been shown that by embedding an OF near the crack surface, the growth of the crack can be monitored under the applied loads.53,54 The crack tip causes a local strain peak, which moves corresponding to the crack tip location and can be tracked in the strain measurements.
In the previous studies, OFs were embedded inside the material; however, when bonding an OF to the surface of a stiffener, as is the case in this work, the strain peaks near the crack tip are not as apparent. 55 Not only are the strain peaks less distinctive but also a larger strain area is affected by the damage.51,56 The latter effects make both damage localization and sizing assessments more challenging when employing surface-bonded OFs. In this regard, a finite element model (FEM) can be used to assess the relation between the damage and the strain measurements. For example, an artificial neural network can be trained to relate strain measurements to the disbond length,55,57–59 or to create an empirical relation between the peak-intensity ratio and the disbond length. 60 Despite these studies showing the potential of using FEMs to relate strain measurements to damage size, they lead to structure- and lay-up-specific algorithms. The latter can be a disadvantage since it makes the approach less generally applicable. One way to mitigate this is by not considering an assessment of the actual damage size but instead by monitoring disbond growth using health indexes (HIs). For example, such an HI was proposed based on numerically simulated strains for the monitoring of disbond growth in a composite stiffened panel. 61 The applicability of this method for disbond monitoring was subsequently demonstrated for two artificially disbonded composite panels subjected to fatigue loading by employing FBG strain measurements. 62
Objectives
As seen, previous studies have not yet combined AE and DFOS for damage monitoring. In general, studies, in which these SHM techniques are applied, aim at improving the damage assessment on one SHM level rather than moving toward an integral diagnostic framework containing assessments on all four SHM levels. In addition, it is seen that most studies employ only one SHM technique for damage monitoring and that when multiple techniques are employed, those are mostly used for validation or comparison purposes rather than in a fusion setting. A fusion approach can be beneficial by allowing one to utilize the strength of each technique, thereby obtaining a comprehensive damage assessment and increased confidence in its results. Finally, current studies involving AE- or DFOS-based damage monitoring focus on coupons or (stiffened) panels subjected to quasi-static compression or impacts; studies aimed at monitoring impact damage growth under compression fatigue loads are not common.
This study works toward the implementation of a fusion-based framework by fusing AE data, DFOS data, and damage diagnostic results to obtain a damage assessment on multiple SHM levels for stiffened panels. In this regard, three single-stiffener composite coupons (SSCs) are subjected to fatigue compression after impact (FCAI) tests. For each SSC, the four SHM levels, that is, (1) damage detection, (2) damage localization, (3) damage type, and (4) damage severity, are assessed simultaneously by employing the strengths of both AE and DFOS. We identify the strengths of both techniques and use AE data to detect damage initiation and propagation throughout the SSC, as well as to localize and identify the damage type. Moreover, we recognize that the strengths of the strain data from the DFOS system lie in disbond growth identification and localization, as well as in the identification of stiffness degradation. We exploit the strength of each SHM technique and propose a novel fusion technique–based SHM methodology that allows for a holistic damage assessment on all four SHM levels, alongside addressing new challenges arising from selecting such a fusion approach, as well as the formulation of fused HIs.
This article is organized as follows: first, we discuss the conducted experimental campaign and the employed SHM techniques. This is followed by a conceptual explanation of the behavior of the strain distributions along the stiffener foot under loads and damages. Next, the methodological framework for damage monitoring based on fusion techniques is presented, after which its performance on the experimental data is discussed in the section “Results and discussion.” Finally, we present our conclusions on the benefits and challenges of implementing such a fusion-based approach for damage diagnostics of composite structures. For clarity purposes, an overview of the mathematical notations is provided in Appendix 1.
Experimental campaign
Three composite SSCs were subjected to FCAI tests with compression–compression fatigue loads. The test setup including indications of the used SHM systems is shown in Figure 1. Each tested SSC is similar and consists of a co-cured skin panel and a single T-stiffener: an example is shown in Figure 2 including its dimensions. For manufacturing of the SSCs, IM7/8552 carbon fiber–reinforced epoxy unidirectional prepreg was used, and the lay-ups of the skin and stiffener are
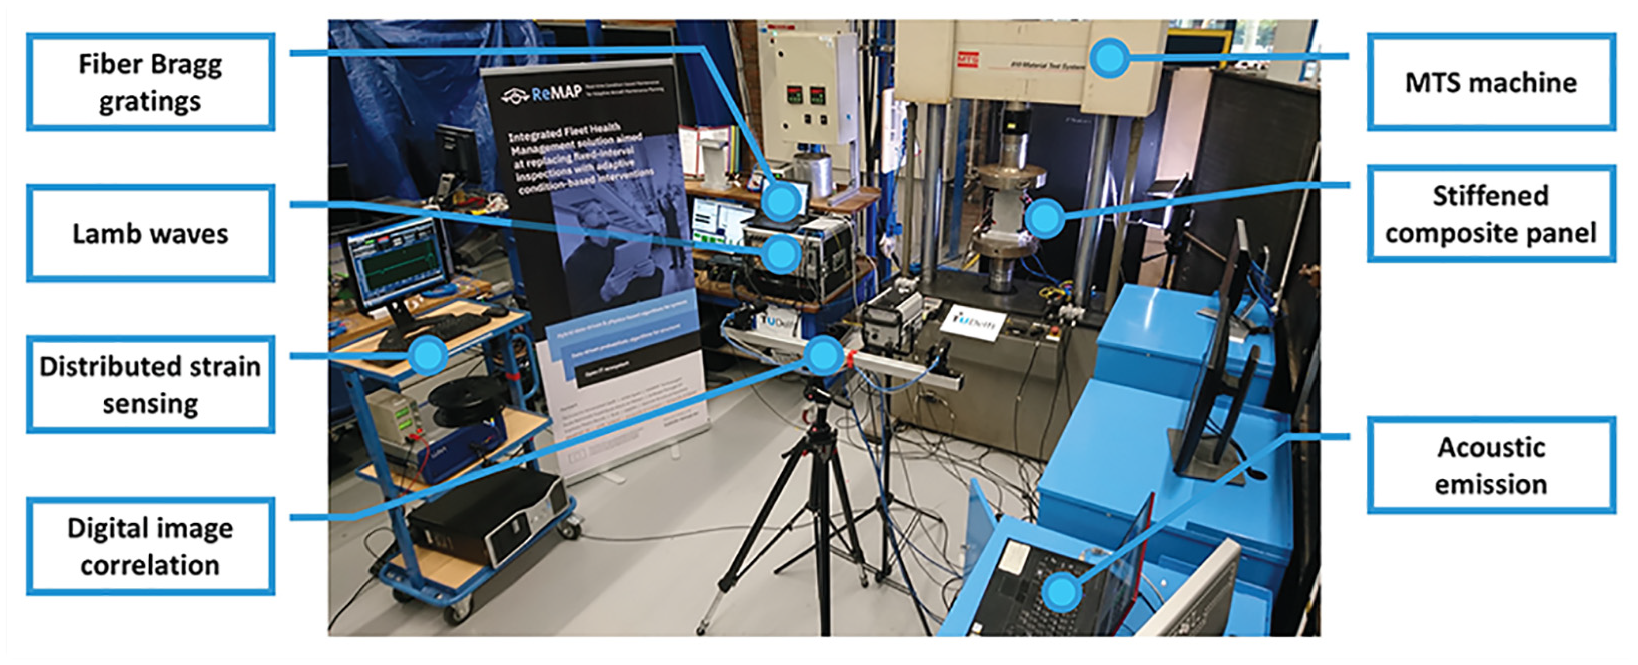
Test setup with pointers indicating various aspects of the experimental campaign, including the fatigue test bench (MTS machine), the placement of the SSCs, and the five SHM systems.
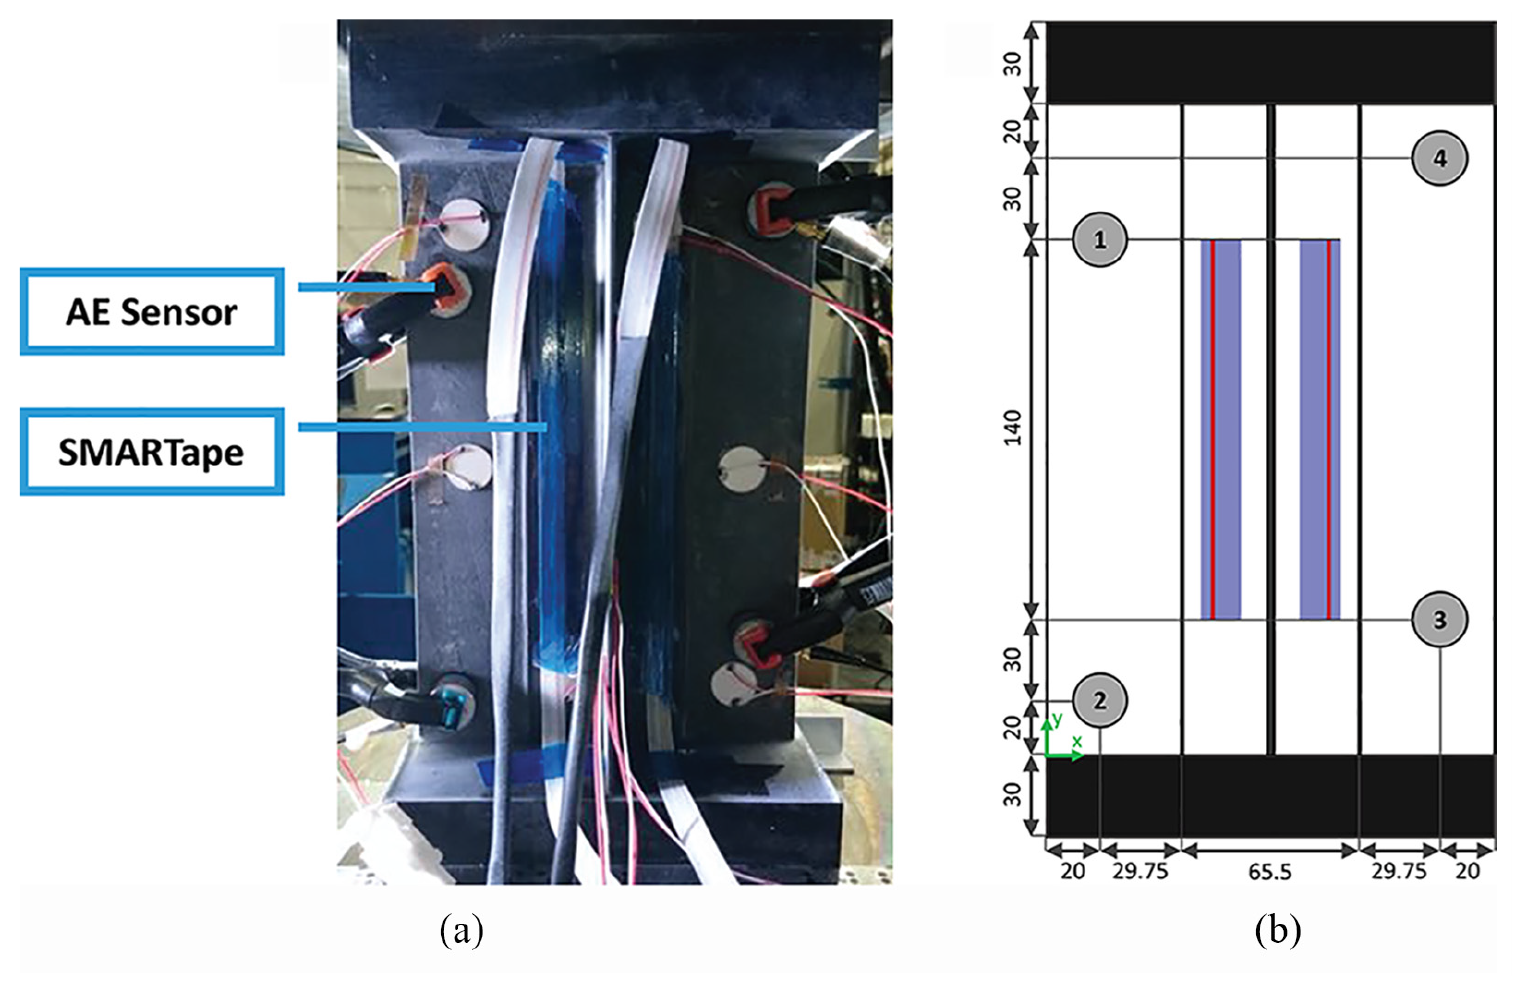
(a) Single-stiffener coupon as seen from stiffener side, including points to the AE sensors and the SMARTape. (b) A schematic representation of the SSC, indicating its dimensions, location of the AE sensors (represented by gray circles with number), and location of the SMARTape (represented by blue square) and the DFOS fiber (represented by red line).
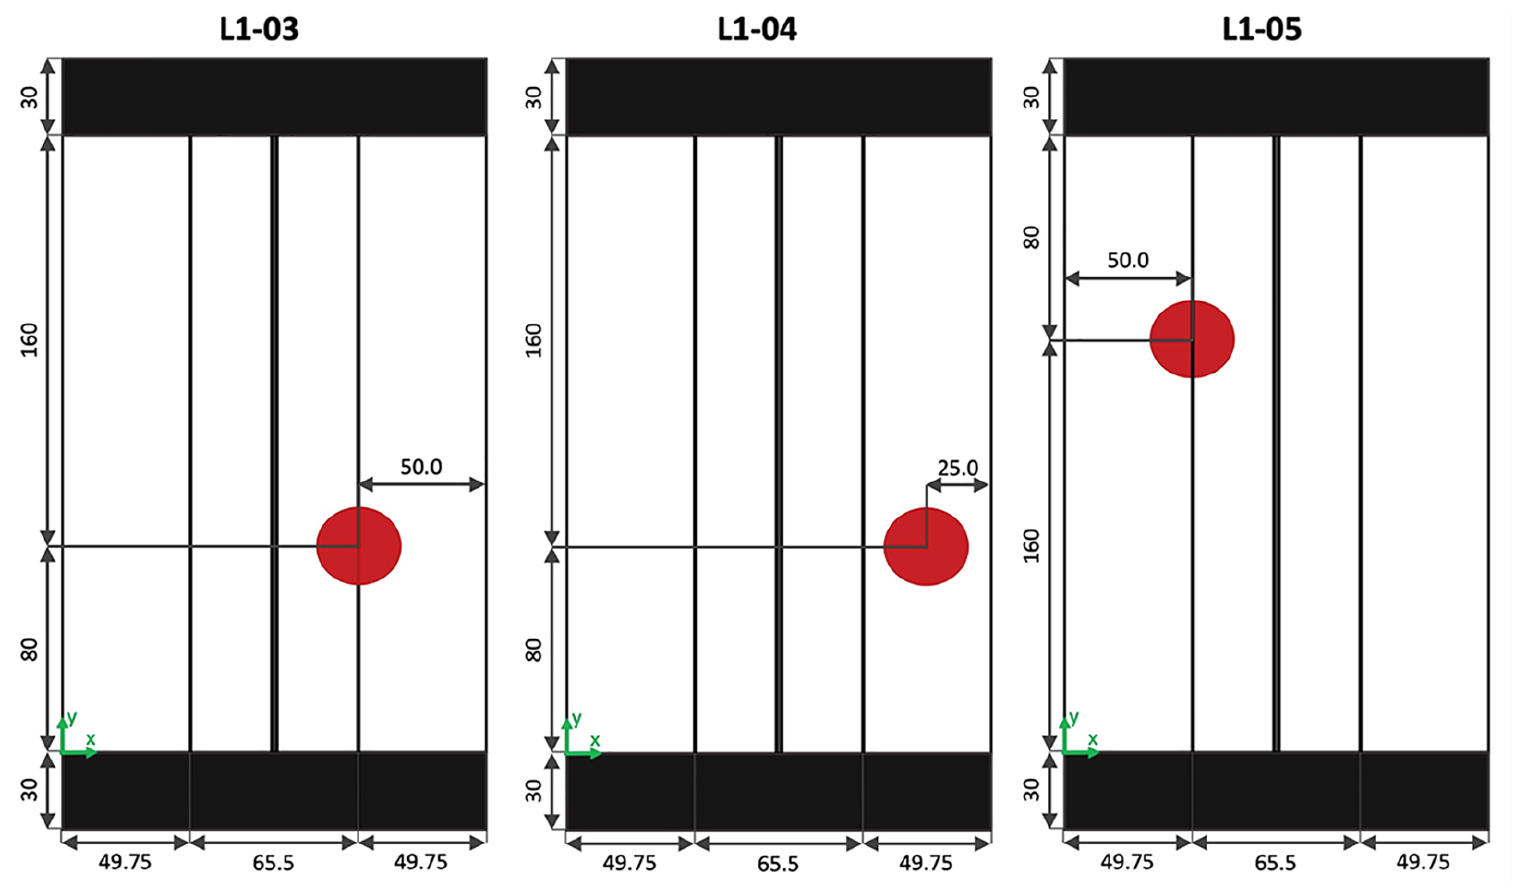
Locations of impacts (indicated by red circles) for each tested SSC, as seen from the stiffener side.
Before performing the fatigue tests, a quasi-static compression test was performed on a single SSC to assess the buckling and the collapse load. The buckling load was estimated at 12.8 kN and the SSC collapsed at a final compressive load of 104 kN. Based on this preliminary test, the fatigue loading conditions for the three SSCs were determined. For fatigue testing, each SSC was placed inside an MTS test machine with a maximum load of 500 kN. Sinusoidal compression–compression fatigue loads were applied with a stress ratio (R-ratio) of 10, a frequency of 2 Hz, and a minimum and maximum compressive load of −6.5 and −65.0 kN, respectively. These load conditions were kept constant until the final failure of the SSC, which is defined as loss of the load-bearing capacity of the SSC. The applied fatigue loads, the impact location, and the number of fatigue cycles until failure
Summary of each SSC, specifying the applied fatigue load, the initial impact location, and the number of cycles to failure
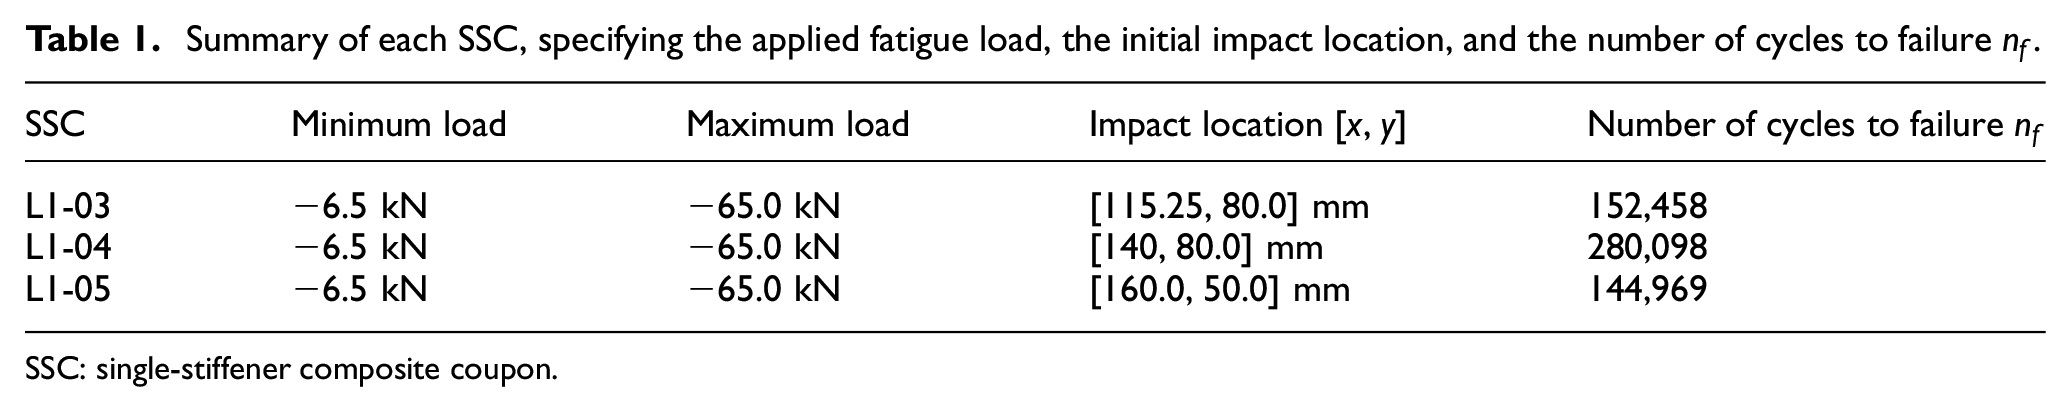
SSC: single-stiffener composite coupon.
The damage initiation and propagation in each SSC is monitored using five monitoring systems, namely: (1) AE, (2) distributed Rayleigh-backscattering fiber optic strain sensing, (3) FBGs, (4) Lamb wave (LW), and (5) digital image correlation (DIC). For this work, only the data of the first two systems are used. To allow for measurements by each technique, the fatigue load is interrupted at pre-defined intervals. The load cycle is indicated in Figure 4 and repeats itself every 5000 cycles. Every 5000 cycles, the applied load is reduced to 0 kN to allow for LW measurements. Every 500 cycles, except for the 5000th cycle, the SSC is subjected to a quasi-static load from the minimum to the maximum fatigue load level under a constant displacement rate of 0.5 mm/min. The FBG and DIC systems take measurements throughout the quasi-static loading, while the distributed strain is recorded at the minimum and maximum load. Finally, the AE system is continuously recording throughout the load cycle. In the next two sections, the AE and DFOS data acquisition is discussed in more detail.
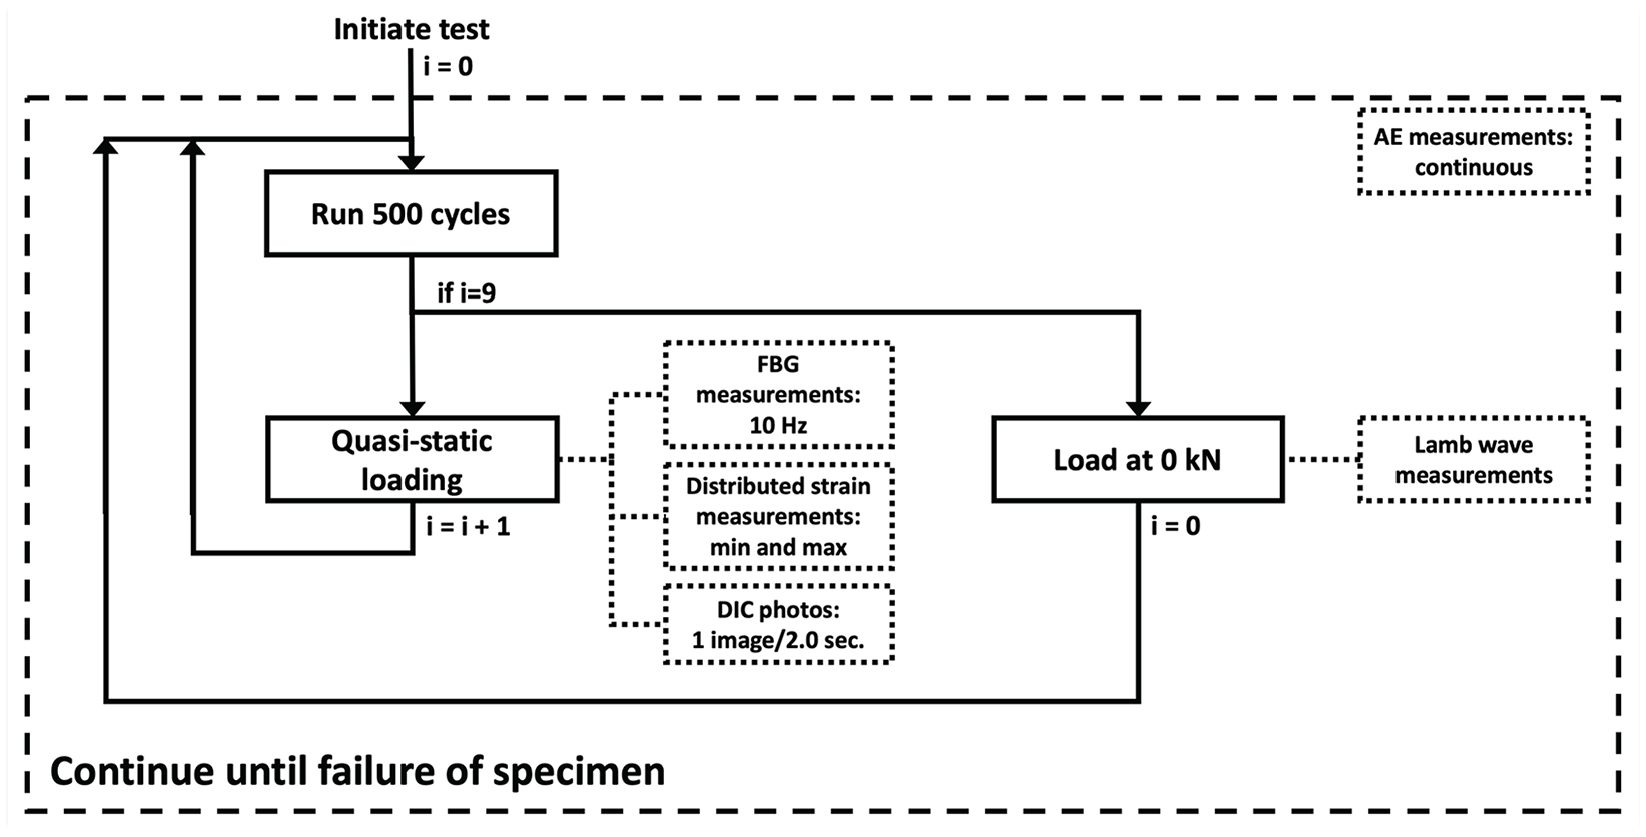
Applied load cycle to each SSC including indications of measurement intervals of each SHM system.
AE
Four VS900-M broadband sensors from Vallen Systeme GmbH with an operating frequency range of 100–900 kHz were clamped onto the skin of the SSC on the stiffener side. To record the hits, an AMSY-6 Vallen acquisition system was used, as well as external pre-amplifiers with a gain of 34 dB. To prevent the capturing of noise signals, the amplitude threshold was set at 60 dB. The four AE sensors were placed on the skin of the SSC to form a parallelogram. The [x, y] location of each sensor is indicated in Figure 2, and equals [20.0, 190.0], [20.0, 20.0], [145.0, 50.0], and [145.0, 220.0] mm for sensors 1, 2, 3, and 4, respectively. Placing the four sensors at these locations allows for localization of the recorded AE hits. To determine the AE event locations, the internal Vallen processor for planar location, based on Geiger’s method, 63 was applied, which is further discussed in section “Methodology.” In the remainder of this work, only AE localized events are considered when discussing AE data.
DFOS
The distributed strain measurements are made along the surface of the stiffener foot at the minimum and maximum load during the quasi-static load segment. For this purpose, a SMARTape is used (a glass fiber–reinforced polymer–epoxy tape containing an OF used for DFOS), which is adhesively bonded (co-polyamide-based adhesive) to the surface of the stiffener foot. 64 Two SMARTapes are used, one placed on each stiffener foot, which were subsequently connected by splicing them. Furthermore, a coreless fiber was included at the end of the SMARTape to minimize noise caused by unwanted reflections. A LUNA Optical Distributed Sensor Interrogator (ODiSI-B) was employed for recording the distributed strain along the stiffener feet. Measurements were made with an acquisition rate of 23.8 Hz and a spatial resolution of 0.65 mm.
Influence of load and damage on strain measurements
Before discussing the diagnostic methodologies used in this work, it is of importance to have a profound understanding of the obtained measurements, in particular the strain distribution measurements along the surface of the stiffener foot. In order to employ the strain measurements for damage diagnostics, the aspects influencing the strain values must be identified. Based on the strain behavior observed during testing, it can be derived that four factors affect the strain values, namely:
Applied compressive load.
Buckling.
Stiffness degradation
Presence of disbond.
It is essential to note that it is assumed that the SMARTape itself did not disbond or was damaged during the fatigue test. This was both visually checked throughout the fatigue test and checked post-test through taken camera images. The shape of the strain distribution is different for each stiffener foot. This is mainly caused by the buckling behavior and placement of the OF, which have a substantial influence on the measured strain distributions. The expected behavior of the strain distribution during testing, following the previously identified four factors, is discussed next and summarized in Figure 5.
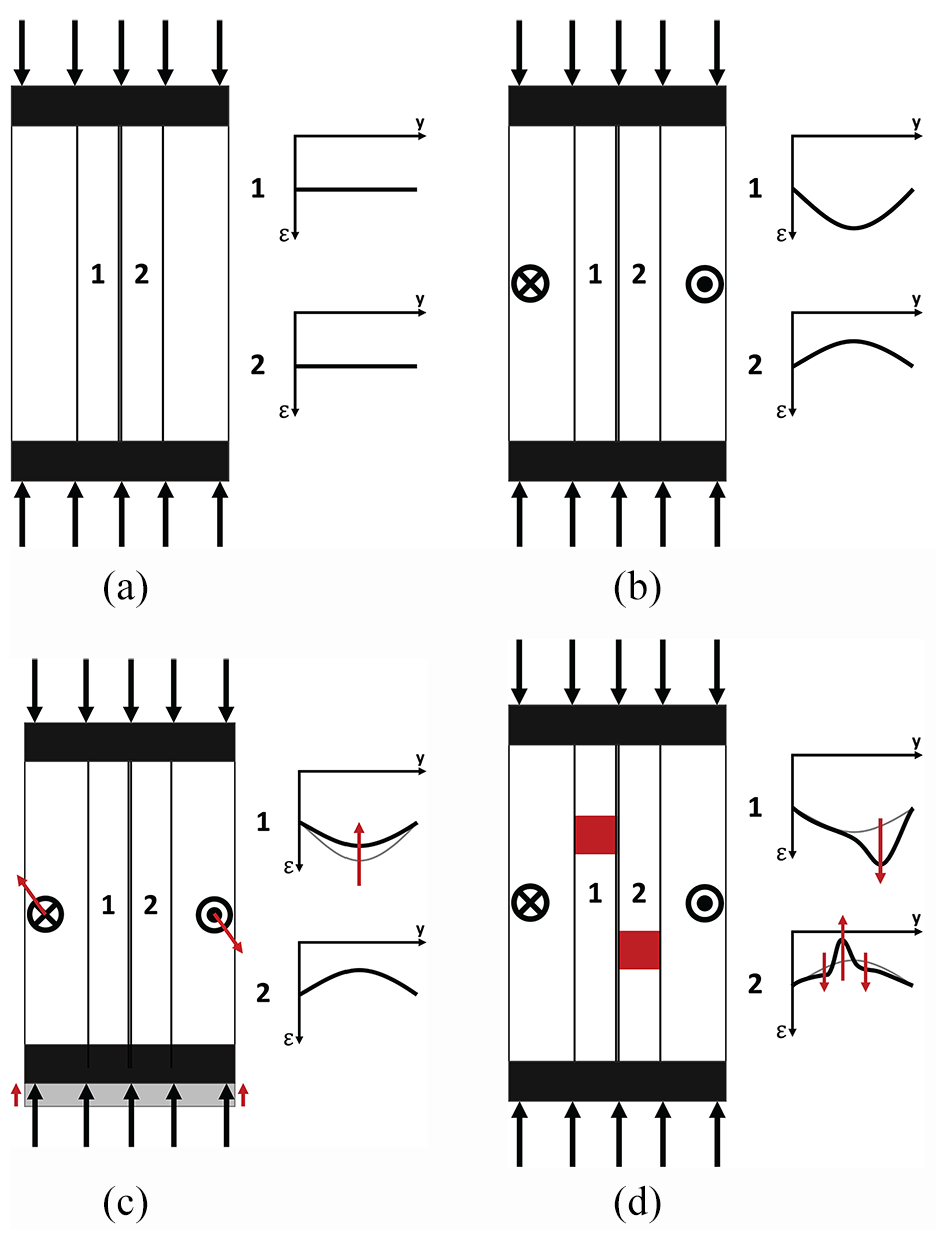
Four factors influencing the measured strain values: (a) axial compression: a compressive load is applied on either end of the SSC, (b) buckling: the skin moves in out-of-plane direction. The symbols ⊙ and ⊗ indicate movement in the out-of-plane direction, either out from or into the page, respectively, (c) stiffness degradation: causes larger displacements and changes in the strain distribution as indicated by the red arrows, and (d) disbond: the presence of a disbond (red squares) causes changes in the strain distributions (indicated by red arrows). The diagrams of the SSC are shown as seen from the stiffener side. In addition, the strain distribution
Applied compressive load
A distributed compressive load is axially applied onto the SSC through the centerline, causing a constant compressive strain in the SSC. This axial strain causes equal values in both the left and right stiffener foot, as shown in Figure 5(a).
Buckling
The buckling of the SSC results in a bending moment through the thickness, which has a subsequent effect on the measured surface strains on each stiffener foot. Namely, due to the placement of the SMARTape, strains are not measured on the neutral axis but are instead measured on the surface of each stiffener foot. The presence of buckling causes a tension on the surface of one stiffener foot, while the strains measured on the other stiffener foot show compressive values. This buckling effect is combined with the uniform axial compression previously described and is depicted in Figure 5(b). Here, stiffener 1 experiences larger compression, whereas the compression on stiffener 2 is partially relieved by the tension loads caused by buckling, although remaining in the compression regime. Note that an opposite effect is seen on the skin surface due to its placement on the opposite side of the neutral axis.
Stiffness degradation
In stiffness degradation, the Young’s modulus decreases under the fatigue loads. Keeping the applied load constant causes an increase in the axial compressive strain (section “Applied compressive load”), which leads to increased strain values on the surfaces of both stiffener feet. However, a second effect is present, namely, that stiffness degradation also changes the influence of buckling on the strain values: stiffness degradation leads to an increase in the out-of-plane displacement of the skin. The latter causes a change in the moment and subsequently affects the strain increase and relief on the surface of the stiffener foot. This combination of effects results in the following observed behavior in the measured strain distribution under stiffness degradation. Namely, stiffness degradation causes the compressive strain on the surface of the stiffener foot to reduce on the more compressed side (stiffener 1). On the other side (stiffener 2), it is observed that the strain remains approximately constant under stiffness degradation. Therefore, for the latter stiffener, it is reasoned that the two effects cancel out one another. The effects of stiffness degradation on the measured strain distribution values are presented in Figure 5(c).
The presence of disbond
A disbond affects the strain distribution locally, although the affected area is not equal to the disbonded area: the surrounding area is also affected.51,56 The latter means that, from a longitudinal perspective, the region above and below the disbond is affected. From a lateral perspective, it means that the measured strain on a stiffener foot can be influenced by a disbond located at the opposite stiffener foot. Secondly, the presence of a disbond has a different effect on the strain curve, dependent on the stiffener side. On the one hand, if a disbond is present on the more compressed side (stiffener 1), it causes a local compressive strain increase, resulting in a change in the strain distribution shape that grows in both size and width with an increasing disbond length. On the other hand, if a disbond is present on the tensed side (stiffener 2), a local compressive strain reduction is observed with two adjacent compressive strain increases on either side, resulting in a local valley-peak-valley shape as indicated in Figure 5(d). Similarly, this bump grows in both size and width with an increasing disbond length.
Methodology
This section addresses the steps needed to fuse AE and DFOS data for a four-level damage assessment of the SSCs. The strengths of the AE technique and of the DFOS technique were previously identified and are employed for the design and proposal of fusion-based diagnostic methodologies for each SHM level. Several challenges that arise from the application of fusion approaches are addressed such as practical challenges related to differences in acquisition intervals and discrepancies between the different units. Moreover, appropriate HIs are formulated for the various levels that not only work for single SHM techniques but that also complement one another when joined in the fused HIs.
The fusion-based approach in each SHM level is discussed separately in each of the next sections. Section “Level 1: damage detection” covers the first SHM level in which we build a single hybrid feature developed from AE and strain features. This fused feature is subsequently employed for damage detection of the SSC. Next, in section “Level 2: damage localization,” a method for damage localization is considered, which relies on AE data for all damage localization, and strain data for disbond localization in particular. For the latter, we develop a disbond localization algorithm relying purely on DFOS data and the results of the damage identification algorithm from section “Level 3: damage type identification.” In this third section, a methodology for damage type identification is designed that relies on changes in strain data, which is used for the identification of stiffness degradation and disbond growth. In addition, AE data are clustered into two groups of which one is related to delaminations (including disbonds) by fusing the clustering results with the localization results, as well as with the disbond growth identification results derived from the strain data. In this manner, we present a methodology that is capable of relating partial AE data to a specific damage type (delaminations) by linking the AE- and DFOS-based results. In the last section “Level 4: damage severity,” a methodology is presented that assesses the fourth SHM level. In this regard, a DFOS-based HI is designed that relies on the changes in strain mean values over time. The DFOS-based HI is subsequently fused with a common AE-based HI, namely, the cumulative energy, after which we build a fused HI based on both AE and OF data in order to assess damage severity throughout the test.
Level 1: damage detection
The damage detection methodology is presented next. This section commences with a short description of how each technique can be used individually for damage detection, followed by a proposal for fused damage detection.
AE
The source of AE signals can be damage initiation and propagation, friction, or an external source. Using filtering and localization, the AE signals from external sources and friction are filtered. In addition, as stated previously, only localized AE events are considered in this work. In this manner, the recording of an AE event can be directly linked to damage detection. The cumulative AE events for each window of 500 cycles are collected in a vector
DFOS
From the OFs, two strain distributions are obtained: one for each stiffener foot. These measurements are available every 500 cycles, except for the 5000th cycle. In a period in which no damage occurs, the strain distribution along each foot remains constant. If the strain distribution changes, this can be an indication of the initiation and propagation of damage as explained in the previous section. Thus, by comparing strain distributions in time, damage can be detected. Comparing strain distribution curves in time is a tedious process and does not provide immediate insight into the moment at which damage occurs. Therefore, we develop the following method to extract a feature from the distributed strain measurements that can be used to indicate the occurrence of damage.
For each strain curve, we calculate the arithmetic mean of all datapoints of the curve. Next, these are combined into a vector
Fusion
We mitigate the limitation of
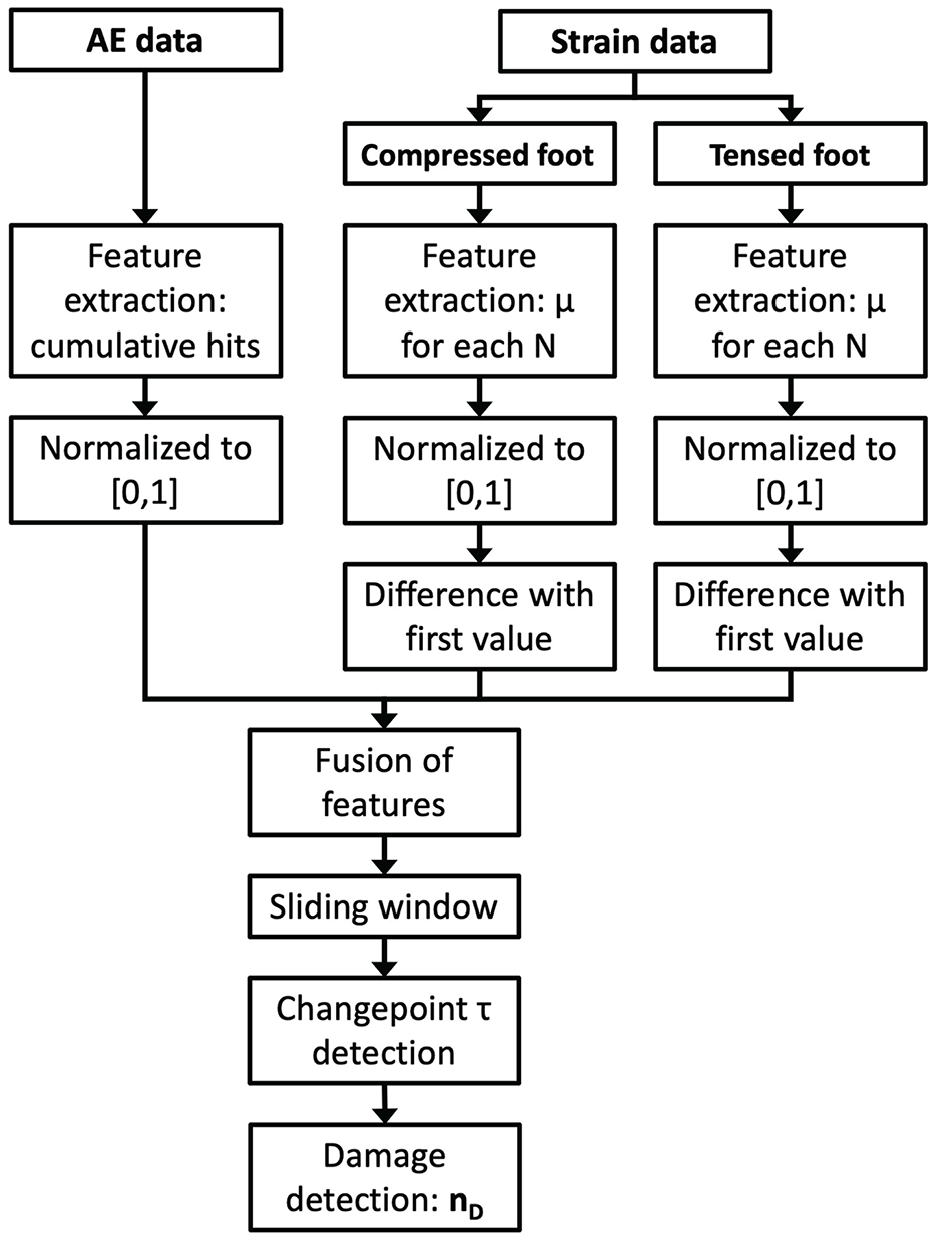
Flowchart depicting damage detection methodology.
From the AE, a single vector describing the cumulative AE events was obtained. From the OF, two vectors were extracted, each describing the mean strain value of one stiffener foot. To perform a fusion of the three, two challenges are identified that first and foremost must be handled before fusion can be performed, namely: (1) the discrepancy between units and (2) the value range of each feature. Currently,
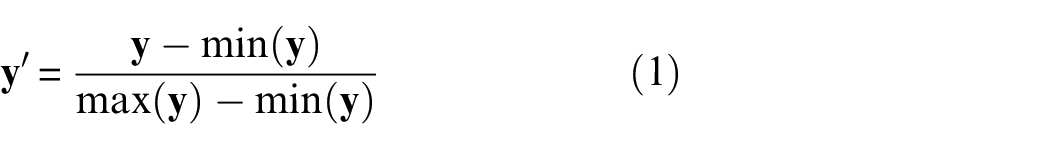
Besides compatibility in terms of units and value range, it is of interest to have the initial value of
After performing these initial processing steps, the features are summed, following a simple sum rule with each curve having equal weight, given as

which results in the fused feature
From the step in equation (2), another emerging challenge arises, namely, the differences in acquisition intervals between the two SHM techniques. It needs to be noted that
Similar to the single features, we argue that if the fused feature values change, damage is initiating or propagating in the SSC. Thus, in order to detect damage, the cycle at which the value changes, the so-called changepoint
If the values of
where

is met. Here,
Level 2: damage localization
The method for damage localization is presented next. First, localization using solely AE data is considered, followed by strain-based damage localization. For the latter, we build an automatic disbond localization algorithm that employs information from the “Level 3: damage type identification” algorithm. Note that due to our approach, it is implied that we will perform levels 2 and 3 in a simultaneous manner. Finally, in this section, we propose a methodology for the fusion of the AE and DFOS results for damage localization.
AE
Damage can be localized throughout the SSC using AE data, for which four AE sensors were placed to form a parallelogram. In this work, a planar localization algorithm is applied that follows the Geiger method, 63 and which is included in the internal Vallen processor. The Geiger method follows the time-of-arrival approach and assumes a constant wave velocity. For its application on composites, this implies that it can result in large localization errors. In section “Introduction” of this work, several localization methods to reduce these errors were introduced, although these were not selected in this work. Namely, because they require a training process (Delta T-Mapping method) 31 or additional sensors (sensor clustering approach).37,38 Even though a variant of the latter method could have been applied in this work since four AE sensors are available, 39 this approach was not selected, because it would not allow for redundancy. Namely, if one sensor would fail during testing, AE localization can no longer be achieved. Moreover, applying four sensors for the Geiger method (one more than the minimum of three) allows estimation of the location uncertainty (LUCY), which could have otherwise not been accomplished.
Before performing the FCAI test, the wave speed is measured using Hsu–Nielsen sources in both longitudinal and lateral directions, equaling 6107 and 4423 m/s, respectively. The average of both values is taken, which equals 5265 m/s. This wave speed is used as input to the Geiger method, resulting in the localization of the AE events. The localized events are filtered, and only those events adhering to LUCY
DFOS
Besides the AE data, also the strain data can provide damage localization, in particular for more precise disbond localization. The strain on each stiffener foot is measured along the OFs, thereby providing indications of damage at and near the stiffener foot. As previously discussed, the measured strain is affected by the surrounding area and it is yet to be determined to what extent. Nevertheless, strain measurements can provide indications of the location of damage along the stiffener foot because damage such as a disbond will alter the shape of the strain distribution only locally. Once a disbond is large enough, a well-defined peak/valley (dependent on the stiffener side, as explained in section “Influence of load and damage on strain measurements”) is identified in the strain distribution, which can be used to derive an approximate location of the disbond along the length of the stiffener foot.
We can profit from this knowledge on the physical concepts in order to develop a methodology for disbond localization using the disbond identification algorithm that is defined in the next section (“Level 3: damage type identification”). First, we apply the disbond identification algorithm as defined in the next section. This results in the computation of a vector
Fusion
On the one hand, we have identified that AE data can thus be used for damage localization in the region enclosed by the AE sensors, although results can be less accurate due to the anisotropy of the composite SSC. On the other hand, strain data can provide an approximate location of a disbond along the length of the stiffener foot. Because of these differences, we believe that a localization algorithm can benefit from employing both techniques. Therefore, this study proposes the following approach in which these two techniques can be used in a complementary fusion fashion, providing results on both the global localization of damage throughout the SSC and a more precise localization of disbonds. Here, the sensor data from both sensors are processed independently, after which a fused result on the damage location is obtained. This complementary fusion approach of the results is presented in Figure 7.
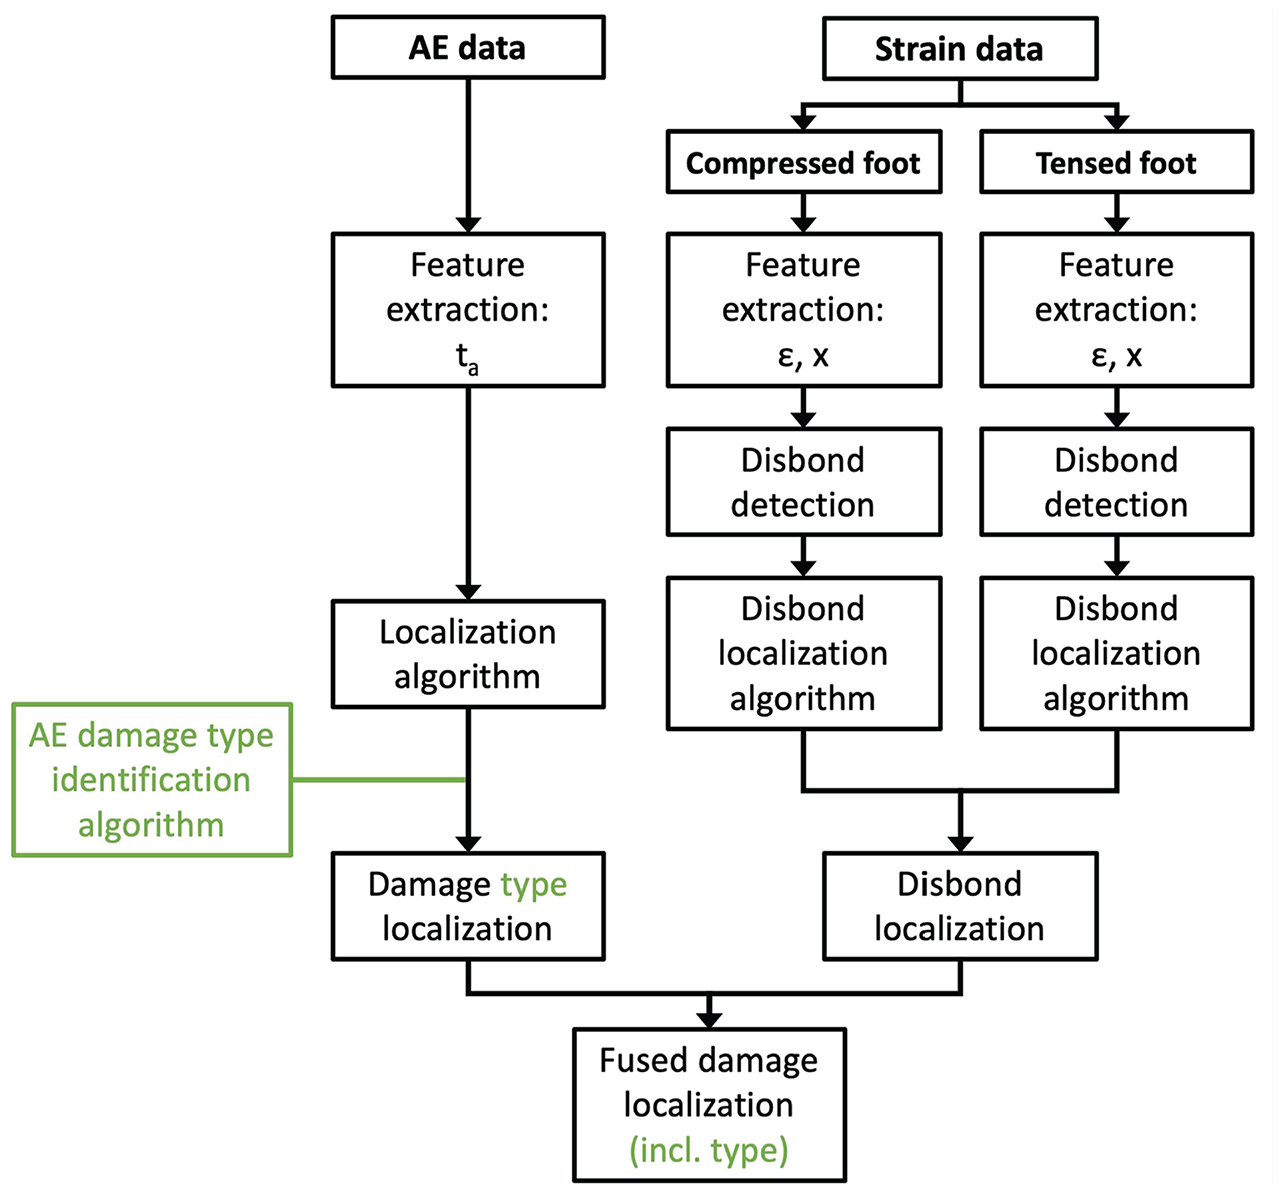
Flowchart depicting damage localization methodology. The green-colored elements indicate an extension of the proposed damage localization approach with the damage type identification algorithm.
Besides the initial complementary fusion between the AE and DFOS results, we see additional opportunities for further extension and improvements. Specifically, the fused damage localization algorithm can be extended to include the damage type identification algorithm discussed in the next section. Namely, the AE data can be clustered to identify the type of damage. If these cluster results are combined with localization, not only a general damage localization can be provided, but this can also be specified to the type of damage. Such an extension will allow for direct disbond growth localization using AE data and a subsequent complementary fusion with the disbond localization based on the strain data. The proposed extension is indicated in Figure 7 by the green-colored elements.
Level 3: damage type identification
For the identification of the type of damage that propagates in the SSC, we propose a methodology that relies on both AE and strain data. This section commences with a discussion on AE clustering, used for the identification of delaminations. This is followed by the development of a damage type identification methodology using merely strain data, and that is capable of identifying both stiffness degradation and disbond growth. Subsequently, the results are complementarily fused with the localization results of section “Level 2: damage localization” to allow for meaningful interpretation of the AE cluster outcomes.
AE
The type of damage is identified by applying a clustering method to the AE data. For this purpose, five features are extracted, namely, amplitude A, rise time R, duration D, energy E, and counts/duration
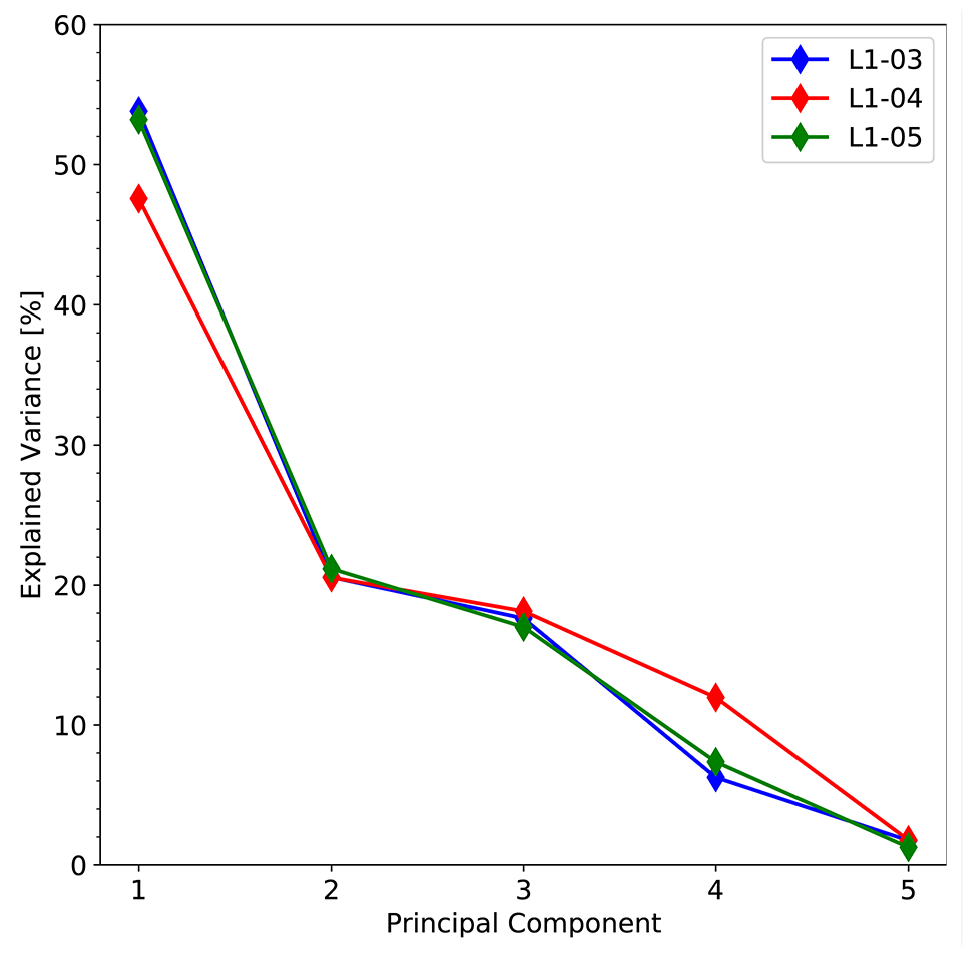
Scree plots for the AE data of each SSC.
DFOS
The strain distributions can provide information on stiffness degradation and the presence of a disbond along the stiffener foot. Both cause a change in the recorded strain levels, resulting in a changing curve in time. Since each one affects the strain values differently, this inspired us to investigate whether they can be automatically identified by evaluating in which manner the strain curve is affected. Where section “Influence of load and damage on strain measurements” visually described how stiffness degradation and disbonds affect the strain values, we develop this further in this section into a method that can identify the damage type in an automated manner. This methodology is discussed next.
As previously explained, stiffness degradation affects the strain measurements on a global scale, causing the strain distribution curve to shift. In contrast, a disbond will affect the strain measurement only locally, leading to a change in the shape of the strain curve. The different effects of each damage process on the strain curve necessitate a damage type identification method consisting of two sub-procedures. In the first sub-procedure, we aim at identifying the occurrence of stiffness degradation. We suggest to do so by developing a methodology that assesses global behavior by detecting changes in the mean strain values in time. In the second sub-procedure, we identify the growth of a disbond by implementing a methodology that assesses changes in the strain values in time for measurement locations along the stiffener foot. Each sub-method of our proposed damage type identification method is separately discussed next.
Stiffness degradation
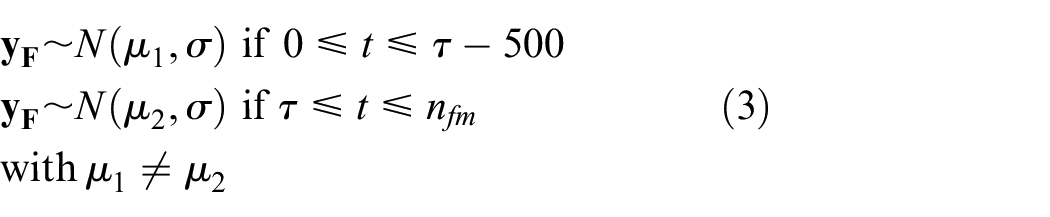
For the development of the stiffness degradation methodology in this section, we observe that stiffness degradation has an effect on the strain along the entire length of the stiffener foot, where its effect is most apparent at the compressed stiffener foot. Consequently, only the strain measurements from the more compressed stiffener foot are employed for the identification of stiffness degradation. By estimating the mean strain value at each measuring cycle interval and monitoring any changes, stiffness degradation can be identified. If stiffness degradation occurs, the compressive strain values reduce, causing the strain curve to shift upward and the mean strain value to reduce in absolute value. Similar to the previously defined damage detection method, a windowing approach is taken with a window size of five measurements. If the difference in mean of two consecutive windows satisfies

stiffness degradation might be occurring. Here,
Disbond identification
In this section, we discuss the methodology for disbond growth identification. The development of such a methodology requires a method to assess local changes. The presence of a disbond causes a local compressive strain increase on the compressed side and a local compressive strain decrease on the tensed side. We can deduce that such changes cannot be identified when only assessing the mean strain; instead, we need to develop a methodology that is capable of examining the strain behavior of each measurement point along the stiffener foot, as described next.
First, the change in strain value in time is evaluated for each measurement location along the stiffener foot. Similar to the previous sub-method, a windowing procedure is applied and consecutive windows are compared. A change is detected if the absolute change in strain value is larger than
Fusion
In the previous section, we developed a method that can directly identify disbond growth from the strain measurements. Yet, looking at the AE-based localization approach, the assigning of clusters of AE events is still pending. In this study, we do so using both the strain results and the AE localization results. For this, we propose the implementation of a cooperative fusion approach, in which the former is used to identify the cycle at which a disbond growth has occurred. Using these cycles (collected in
Finally, after identifying the AE cluster related to delaminations, we complementarily fuse the cluster results with the identification results of the disbond growth and stiffness degradation based on the strain data. This last fusion step results in the establishment of a damage identification method allowing for the identification of delaminations, disbond growth and stiffness degradation, based on both AE and strain data. The methodology in this study for damage type identification is illustrated in Figure 9.
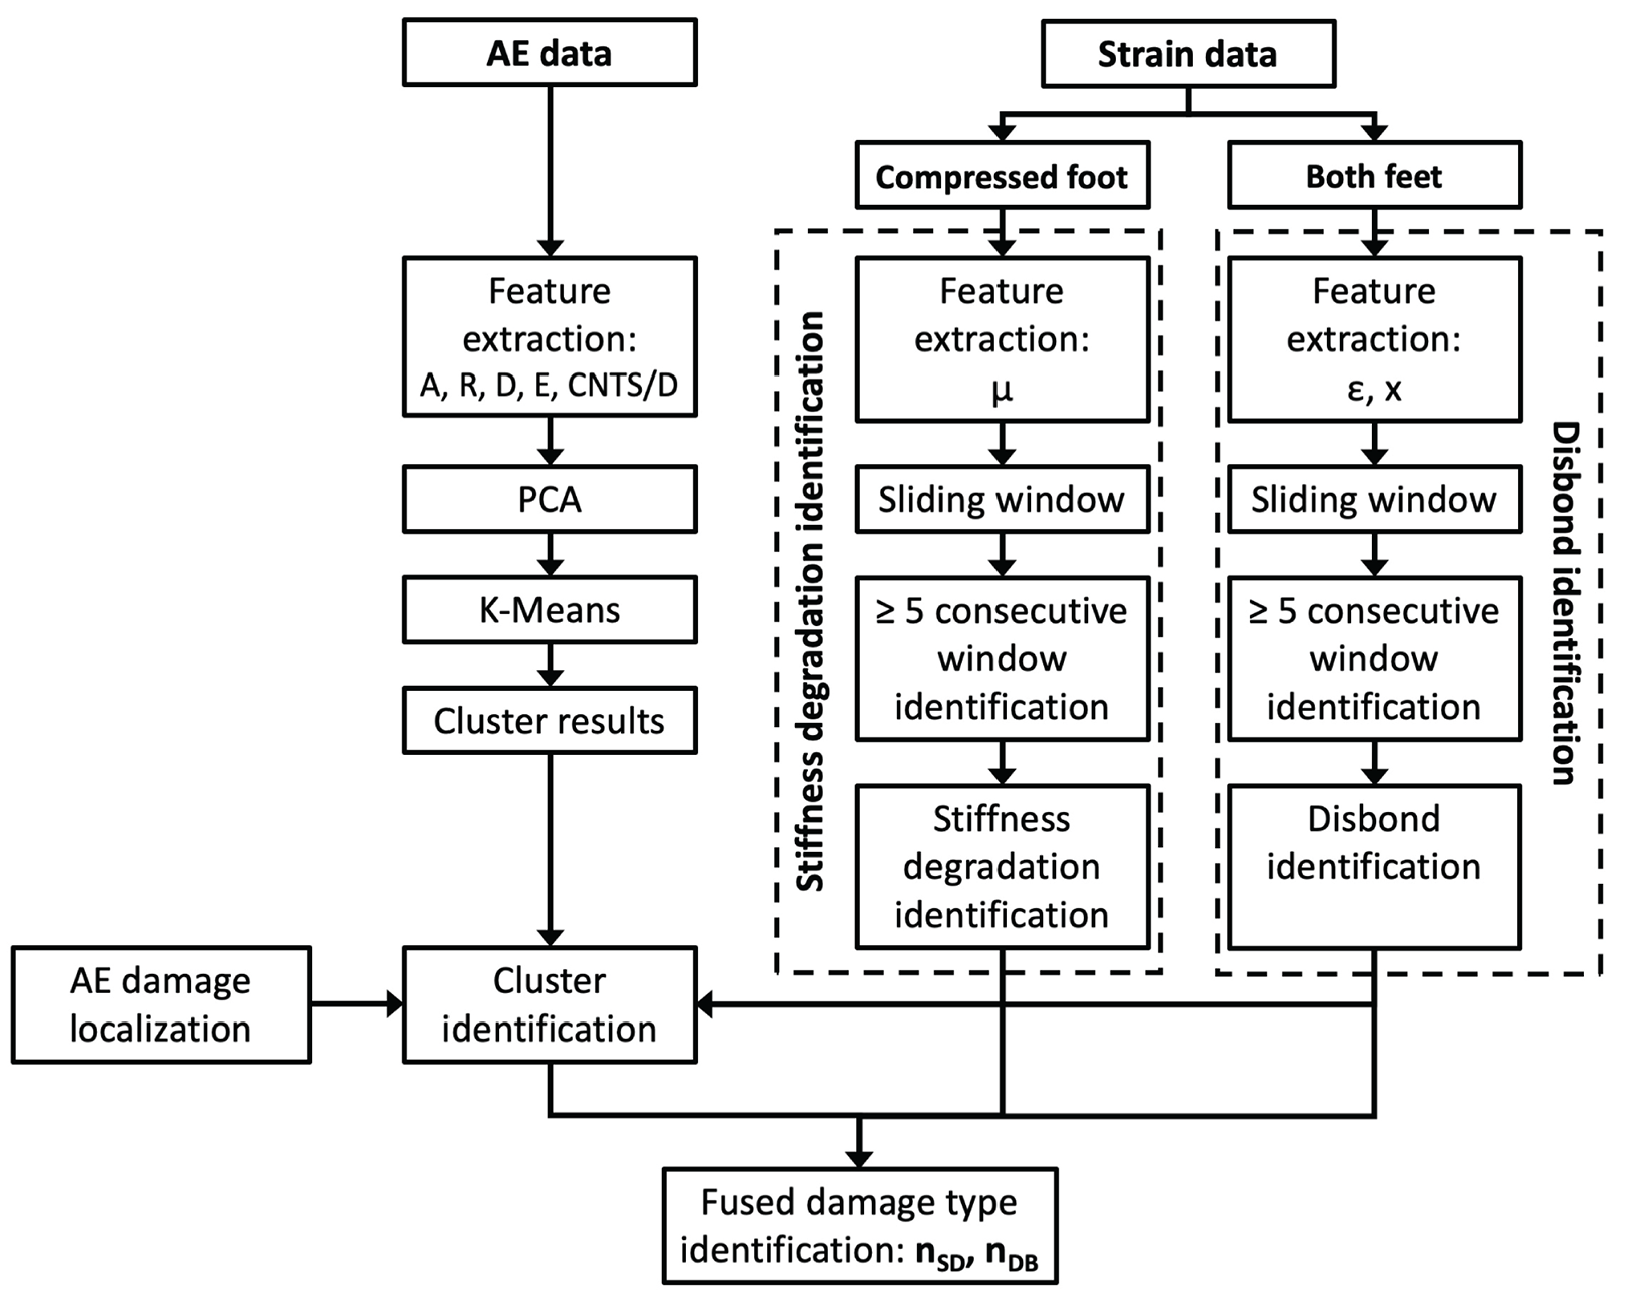
Flowchart depicting damage type identification methodology.
Level 4: damage severity
The last SHM level, level 4: damage severity, can be assessed through both AE and strain measurements. As each technique can provide different information on damage growth and severity of damage growth, we fuse the two in this section. In this regard, a fused HI based on the simultaneous assessment of both data sets is designed. In this section, first, the HIs based on the data sets from each technique are extracted separately, which includes the presentation of a DFOS-based HI for damage severity assessment. This is followed by a final fusion step, which results in a single fused HI capable of assessing damage severity throughout the test.
AE
For assessment of the fourth SHM level with AE data, we employ the commonly used cumulative energy feature. Advantages of using such feature are its inherent monotonic behavior with the number of fatigue cycles and its relation with damage propagation.
2
For the assessment of the SSCs in this work, bins of 500 cycles have been considered, resulting in
DFOS
For the distributed strain measurements, we adopt an approach that develops a DFOS-based HI in which a change in the mean value of the strain measurements is considered to be an indication of damage occurrence. In this section, we make the connection to severity as follows: an HI is established that consists of the changes in mean strain value with respect to the first strain measurement, with a larger change in the mean strain value directly leading to a larger change in HI value. Since two strain measurements are available (one for each stiffener foot), two sub-HIs are obtained, given as

where we give equal weight to each index, and we subtract
Fusion
After establishing the separate HIs from the AE technique
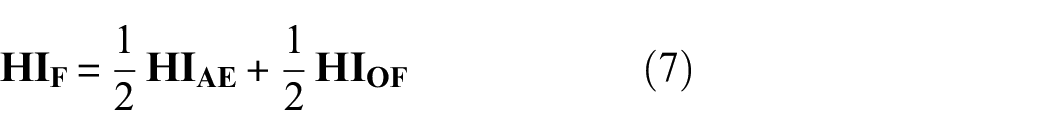
with each HI having equal weight of
Note that, similar to the considerations for the damage detection methodology, the measurement intervals of AE and OF are not equal, posing challenges when fusing the HIs. Therefore, to allow for a fusion, we adopted a similar method as specified for the fused damage detection, in which we substitute the preceding value for any “missing” value. The procedure to establish the fused HI
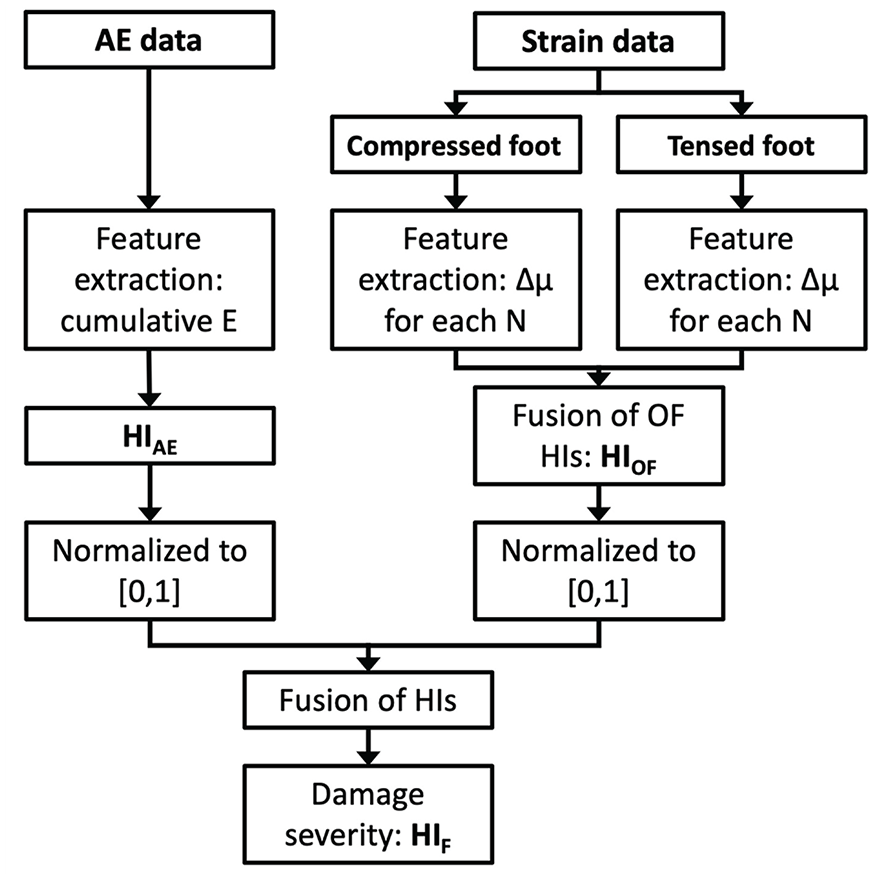
Flowchart depicting damage severity methodology.
Results and discussion
Fusing AE and DFOS data and their diagnostic results enables damage monitoring of each SSC throughout the fatigue test. The damage assessment of the SSCs is discussed following the four SHM levels, commencing with the first level: damage detection. This is followed by section “Level 2 and 3: damage localization and damage type identification,” in which a simultaneous assessment of damage localization and type is made due to their interdependence. Finally, the damage severity (level 4) is assessed using fused HIs.
Level 1: damage detection
The extraction of the fused damage detection feature
Fused damage detection curves
Level 2 and 3: damage localization and damage type identification
In this section, the damage localization and type identification results are presented. The diagnostic results for the second and third levels are discussed together because the proposed methodology employs an integral fusion of their (sub-)results. For example, the disbond identification results are employed in order to determine strain-based disbond localization, and both the disbond localization and identification are combined with AE localization to interpret the AE clustering results. Before assessing each SSC separately, the diagnostic results from the strain and AE data are shortly introduced next.
DFOS
Strain data are used to identify stiffness degradation and disbond growth following the proposed damage type identification algorithm. From the strain measurements, this results in two vectors containing fatigue cycles, namely,
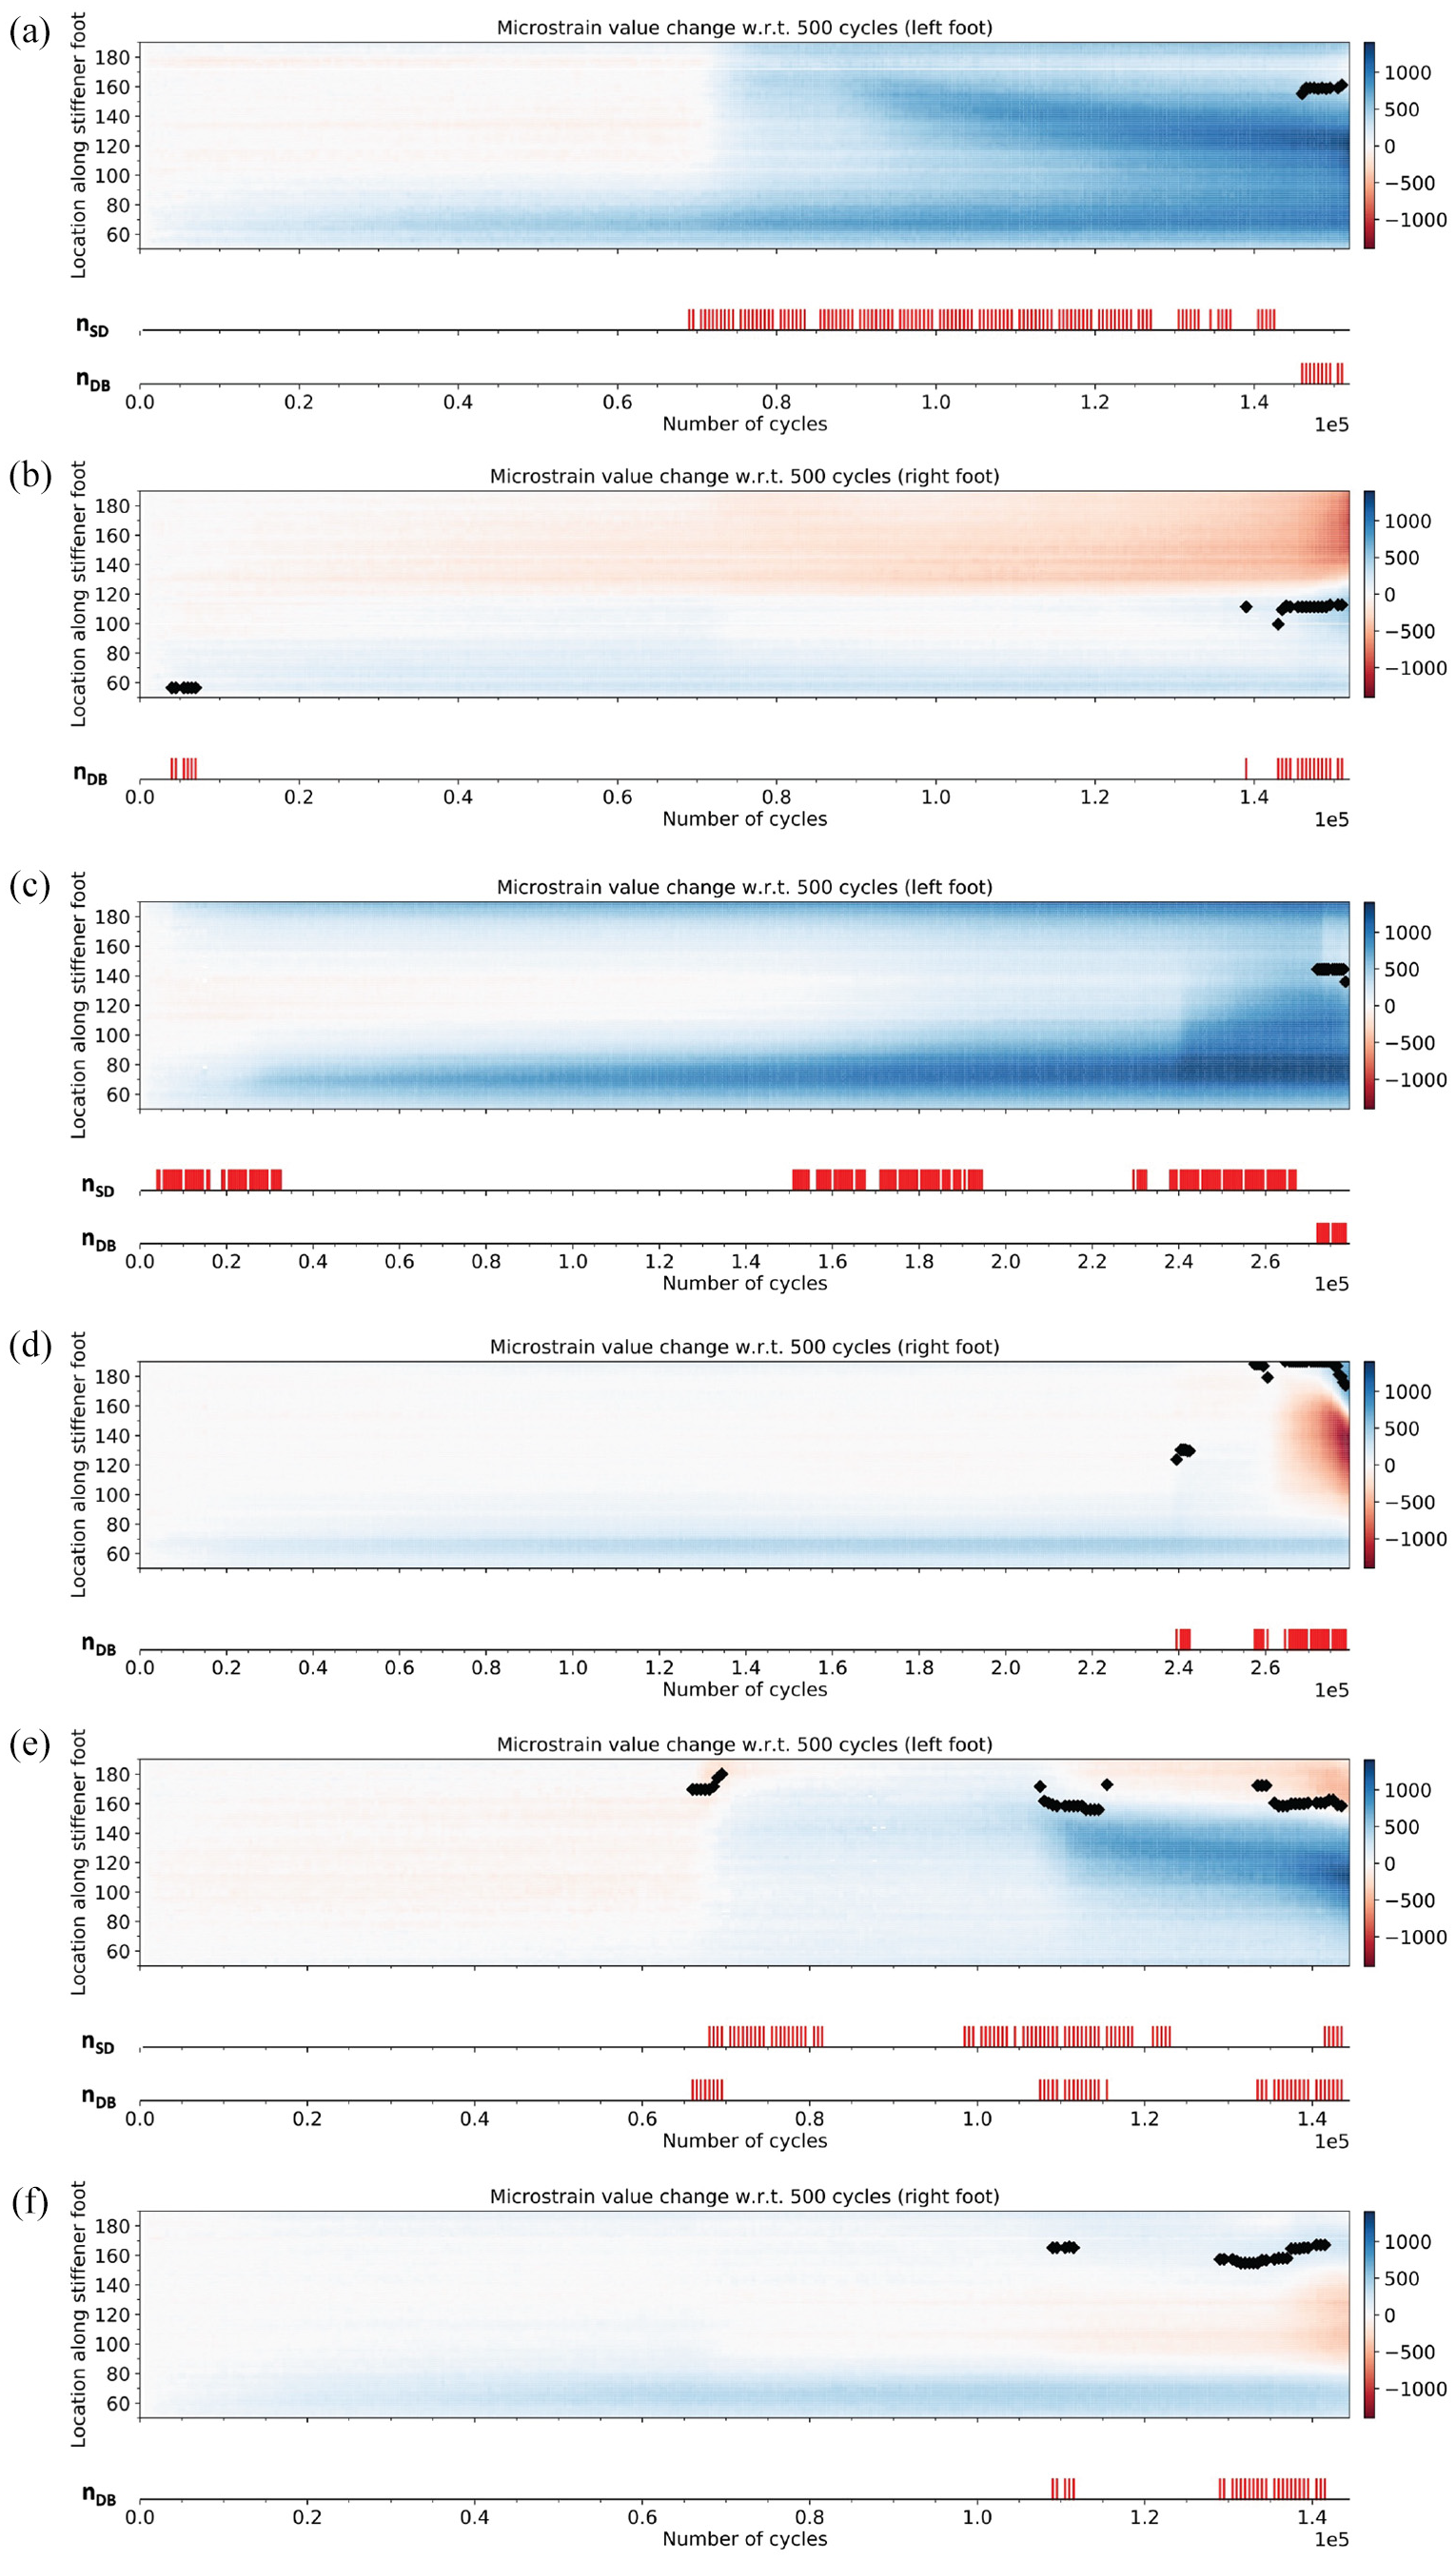
Colorplots indicating the change in strain with respect to the strain curve measured at 500 cycles for each SSC: (a) and (b) L1-03, (c) and (d) L1-04, and (e) and (f) L1-05. The x-axis indicates the number of cycles, y-axis indicates the location along the stiffener foot, and the color indicates the change in strain. In addition, the identified location of the disbond is shown by the black scatterpoints. Below the colorplots, the cycle numbers at which stiffness degradation or a disbond is identified are presented (
AE
The localized AE events are clustered using PCA and k-means clustering following the proposed methodology. For evaluation of the results, two types of x-y localization plots are employed. First, a kernel density estimation is presented in which the AE events are split per cluster. This allows one to interpret the intensity of the number of AE events in certain regions; information that is lost when plotting all localized events on top of one another. Second, to allow for a time-wise interpretation of damage growth, clustered localized AE events are plotted separately for several cycle periods. The results are indicated for L1-03 to L1-05 in Figures 13 to 15, respectively. Note that the presented cycle periods differ per SSC and are based on the obtained measurement data. In addition, the localized events were clustered into two clusters. From the presented clustering results for each SSC, the inference is drawn that cluster 1 contains AE events caused by the propagation of delaminations (including disbonds), while the remaining events are included in cluster 2. For each SSC, most AE events in cluster 1 are located near the impact or centered in areas at the stiffener. Contrarily, cluster 2 shows localized events with a wider spread throughout the SSCs, including the skin.
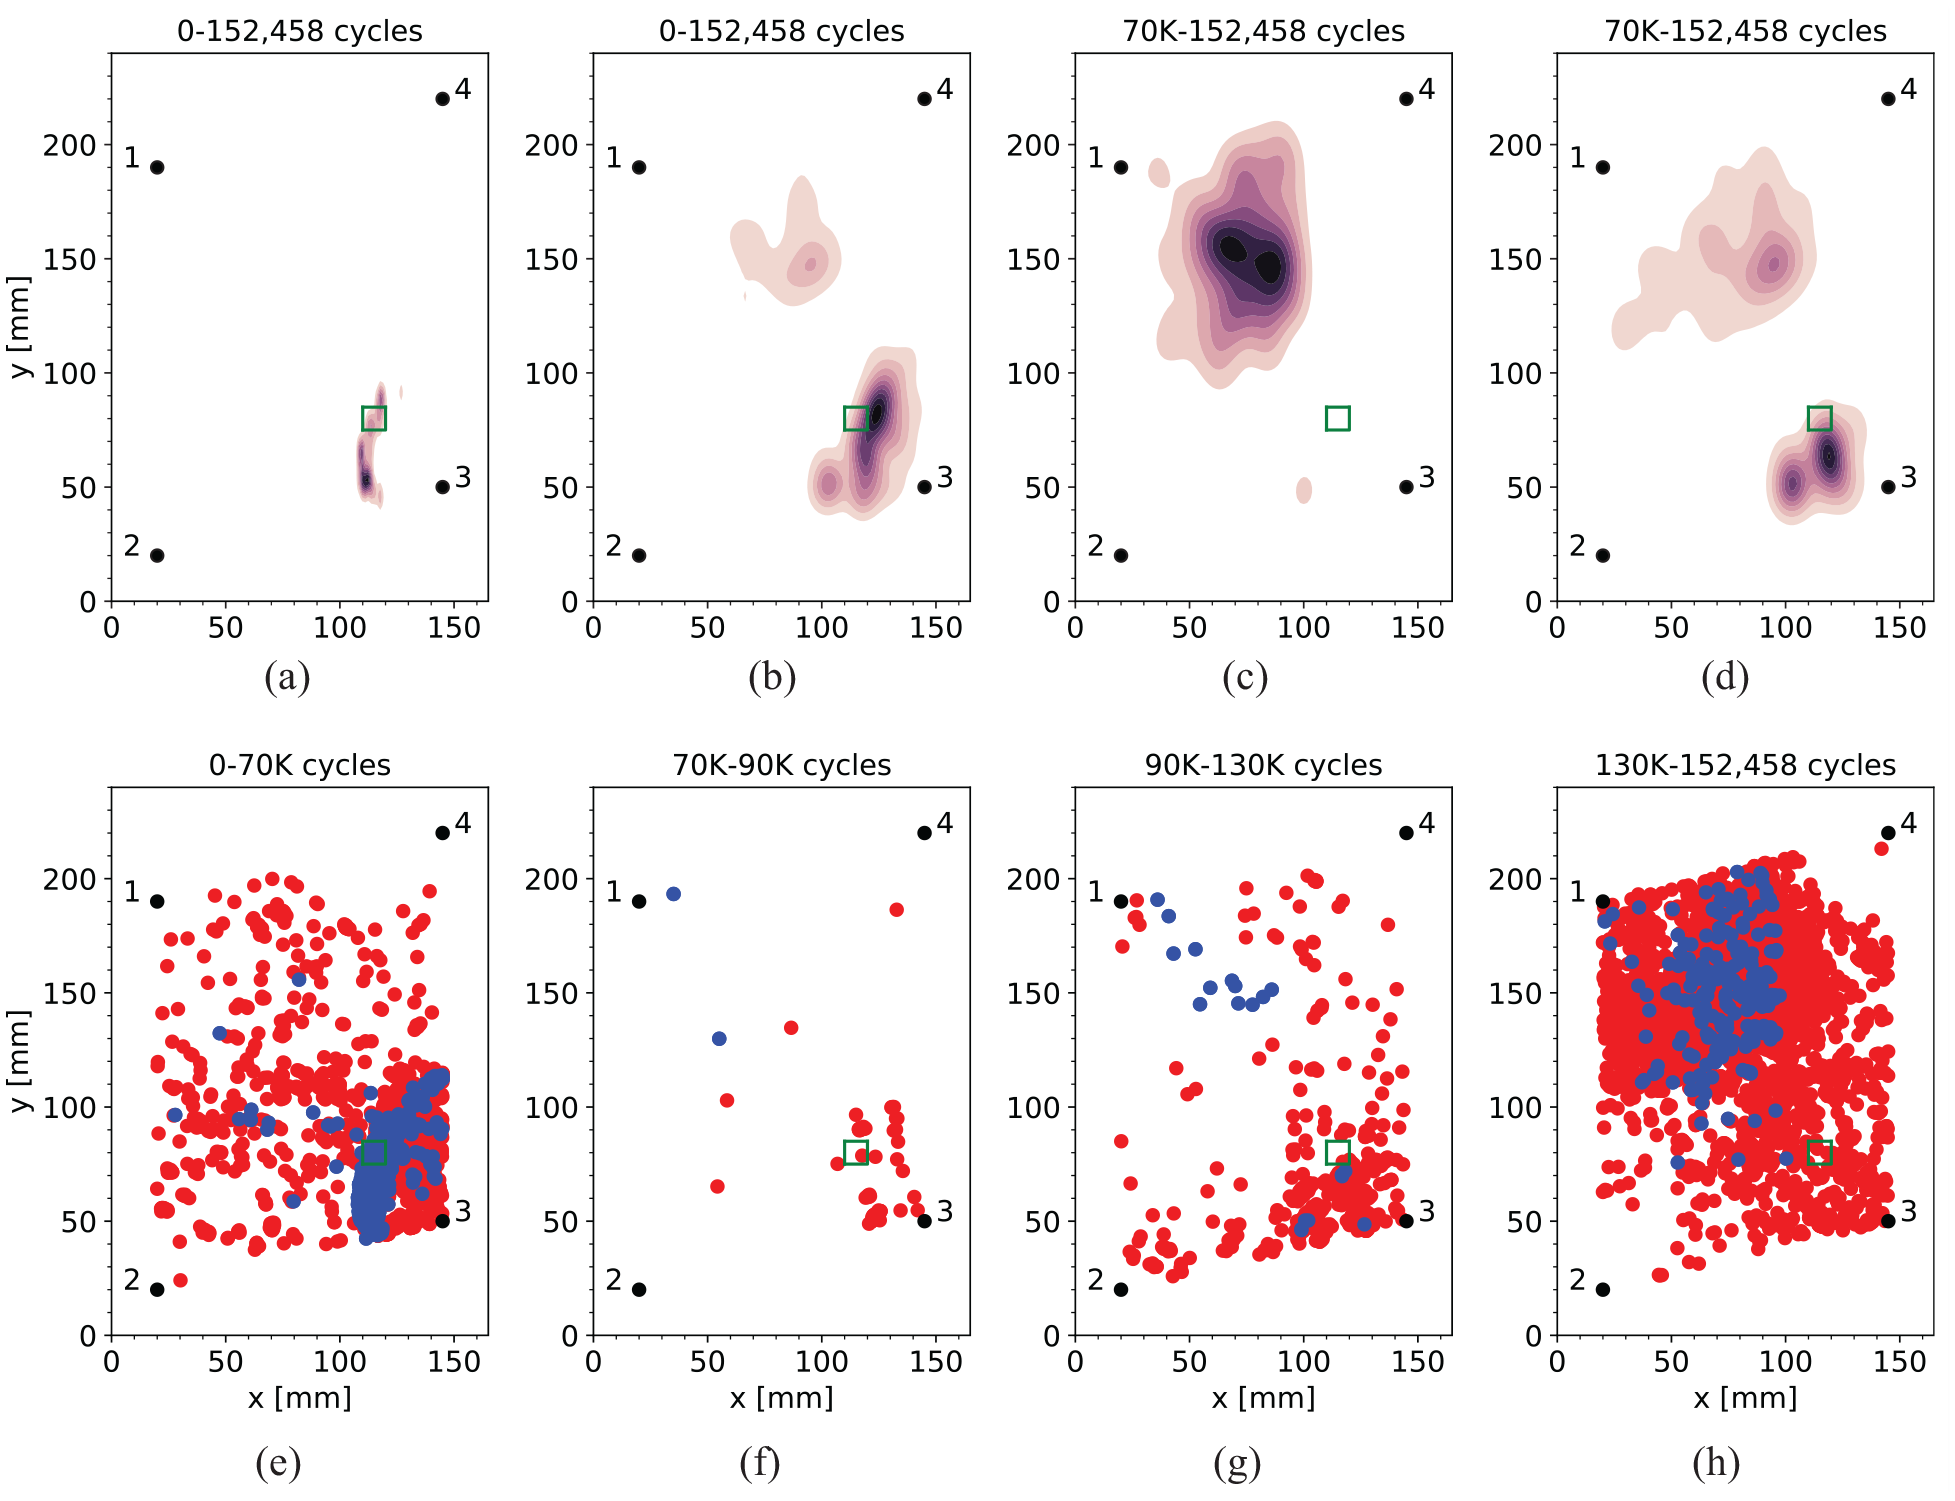
Kernel density estimation (a) to (d) and time-wise (e) to (h) plots for the clustered and localized AE events results of L1-03. In (e) to (h), clusters 1 and 2 are indicated using blue and red scatterpoints, respectively.
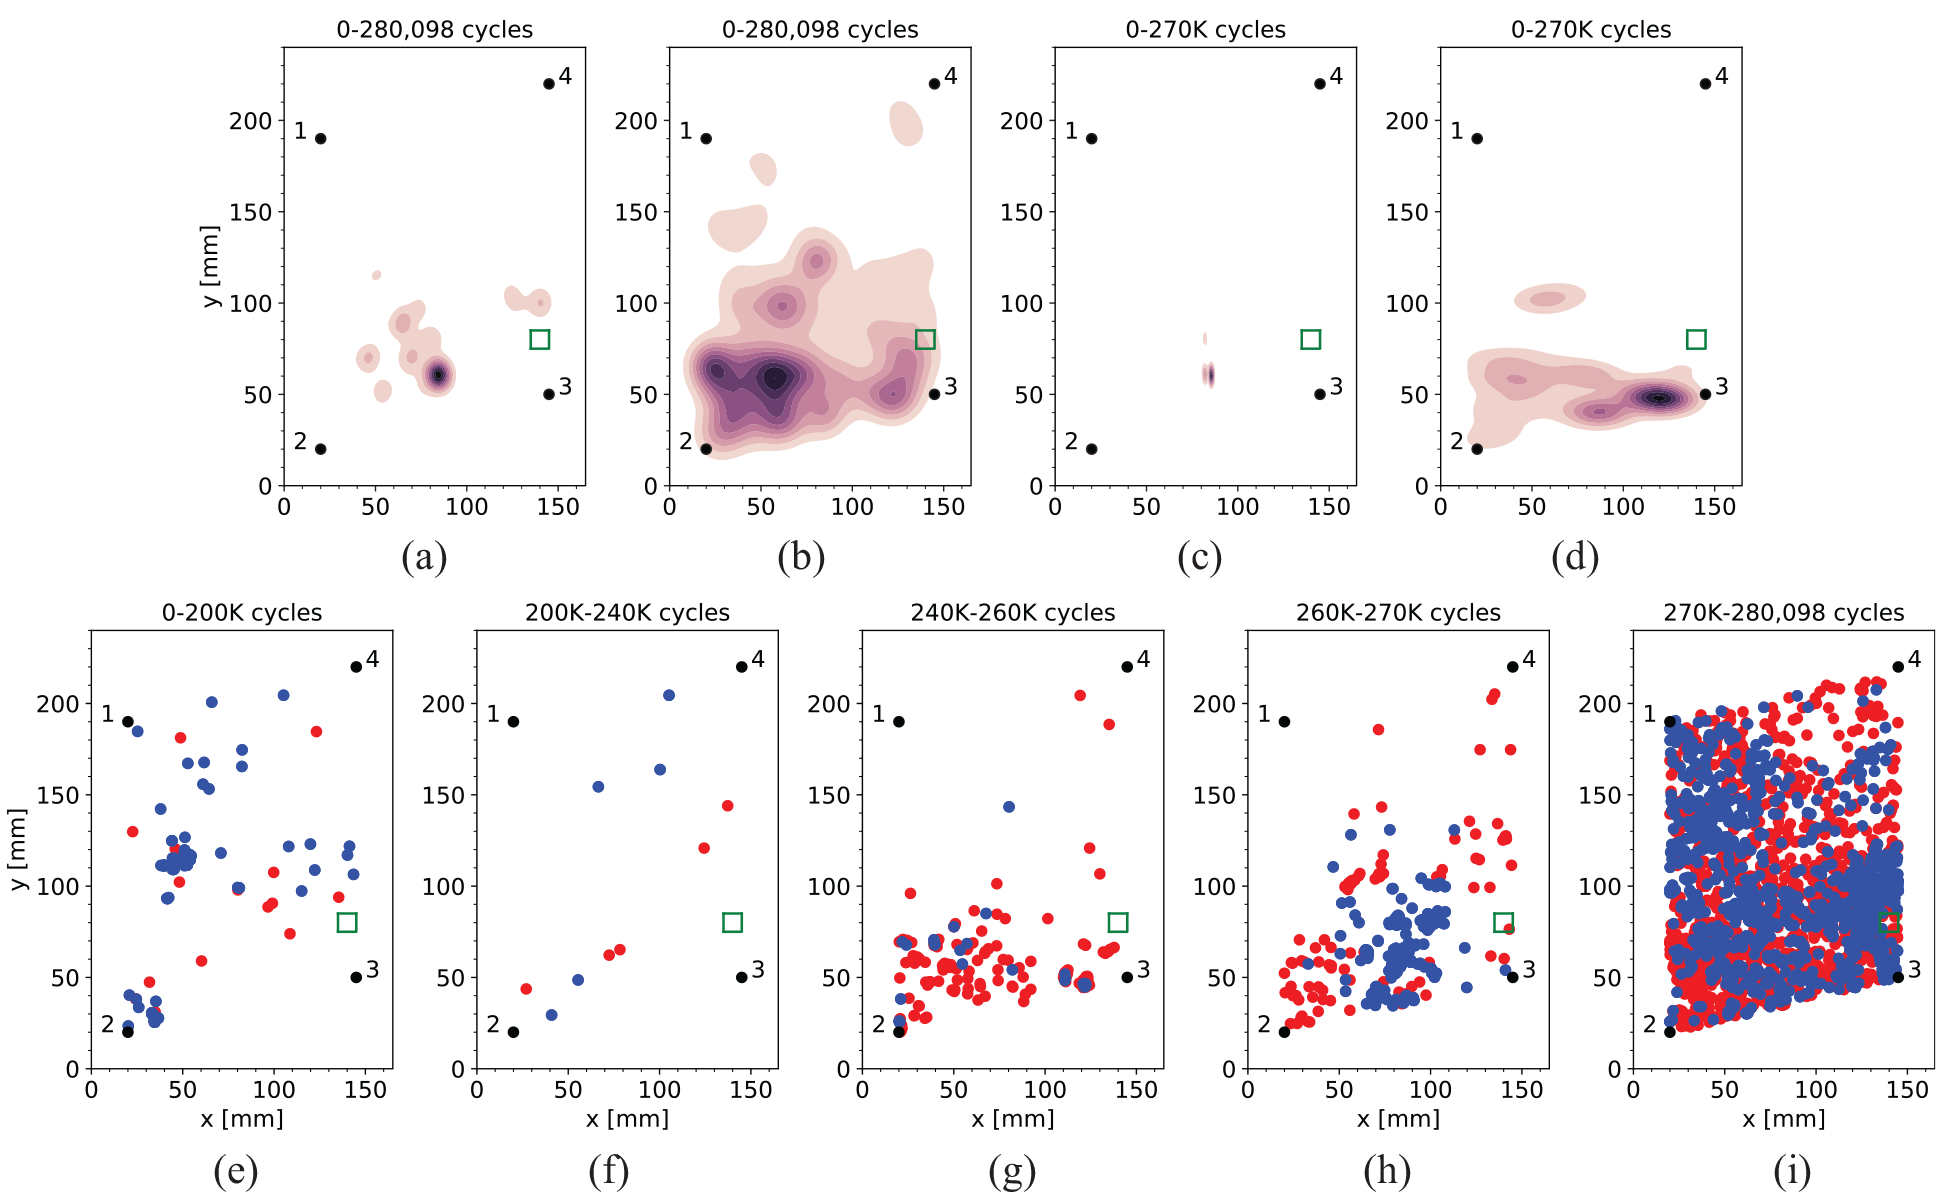
Kernel density estimation (a) to (d) and time-wise (e) to (i) plots for the clustered and localized AE events results of L1-04. In (e) to (i), clusters 1 and 2 are indicated using blue and red scatterpoints, respectively.
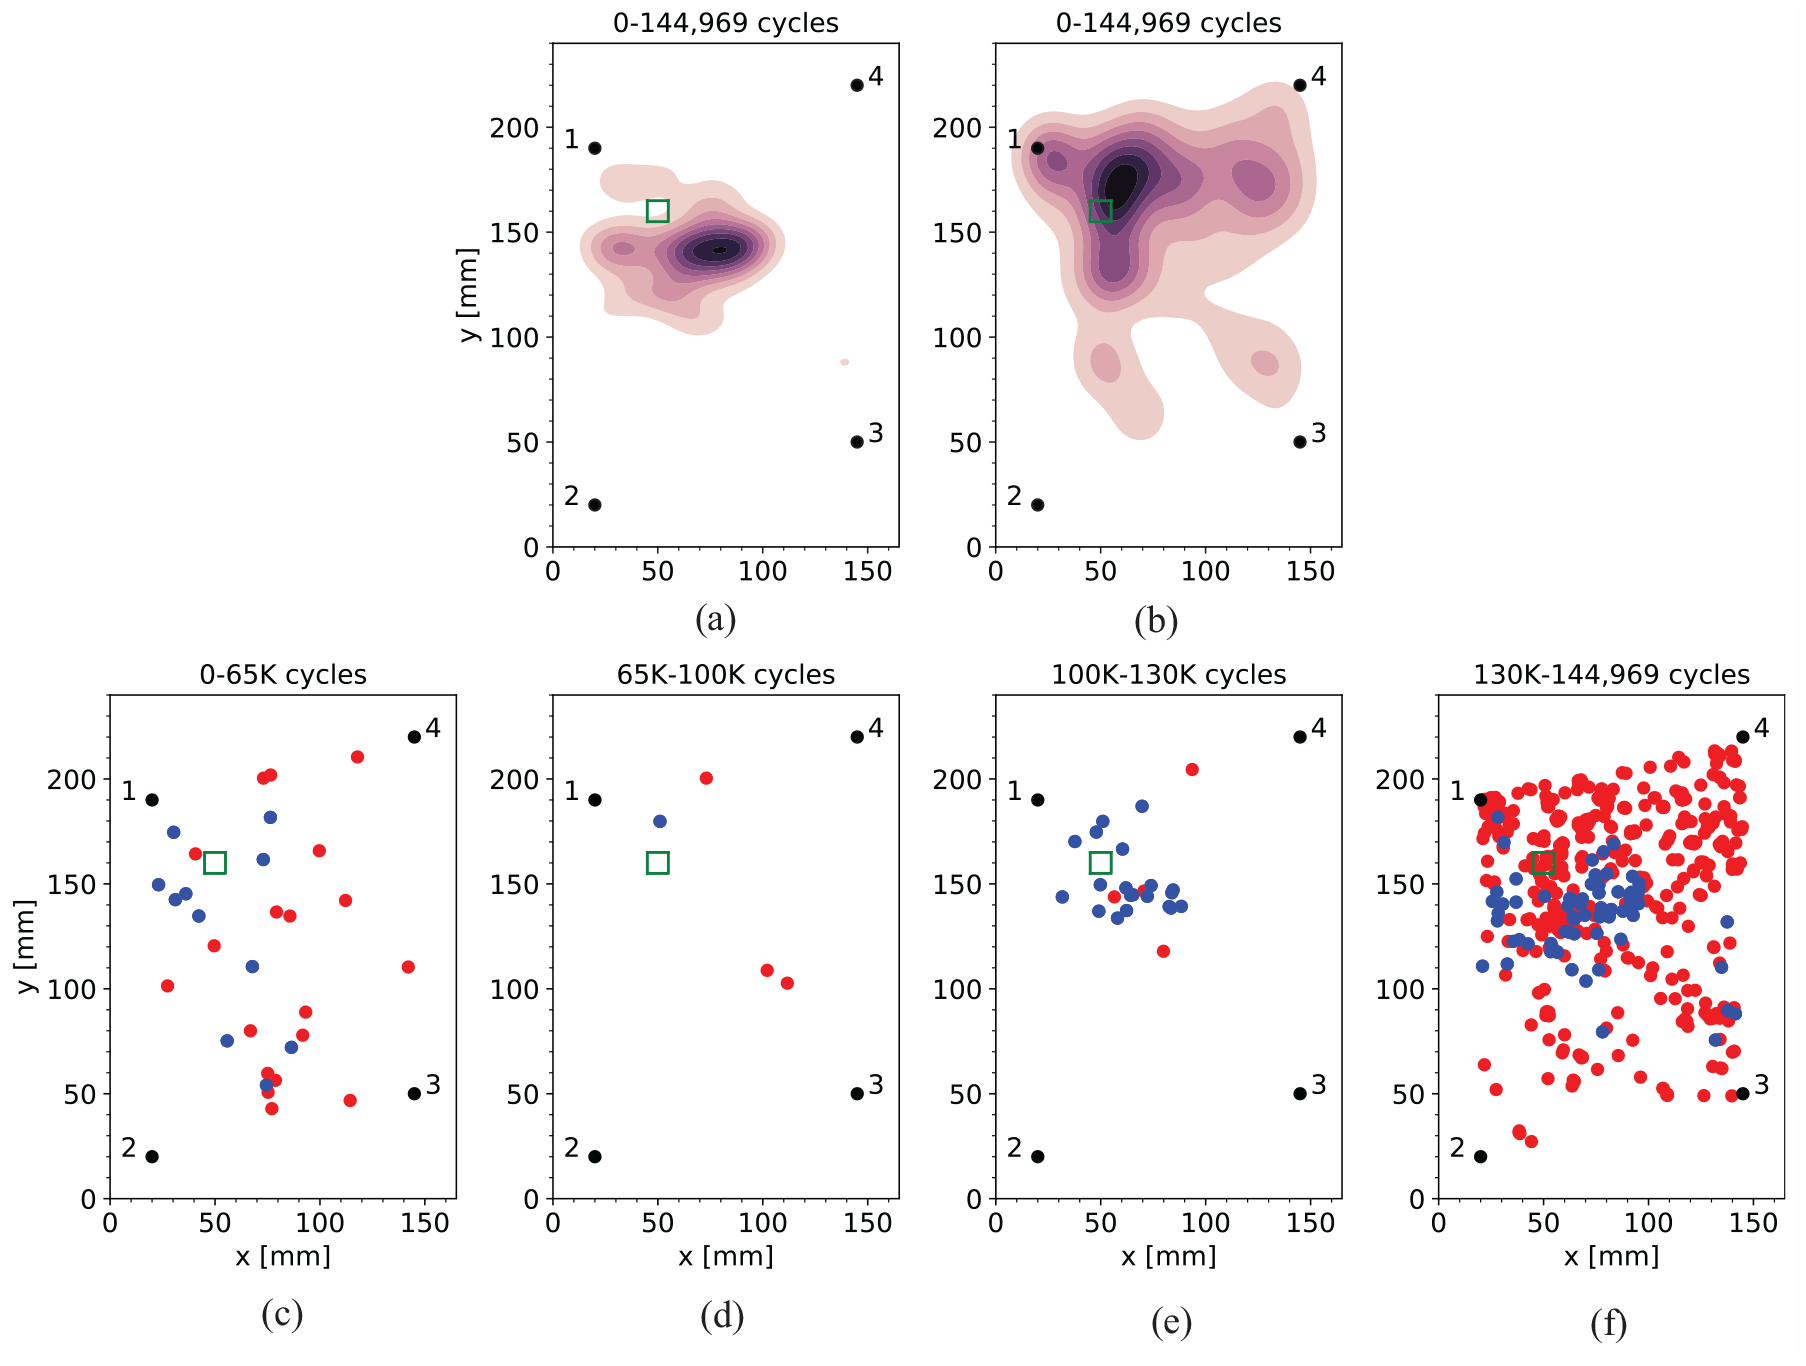
Kernel density estimation (a) and (b) and time-wise (c) to (f) plots for the clustered and localized AE events results of L1-05. In (e) to (h), clusters 1 and 2 are indicated using blue and red scatterpoints, respectively.
L1-03
The SSC L1-03 was impacted at the edge of the stiffener foot before applying fatigue loading. The localized and clustered AE events in Figure 13(e) indicate that the impact caused delamination growth (cluster 1) in the first few thousand fatigue cycles with an extension of the delaminated region inward of the skin. Moreover, the strain measurements (Figure 12) indicate some delamination growth near the right stiffener foot during the first few thousand cycles. After 10,000 cycles, little delamination growth is observed in either of the diagnostic results; although, stiffness degradation is identified from 69,000 cycles onward. AE data indicate a disbond growth after 130,000 cycles in the upper half of the left stiffener foot, which continues to grow until final failure. The identification of disbond growth based on the strain measurements is slightly delayed with respect to the AE results, indicating the first disbond growth at 143,000 and 146,000 cycles for the right and left stiffener foot, respectively. Moreover, disbond growth is detected in two regions: for the left stiffener foot in the upper half and for the right stiffener foot in the lower half and closer to the center of the SSC, which continues to grow until final failure. Note that this infers that although the impact caused a delamination that subsequently grew during the first 10,000 cycles, it was not the main source leading to the final failure of the SSC: this was caused by a disbond originating in the upper half of the left stiffener foot that subsequently grew across its length and width, resulting in the loss of the load-bearing capability of the SSC, hence in final failure.
L1-04
The SSC L1-04 was impacted in the right bottom half of the skin. Figure 14(e) and (f) indicates little AE activity in the first 240,000 cycles and no large activity near the impacted region besides some events located 2 cm above the impact location, as well as more spread throughout the SSC. The strain measurements seem to confirm that no disbond growth occurs as no activity is identified by the damage type identification algorithm. Only some initial stiffness degradation is identified in the first 30,000 cycles, which was previously deemed erroneous. No further stiffness degradation is identified hereafter until the interval of 151,000 to 194,500 cycles and after 229,500 cycles. Diagnostic results indicate that disbond growth in the right stiffener foot (Figure 12(d)) is first identified at 239,500 cycles and is subsequently identified up until final failure. Simultaneously, AE events are localized in the lower bottom half of the SSC. Between 260,000 cycles and final failure, the activity of cluster 1 (delaminations) accumulates at the bottom center half of the stiffener, which is clearly visible in Figure 14(c). The AE data indicate that the disbond grows both upward, toward the center of the SSC, and through its width. The latter is confirmed by the first disbond identification in the left stiffener foot at 272,000 cycles (Figure 12(c)). The identified disbond growth along the length and width of the bottom half of the stiffener in the final 40,000 cycles of the FCAI test resulted in the final failure of the SSC.
Although the diagnostic results seem to be consistent, the disbond localization algorithm based on strain data is not performing sufficiently. On the one hand, for the left stiffener foot, the disbond location is indicated only slightly above that of the AE results. On the other hand, for the right stiffener foot, the disbond locations as indicated in Figure 12(d) are not in agreement with those of the AE results. Where the strain-based localization algorithm initially localizes the disbond in the center region of the SSC, it is subsequently identified in the upper region and it is localized downward in the final stages of the test. Contrarily, the AE localization results indicate that most events, including those related to the disbond, are located in the bottom half. It is hypothesized that this difference is caused by the location of the disbond, which affects the buckling pattern and subsequently also affects the strain distribution. Whereas for the other SSCs, the disbond is concentrated in one of the stiffener feet, the results for L1-04 seem to indicate that the disbond initiated in the center width of the stiffener before growing outward. Consequently, this led to an erroneous disbond localization based on the strain measurements.
L1-05
The SSC L1-05 was impacted at the top of the left foot stiffener. Some initial AE events in cluster 1 are localized around the impacted region, but no substantial AE activity is recorded in the first 100,000 cycles (Figure 15(c) and (d)). Although a short period of disbond growth is detected by the damage type identification algorithm, as seen in Figure 12(e), where between 66,500 and 69,500 cycles, disbond growth is identified in the upper region of the left stiffener foot. As indicated by Figure 12(e), stiffness degradation is identified between 68,000 and 82,000 cycles, and again between 98,000 and 123,000 cycles. After 100,000 cycles, the clustered AE localized events indicate a disbond growth downward and toward the center of the stiffener, as seen in Figure 15(e). Disbond growth at the left stiffener foot is identified shortly afterward based on the strain measurements, as displayed in Figure 12(e). In this figure, the disbond localization results based on the strain measurements indicate a similar growth pattern downward, as well as toward the right stiffener foot, as confirmed by the first disbond growth identification around 110,000 cycles in the right stiffener foot (Figure 12(f)). From 130,000 cycles onward, the AE events indicate a continued disbond growth in the upper half of the stiffener toward the right stiffener foot (Figure 15(f)). This disbond growth in the right stiffener foot was also identified based on the strain measurements from 129,000 cycles onward. The propagation of the disbond growth along its length and width ultimately led to the final failure of L1-05.
Level 4: damage severity
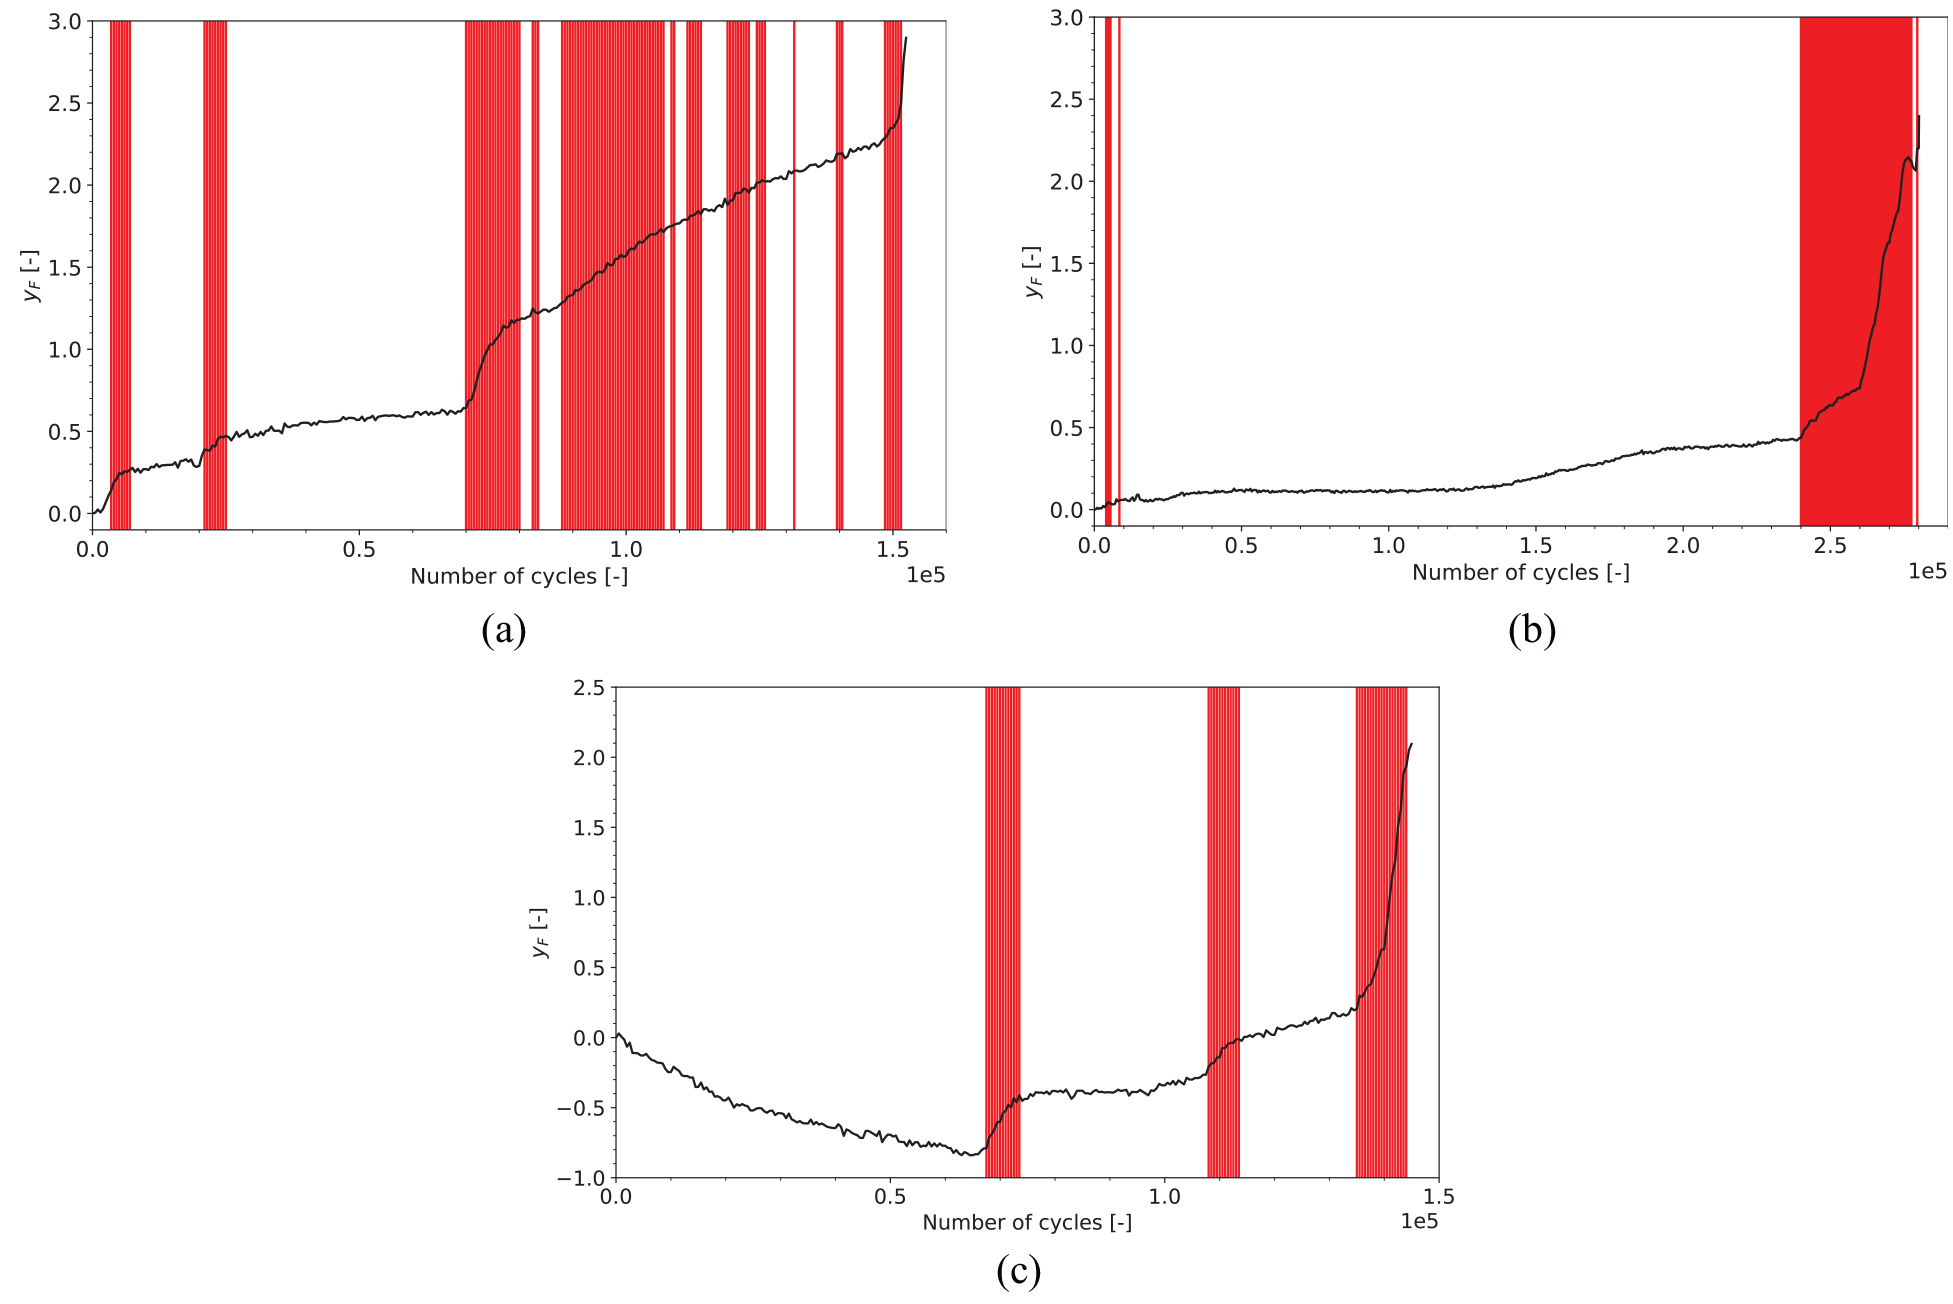
The fused HIs for each panel are presented in Figure 16, together with the HIs based solely on AE
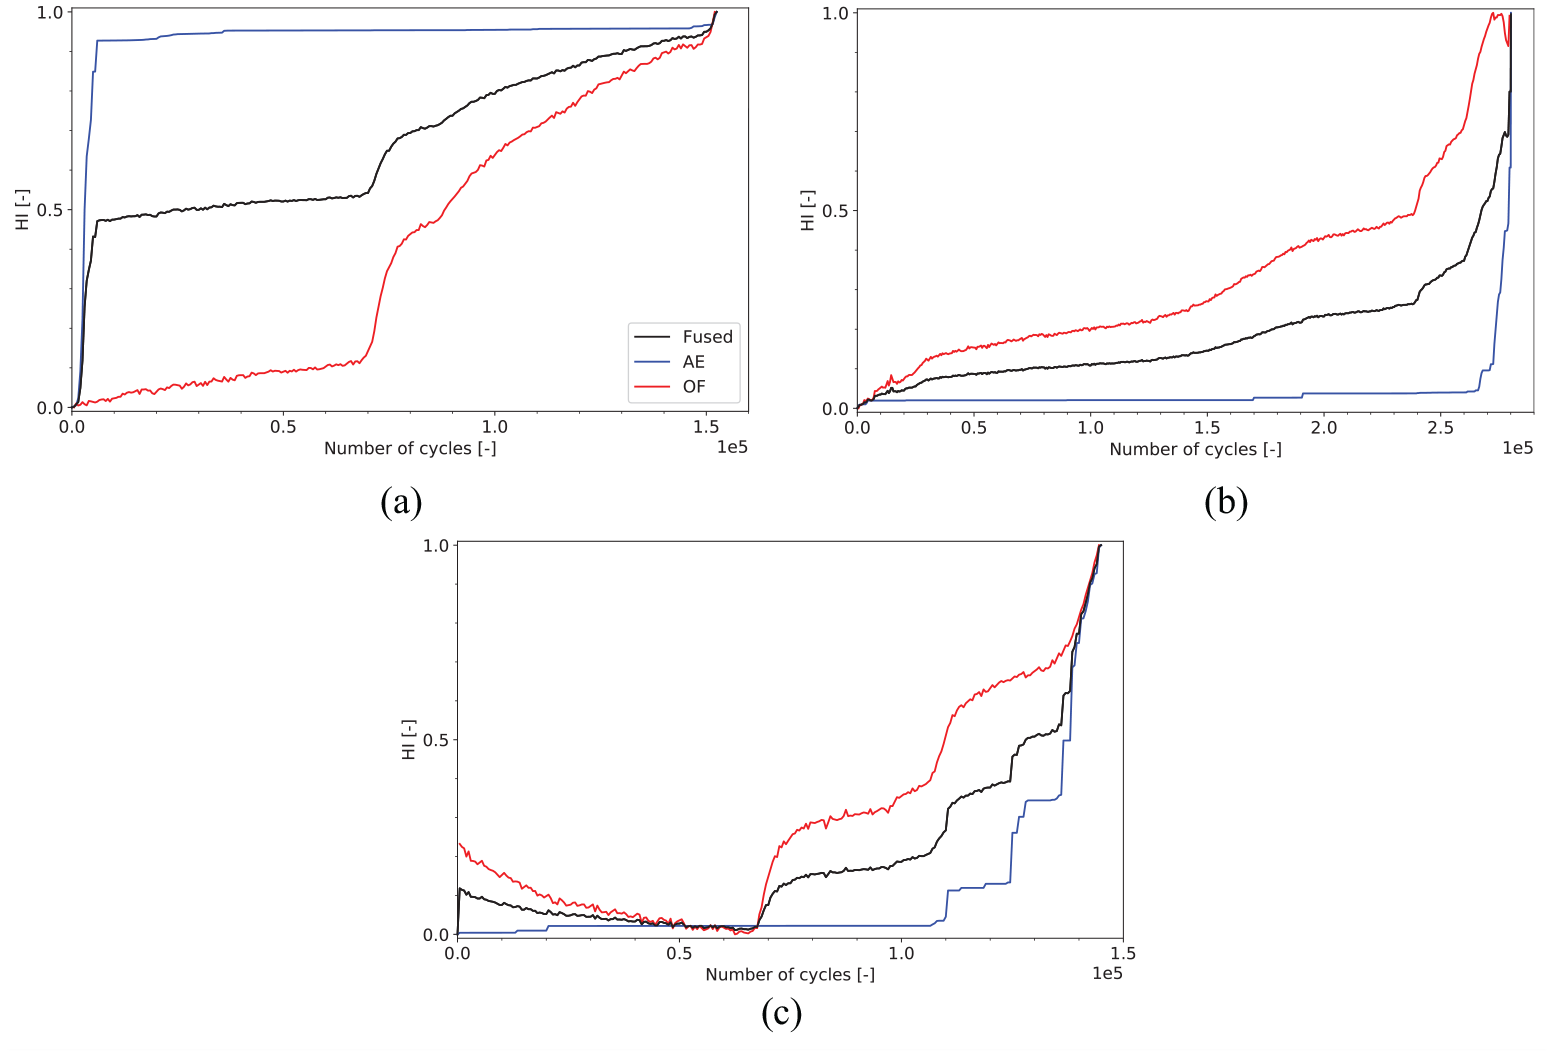
Fused
For L1-04, similar results are obtained, although displaying opposite behavior: whereas the strain-based
For the third SSC, L1-05, the obtained
Conclusion
A fusion-based approach for damage diagnostics of SSCs subjected to FCAI tests was presented in this work. A complementary and cooperative fusion method was proposed to combine AE and strain data, where the strengths of each SHM technique were identified and exploited to make a diagnostic assessment on the four SHM levels, namely: (1) detection, (2) localization, (3) damage type identification, and (4) damage severity. However, we learned that its fusion is not straightforward, as a variety of aspects must be faced first, such as the discrepancy between units, range values, and differences in data acquisition intervals. We implemented procedures to mitigate these challenges, including missing-value replacement and unity-based normalization, allowing for a successful fusion.
For the first level, that is, damage detection, feature-level fusion was performed on two features: one extracted from the AE data set (cumulative AE events) and one developed HI from the strain data set (a feature derived from the mean strain values). The fused feature was subsequently used in the development of a damage detection algorithm. By implementing such a feature-level fusion to obtain a hybrid feature, we showed that stiffness degradation, disbond growth, as well as other damage initiation and propagation unrelated to the disbond, can be detected in a synchronized manner. In contrast, if only AE data are employed, then stiffness degradation cannot be detected; if only strain data are employed, then the detection of damage outside the stiffener region is overlooked and the disbond growth detection is delayed.
Similar conclusions were drawn when assessing the damage propagation throughout the SSC during the fatigue tests, based on both the damage localization and damage type identification results. This work suggested a damage localization methodology that fuses AE and strain data in a complementary manner. The AE data allowed damage localization throughout the SSC, despite being affected by uncertainty errors caused by the anisotropy of the SSC. For disbond localization, a disbond identification and localization algorithm was presented that resulted in indications of the disbond location based on strain data, although the localization of the disbond edges requires further investigation. As these two techniques and their results clearly supplemented one another, a complementary fusion approach was introduced. The localization results from the different techniques were consistent for two SSCs, thereby showing agreement and conformity in the damage localization results, yet those for one SSC (L1-04) were competing and differed substantially. It is hypothesized that this was caused by the location of disbond initiation, although further research is required to confirm this hypothesis.
Furthermore, a second fusion approach was introduced that relies on both complementary and cooperative fusion techniques. This methodology was proposed to fuse the localization results and the damage type identification results. This resulted in a simultaneous time-based assessment of stiffness degradation, delaminations, disbond location, and disbond growth. Hereby, we concluded that a fusion of both damage location and damage type results based on both AE and strain data allows for a damage diagnostic throughout the fatigue load cycle up until the final failure of the SSC.
This study assessed the fourth SHM level, which considers damage severity, by implementing a feature-level fusion methodology that employs the AE cumulative energy and a DFOS-based HI relying on the change in mean strain value. This feature-level fusion led to the implementation of a fused HI with which we showed that performing a fusion allows for an improved assessment of the damage severity throughout the fatigue cycle. The fused HI takes into account both the information provided by the AE and the strain data, thereby resulting in the capability of assessing the severity based on the damage propagation in the complete SSC.
This work has demonstrated the advantages of a fusion-based framework on SHM data for damage diagnostics of complex composite structures such as stiffened panels subjected to realistic loadings as fatigue and impact. Fusion allows one to achieve a broader assessment of the damage initiation and propagation, thereby allowing for the inclusion of multiple damage types that cannot always be monitored by a single technique. Moreover, it enables us to move toward a full SHM level assessment rather than fixating on improving methodologies on a single level. This is of interest in the SHM application on complex structures used in-service, where a full damage diagnostic on all four SHM levels is required.
Although this work has shown the first steps toward a full SHM assessment, further analysis of the behavior of the considered SSCs is needed, as well as the effect of initial damage type and location. For example, the identification of impact damage has not yet been included in this work since the impact was performed before the start of damage monitoring. Only damage initiation and propagation occurring during the fatigue test can be detected and monitored; the damage present before fatigue testing goes unnoticed. In this regard, it can be of interest to include a fusion with dynamic strain sensing into the proposed framework. Another aspect requiring further improvement is the analysis of the strain data. Although the influence of a disbond on the strain distribution measurement is recognized, a method to extract its actual growth is pending and likely requires models such as an FEM. The latter closely relates to the damage assessment on the fourth SHM level, that is, severity, that vastly benefits from applying fusion techniques as demonstrated in this work. The fusion of additional SHM techniques, such as LW measurements, can also be of benefit here, thereby bringing its strengths to the table. Although further improvements must be considered, it is foreseen that developing and implementing fusion techniques in the field of SHM result in damage diagnostic frameworks capable of making assessments on all four SHM levels.
Footnotes
Appendix 1
Appendix 2
Strain data are used to identify stiffness degradation and disbond growth (Figure 12), resulting in two vectors containing fatigue cycles:
The load–displacement curves for several cycle intervals are given for each SSC in Figure 17. When comparing these with the results presented in Figure 12, an agreement can clearly be identified. For example, for L1-03, stiffness degradation is identified based on the strain measurements of the left (compressed) stiffener from 69,000 cycles onward (Figure 12). The load–displacement curves at 500 and 67,000 cycles (taking into account a range of 2000 cycles due to windowing) show no differences, whereas those at 67,000 and 129,000 cycles indicate a strong stiffness degradation. The remaining load–displacement curves show a further though less pronounced stiffness degradation, which corresponds to the lower number of cycle intervals in which stiffness degradation occurred.
For L1-04, similar agreements are obtained, except for the initial 30,000 cycles: stiffness degradation is identified; however, no indications are seen in the load–displacement curves. This indicates that the identification of stiffness degradation during the first 30,000 cycles is erroneous. Stiffness degradation is identified as well after 149,000 cycles, which is confirmed by the load–displacement curves, although one could expect a larger reduction in stiffness based on the length of the identified interval. This leads one to reason that the proposed stiffness degradation methodology is perhaps too sensitive to changes in the strain distribution for the L1-04 case. This can be confirmed by evaluating the
Finally, for the L1-05 SSC, the performance of the stiffness identification algorithm is seemingly improved. Figure 12(e) shows that stiffness degradation is detected between 68,000 and 82,000 cycles, and again between 98,000 and 123,000 cycles. Evaluating the load–displacement curves in Figure 17(c), a change in the slope between 66,000 and 84,000 cycles can be noted, as well as between 96,000 and 125,500 cycles. Simultaneously, the load–displacement curve at 84,000 and 96,000 cycles remains constant; hence, it is concluded that the fatigue cycles in
Acknowledgements
The authors acknowledge Embraer for the design of the SSCs, Optimal Structural Solutions for the manufacturing of the SSCs, Smartec for the SMARTapes procurement, and our colleagues at the University of Patras and Delft University of Technology for their technical support.
Declaration of conflicting interests
The author(s) declared no potential conflicts of interest with respect to the research, authorship, and/or publication of this article.
Funding
The author(s) disclosed receipt of the following financial support for the research, authorship, and/or publication of this article: This work was supported by the European Union’s Horizon 2020 research and innovation program (grant no. 769288).