
Abstract
Value of information analyses in structural integrity management has gained significant interest over especially the last decade. The concept of value of information analysis provides a methodical framework facilitating for the optimization of strategies for information collection through inspections and structural health monitoring. The information, which is collected, represents indications of the condition and performance of the structure and is generally subject to significant uncertainties. An important part of this uncertainty is directly related to the quality of the techniques that are utilized for collecting information. Whereas such uncertainties are generally appreciated and accounted for in the research literature, it is generally assumed that information of relevance of integrity management, collected over space and time, is unbiased and independent. In the present contribution, we investigate the possible consequences of such assumptions. To this end, we model the value of information associated with information collection and evaluate the effect of introducing biases and dependencies on the value of information. Two different probabilistic models are introduced to represent and study the effect of possible biases corresponding to the case where biases in information collected at different times are independent or fully dependent, respectively. The study is supported by the address of two different integrity management problems considering (1) an oil well tubing system subject to scaling and (2) a welded detail in steel structures subject to fatigue degradation.
Introduction
Value of information (VoI) in support of risk informed structural integrity management (SIM) has attracted significant interest in the civil engineering research community over the last decade, see, for example, COST Action TU1402. 1
The theoretical and methodical basis for VoI analysis in the context of risk informed SIM was developed already some 50 years ago through modern methods of structural reliability analysis by Freudenthal 2 and Bayesian decision analysis by Raiffa and Schlaifer. 3 Since then, important further developments of methods, techniques, and tools have been established for application related to especially to civil infrastructures such as offshore structures and bridges.
Original ideas on how to utilize Bayes’ theorem as basis for accounting for information collected by inspections in support of integrity management are presented by Tang 4 and Yang and Trapp. 5 These ideas were soon after adopted for applications in the offshore oil and gas industry for optimization of risk informed inspection and maintenance planning. First applications to this end are reported by Skjong 6 and Madsen, 7 considering integrity management of individual welded details in fixed steel jacket structures subject to fatigue crack growth. Adaptation of formulations for systems, considering multiple welded details in structural systems, is developed by Faber et al., 8 Moan and Song, 9 Faber and Sørensen, 11 and Straub and Faber. 12 In Faber, 13 a comprehensive account is provided on the major developments in the field of risk and reliability informed integrity management for offshore and marine oil and gas facilities.
A central issue in VoI analysis and system modeling in more general terms concerns the probabilistic representation of the information upon which the analysis and modeling is based. 14 In the context of risk, informed SIM information may be modeled by means of indicators—observable condition states of the structure. Within the framework of Bayesian prior/posterior and pre-posterior decision analysis in the context of SIM, indicators are generally utilized for either (1) updating of probabilistic representations of relevant condition states of the structure or (2) for updating of the probabilistic representation of individual random variables.
In SIM, monitoring and inspections serve to identify possible damage states and to provide information concerning the extent—or size of damages. In the probabilistic modeling of the quality of monitoring and inspections quality of monitoring, these two aspects are addressed through the probability of detection (PoD) and the uncertainty associated with sizing. An overview on probabilistic modeling of the quality of inspections is provided by Straub and Faber. 15 SIM for pipeline systems subject to corrosion-induced damages is developed by Xie and Tian. 16 As a means for detecting and sizing corrosions damages in such systems so-called in-line inspections (ILIs) may be applied. Probabilistic models for errors associated with detections and sizing are reported by, for example, Dann and Maes, 17 Dann and Huyse, 18 and Zhang and Zhou. 19 VoI analysis and associated probabilistic modeling in the context inspection planning for pipeline systems are addressed by Haladuick and Dann. 20
In the present contribution, closely following the framework for the representation of information in decision analysis, 14 we address the probabilistic modeling of information in the context of SIM with a focus on (1) the significance of biases associated with inspection results and (2) the effect dependencies between results of consecutive inspections—measured in terms of the VoI they facilitate. To this end, two different probabilistic models are introduced to represent and study the effect of possible biases corresponding to the case where biases in information collected at different times are independent or fully dependent, respectively. The study is supported by an example considering two different integrity management problems, that is, (1) an oil well tubing system subject to scaling and (2) a welded detail in steel structures subject to fatigue degradation.
Methodical framework for VoI-supported SIM
Integrity management of structures aims to maximize the service life benefits and/or to minimize the operational expenditure (OPEX). Information, which may be collected from, for example, inspections and monitoring may adequately be utilized to improve the understanding of the structural condition and general performances—and essentially forms the basis for SIM. However, due to a range of reasons, the collected information is generally not perfect and this may, in turn, result in SIM decisions, which are far less than optimal. Decision-making is fundamentally challenged by the fact that the available decision alternatives are associated with uncertainties. The optimality of SIM decisions critically depends upon the quality of the collected information and the potential and relevance for improving the quality of collected information should ultimately be quantified using VoI analysis.
The introduction to VoI analysis is provided by Raiffa and Schlaifer. 3 VoI analysis in the context of SIM again takes the framework of Bayesian prior/posterior and pre-posterior decision analysis as the basis together with the axioms of utility theory, 21 where the expected value of benefits is the criteria to measure the value of the information. Following the engineering practice of SIM, the idea hereby is to analyze the difference among the expected values of the benefits (and/or reduce the OPEX) over the service life with or without different strategies for collecting additional information, even before it is collected. Uncertainties associated with different perspectives—including the strategy for collecting information, the collected information, actions, and the state of the structure—would be considered in the analysis of the benefits.
The decision event tree considered in SIM is illustrated in Figure 1. The information is collected through different strategies
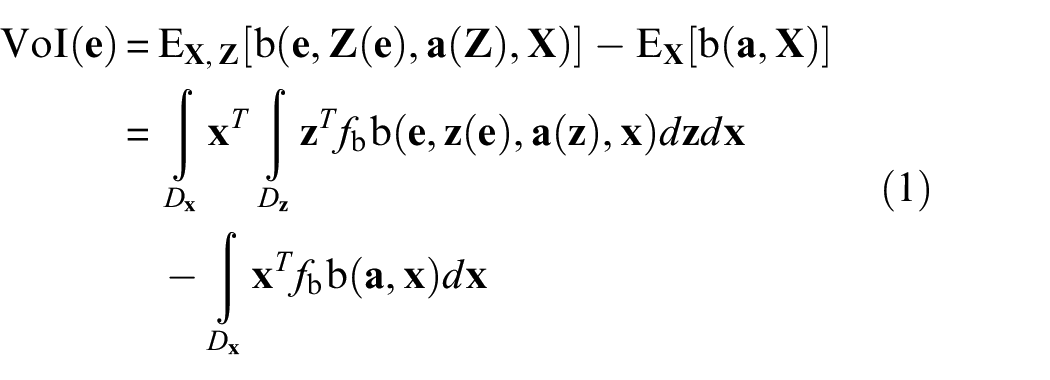
where
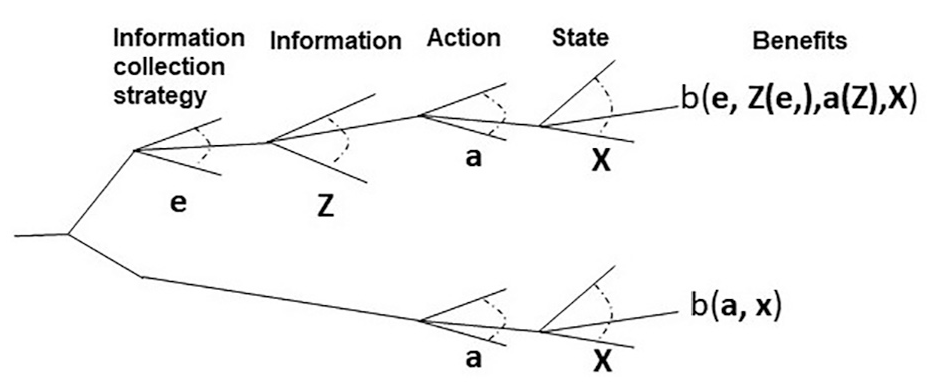
Illustration of the decision event tree considered in SIM of engineered structures.
VoI analysis provides identification of the steps in the SIM value chain for the uncertainties involved in additional information that has been added across the different types of systems such as structures and wells, and of offshore oil and gas production facilities for the reduction in OPEX. VoI may ensure that the general approach and applied modeling across the different types of systems are consistent with respect to the representation of uncertainties related to information and accounted for the optimization of SIM strategies.
Information modeling in SIM
The basis for SIM is the information concerning the states of engineered structures and the knowledge synthesized on the basis of the information. Therefore, we need to collect relevant information to update our knowledge about the states of the structures to facilitate SIM. In accordance with Nielsen et al., 14 five classes to represent the information are proposed as follows:
Class 1: the information is relevant and precise.
Class 2: the information is relevant but imprecise.
Class 3: the information is irrelevant.
Class 4: the information is relevant but incorrect.
Class 5: the flow of information is disrupted or delayed.
In the following, the information
There are normally two types of strategies
To facilitate SIM, both SHM and inspections may be implemented to observe the indicators relevant to the unknown state
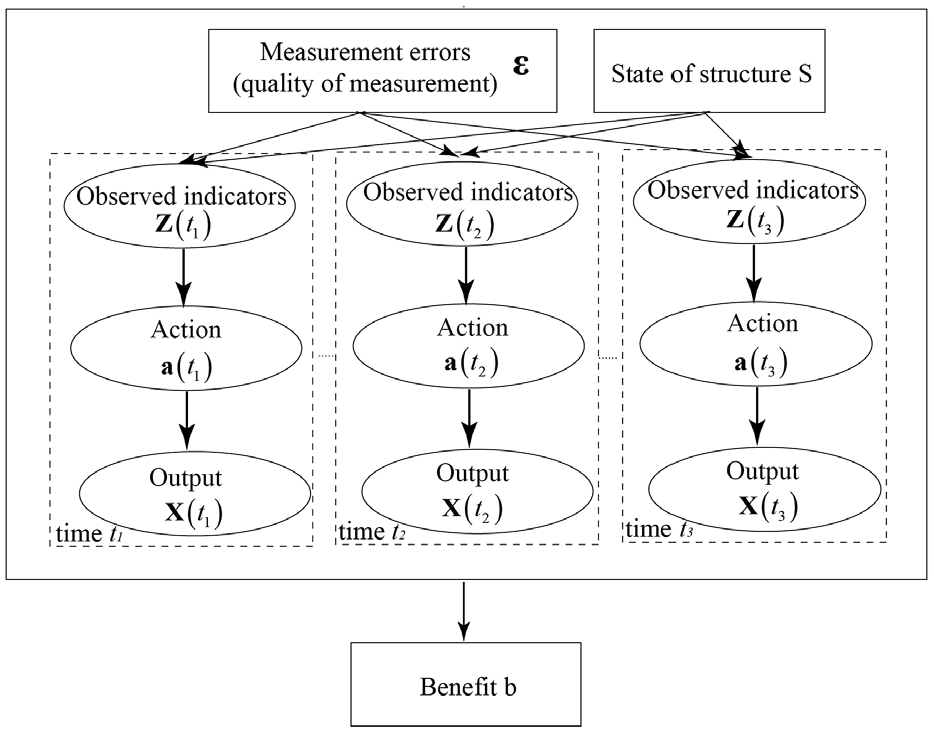
Illustration of two types of dependency models of errors in the collected information at different times.
This article presents two different models to describe errors in the collected information
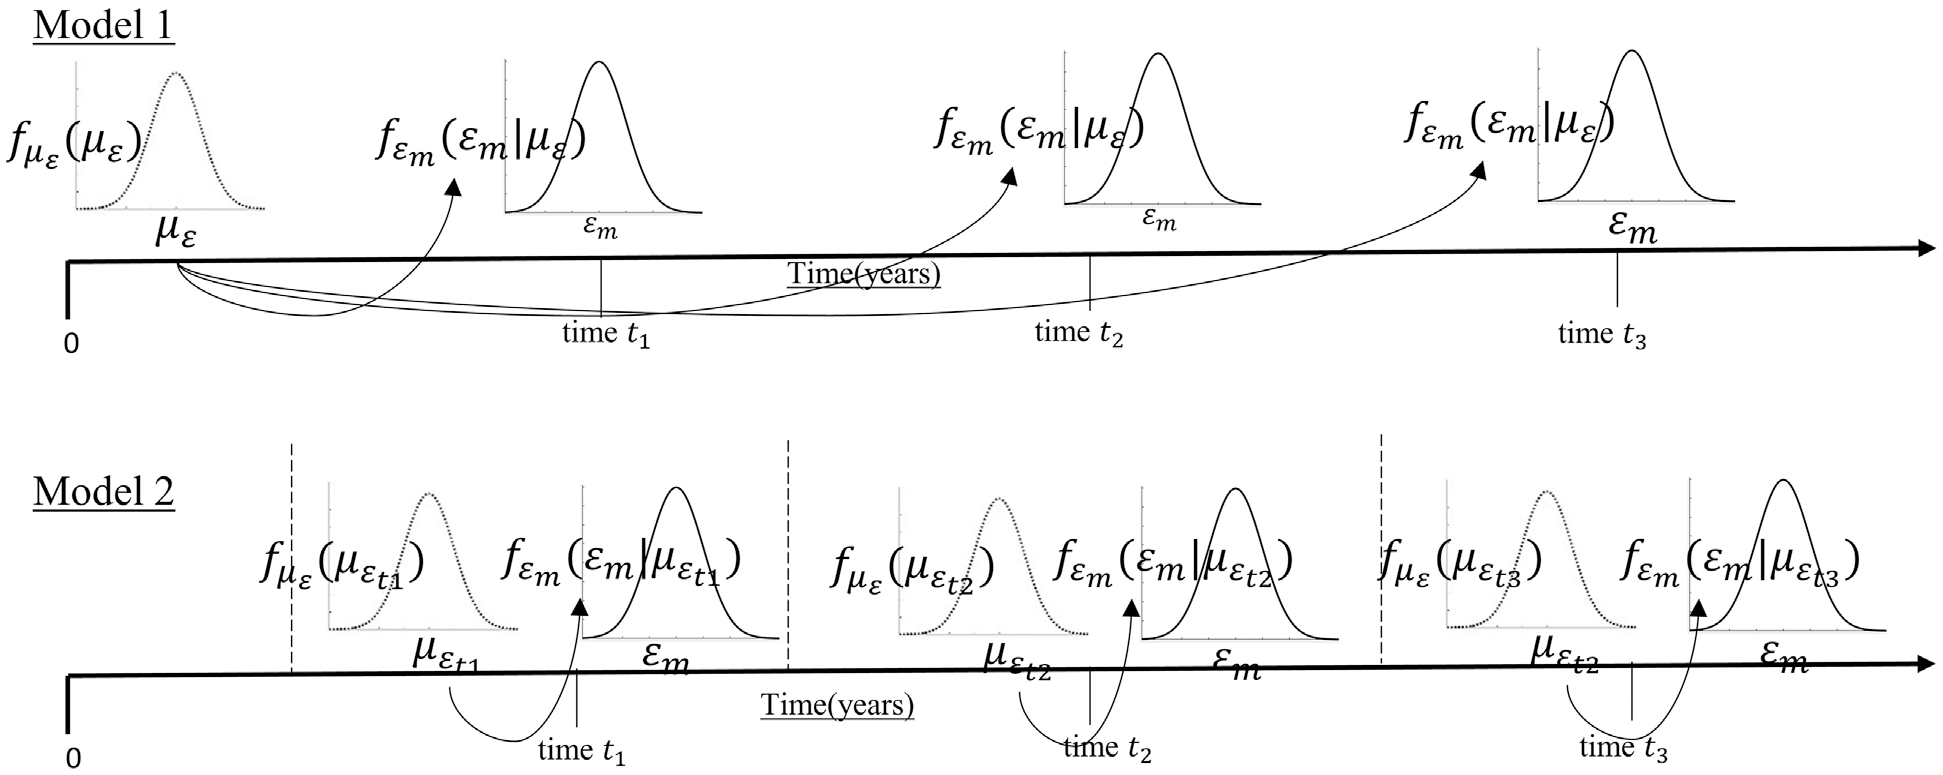
Illustration of two sources of dependencies between the observed indicators given the choice e.
Model 1 might be relevant in the case where a measurement device is installed imperfectly such that measurements are systematically shifted from the true value; an example of this concerns strain gages installed at an incorrect angle. In Model 2, it is assumed that the realizations of the systematic errors might differ at different inspections times. The time indices
The VoI analysis for the scenarios with these two different models of measurement errors
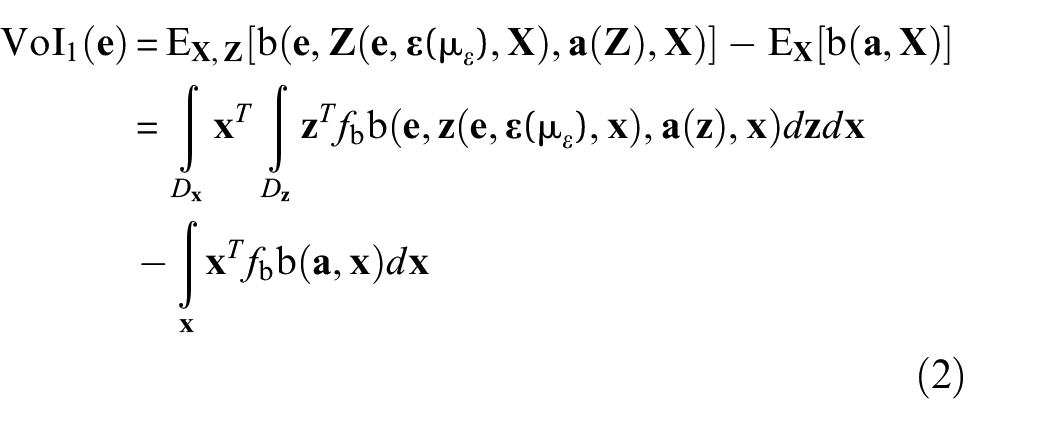
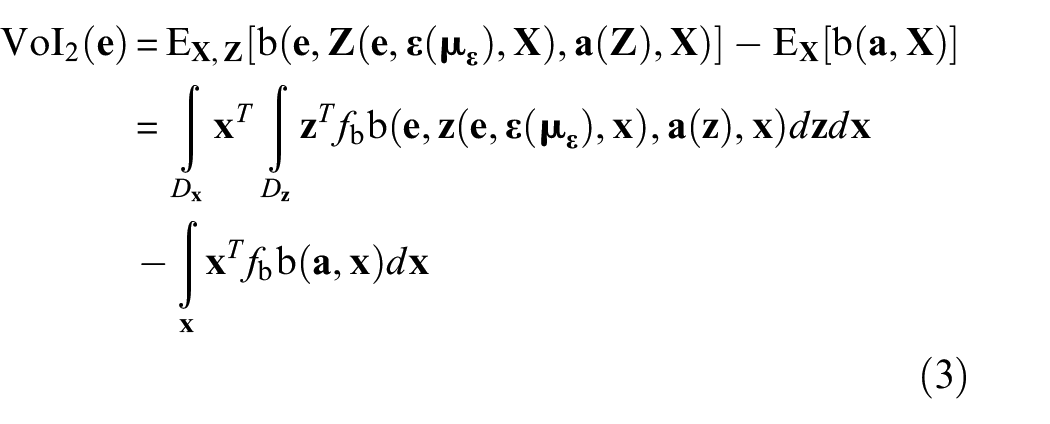
Equations (2) and (3) represent VoI analysis for the scenarios with Model 1 and Model 2, respectively. Note that in VoI analysis for the scenarios with Model 1, the measurement error
In the next sections, the two dependency models are addressed and investigated in two different contexts of VoI analysis–supported SIM. The first example concerns the modeling and assessment of VoI in the context of integrity management of an oil production well system subject to scale degradation. In the second example, VoI is analyzed considering the life cycle cost minimization for a welded detail in a steel structure subject to fatigue crack growth.
Example: VoI analysis for measurements of scale degradation of subsurface wells in the context of SIM
Introduction
In this example, the VoI associated with measurements of scale degradation is investigated in the context of SIM of subsurface wells, accounting for the influence of systematic errors (bias) of the measurements and considering the two different models for the representations of dependencies between those errors at different times. The oil production from subsurface wells during their service life may be reduced or even lost due to a reduction of the inner diameter of the production tubing. The reduction considered here is assumed caused by inorganic depositions of salts—called scaling—including the formation of hard deposits of calcium carbonate (CaCO3) and barium sulfate (BaSO4) as shown in Figure 4. The industrial practice shows that scale such as barium sulfate is formed mainly along the horizontal tubing, at the depth of the reservoir, while calcium carbonate deposits normally are formed at lower depths in the vertical part of the tubing. To gain knowledge about the level of scaling and to facilitate optimization of SIM, inspections are performed to measure the scale propagation using, for example, multi-finger caliper measurements. However, the results from those measurements—at any given location—are generally associated with uncertainties and possible biases. Moreover, measurements at different times are subject to stochastic dependencies. In this section, the value of the information from measurements of scale propagation of one subsurface well is investigated—accounting for the uncertainties and the bias together with the stochastic dependency between the measurement results at different times, to support SIM.
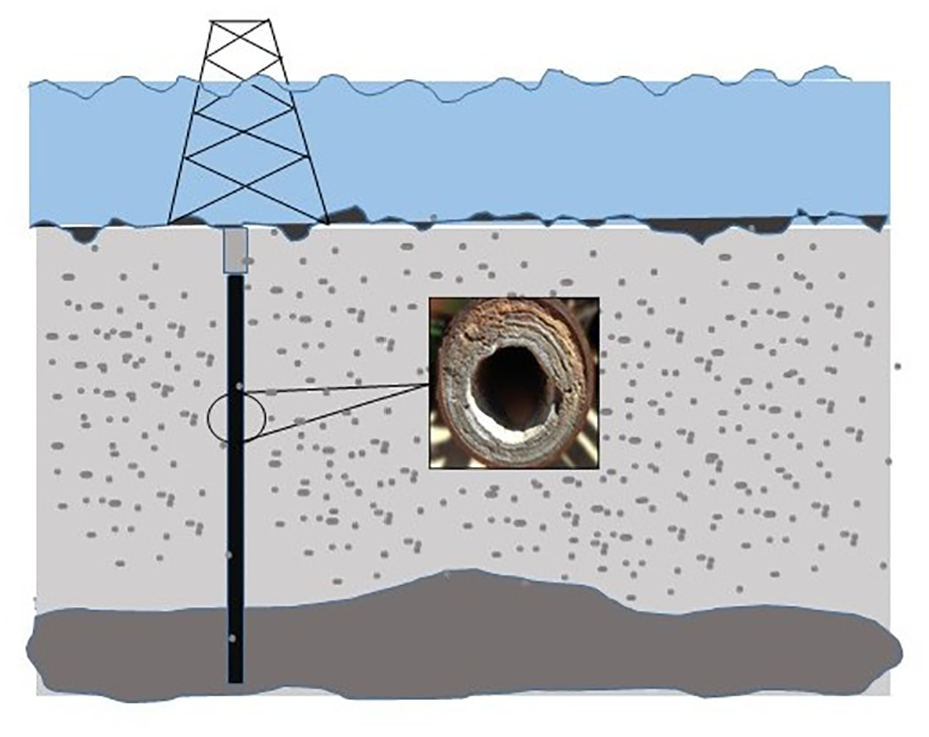
Illustration of scale deposits in a subsurface well.
The subsurface well considered here for illustrational purposes is assumed to have a 30-year service life. Inspections are assumed performed with equidistant time intervals to support the decision of maintenance actions and further SIM decision optimization. Three different inspection intervals are considered here, that is, 2, 6, and 10 years. The accumulated scale growth at year t,

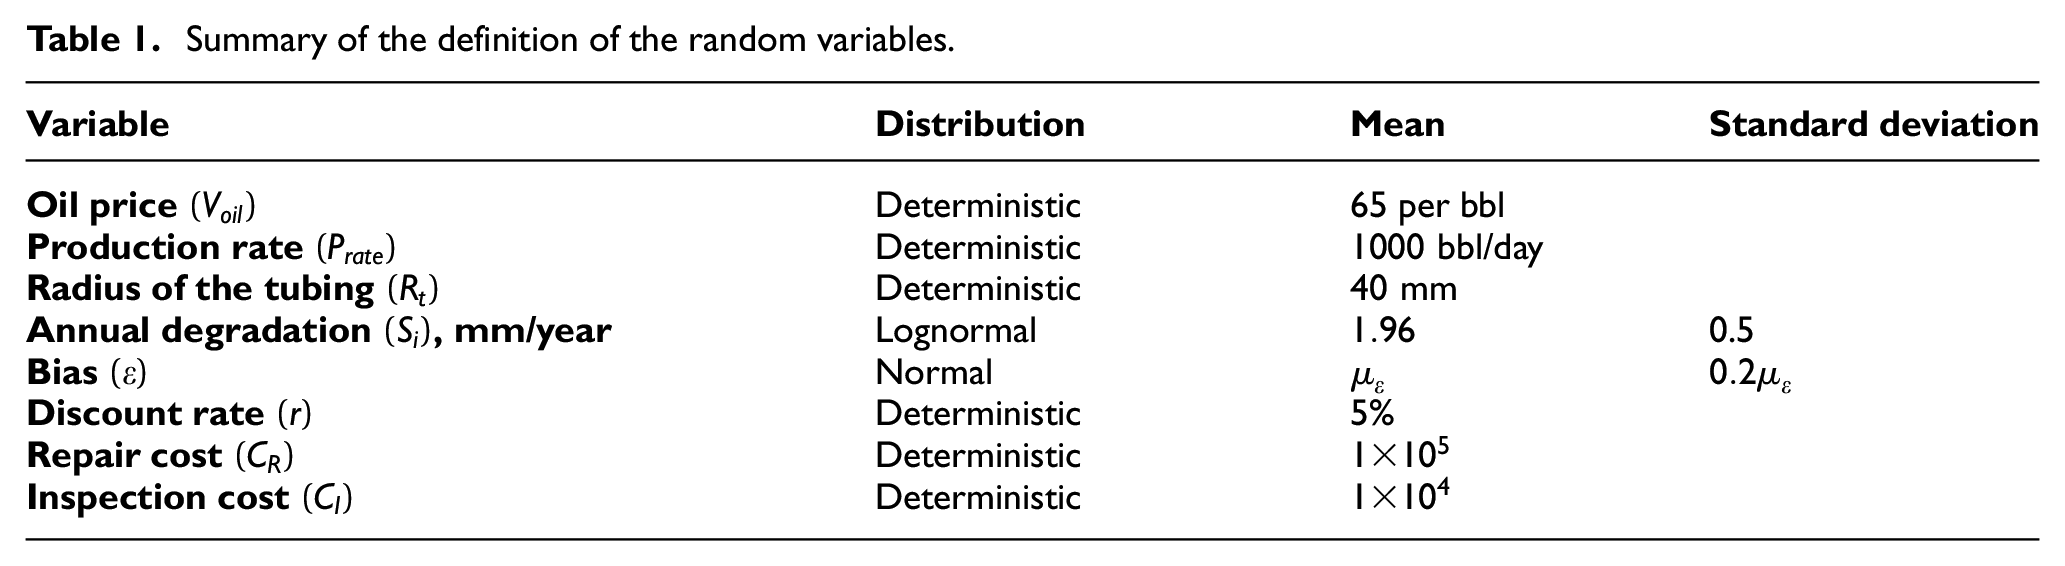
Scale formation is complex and complicated phenomena, and the scale rate varies for different environmental conditions provided. Previous studies25,26 show that the annual scale growth rate
In addition, measurements from inspections might not necessarily be perfect and could be associated with systematic errors, that is, biases. The biases associated with measurements of accumulated scaling thickness
Summary of the definition of the random variables.
In the investigations, it is assumed that the characteristics of the probability distribution function of the absolute value of the expect value of

The probability density functions for the case of
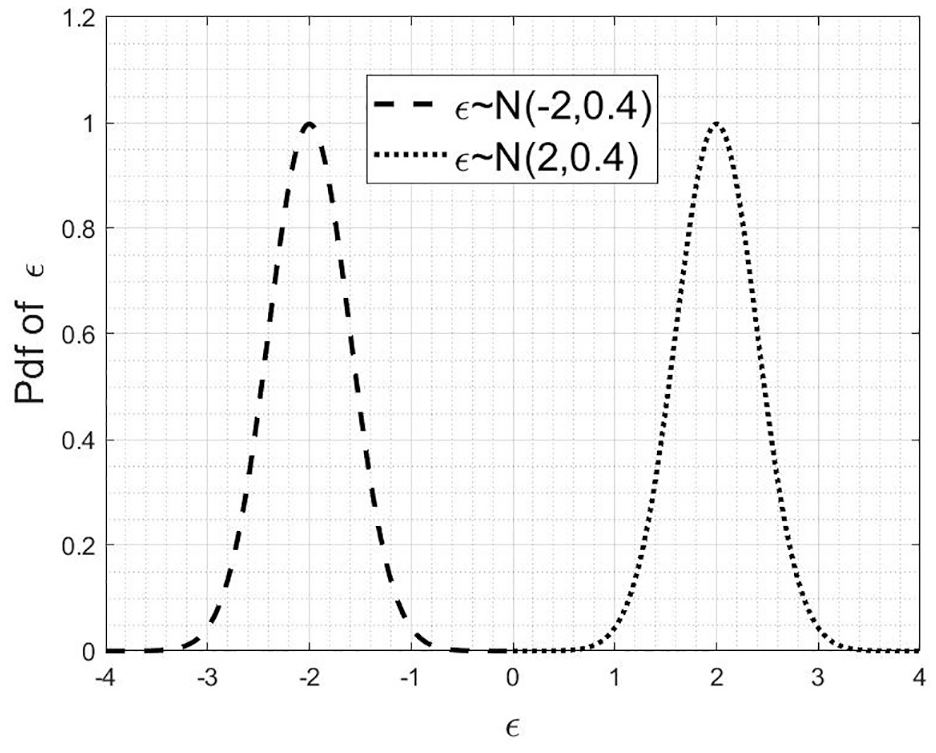
Illustration of the probability density functions of normal distribution for measurement errors
The accumulation of scale growth is assumed to reduce oil production due to a decrease in the inner radius of the well tubing. The unit oil price per barrel
The annual income or benefit

where
The expected value of total benefit

In the following investigation, the expected value of the total benefit, the total inspection cost, and the total repair cost for the whole service life together with the VoI are analyzed. The scenarios considered include all combinations of different inspection intervals (after 2, 6, and 10 years), different absolute values of the expected value of measurement errors (2, 6, and 10 mm), and the three different repair criteria together with the two dependency models. The probabilistic analyses are undertaken through
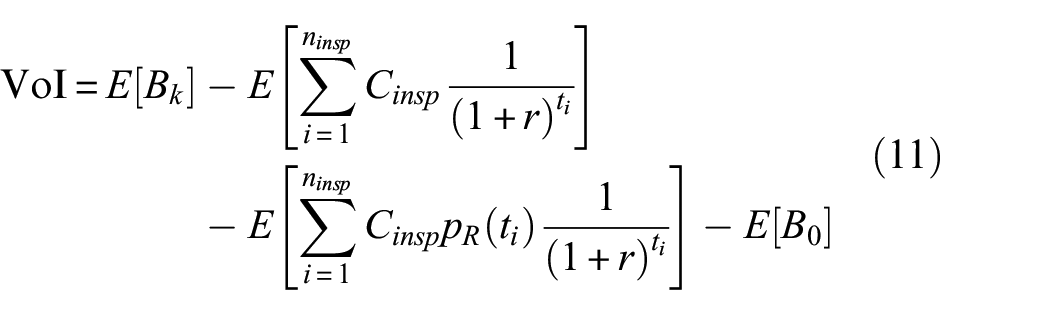
The expected value of the inspection costs for different time interval–based inspection strategies is estimated as 27

where
The expected value of the repair cost depending upon the repair criteria is estimated as 27

where
Given the inspection intervals, the expected values of the total inspection cost, the total repair cost, the total production benefit, and the VoI are analyzed for the scenarios corresponding to the different combinations of absolute values of the expected value of measurement errors and different repair criteria. For example, for the scenario where the expected value of the bias is
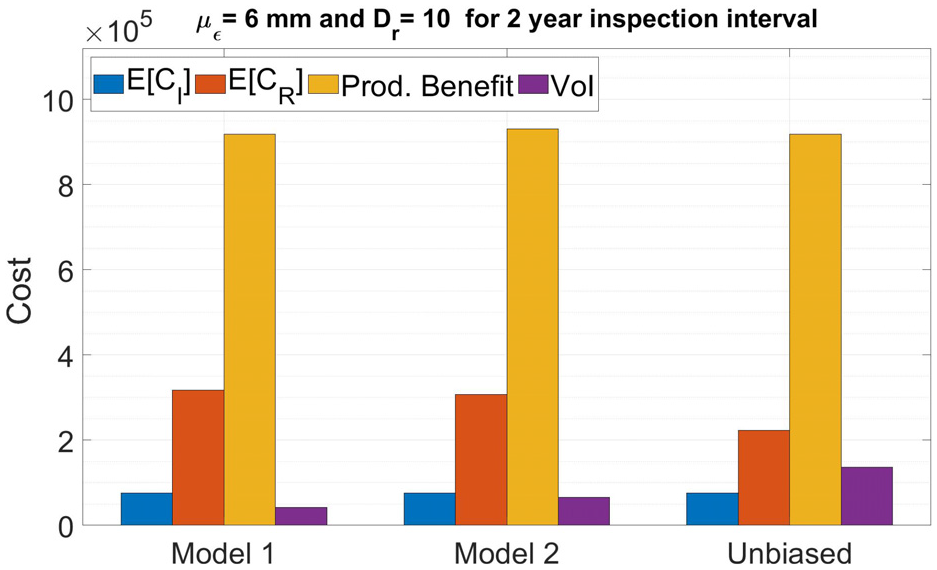
The expected values of the total inspection cost, the total repair cost, the total production benefit, and the VoI given that the inspection interval is 2 years (
The expected

Results
The VoI for the scenarios with the combinations of different inspection intervals and different absolute values of the expected value of both measurement errors and different repair criteria together with the two dependency models is shown in Figure 7. From Figure 7, it can be seen that the value of the unbiased information is generally higher than that of biased information, while the value of the biased information with the dependency following Model 2 is higher than that of the information with the dependency following Model 1. However, it is not always the case especially when the repair criteria are low (the value of
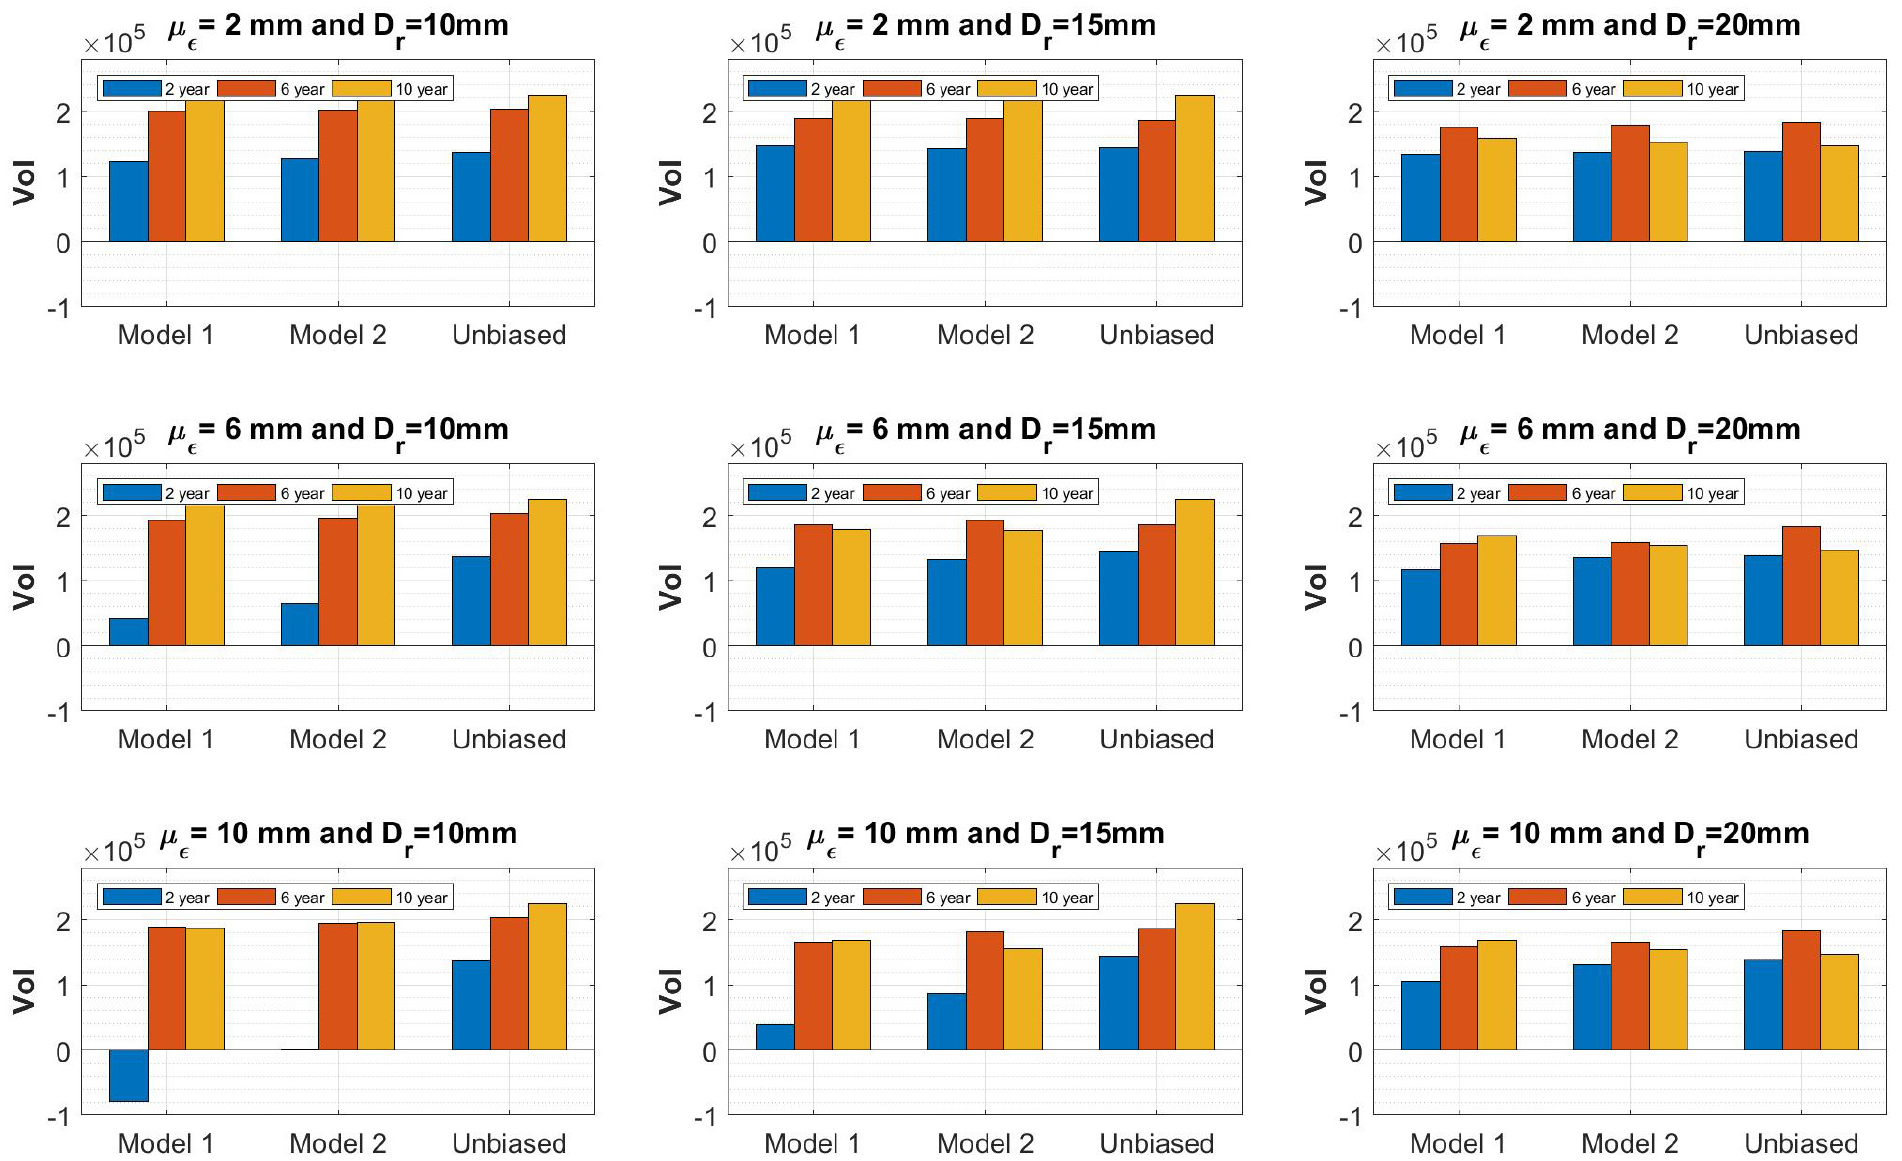
The VoI for the scenarios with the combinations of different inspection intervals and different absolute values of the expected value of both measurement errors and different repair criteria together with the two dependency models.
Example: VoI of integrity management for steel structures subject to fatigue
Introduction
In this example, we consider a steel structure with a 20-year service life subject to fatigue crack growth. The information regarding the development of fatigue crack growth is collected during the service life by means of inspections. The VoI associated with inspections is analyzed accounting for possible biases.
To model the evolution of crack growth, a simple one-dimensional crack growth model is considered here,28,29 where the crack growth

where n is the number of stress cycles per year,
Definition of parameters relevant to fatigue loading and crack growth parameters.
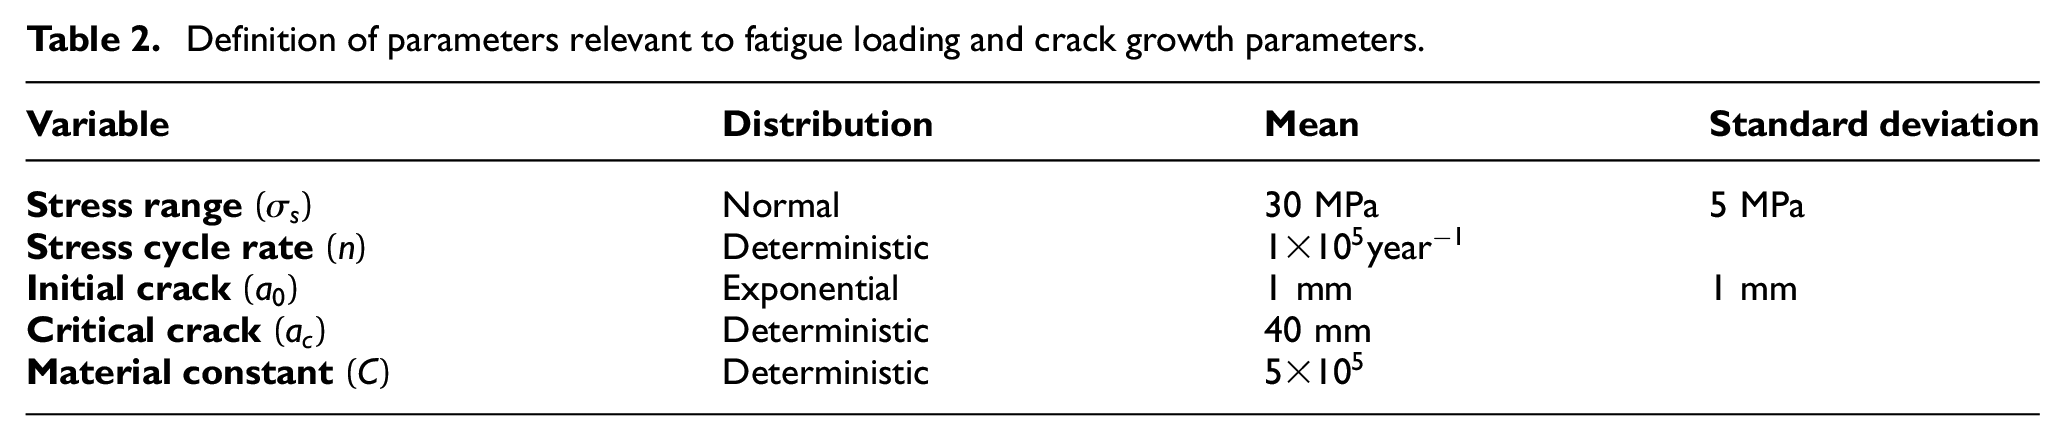
Fatigue crack growth might result in a structural failure, if the crack size exceeds a critical threshold

The crack size
Depending upon the maximum acceptable threshold for the annual probability of failure, for the considered structure (generally defined by code or regulation), inspections are planned such that they take place at the latest time (year) for which the annual probability of failure is not exceeded. For example, in the case that the maximum acceptable annual probability of failure is set to
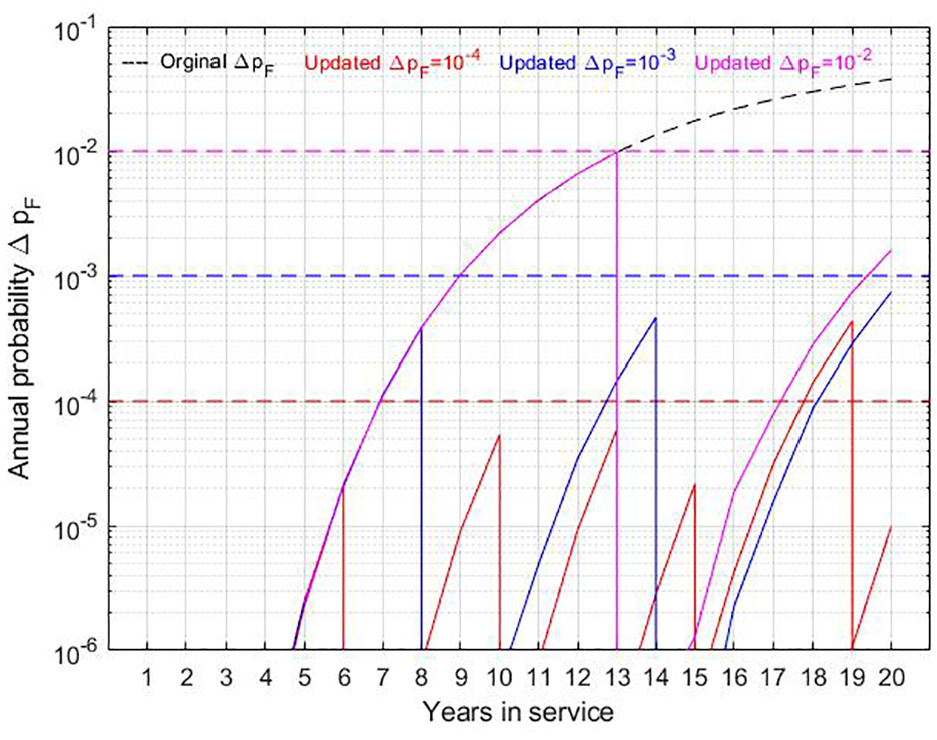
Prior and updated
If a crack is detected at an inspection, the structure will be repaired immediately. The probability of detecting a crack is modeled as a function of the size of cracks through the PoD. The PoD is modeled here by an exponentially distributed random variable with expected value

The annual probability

where
In the same manner as in the foregoing example, the inspection information is considered associated with errors together with biases. In this example, it is assumed that there are errors (together with biases)
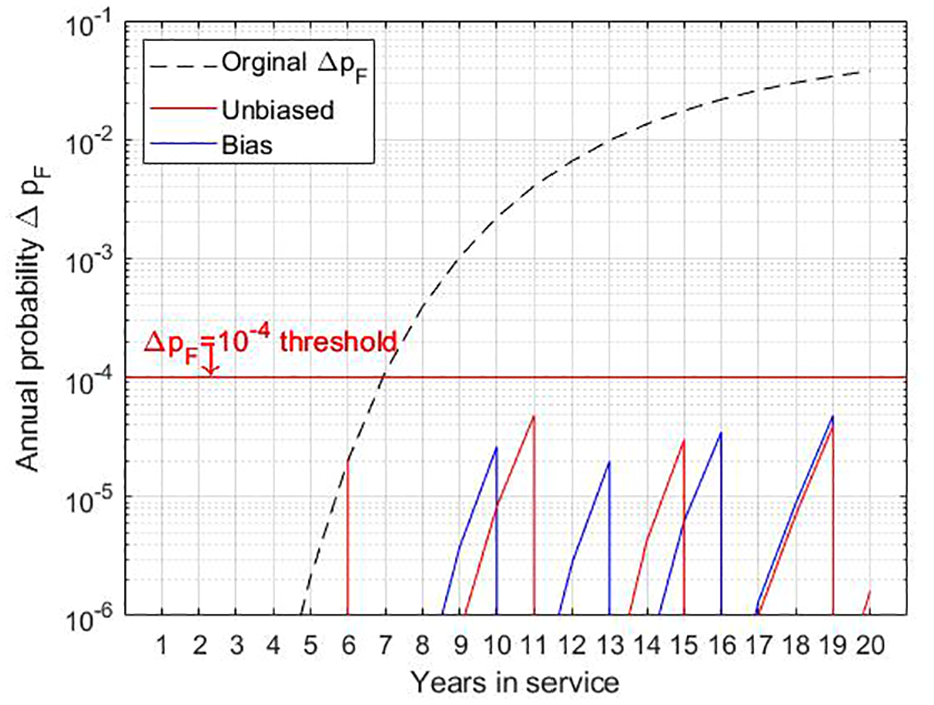
Effect of bias and unbiased in PoD on inspection planning.
The expected total life cycle cost

where

where

where
Thus, the total cost would be
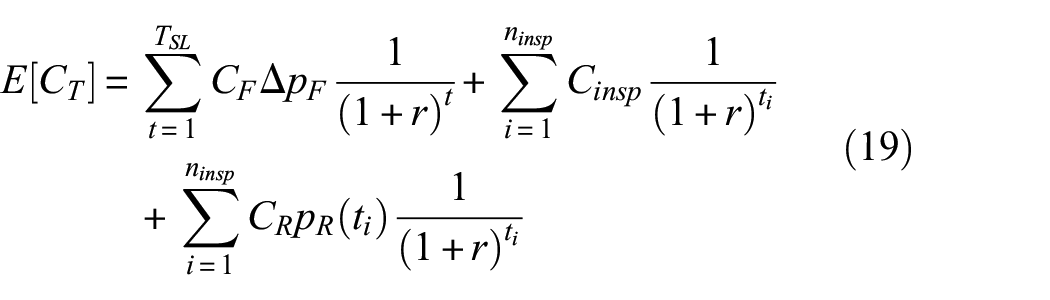
The cost terms are defined as
For the case of unbiased information, that is,
Results
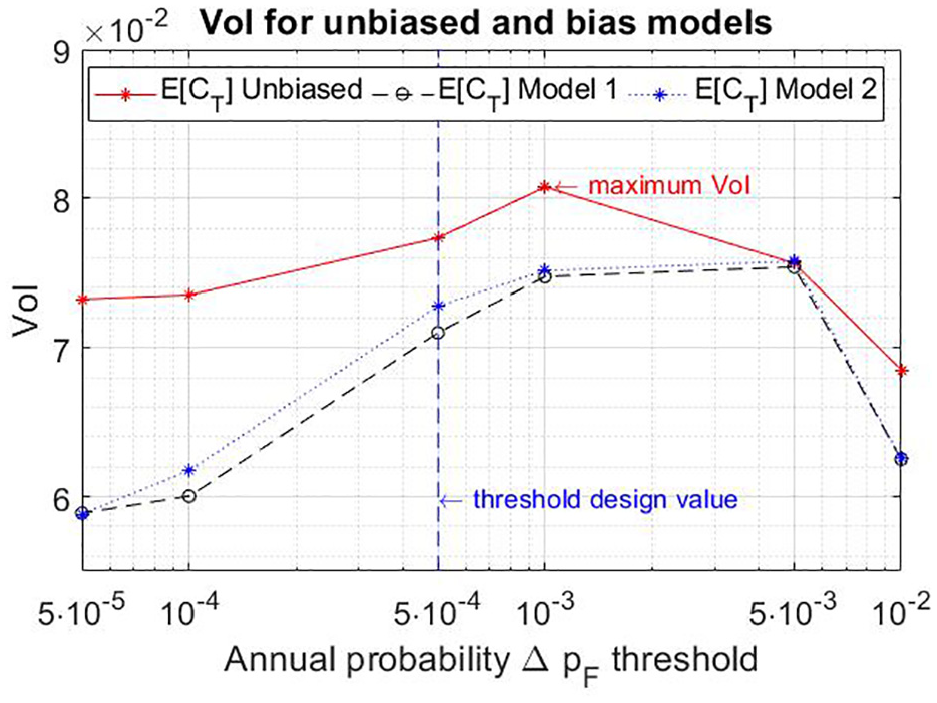
The expected values of the service life cycle costs of integrity management of the structure with unbiased information are presented in Figure 10 as function of the threshold
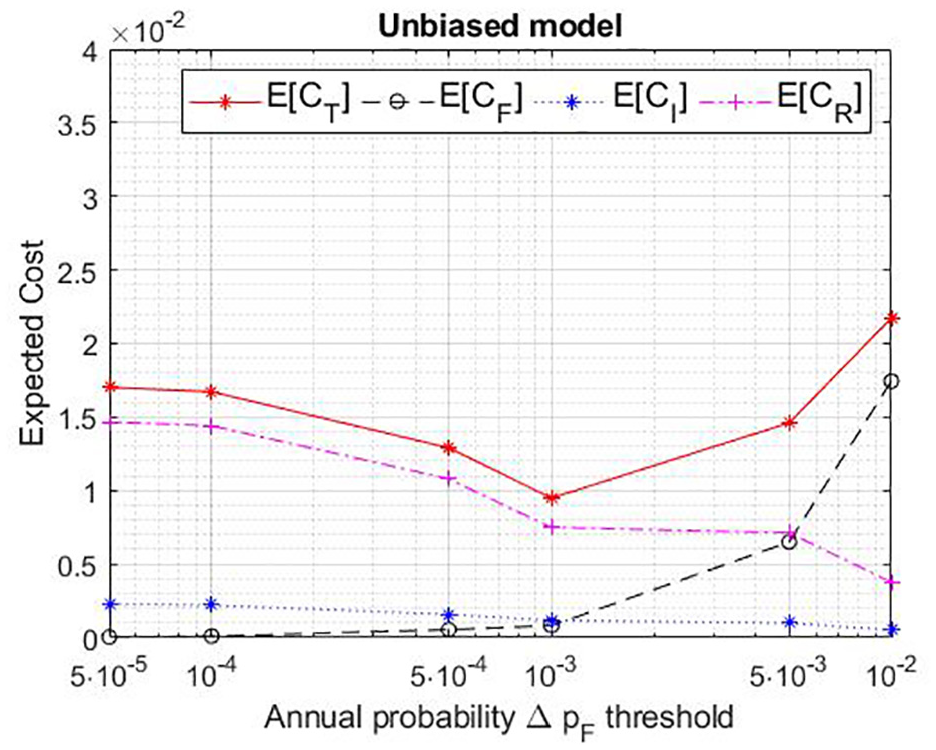
Expected life cycle costs with unbiased information.
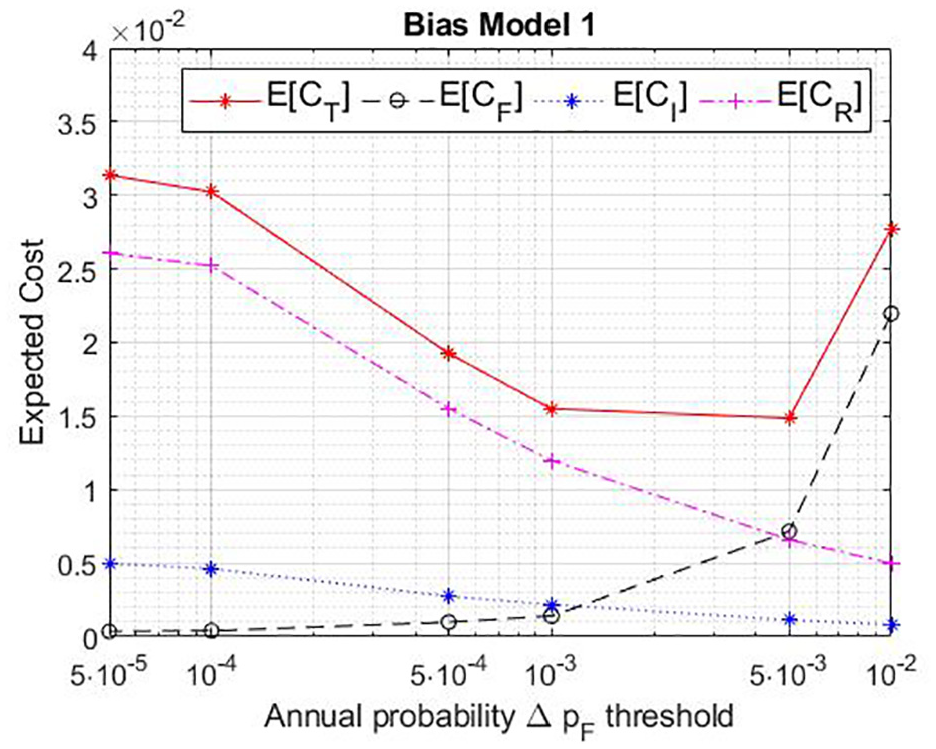
Expected life cycle costs with bias information from inspection together following Model 1.
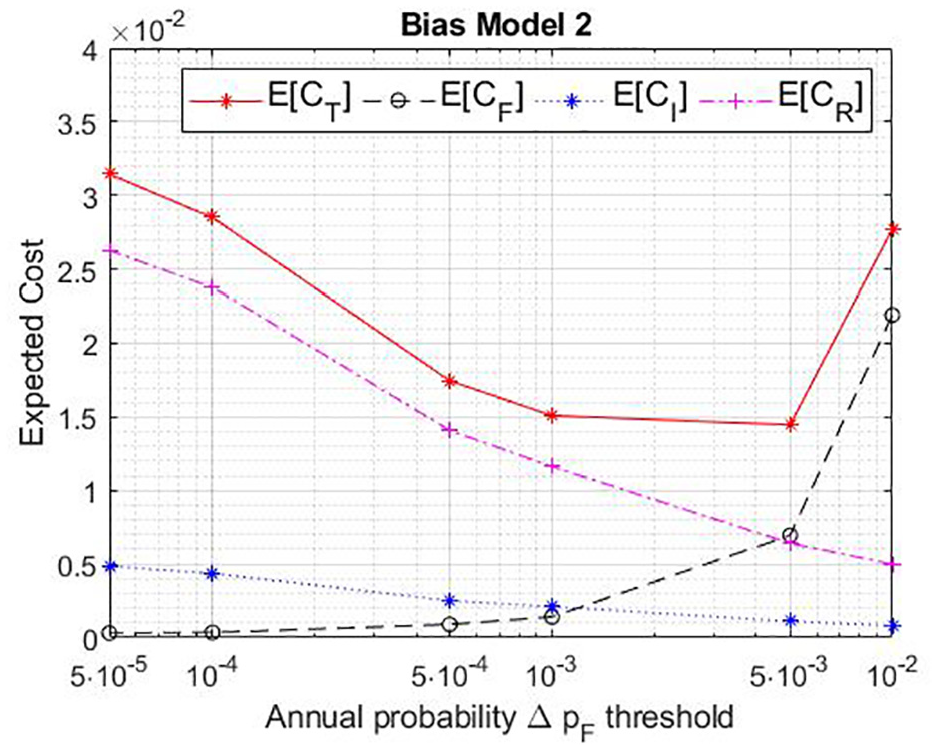
Expected value of the life cycle costs with bias information from inspection together following Model 2.
In Figure 13, a comparison of the expected values
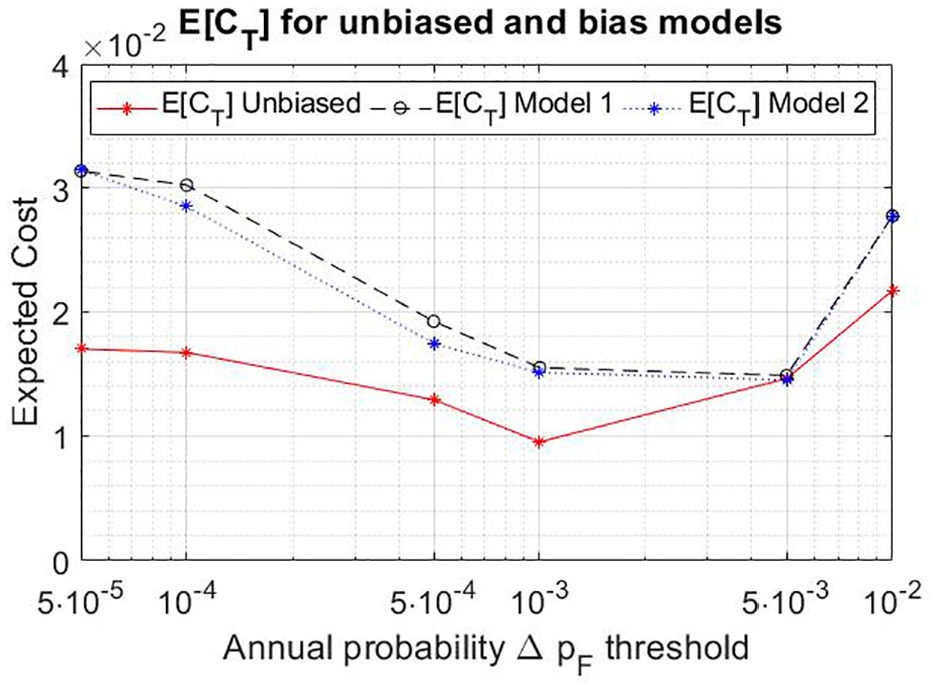
Comparison of the expected value of the total life cycle cost considering biased inspection results with two different dependency models as well as for the case of unbiased inspection results.
The results of VoI analysis as the function of the threshold
VoI associated with unbiased and biased inspection information in accordance with the two dependency models, as a function of
Conclusion
In this contribution, we analyze to what extent the value associated with the information collected during the service life of engineered structures, for example, inspections, in the context of integrity management, is affected by not only measurement random errors but also biases (systematic errors), taking the dependency between the collections into account. This is novel since in general the effect of possible biases together with the dependency is not accounted for in integrity management optimization—implicitly assuming that SHM and inspection techniques are always calibrated and free of bias. To cast light on the effect of possible biases on the VoI, two different models for the representation of the possible dependency in biases from inspection time to inspection time are proposed. Their implications on the VoI are studied by means of two principal examples that are representative for integrity management of well systems subject to scale and fatigue crack growth for welded steel structures, respectively.
The examples show how VoI analysis may be applied accounting for possible biases and provide important insight on the significance of the dependency effect, which facilitate for the identification of measures and strategies to improve the beneficial effect of monitoring and inspections in the context of SIM.
From both of the two examples, it is apparent that when the number of instances over the service life where information is collected, for example, through inspections, the VoI is not significantly affected by biases. However, for the cases where the information collected by means of inspections is essential for the integrity management, the effect of biases is a significant reduction of the VoI, caused by wrong information triggering either unnecessary maintenance and repair or wrong information suggesting that no maintenance or repair is required despite actually needed. Based on the examples, it is seen that biases generally reduce the VoI. Moreover, dependencies in biases associated with information collected for integrity management at different times have a negative effect on the VoI.
The present contribution has put focus on the effects of biases and dependencies associated with information collected in support of integrity management optimization. It has been shown that these effects indeed should be accounted for explicitly, and ignoring them may lead to rather suboptimal integrity management decisions. Future studies should be directed to develop more specific models of uncertainties, biases, and dependencies, for different information collection techniques.
It should be noted here that the two models for the probabilistic representation of the bias presented in section “Information modeling in SIM” are introduced for improving the understanding of the effect of biases associated with measurements, on the VoI offered by inspection. The two models represent the extreme cases where there is either full or no dependency between the realizations of performed measurements. In the examples, and the outlines of the models, we explicitly address collection of information over time. However, it should be noted that dependencies in systematic error (bias) may also have a spatial component. Spatial dependencies may be investigated in principally the same manner as the temporal dependencies investigated within this article. The effects of the temporal and spatial variability should be taken into account in the future study.
Footnotes
Declaration of conflicting interests
The author(s) declared no potential conflicts of interest with respect to the research, authorship, and/or publication of this article.
Funding
The author(s) disclosed receipt of the following financial support for the research, authorship, and/or publication of this article: The authors acknowledge the funding received from the Center for Oil and Gas—DTU/Danish Hydrocarbon Research and Technology Center (DHRTC).