
Abstract
Acoustic emissions have been widely used as a means to investigate the damage state of concrete structures. While successful applications have regarded the localisation of cracks, quantification of the damage and safety margin estimation have been elusive because the main approaches are mostly based on empirical observations. In this work, a methodology for the numerical simulation of acoustic emission events in reinforced concrete structures is proposed with the aim of filling this gap. It relies on a numerical model for reinforced concrete structures at the macro-scale which simulates the mechanical cyclic behaviour of the structure. Analysis of the stress and strain states in the numerical model provides the basis for the simulation of the occurrence and quantification of the events. A simple attenuation law is then used to estimate the acoustic event intensity recorded by the sensors. Application to a four-point bending test on a reinforced concrete beam confirms the capability of the model to reproduce the data recorded during the test, including the Felicity effect and the cumulative intensity curve. This could potentially open the path to a more quantitative use of acoustic emission data for structural assessment of reinforced concrete structures, directly linking mechanical models and acoustic observations.
Keywords
Introduction
Acoustic emission (AE) is the phenomenon occurring in structures when, due to the effect of internal stress and micro- or macro-cracking, elastic waves are generated by sudden release of energy in localised points. The observation of AE being related to internal stress and damage state and the possibility to record such signals by means of piezoelectric sensors has led researchers since the late 1950s to explore the feasibility of using AE for the evaluation of the damage state of structures. First applications are due to Joseph Kaiser in Germany, 1 who discovered the effect which is called after him, stating that under cyclic loading AE is not generated in a structure unless the previously attained maximum load Fmax is exceeded. This is true only if the structure is not significantly damaged, in which case AE is recorded for a lower load Fi. The ratio Fi/Fmax is called Felicity or load ratio and in many works and general recommendations it is regarded as an indicator of the structural damage extent in the structure. 2
The application of AE for structural health monitoring of reinforced concrete (RC) structures has been the topic of several studies in the last decades. Behnia et al. 3 present a review on the use of AE for structural health monitoring of concrete structures. Generally, two approaches for the analysis of AE data are described: (1) parametric analysis, which makes use of parameters as counts, maximum amplitude and energy of the signals and (2) signal waveform analysis, which allows better noise discrimination, three-dimensional (3D) localisation and source mechanism identification. Damage severity evaluation of existing structures is usually approached by means of parametric analysis of AE data, and to this aim Behnia et al. 3 distinguish five methods:
Correlation of calm and felicity ratio, exploiting the phenomenon of Kaiser effect. 4 This has been codified by the Japanese standard. 5
The use of relaxation ratio, which measures the release of AE energy during unloading. 12
The use of cumulative signal strength ratio 13 in positive relationship with the growth of the level of damage.
Although generally regarded as a consolidated approach to highlight the possible presence of damage in a structure and thus the need of further investigations, parametric analysis of AE is intrinsically unable to give quantitative information about the extent and nature of the damage because of its empirical nature. An increasing research effort has been thus devoted to understanding the physics underlying the emission of elastic waves and their correlation with the mechanical damage. Ohtsu and Watanabe 2 first experimentally confirmed that the presence of critical micro-cracks in concrete is closely associated with AE generation under compression and proposed a relationship between the number of total AE events and stress level, based on rate process analysis. Carpinteri et al.14,15 proposed analytical correlation with theory of fracture, while Liu et al. 16 investigated the relationship between the AE distribution through the depth of a RC beam cross section and the stress magnitude. In Dai et al., 17 the authors explored the possibility to use AE techniques to estimate the damage in single-edge notched beam tests, assumed as a random variable in a heterogeneous material. The comparison study indicated that the Weibull damage function calibrated from the acquired AE data can describe the damage response of both normal strength and high-performance concrete. Benavent et al. 18 proposed a tentative formula for predicting the level of low-cycle fatigue damage in RC frame connections, characterised as plastic strain energy dissipated by concrete, given the AE energy recorded by sensors located close to the region of expected damage concentration, after observing a strong correlation between these two quantities.
In this context, particular significance has assumed the support of numerical simulations. Starting from the seminal works by Ohtsu and Ono 19 and Scruby and colleagues,20,21 analytical techniques were developed to simulate the acoustic wave signal generated by an opening crack in an elastic continuum. More recently, numerical simulations of wave propagation in solids have been carried out in metals 22 and composites. 23 Carpinteri and coworkers made use of lattice models24,25 to analyse the mechanical process and simulate AE in small concrete specimens, finding good agreement with experimental results in terms of b-value. In Lacidogna et al., 26 the authors correlated the decrease in modal frequency recorded and simulated by a finite element (FE) model in a four-point bending test on a concrete notched beam to the AE energy released during loading. Fracture mechanics and finite-volume wave-propagation algorithm were instead used in Berezovski and Berezovski 27 to simulate the entire process of crack propagation and energy release in a three-point bending test. Similarly, in Zhu et al. 28 concrete is represented within a mesoscale approach and AE activity is modelled by means of fracture mechanics concepts. Cohesion zone modelling (CZM) and extended finite element method (XFEM) were used in Cuadra et al. 29 to directly simulate crack initiation as an AE source. 3D models were created to investigate wave generation and propagation as a function of distance from the crack source.
In general, it is in the authors’ opinion that a close correlation between AE signal parameters and damage in the structure may only be obtained if sound hypotheses are considered regarding:
The mechanical behaviour of RC under cyclic loading and simulation of stress and strain state in the continuum;
The definition of the onset of cracking and quantification of energy release;
Modelling of propagation and attenuation of elastic waves.
Most of the mentioned contributions from the literature (generally regarding plain concrete) focus on the use of meso-models and/or fracture mechanics, consistently with the observation that AE events originate from initiation, propagation and coalescence of micro-cracks. However, if one wants to investigate the global behaviour of an RC structure, these approaches become too computationally demanding and, in fact, in the structural analysis of RC members and structures, especially under cyclic loading, macro-models based on smeared-crack concepts are mostly used.
In this work, a theoretical framework for the numerical simulation of AE making use of one of such models is presented. Clearly, the use of macro-models, with much lower level of detail compared with CZM or XFEM prevents from simulating individual AE waveforms as in Iturrioz et al. 25 and Berezovski and Berezovski 27 or Cuadra et al. 29 Conversely, the investigation carried out in this work aims at exploring the possibility of using smeared-approach material models with proven capability of simulating cyclic behaviour of RC structural members at the macroscale (1) to predict global AE parameters, under some simplified yet appropriate hypotheses regarding (2) and (3). This has the potential to open new horizons in the practical applications of AE technology to track damage in RC structures. The methodology will be then applied to the results of a cyclic four-point bending test on a RC beam, to assess the accuracy of the simulation.
Numerical modelling of AEs
The mechanical model
Even though the process of cracking nucleation and propagation is discrete in nature and should be rigorously approached by making use of principles of fracture mechanics, it is generally acknowledged that in the simulation of the behaviour of RC structures, smeared-crack methodologies can accurately predict the global stress and damage state. In these approaches, concrete is considered as a continuum and the effect of cracking is simulated by means of suitable softening curve in terms of strains, instead of cracking opening displacements. The mechanical model used in this work to simulate the cyclic behaviour of an RC member under cyclic loading is the fixed-strut angle panel model by Kolozvari et al. 30 It is based on the multiple-vertical-line-element-model (MVLEM) by Orakcal et al., 31 but with some important differences which make it suitable to simulate the cyclic behaviour and capture shear-flexure interaction (SFI) in RC members.
A structural member is discretised by n modified MVLEM elements along the axis of the element, each composed of m macrofibres. Kinematic rigid constraints are applied at the ends of the MVLEM elements to reproduce the Bernoulli hypothesis of plane cross sections remaining plane during the loading application. Each macrofibre is a panel element comprising concrete and both vertical and horizontal reinforcement and represents a two-dimensional (2D) constitutive behaviour that relates average (smeared) axial strains in vertical and horizontal directions εx and εy and the average shear strain γxy, with average axial stresses σx and σy and average shear stress τxy (Figure 1). The average stresses on each panel element are the resultant of the contributions from concrete and reinforcing steel. The transformation of the usual one-dimensional (1D) fibre into a 2D panel allows the model to account for SFI.
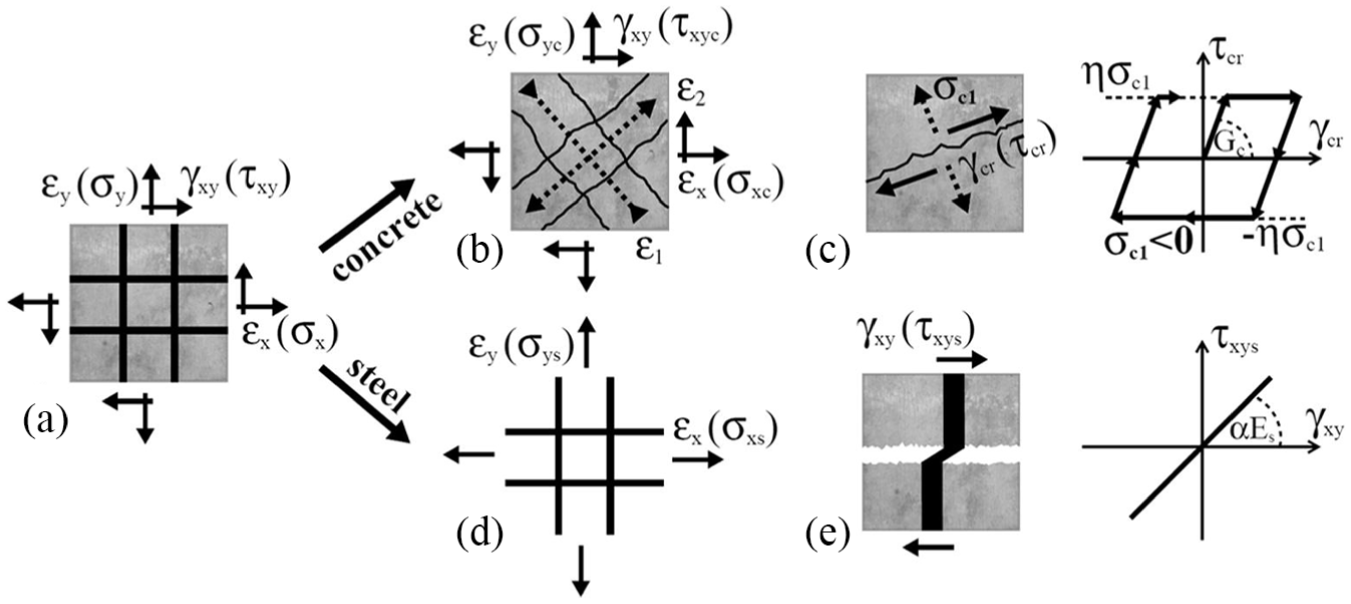
Mechanical model for reinforced concrete: (a) Strain-stress field, (b) concrete biaxial behavior, (c) concrete shear aggregate interlock, (d) steel behavior, and (e) dowel action on reinforcement. Reproduced from Kolozvari et al. 32
The behaviour of the RC panel elements under reversed cyclic loading follows the fixed-strut angle model (FSAM) developed by Orakcal et al. 33 It considers the panel as an ensemble of compressive struts whose direction is coincident with the crack direction and does not change after crack occurrence. The mechanical behaviour of the compressive struts is represented by Chang and Mander’s 34 model, modified to account for hysteretic biaxial damage and tension stiffening. The uniaxial constitutive stress–strain relationship for reinforcing steel, acting along the vertical and horizontal directions of reinforcing steel bars, is the hysteretic model of Menegotto and Pinto, 35 extended by Filippou et al. 36 to include isotropic strain hardening effects. The model also considers resisting mechanisms in the direction parallel to the cracks. In particular, the dowel effect is represented by means of a linear elastic contribution of the reinforcement intersecting the crack, where the stiffness is evaluated as a fraction of the steel Young’s modulus. A second resisting mechanism, the aggregate interlocking effect, is described by an elastic-plastic model characterised by friction in accordance with ACI 318-11. 37 The modelling approach briefly described is implemented in the software OpenSees, 38 where the name SFI_MVLEM refers to the element type and FSAM to the plane-stress panel material model.
Onset of cracking and intensity of the acoustic event
As described in the previous sub-section, the FSAM model explicitly accounts for cracking in concrete, even though within a smeared approach. The RC panel behaviour is characterised by three stages, where concrete is still uncracked (stage 1), the first (stage 2) or the second crack (stage 3) has appeared. During stage 1, the behaviour of concrete is characterised by coincidence between principal stress and strain direction, which thus are allowed to rotate according to the stress state. Stage 2 is initiated when the principal tensile strain exceeds a specified value given as material property. The current principal strain direction is assumed as first strut direction from that moment on, and the strut behaviour is governed by biaxial stress–strain relationship. The second crack (stage 3) is formed when the strain along the first strut direction first exceeds the cracking strain. The strain tensor is projected along the first and the second strut directions and the corresponding stress is evaluated considering hysteretic biaxial constitutive relationships along those directions.
In the simulations described in this article, the acoustic event occurrence and magnitude are estimated considering two types of AE sources: tensile cracks(T-type) and compressive cracks (C-type), while shear (mode-II) cracks are neglected. An event arises at time t in the element k if
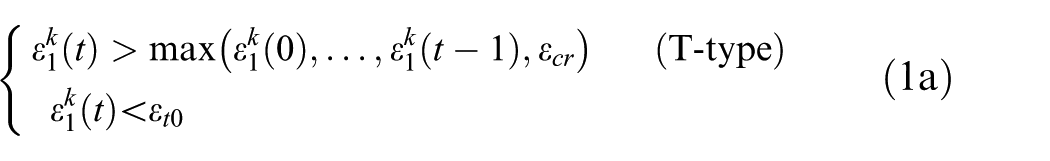

where
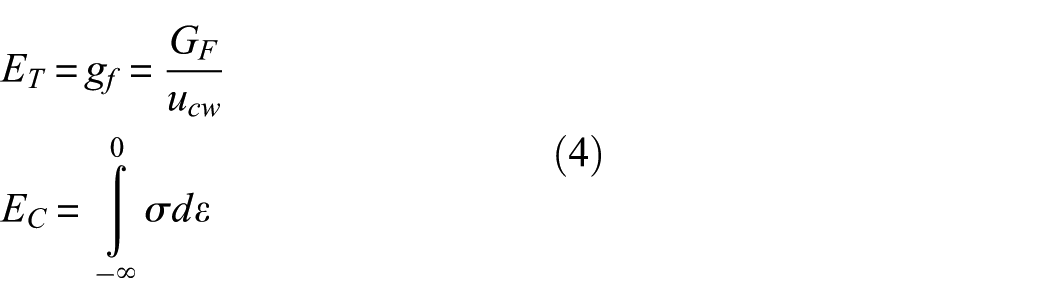
Once the AE event is detected, its magnitude Wk is assumed directly proportional to the work carried out by internal stress and inversely proportional to a parameter ET (resp. EC) representing the energy ‘resources’ of the material after peak (respectively in tension and compression)
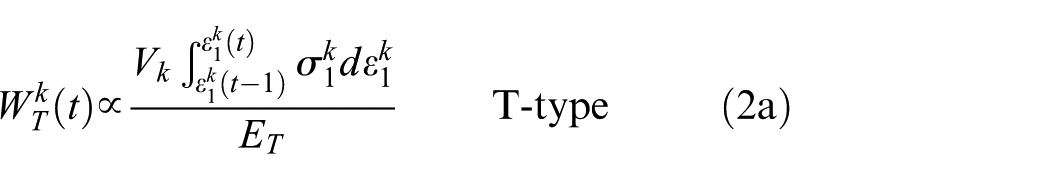
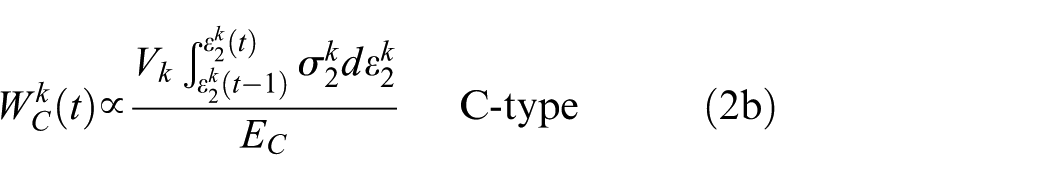
where Vk is the volume of the cracked element. The multiplication of the energy density by the volume of the element is deemed necessary to avoid mesh dependency, as it is intuitive that larger elements should lead to higher event magnitude, while finer meshes would imply more elements generating smaller AE events. The second term in equation (2) has units of volume: an unknown proportionality factor is needed to compare it to experimental acoustic signal intensity (usually measured in V, see later in section ‘From simulated events to recorded signals’).
The AE history for the kth element will be then

T- and C-type events, though represented similarly in the numerical model by a strain increment in the softening region of the constitutive curve, are physically very different phenomena. To understand the relationship between the acoustic energy released by concrete when tensile or compressive events occur, specific experimental activities should be designed. In this research, it is conjectured that ET and EC, being measures of the energy capacity of the material, can be assumed directly proportional to the area under the σ-ε law in tension and compression, respectively. The rationale under this assumption is that equal mechanical work carried out by internal stress gives rise to more energetic AE when material ductility is smaller. This does not pose any problem for C-type events, while, as mentioned above, to account for tension stiffening the tensile backbone curve in Chang and Mander’s model approaches zero stress only asymptotically and thus the energy in tension becomes virtually unbounded. A way to overcome this issue is to consider the fracture energy density gF as a measure of energy resource in tension for the material. The two constants thus read
From simulated events to recorded signals
The methodology proposed in section ‘Onset of cracking and intensity of the acoustic event’ simulates the history of AE events as a function of the stress/strain state in the structure. However, to have any correspondence between the simulation and the recorded AE signals, it is important to understand how the mechanical event magnitude W relates to the acoustic event signal as recorded by the sensors.
The answer to this question involves fundamental issues in acoustic wave propagation, as ‘the AE signal is the convolution of source mechanism, medium transfer function, and sensor transfer function’. 39 Different wave types (P-, S-, Rayleigh, Lamb) travelling with different velocities and energy, reflections of the waves, attenuation dependent not only on the distance but also on frequency content 40 and the responses of the sensors are factors that ‘create’ the recorded signal and make it extremely difficult to correlate to the source event. Multiphysics software has been recently used to investigate the propagation of the acoustic wave in a medium with the aim of calibrating the sensors.39,41 This could be, in perspective, the most accurate approach to couple acoustic and mechanic simulations, even though the increasing level of damage and cracking in the continuum may lead to preferential paths and increased attenuation that could only be captured by advanced mixed mechanical-acoustic models. Some attempts to use time reverse modelling of AEs seem to date limited to localisation of AE sources. 42
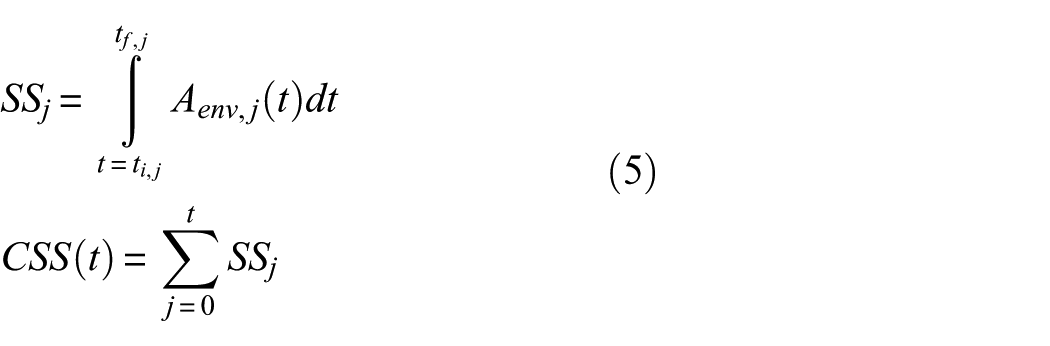
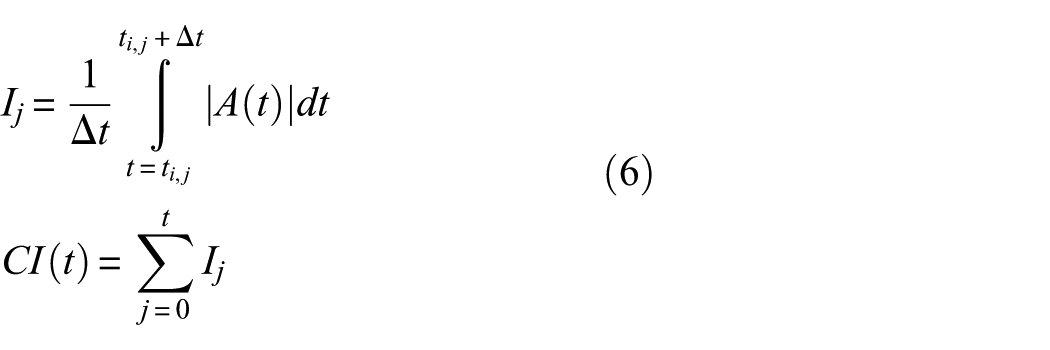
Generally, the intensity of a signal j is estimated using an indicator as signal strength (SS), and its evolution is monitored by means of its cumulative curve, the cumulative signal strength (CSS), which are defined as
where
where
Given the numerical AE magnitude W
k
of the kth element, estimated as in equation (3), it is herein assumed that the simulated acoustic intensity
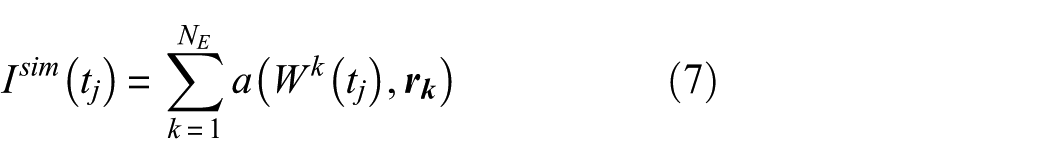
with NE number of the elements in which the structure is discretised and
A simple isotropic attenuation law for acoustic intensity has been used in this work, such that

where α is the attenuation coefficient (with dimensions dB/mm), function of frequency and sound velocity in the medium. Philippidis and Aggelis 43 performed an extensive experimental study on the effect of water to cement ratio (w/c), aggregate size (a/c) and content on the coefficient of attenuation in concrete. The main outcome of the work was that the coefficient of attenuation varies from 0 to about 0.4 dB/mm as a function of source frequency, with four zones clearly identifiable (Figure 2): (a) an increasing ramp until about 100 kHz, (b) a decreasing ramp from 100 to 200 kHz, (c) again increasing ramp, followed by (d) a plateau. The separation between (c) and (d) varies with the concrete characteristics, being comprised between 500 and 800 kHz. This contribution will be considered in section ‘Numerical simulation’ for the definition of a suitable simplified attenuation law.
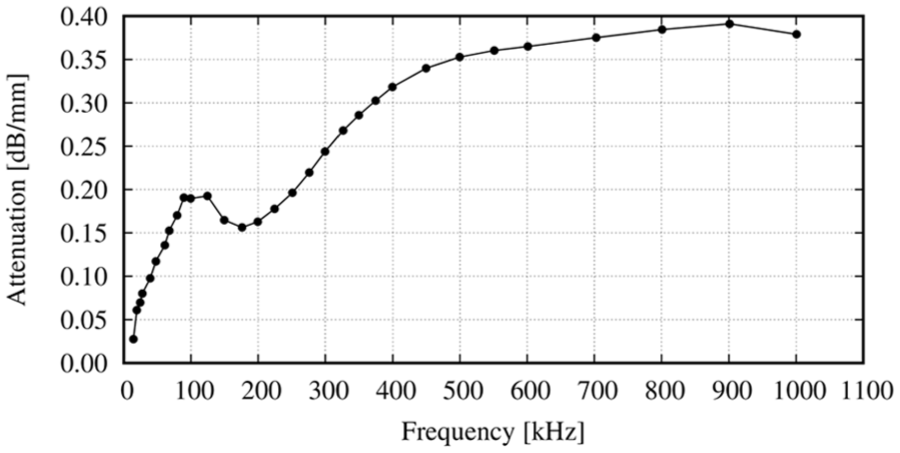
Typical experimental relationship between attenuation coefficient and frequency for concrete.
The whole simulation process is summarised in the pseudo-code shown in Figure 3.
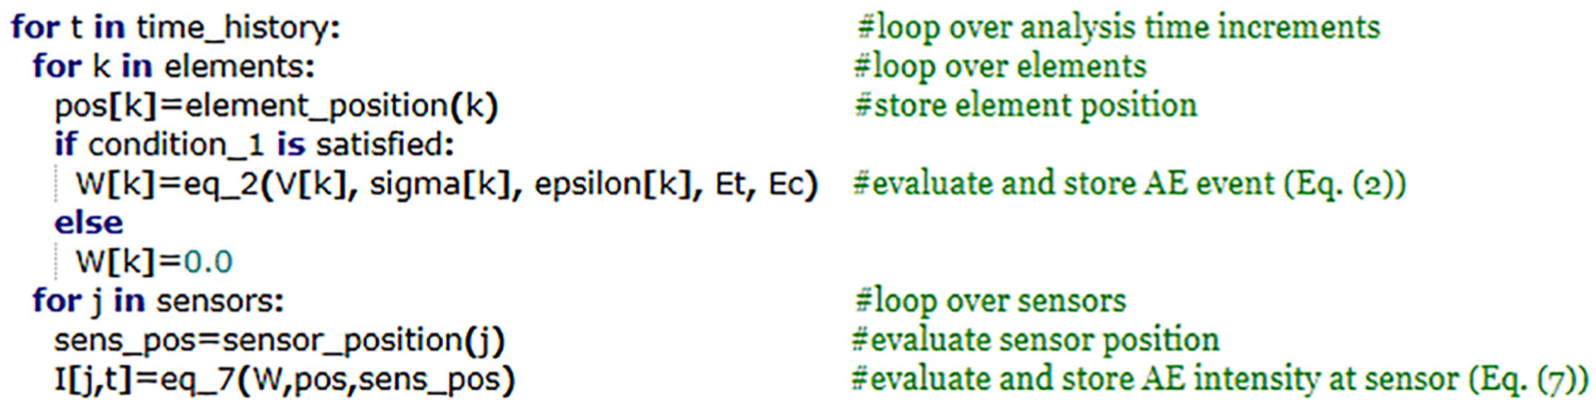
Pseudo-code for AE simulation.
Experimental test and AE analysis
Description of the test
In order to verify the correspondence of the AE to the progressive structural damage and to check the capability of numerical models to reproduce the AE development corresponding to the cracking evolution, a four-point bending test was performed on a simply supported RC beam of length equal to 2000 mm. The test was carried out at the STRENGTH laboratory of the Department of Civil Engineering at the University of Salerno under an Italsigma machine of 3000 kN loading capacity and 200 mm maximum displacement. The load generated by the hydraulic jack of the machine was transferred to the specimen by means of a stiff steel beam which applied two forces on the RC beam symmetrically with respect to the midspan and at the distance from the supports equal to 625 mm (Figure 4). The RC beam had a cross section equal to 150 × 200 mm2 and was reinforced with 12-mm-diameter steel rebars, 2 on upper side and 3 on lower side. The concrete cover was equal to 30 mm calculated from the centre of the rebar. The stirrups were 8 mm in diameter with 125 mm spacing.
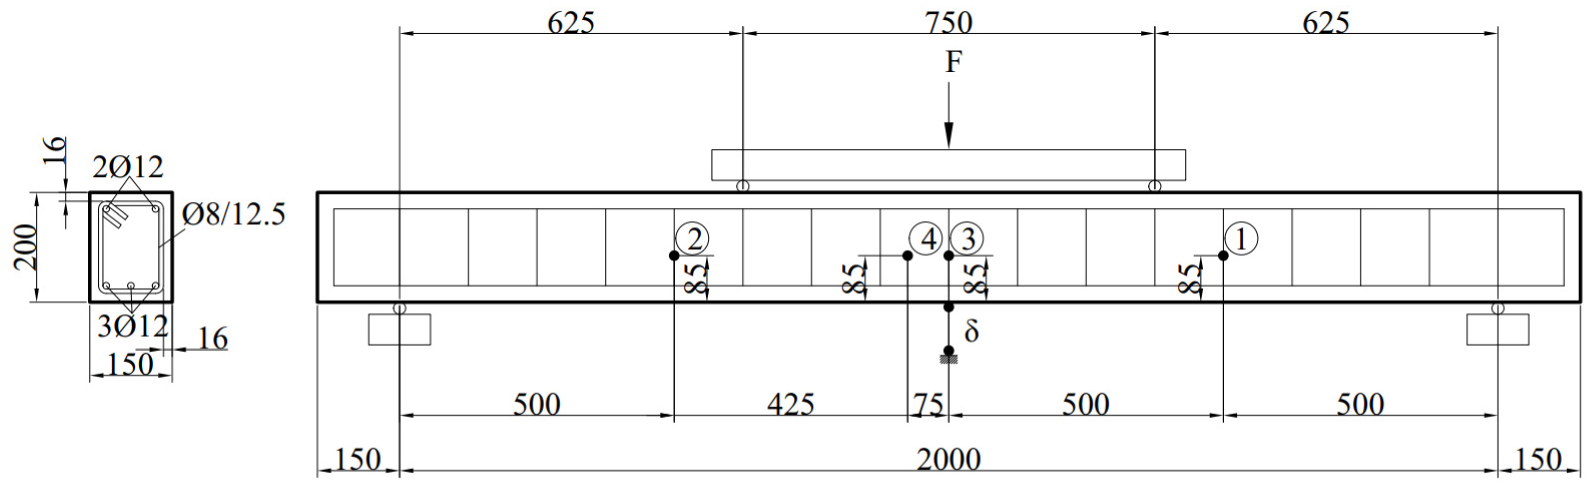
Details of the four-point bending test on the RC beam.
The test was carried out in displacement control developing loading and unloading cycles up to about 80% of the maximum load and then a single monotonically increasing ramp up to the maximum load.
To estimate the mechanical properties of materials, compressive tests were carried out on 150 mm side concrete cubes, providing an average strength of 40.62 MPa. Tensile tests on steel bars gave an average yielding resistance of 560.23 MPa.
AE recording was carried out using four piezoelectric transducers, positioned on the front surface of the beam and at 85 mm from the lower edge (circled numbers in Figure 4). Sensors 1 and 2, with a resonance frequency of 40 kHz, were positioned at 500 mm from the supports, sensor 3, with a wide band of resonance frequency (40–80 kHz), was positioned at the midspan of the beam and sensor 4, with a frequency centred at about 200 kHz, was positioned 75 mm far from the midspan.
A filtering and a pre-amplification factor equal to 38 was applied to the sensors 1, 2 and 3 while a pre-amplification factor equal to 10, without filtering, was applied to the sensor 4. The signals were recorded using a LeCroy oscilloscope, considering a time window of 10 ms from the pre-trigger. Sensor 3, closer to the region of maximum cracking and therefore of maximum AE, has been assumed as a trigger. All the details of the measuring system can be found in Lamberti et al. 44 Figure 5 shows the experimental force–displacement curve, where considerable ductility and a maximum load of 94.05 kN, can be observed. The load at first cracking and the maximum load were estimated by means of analytical expressions. The first cracking load, equal to Fcr = 10.05 kN, was evaluated considering also the contribution of the concrete in tension and a tensile strength equal to 2.61 MPa, according to the formulation of Model Code. 45 The ultimate load, equal to Fu = 91.97 kN, was calculated by adopting the simplified stress-block model for the stress–strain relationship of concrete and the elastic–plastic model for the stress–strain relationship of steel. These values are reported in Figure 5 by means of red dashed lines and show good accuracy compared to the experimental results.
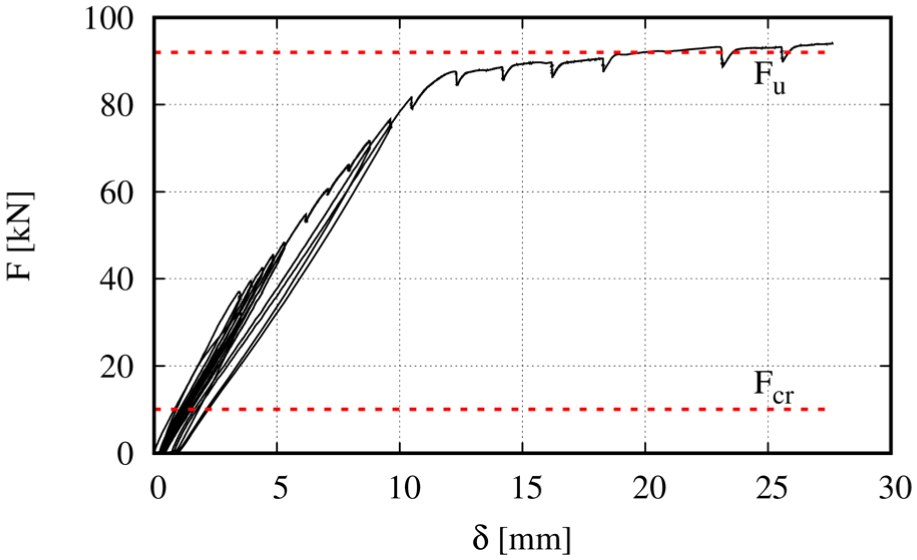
Load–displacement plot in the four-point bending test.
AE analysis
An off-line cleaning process was applied to all recorded voltage-time data of the signals. In particular, the following actions were carried out:
Pre-amplification removal (scaling);
Removal of the low-frequency fluctuations considered as a constant noise in the event window, by imposing the median of the signal to be zero;
Elimination of the values under the voltage amplitude threshold.
The noise threshold is critical for the definition of the signal parameters but rather case-dependent. In this work, it was set as 0.01 V after considering the electronic noise as recorded in typical events (Figure 6(a)). More detailed description of the test and a discussion about the most common acoustic parameters estimated from post-processing of acoustic raw signals can be found in Chisari et al. 46
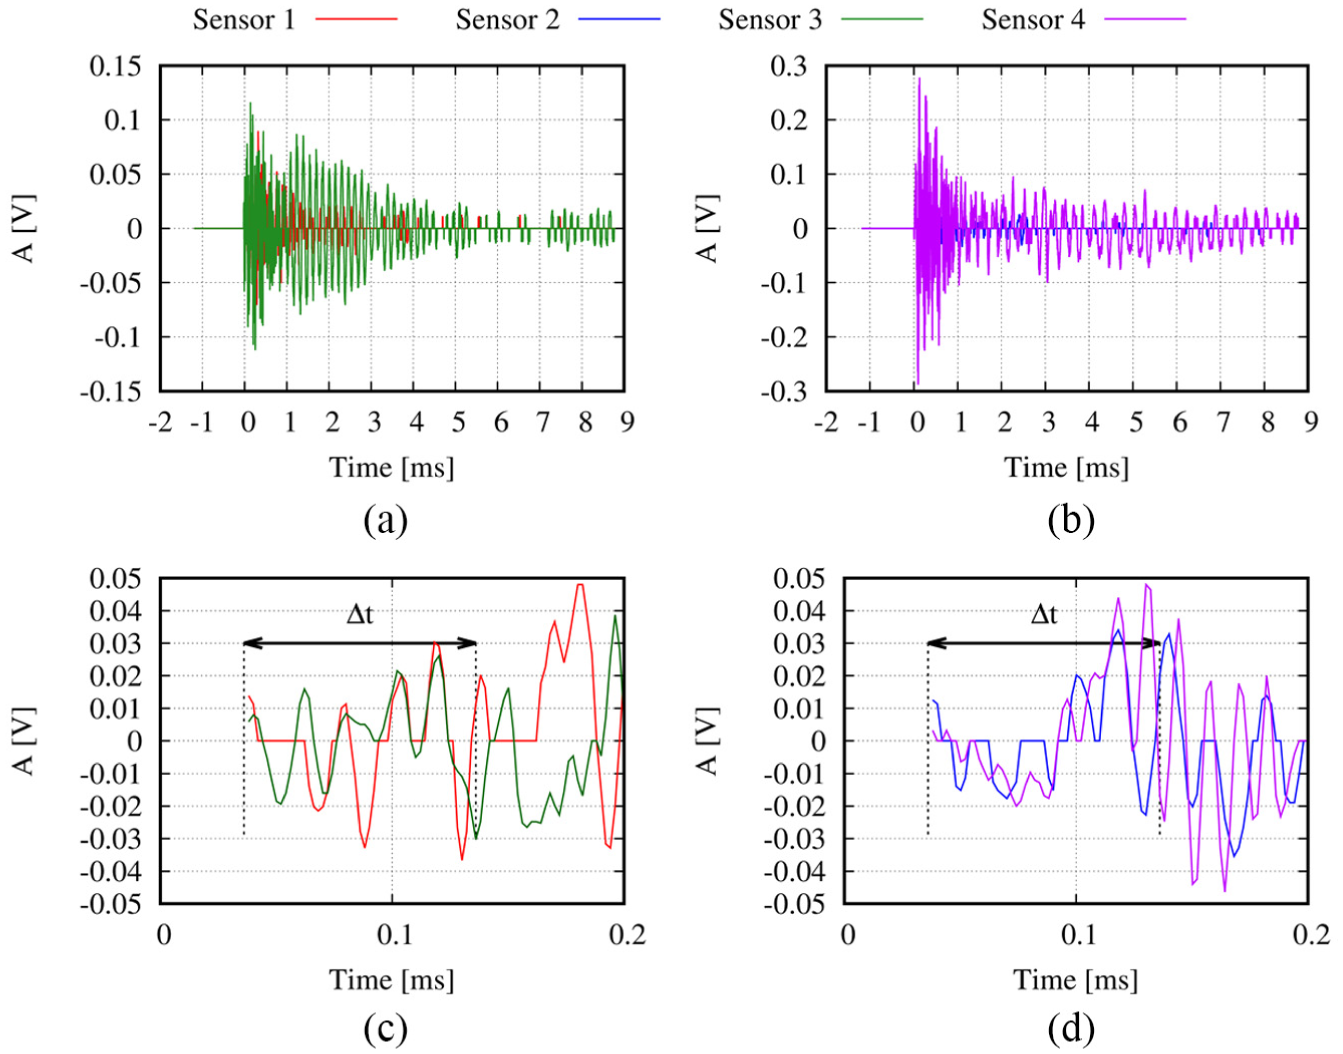
Typical signal recorded: (a) overall signals for sensors 1 and 3, and (b) 2 and 4; (c) zoomed, shifted and scaled signals for sensors 1 and 3, and (d) 2 and 4. Pre-amplification has been removed.
The choice of the time window in equation (6) should be large enough to capture the energy of the event, but as short as to avoid being influenced by noise deriving from reflection and wave mode contamination. In Figure 6(a) and (b), a typical event recorded by the sensors is shown. In Figure 6(c) and (d), the two signals are zoomed, shifted as to make the first threshold exceedances coincident and scaled: it is evident that the wave shape is very similar at the beginning (for a time window equal to
The total number of events after cleaning was equal to 161, 115, 414 and 605 for sensors 1, 2, 3 and 4, respectively. In Figure 7, the force and displacement histories are plotted as lines, while the events are highlighted as circles.
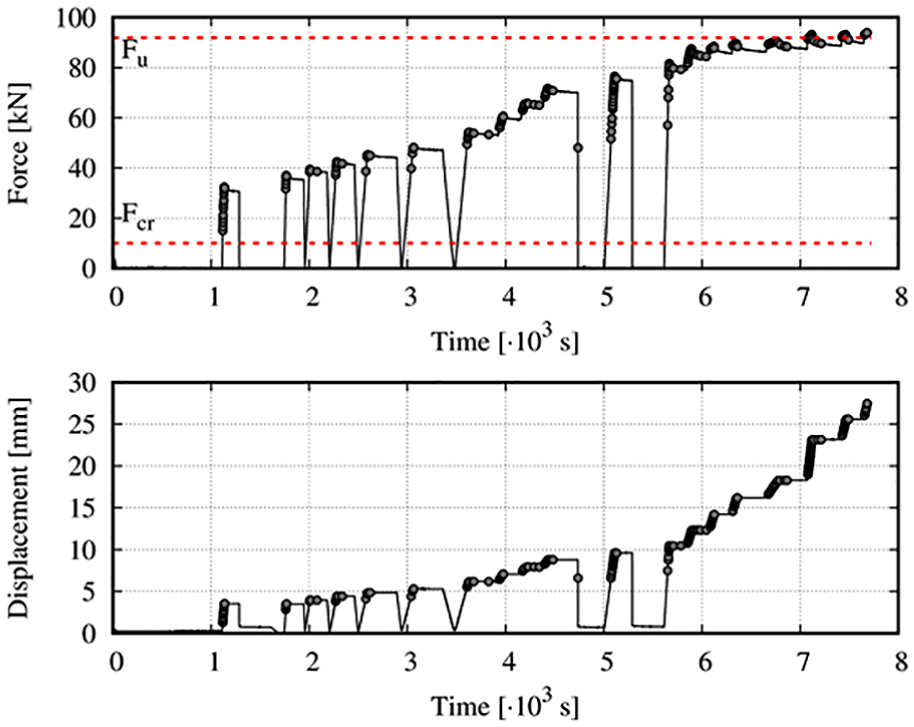
Force and displacement histories and recorded events.
Looking at Figure 7, it is possible to observe that the first events, occurring when the lowest cross-section points in the beam reach concrete tensile strength, were recorded approximately in correspondence of the evaluated Fcr value. The Kaiser effect, stating that in undamaged conditions the AEs appear only when the maximum load previously attained is exceeded, is generally confirmed for the first cycles (Felicity ratio equal to 1). In the latest stages of the test (namely in the last two unloading-reloadings), the Felicity effect is conversely evident, and AE events are recorded for loads below the maximum load attained so far. No events were recorded in the unloading branches, except for a single event at about 4600 s.
In Figure 8, the single events intensity I and the cumulative intensity CI, defined as per equation (6), for sensor 3 are plotted as function of time. It is possible to see that energetic events do not only occur at the end of the test, that is, in the damaged state, but may appear at the beginning. On the contrary, cumulative results show a clearer picture of the damage evolution, as the sudden increment in the CI plot (wide cumulative AE activity) after 7000 s which corresponds to the attainment of the maximum load (Figure 7). Cumulative intensity plot, thus, appears as a reliable indicator of damage onset and progress.
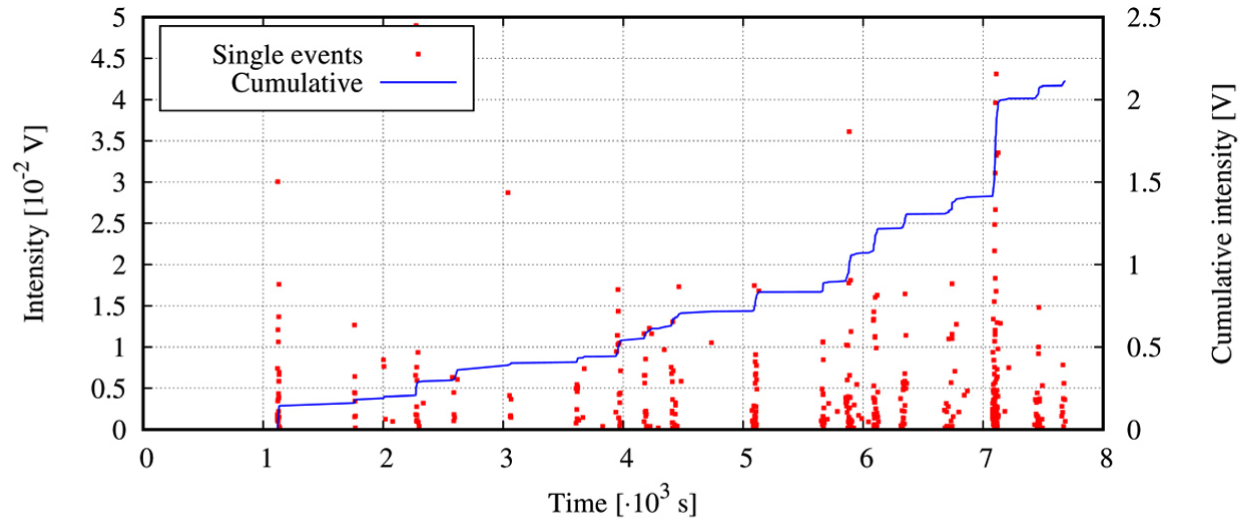
Signal and cumulative intensity of the recorded signals (sensor 3).
In Figure 9, the CSS and the cumulative intensity of the four sensors are shown. Looking at Figure 9(a), it is possible to notice that CSS recorded by sensor 4, which has different frequency band from the other three sensors, is about one order of magnitude greater than the other three sensors. On the contrary, cumulative intensity as defined in equation (6) (Figure 9(b)) shows that the maximum activity is recorded by sensor 3, as we would expect by the consideration that it is placed at midspan, followed closely by sensor 4. Both these sensors are placed in proximity of the constant-moment region of the beam, and thus reasonably their responses are comparable and greater than sensors 1 and 2. This comparison seems to indicate that parameter I may be less influenced by the sensor characteristics than SS. Sensors 1 and 2 present the same cumulative activity until 6000 s and then diverge from each other. This lack of symmetry was evidenced by the crack pattern at collapse (Figure 10), where a larger number of cracks were observed near sensor 1.
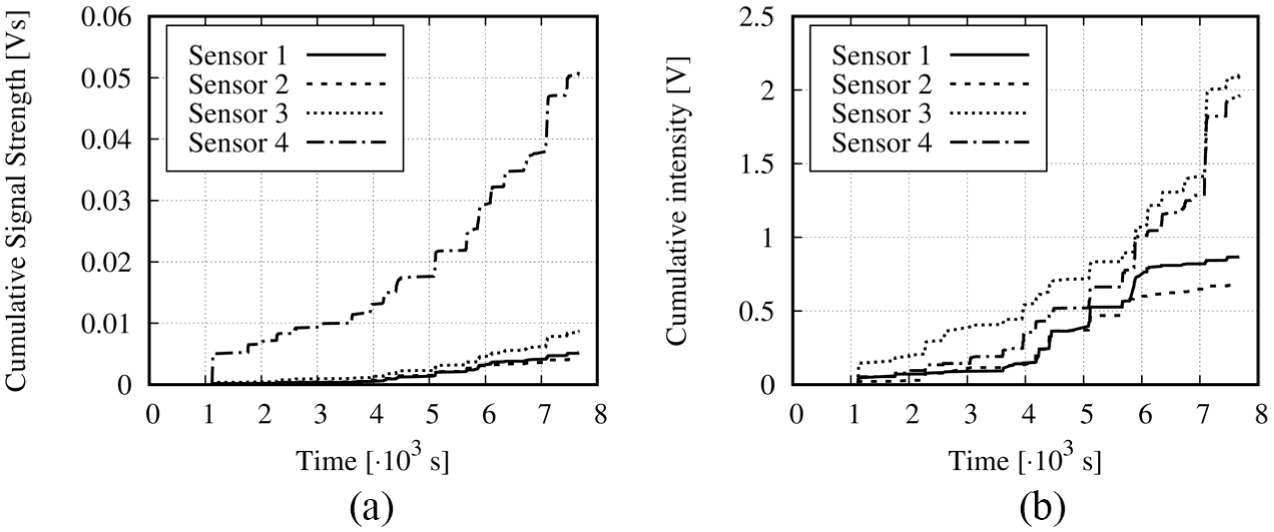
(a) CSS and (b) cumulative intensity recorded by the four sensors.
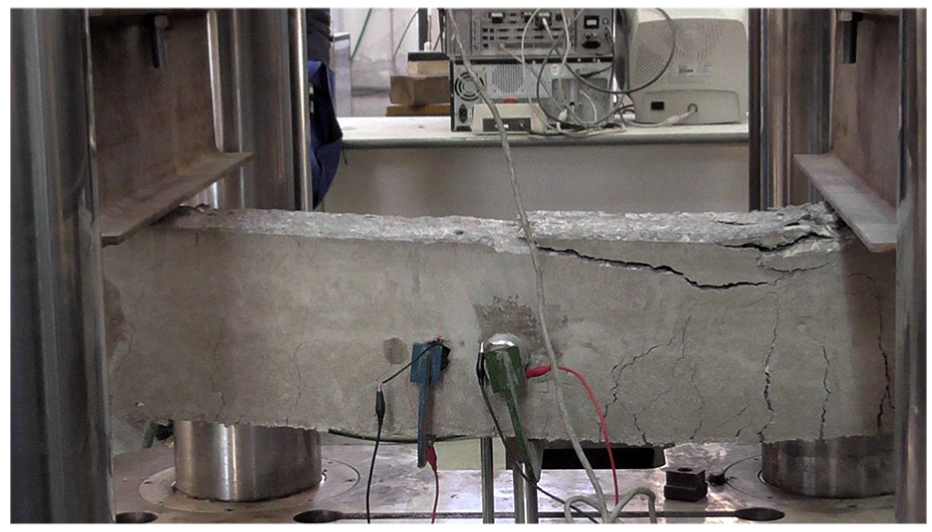
Non-symmetrical crack pattern at collapse.
Numerical simulation
FE modelling of the test
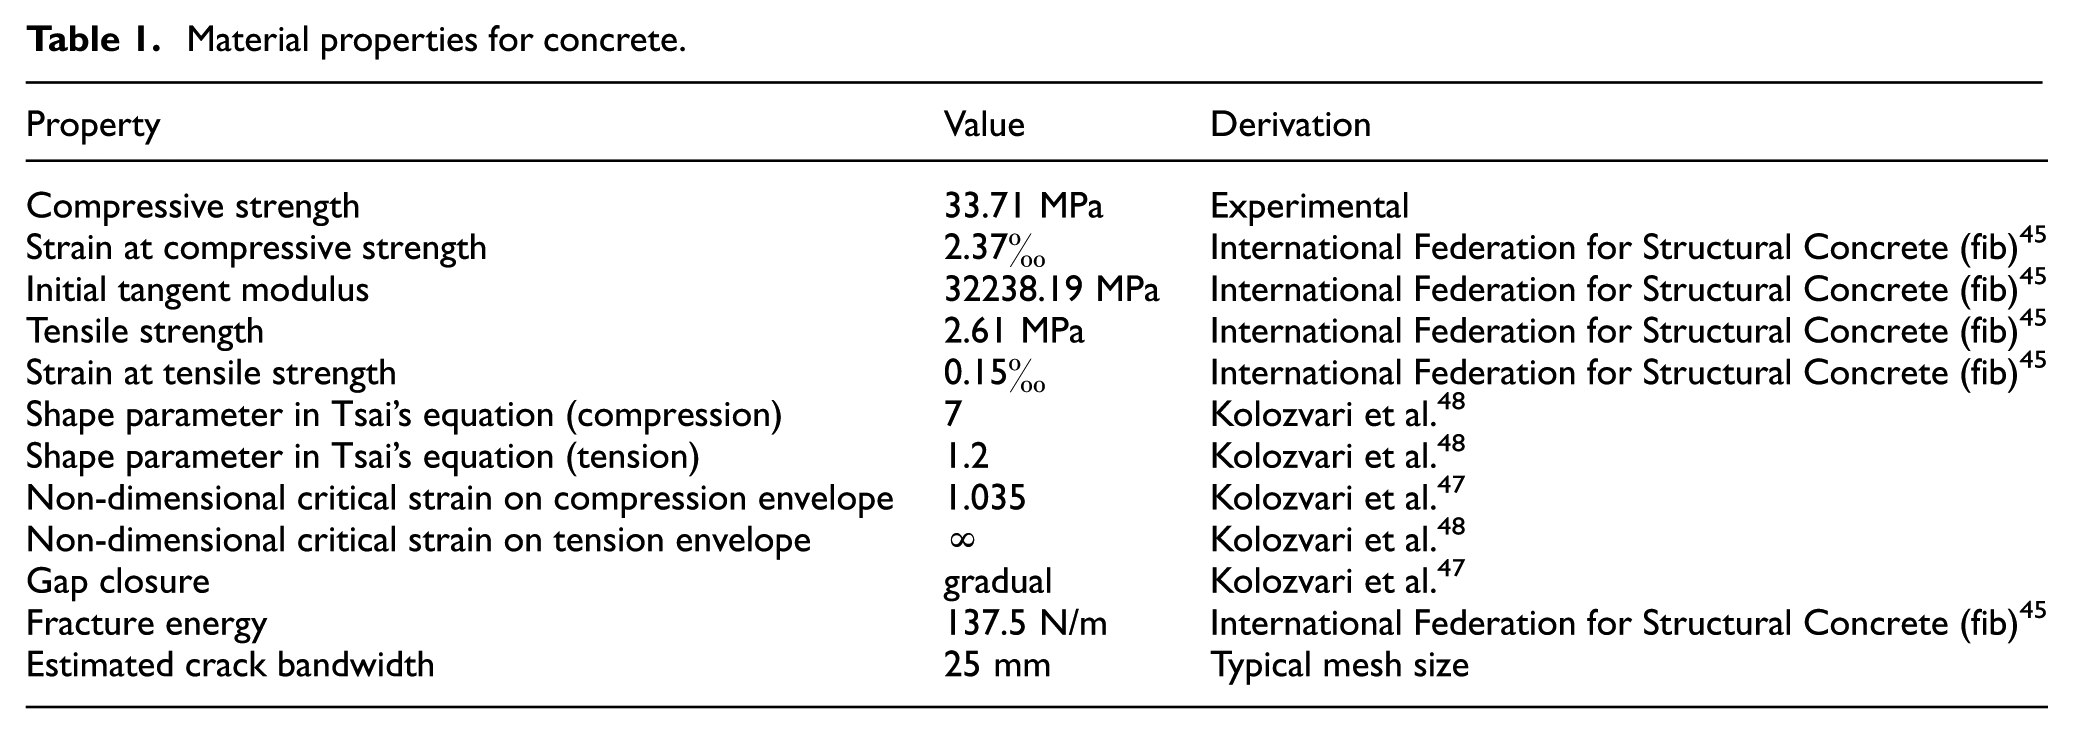
The test was modelled in OpenSees using the approach described in section ‘The mechanical model’. The beam was discretised into 120 MVLEM elements, each composed of 15 panel-like fibres (Figure 11). The material properties used for concrete (Table 1) derive from the experimental compressive strength estimated from tests on cubes, assumptions from Model Code 45 and Kolozvari et al.47,48 The material constitutive relationship for steel is the Menegotto-Pinto model with yield strength equal to 560.23 MPa, Young’s modulus equal to 206,000 MPa and no hardening. Parameters for curvature R = 15 and degradation cR1 = 0.925, cR2 = 0.15 are used according to the suggestions in Kolozvari et al. 47 As far as the panel shear behaviour along cracks is concerned, values η = 0.2 for friction coefficient and α = 0.012 for dowel action stiffness parameter were considered, as suggested in Kolozvari et al. 30 The crack bandwidth has been assumed equal to the typical mesh size. Based on the parameters defining compressive σ-ε curve and the tensile fracture energy density, the constants defined in equation (4) have values: ET = 0.0055 MPa and EC = 0.411 MPa.
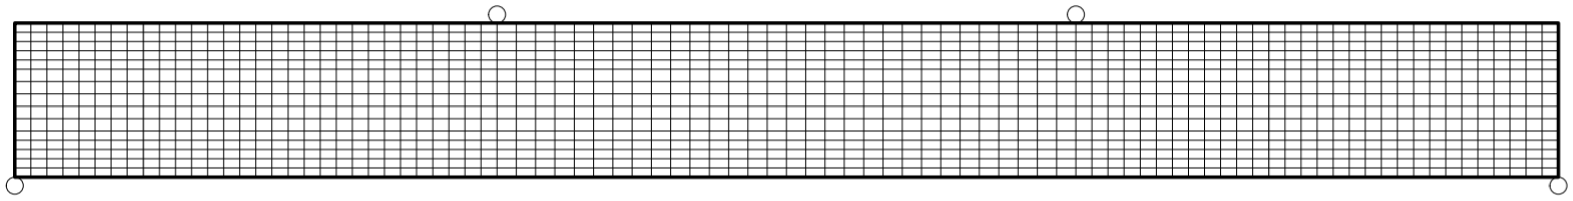
Discretisation of the beam in the numerical model.
Material properties for concrete.
A time history static analysis was performed in OpenSees. The analysis was performed in mixed load/displacement control by applying the vertical load and checking at every time step the displacement at midspan as to match the experimental data. Newton Line Search algorithm was used to this aim. Convergence checks were performed on the energy unbalance of the system with tolerance 10−5Eref, where Eref is the approximate energy evaluated from the experimental results.
Results and discussion
The force–displacement plot of the numerical model is superimposed to the experimental results in Figure 12. The model captures rather accurately the decrease of stiffness due to cracking at the beginning of the test and the cyclic behaviour with stiffness degradation. Although the uncracked stiffness and the final strength seem slightly overestimated, the simulation appears reasonably close to the experimental test.
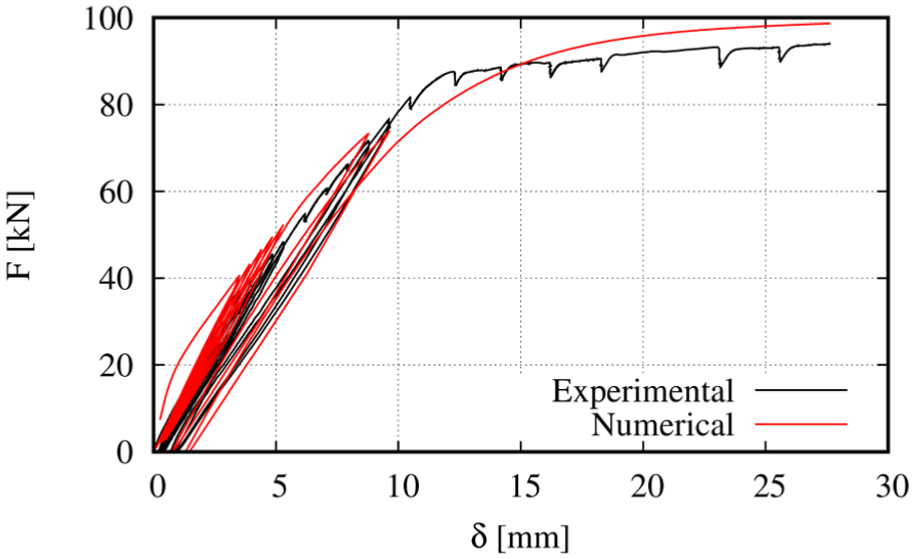
Comparison between the numerical and experimental force–displacement plots.
In Figure 13, the σ-ε plots of concrete and steel at midspan and the ε and σ field in the beam at failure are displayed along with the global F-δ plot. It is possible to appreciate the creation of vertical cracks in the central section of the beam and some inclined shear cracks far from the midspan near the neutral axis. As expected, failure is attained after bottom steel yielding and top concrete crushing.
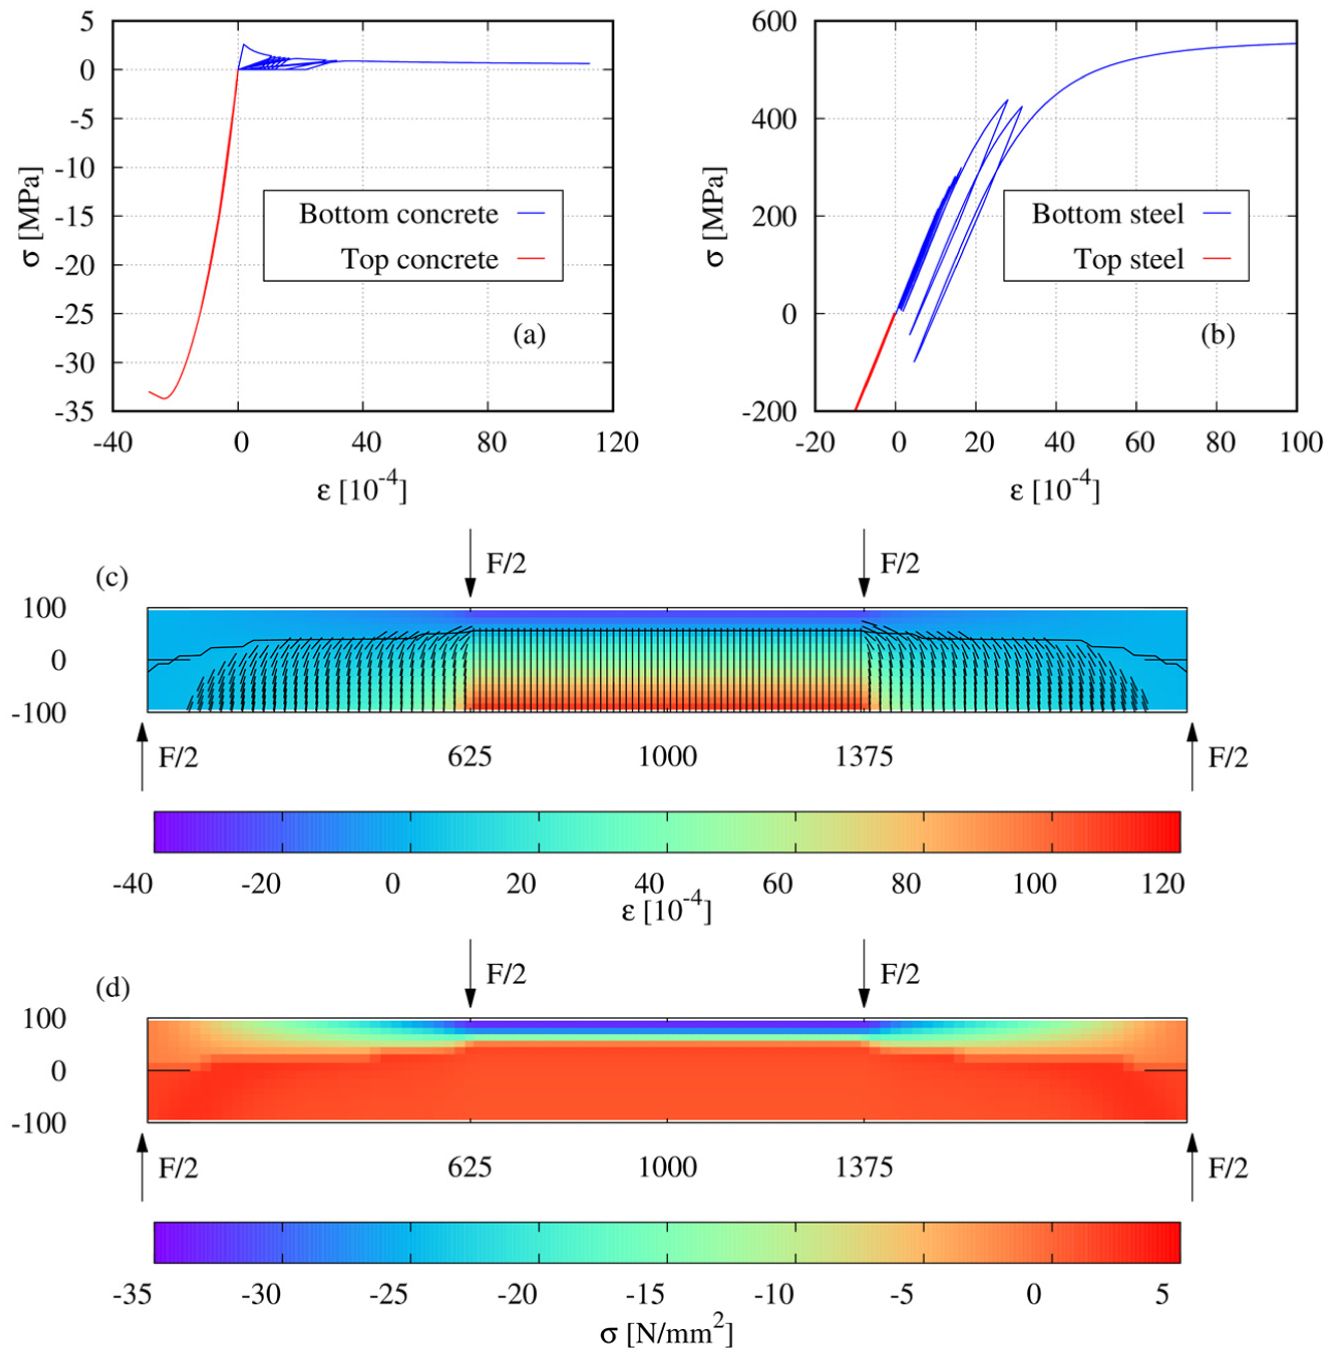
Numerical simulation of the test. Stress–strain plots for (a) the top and bottom concrete fibre and (b) top and bottom steel reinforcement, (c) strain field in concrete with crack pattern and (d) stress field in concrete. In (c) the neutral axis is shown.
From the results of the analysis, simulated acoustic events were extracted with the methodology outlined in section ‘Onset of cracking and intensity of the acoustic event’. Their historical distribution is displayed in Figure 14, showing a remarkable agreement with the experimental results displayed in Figure 7. It is possible to notice that the numerical model seems to be able to simulate the Kaiser effect in the first phases of the analysis and the Felicity effect when the specimen starts to become damaged (last two unloading-reloadings). Interestingly, events in the unloading branch are detected for the same cycles, similar to the experimental results.
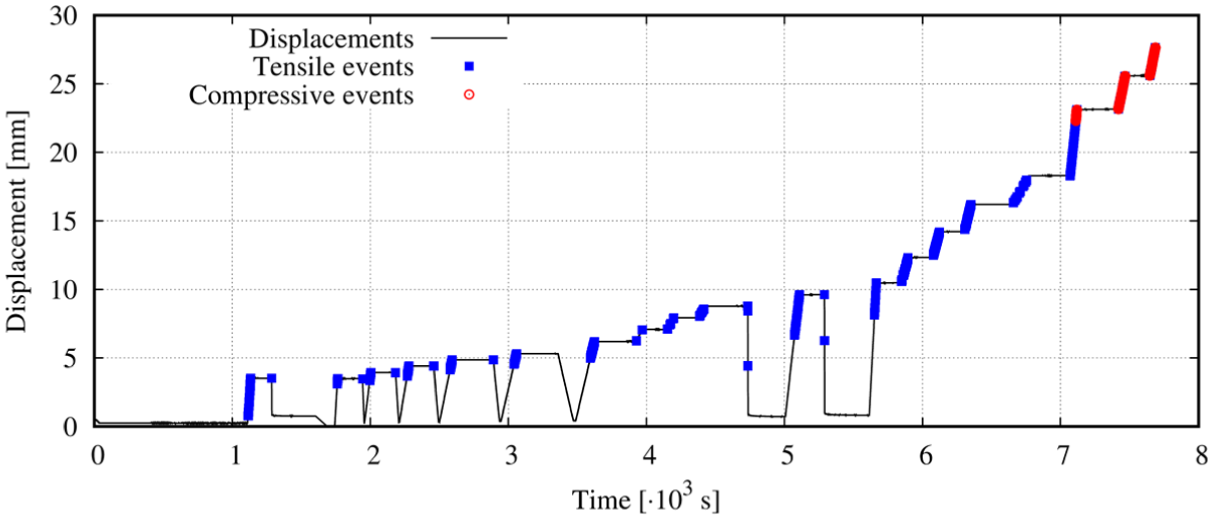
Simulated acoustic events during the test.
In Figure 15(a), the comparison between the Felicity ratio measured and simulated for the eight unloading-reloading cycles performed in the test is shown. It is possible to see that although some differences exist, the model is able to capture the abrupt change observed in the final two cycles. This is confirmed by the plot in Figure 15(b) where the Felicity ratio is plotted against the ratio Fmax/Fu, where Fmax is the maximum load attained so far and Fu is the ultimate load for the specimen, considering the whole test. For Fmax/Fu under 60%, both the experimental and numerical Felicity ratios are greater than 0.85, while when the specimen is significantly damaged (Fmax/Fu > 70%), they are under or close to 0.8. The threshold of 0.85 for damaged/undamaged specimens is similar to that reported in Ohtsu et al., 4 and recommended in RILEM Technical Committee. 49
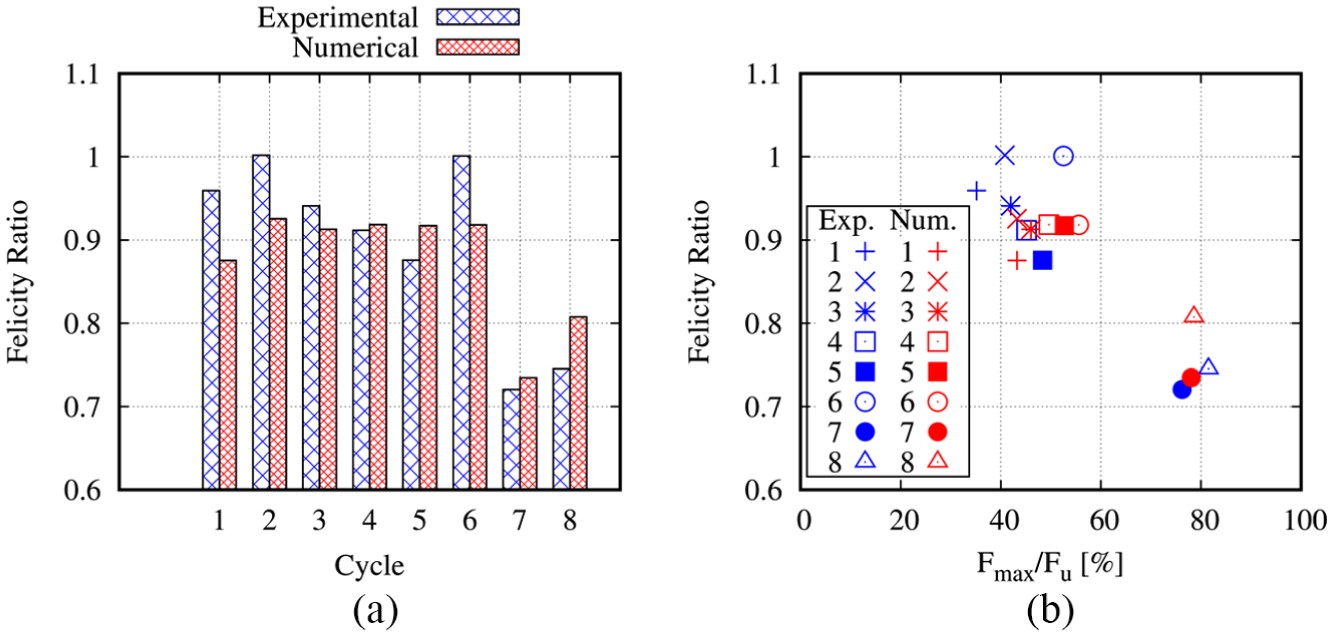
Felicity ratio simulation: (a) comparison with experimental results per cycle and (b) relationship with maximum load reached (the integer numbers indicate cycles).
The distribution of the events simulated by the model (Figure 13) shows that tensile events appear along the whole history, while compressive events are only predicted at the end. This is in agreement with experimental observations that tensile cracking occurred progressively during the test, while concrete spalling only arose at the collapse of the specimen.
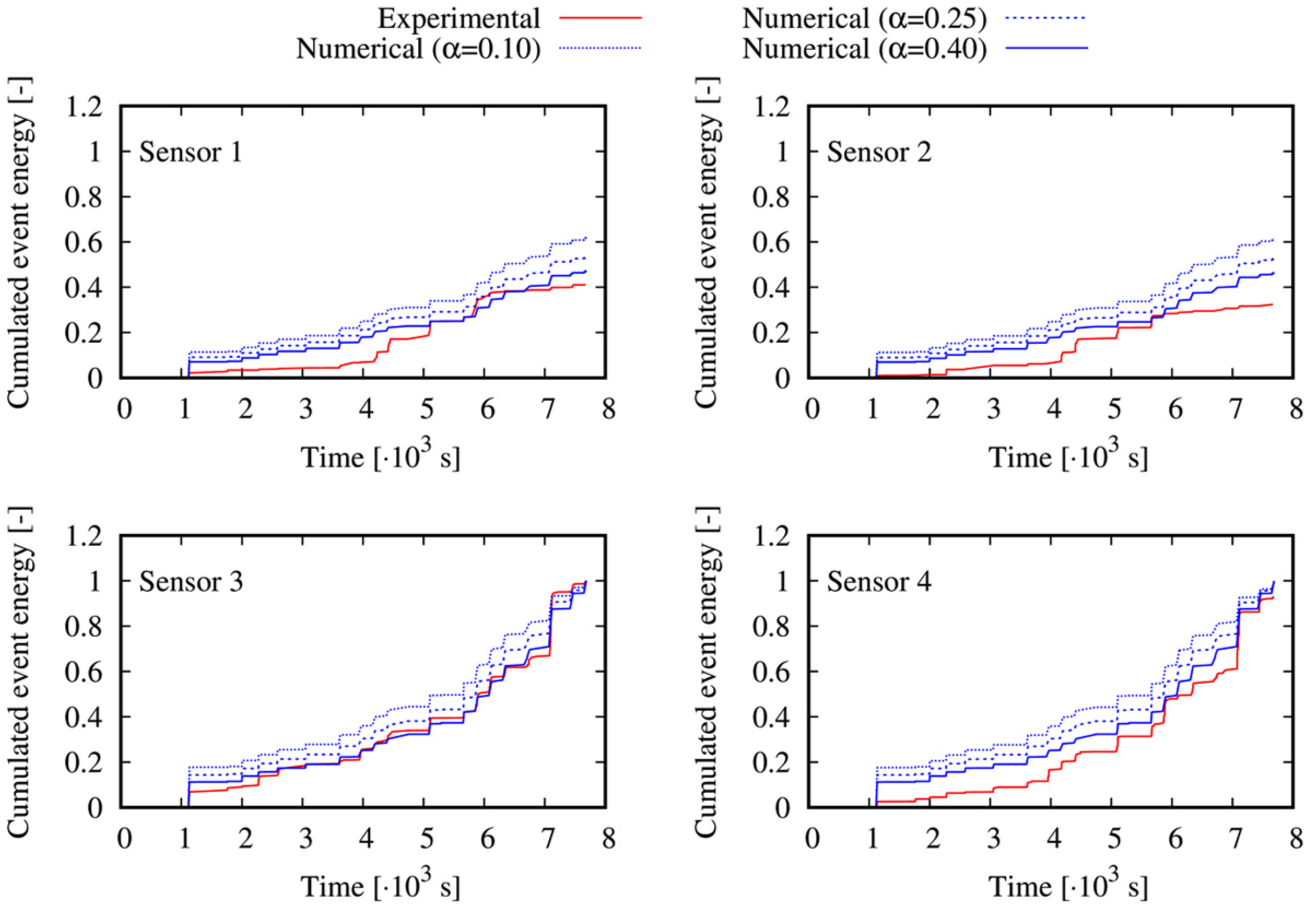
In Figure 16, the cumulative intensity recorded by the four sensors are compared with the simulated counterparts estimated by means of equation (2) and attenuation law equation (8), for various values of attenuation coefficient. As an unknown proportionality factor is necessary to compare experimental results (expressed in V) and numerical counterparts (see equation (2)), all values are normalised to the final cumulative intensity of sensor 3. This has been selected as normalisation value since the sensor was located in the midspan of the beam and because it has a wide band of resonance frequency (40–80 kHz). The values for the attenuation coefficient are chosen as representative of the variability experimentally observed in Philippidis and Aggelis 43 (Figure 2) for various concrete types and frequency source. It must be pointed out that in the proposed methodology the simulated events do not carry any information about frequency content, as they are characterised by the position of the occurring damage and its magnitude. Thus, the simplification of using a single attenuation value, unlike to frequency-dependent law proposed in Philippidis and Aggelis, 43 has been deemed necessary.
Comparison between experimental and computed cumulative energy recorded by the four sensors for different value of attenuation coefficient.
Figure 16 shows that for all sensors larger coefficients of attenuations lead to better approximation of the recorded responses. α = 0.4 was estimated in Philippidis and Aggelis 43 as limit value for various types of concrete and high frequencies (>500 kHz). Considering the sensors used in this experimental programme, such high frequencies are unlikely to be captured: however, with increasing damage in concrete, it is realistic to assume correspondingly increasing attenuation, 50 such as to justify the high value α = 0.4.
Conclusions
In this article, a numerical approach for the simulation of AEs in RC structures is proposed. The mechanical behaviour of RC structures under cyclic loading may be predicted by means of the accurate yet relatively computationally inexpensive fixed-strut angle model proposed by Kolozvari et al. The evolution of the internal stress and strain state is monitored during the analysis, and AE event occurrence and intensity are estimated based on energetic considerations. An approximate exponential law for the attenuation due to distance is then used to estimate the acoustic energy recorded by piezoelectric sensors.
An important feature of the approach is related to the signal recorded by the sensors. In the literature, SS is often assumed as a proxy of the energy released by the source. In this work, it is shown that such parameter is strongly influenced by the frequency band of the sensor and by the complex phenomena occurring related to wave propagation, that is, reflections and mode superposition. To overcome this problem, only the first part of the signal has been considered as it is mainly controlled by the longitudinal waves. The average absolute amplitude of the signal over a short time window after the first threshold exceedance is assumed as index of the AE energy and compared with the numerical predictions. These comparisons were carried out here with reference to a four-point cyclic bending test on a RC beam.
The numerical model is able to predict the occurrence of AE events highlighting the Felicity effect when the structure becomes increasingly damaged. Furthermore, a remarkable agreement is observed between the numerical and experimental cumulative energy curves, in particular for the sensors which are closer to the maximum moment region. A parametric analysis shows that high attenuation coefficients for the exponential law lead to better fit, in particular with the furthest sensors. It must be pointed out that the use of a single attenuation coefficient for the exponential law does not account for frequency content of the signal and increasing damage in the medium and thus is necessarily approximate.
The methodology outlined in this article represents a proof of principle that a direct correlation between acoustic observations and macroscale mechanical models usually employed for the prediction of the response of RC structure under cyclic loading can be established. This could potentially improve calibration and identification of such models by means of AE data in the context of structural assessment, with a considerable boost in the applicability of AE technology compared to the existing (mainly) empirical approaches. Further research will focus on a better characterisation of tensile and compressive stress-related events and embedding of more accurate wave propagation algorithms into the procedure. Comparisons with more detailed 3D models, either homogeneous or where fracture is explicitly modelled including multi-scale approaches, will be performed in the future to increase the confidence in the methodology.
Footnotes
Acknowledgements
TAU Lab of the University of Salerno and in particular Prof. Nicola Lamberti, Mr Pasquale D’Uva and Mr Nicola Greco are gratefully acknowledged for the technical support during (and fruitful discussions after) the experimental test described in this paper.
Declaration of conflicting interests
The author(s) declared no potential conflicts of interest with respect to the research, authorship, and/or publication of this article.
Funding
The author(s) disclosed receipt of the following financial support for the research, authorship, and/or publication of this article: “Fondo di Finanziamento per le Attività Base di Ricerca (FFABR) 2017” assigned to C. Guarnaccia.