
Abstract
There has been a large volume of research on structural health monitoring since the 1970s but this research effort has yielded relatively few routine industrial applications. Structural health monitoring can include applications on very different structures with very different requirements; this article splits the subject into four broad categories: rotating machine condition monitoring, global monitoring of large structures (structural identification), large area monitoring where the area covered is part of a larger structure, and local monitoring. The capabilities and potential applications of techniques in each category are discussed. Condition monitoring of rotating machine components is very different to the other categories since it is not strictly concerned with structural health. However, it is often linked with structural health monitoring and is a relatively mature field with many routine applications, so useful lessons can be read across to mainstream structural health monitoring where there are many fewer industrial applications. Reasons for the slow transfer from research to practical application of structural health monitoring include lack of attention to the business case for monitoring, insufficient attention to how the large data flows will be handled and the lack of performance validation on real structures in industrial environments. These issues are discussed and ways forward proposed; it is concluded that given better focused research and development considering the key factors identified here, structural health monitoring has the potential to follow the path of rotating machine condition monitoring and become a widely deployed technology.
Keywords
Introduction
There has been a huge and increasing volume of research on structural health monitoring since the 1970s with ∼17,000 papers published in the last decade alone (Scopus search on ‘structural health monitoring’ from 2008 to 2017 conducted in March 2017). However, this enormous research effort has yielded only a small number of routine industrial applications.
Structural health monitoring (SHM) and non-destructive evaluation (NDE) both aim to assess the integrity of a structure non-destructively and, depending on the definitions employed, the fields can overlap to a greater or lesser extent. In this article, I define NDE as the use of measurements taken using removable transducers and instrumentation to assess structural integrity. It is often carried out at plant shutdowns so measurements are usually infrequent and are generally interpreted by the test technician on a one-off basis without attempting to compare the signals obtained in the current inspection with those obtained previously. By contrast, SHM involves permanently attached transducers, often combined with instrumentation, and so enables frequent measurements during operation. The signals obtained are often interpreted by comparing them with previous measurements using a process commonly called baseline subtraction; the detection of damage from the sequence of signals may be automated.
The subject of SHM is very broad and, if defined widely, can include applications on very different structures with very different requirements. Table 1 splits the subject into four categories:
Machine condition monitoring– this is concerned with the condition of rotating machines and is a relatively mature field. It is included here for completeness but is not strictly concerned with structural health; there have been an additional ∼6000 papers published in this area over the last decade (Scopus search on ‘machine condition monitoring’ from 2008 to 2017 conducted in March 2017). Significant activity in this area started in the 1930s, whereas interest in SHM applied to non-rotating structures took off in the 1970s; this time-lag may partially explain the relatively few industrial applications of SHM to non-rotating structures.
Global monitoring of large structures– this started with attempts to detect localised damage from a small number of measurements, but is now often Structural Identification– developing a numerical model of a dynamic system based on its measured response, with emphasis on assessment of the health and performance of the structure, as well as decision-making regarding its maintenance and/or rehabilitation. 1 This is applied to large structures such as bridges and is unlikely to be sensitive enough to detect localised damage reliably, unless it is extremely severe.
Large area monitoring– techniques that offer full volume coverage of a region of a larger structure from a limited number of sensors; these methods are looking for localised damage and there is often a trade-off between area coverage per sensor and sensitivity. Full coverage of a large structure would typically require multiple large area monitoring systems to be deployed.
Local monitoring– techniques that monitor a small area immediately adjacent to the sensor. These are useful for tracking the progress of damage already identified in routine non-destructive testing (NDT) inspection, or monitoring known hot-spots; they can also be used as spot checks where degradation is expected to be relatively uniform across a structure.
Classification of SHM techniques.
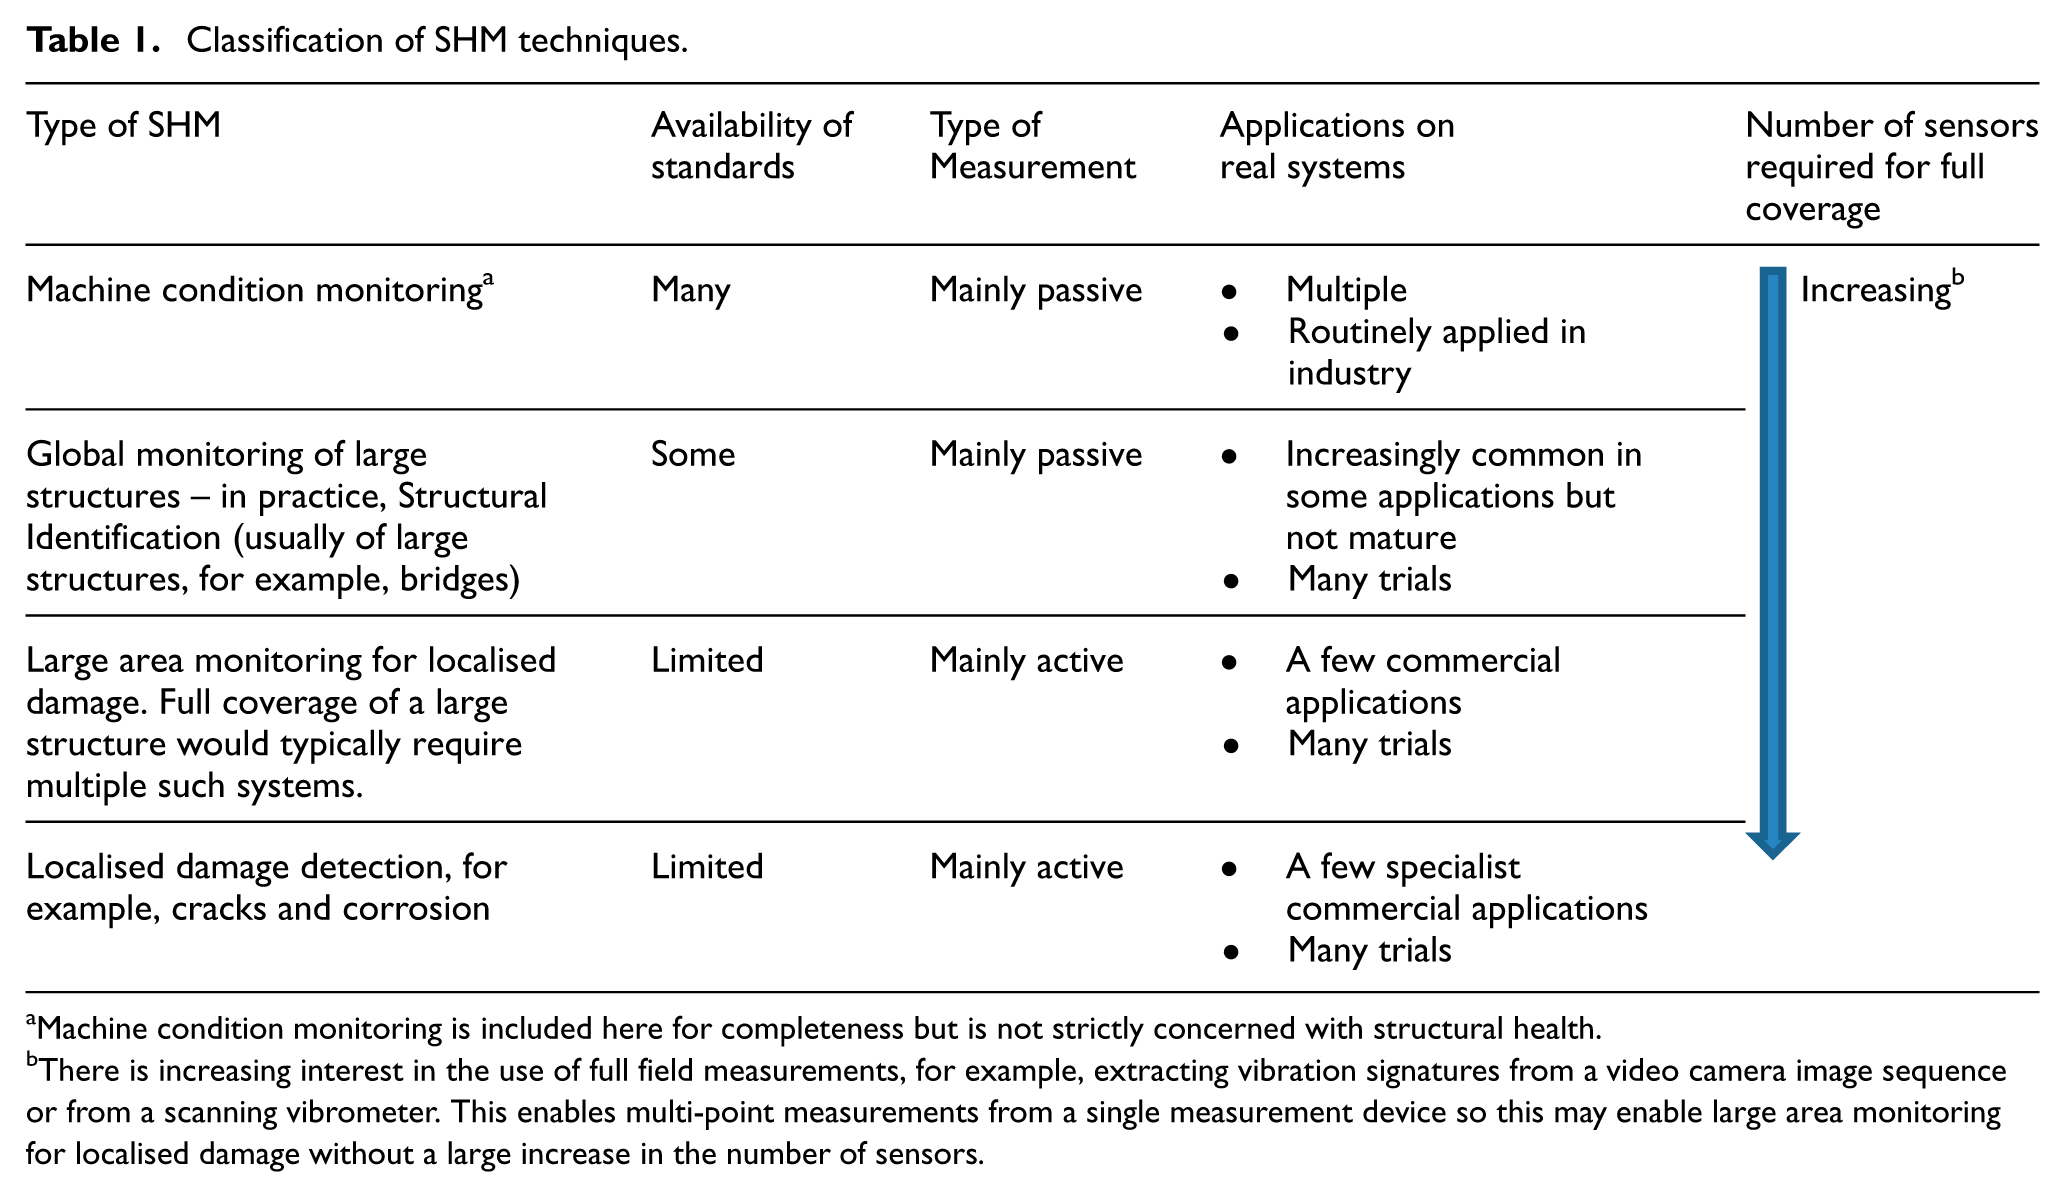
Machine condition monitoring is included here for completeness but is not strictly concerned with structural health.
There is increasing interest in the use of full field measurements, for example, extracting vibration signatures from a video camera image sequence or from a scanning vibrometer. This enables multi-point measurements from a single measurement device so this may enable large area monitoring for localised damage without a large increase in the number of sensors.
Machine condition monitoring employs mainly passive measurements, for example, vibration levels during operation or debris levels in lubricating oil. Similarly, structural identification can be done by monitoring the vibration response to wind or traffic loading, though it is also possible to use active excitation. By contrast, large area and local monitoring generally involve measuring the response to an active excitation input, though acoustic emission (AE) can sometimes be used. The number of sensors required for full structure coverage increases going down the table.
This article discusses each area in more detail, and then goes on to discuss the business motivation for installing an SHM system since, unless this is clear, the technology will not be widely adopted. In traditional NDT, data interpretation is typically done by the trained technician doing the inspection; in contrast, SHM systems can generate vast amount of data that has to be analysed. This problem has not received sufficient attention in the literature and is discussed in a separate section. This is followed by a discussion of the design of SHM systems and the validation of their performance as unless they can be shown to be reliable, the required investment will not be made. The article does not claim to be a comprehensive review of the state of research in the field – this has been covered by many review papers, some of which are referenced here; it concentrates on applications of the technology and does not pretend to discuss state-of-the-art research that has not reached commercial use. Rather, this article seeks to focus discussion on the barriers to adoption of the technology, and the work required to overcome them. Also, by splitting the field into different categories, it hopes to promote focused discussion around better defined topics.
Machine condition monitoring
As discussed above, machine condition monitoring is not strictly concerned with structural health; however, many authors treat it as a type of SHM (see, for example, Farrar and Worden 2 ) so it is included here for completeness and because, as a relatively mature field, useful lessons can be read across to the rest of SHM. Randall 3 gives an excellent introduction to the subject; he identifies three maintenance strategies:
Run-to-break– the machine is simply run until it breaks down. This offers the longest time between shutdowns, but is unacceptable if the failure can cause danger to personnel or costly knock-on effects. Also, the shutdown caused by the failure is unplanned and may be extended by lack of spare parts, availability of labour and so on. Nevertheless, this can be a good strategy in industries using multiple, similar machines where the loss of one machine does not have a major impact on production, and where the failure will not be catastrophic.
Time- or usage-based preventive maintenance– maintenance is done at regular intervals that are shorter than the expected time between failures. This has the advantage that most maintenance can be planned in advance and there is a greatly reduced probability of catastrophic failure. However, if degradation rates are unpredictable, the mean time to failure can be two to three times the minimum, so if the maintenance interval is chosen to give very few failures, many serviceable parts will be replaced.
Condition-based maintenance– here, the potential breakdown of a machine is predicted through regular condition monitoring, and maintenance is carried out at the optimum time. This has obvious advantages, but is dependent on reliable monitoring techniques. Initial successes were in industries where machines are run at constant speed and roughly constant load; the features taken from the raw measurements are then easily computed, robust and highly correlated to particular damage types, making changes relatively easy to track. However, the range of successful applications has now greatly increased. 3
Condition monitoring requires information about the internal condition of the machine to be obtained externally. Vibration analysis is the most commonly applied method, and the analysis techniques have advanced greatly over the historic observation that if a machine is vibrating more than normal then it is likely to be faulty. Lubricant analysis can be used to identify wear particles and chemical contaminants and is also commonly applied, while the use of thermography to identify temperature anomalies is increasing.
There is a choice between continuous and intermittent monitoring; once a fault is present, the resultant vibration signature will always be present so intermittent monitoring does not risk missing the problem. This contrasts with crack monitoring using AE 4 where the emission is produced by the crack growth events, so continuous monitoring is essential. The choice between continuous and intermittent monitoring is analogous to that between NDT and SHM – in intermittent monitoring, the instrumentation costs are spread over many machines and the data analysis is likely to be done by the trained operator, while in continuous monitoring, the instrumentation is permanently installed on one machine and generates large volumes of data that have to be interpreted. Lubricant analysis looks for build-up of debris over time and so is inherently an intermittent method.
Mitchell 5 gives a fascinating account of the 70 years of progress in condition monitoring to 2007. He identifies a series of key advances:
Replacement of subjective assessment by electronic vibration measurement and quantified levels of severity; in 1939, Rathbone 6 published vibration severity criteria that have been very widely applied ever since.
Frequency analysis, initially via analogue filters, enabling better identification of the nature of the fault.
In the 1960s, non-contact proximity probes were developed to allow the motion of the shaft of large turbo-machines relative to the bearing housing to be measured. Although this involves modification to the machine to introduce the probe, the method is now universally applied.
Accelerometers replacing the original displacement and velocity sensors.
Portable data recorders (initially analogue tape recorders) replacing the racks of instrumentation previously required.
Digital fast Fourier transform (FFT) analysis giving better frequency analysis than the original analogue filters.
Automated analysis on local computers assisting interpretation.
Permanently installed sensors and then instrumentation to allow continuous monitoring of critical machinery.
Combination of multiple measurements to improve diagnostics – current predictive monitoring software analyses multi-channel vibration data, lubricating oil analysis, temperature and other machine performance data. 7
Predictive monitoring via expert systems produced both by OEMs and third parties; trend monitoring is particularly powerful in giving early warning of developing problems. 8
Development of national and international standards and training schemes, for example, the ISO 18436 9 series.
While some early implementations were bedevilled by false calls, the analysis techniques have advanced greatly and the technology is now mature and widely applied; multiple case studies demonstrating the detection of out-of-balance, bearing faults, shaft cracks, fractured gear teeth and other problems are available on the websites of the large system suppliers, for example, GE Measurement, 10 Honeywell 11 and National Instruments. 12
It is interesting that, in contrast to structural monitoring, many of the developments in machine monitoring identified by Mitchell 5 originated in industry rather than academia, and were applied immediately. Also in contrast to structural monitoring, only a small number of passive measurements is required to cover the whole machine, and it is relatively easy to link measurements to remnant life via fleet statistics incorporating readings of load, pressure, temperature and other process parameters, along with the specific condition monitoring measurands. The longer history of machine condition monitoring, the small number of sensors required for full coverage and the large installed base on similar machines facilitating fleet statistics are probably the main reasons for the much larger number of practical applications of machine condition monitoring compared to the rest of SHM.
Global monitoring of whole structures
Attempts to obtain local damage detection with full structure coverage
Condition monitoring aims to infer the health of a whole machine from measurements at a small number of locations, and in the 1970s, researchers started to investigate the possibility of assessing the integrity of structures from a similarly small number of measurements. The work concentrated on vibration measurements since vibration modes are properties of the whole structure, and the resonance frequencies are independent of measurement position provided there is motion in the mode at the chosen point. The chief motivation for the initial work was to assess the integrity of offshore oil platforms in the North Sea or Gulf of Mexico from measurements of the vibration response to wave excitation taken above the water line. However, it was found that the measured resonance frequencies were sensitive to environmental conditions such as marine growth that adds significant mass to the structure, and also to changes in the mass distribution on deck, and these changes effectively corrupted the data. The tests also identified uniqueness issues associated with the damage prediction if only resonance frequencies are used, and this lack of success led to the oil industry abandoning the technology in the mid 1980s. 13 There has been a great deal of further work since that time and many reviews, for example, Farrar and Doebling 14 and Fan and Qiao. 15
The resonance frequencies of the lower structural modes are affected by changes in boundary conditions, mass distribution and temperature-induced modulus changes much more than by the stiffness changes produced by localised damage unless the damage is very severe. Changes in boundary conditions due to scour around a pier, expansion joint failure or seizing of bearings designed to restrain motion in a particular direction can be very serious and are detectable from changes in the lower structural modes. However, localised damage produces much smaller changes, for example, Figure 1 shows the change in the resonance frequency of the first flexural mode for a crack-like defect at the root of a cantilever beam. A crack through 1% of the cross section produces a frequency change of ∼0.1% and this can also easily be produced by other effects, leading to high false call rates; the sensitivity is even lower at other locations on the beam, particularly towards the free end. 16 This problem with resonance frequency measurements has led to a great deal of work on mode shape measurements that are then often double-differentiated to obtain the curvature, and hence the flexural strain; a variety of processing methods can then be used to assess whether damage is present. Farrar and Jauregui17,18 assessed six processing methods for the detection of severe simulated cracks in one girder of a 48.8-m-long bridge over the Rio Grande in Albuquerque, New Mexico. Data from the first six modes were used, and in the initial measurements using 26 accelerometer measurement locations over the bridge, the damage was not reliably located until it had removed half the thickness of the I-girder, including one flange. The performance improved considerably when measurements from 16 accelerometers distributed along the girder in which damage was introduced were included in the analysis; a 2-ft-long simulated crack in the web of the girder was then detectable. This indicates that useful damage detection performance might be obtainable if significant numbers of measurements are taken along all the members of interest. This moves away from the original goal of assessing structural integrity from only a small number of measurements, as is achieved with machine condition monitoring. However, there are increasing possibilities of measuring vibration at multiple locations on a structure using a remotely positioned scanning laser vibrometer 19 or by processing frame sequences from a video camera; 20 these approaches greatly increase the attractiveness of multi-point measurement methods.
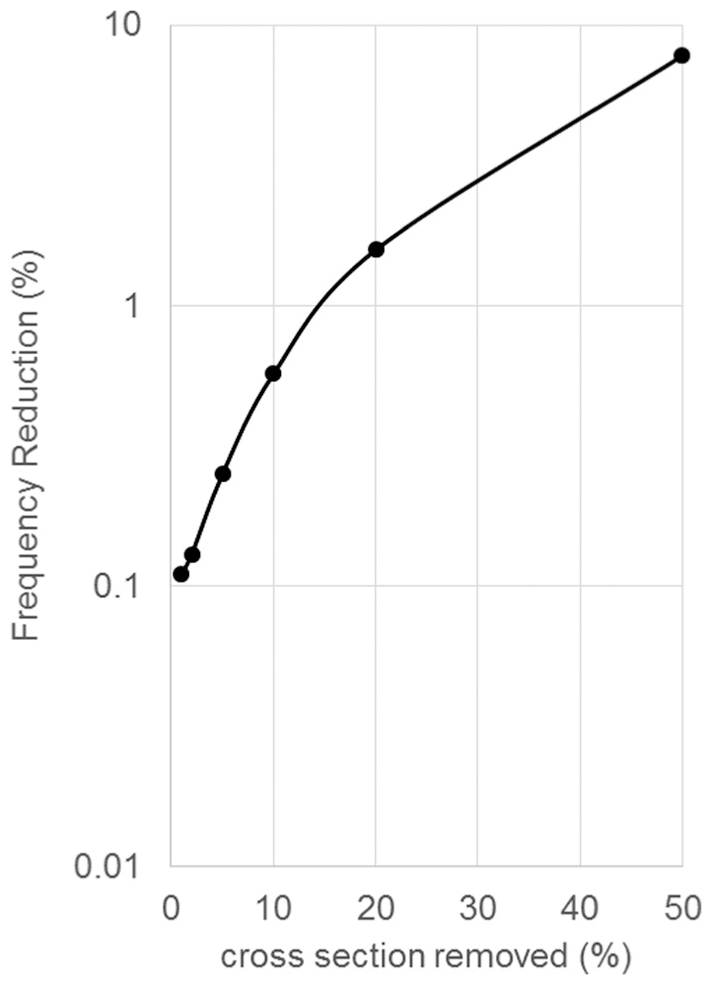
First-mode flexural resonance frequency reduction predicted using finite element analysis as a function of the depth of narrow slot across the full width at root of a cantilever beam.
The cost effectiveness and reliability of modal measurements in the presence of environmental and loading changes would have to be assessed before it was implemented on an operational structure. Peeters and De Roeck 21 monitored a bridge in Switzerland over a period of a year and tracked the variation in natural frequencies with temperature. They showed that it was possible to correct the natural frequency measurements for temperature changes and so improve the detectability of severe damage to the bridge piers; they did not investigate the effect of load changes. To the author’s knowledge, a modal-based local damage detection system has not been implemented on civil engineering structures, but such a system was implemented on the NASA space shuttle 22 where the exterior surface was inaccessible due to the thermal protection system which made conventional NDT particularly difficult.
Structural identification from limited measurements
Although the use of low-frequency vibration measurements at a small number of points to detect localised damage in large structures is very difficult, considerable health monitoring value can be derived from these measurements. Despite huge advances in computer power, models of large structures such as bridges are not able to accurately predict safe operating windows; this is because uniqueness and uncertainty issues (e.g. boundaries – soil foundations shifting and constraints at expansion joints) of bridges and similar large structures make reliable models very difficult to construct. Structural Identification (St-Id) aims to bridge the gap between the model and the real system by developing reliable estimates of the performance and vulnerability of structural systems through improved simulations using experimental observations/data. St-Id is the process of creating/updating a physics-based model of a structure (e.g. finite element (FE) model) based on its measured static and/or dynamic response that will be used for the assessment of the structure’s health and performance as well as decision-making; this is made difficult by the large degree of freedom mismatch between models derived from experimental measurements at a limited number of positions and typical FE models. By offering a rational means to collect, analyse and interpret quantitative data from constructed systems, St-Id has the potential to reduce the need for excessive conservatism in the face of uncertainty, and to expand the assessment of structural performance beyond its current, exclusive reliance on visual appearance. 23 The Structural Engineering Institute of the American Society of Civil Engineers has promoted much interest in this area that has led to a book 23 and a special issue of the ASCE Journal of Structural Engineering. 1 There are six essential steps in Structural Identification:23,24
Justification and preparations for St-Id
A priori modelling
Operational monitoring and controlled experimentation
Data archival, quality assurance, processing, pattern extraction, modelling and interpretation
Selection, calibration and validation of physics-based model(s)
Decision-making
Step 6 involves using the calibrated model for scenario analyses, evaluating and prioritising decisions regarding performance and/or condition concerns and/or retrofit and renewal design. The single most important requirement is to make the model and simulations sufficiently complete, that is, incorporating all of the critical mechanisms that may govern the kinetics and kinematics as well as proper choice of the scenarios that will be simulated by the model given the drivers of the application. 24 The potential gains from this are very substantial since it is estimated that US$2.2 trillion investment is required to bring the infrastructure of the United States alone to a satisfactory standard, 1 and improved models of the existing structures would enable this work to be prioritised intelligently. The role of St-Id in decision-making can be seen as a reduction in the uncertainty premium; better understanding of the performance of constructed systems gives better estimates of vulnerability, and hence makes reduction in the uncertainty premium (safety factor) possible. It should be noted, however, that it does not reduce uncertainty related to loading, for example, wind pressure and earth movement. 24
Once a model has been developed, load monitoring via strain, traffic or wind measurements can be used to assess whether the structure is operating within its safe envelope and whether it is likely to develop fatigue damage. Strain gauges of different types are commonly used and there has also been rapid development of fibre Bragg and Brillouin scattering-based strain measurement methods for SHM.25,26 Such systems are now readily available, for example, Micron Optics, 27 Luna, Inc., 28 Smart Fibres 29 and Smartec 30 and they provide a practical means of load monitoring. In addition to civil engineering applications, load monitoring is routinely used on highly loaded airframes, particularly on military aircraft 31 and can be regarded as a form of SHM.
Although St-Id has attracted the attention of numerous researchers worldwide over several decades, it has not been widely adopted in civil engineering practice, simple models and prescriptive codes generally being used. 32 However, these approaches cannot accurately simulate the actual performance of constructed systems, which in turn necessitates considerable conservatism in the design process. Despite this obvious motivation, potential end users in the public and private sectors remain sceptical about St-Id as they have yet to see compelling evidence that these systems can deliver as promised and improve their ability to design, maintain or manage civil infrastructure. This has been compounded by incidents when St-Id was applied incorrectly and failed to yield useful condition assessments; 23 this highlights the need for well-trained engineers to operate the systems. 24 This experience is strikingly similar to issues with false calls 30–40 years ago in machine condition monitoring that have now largely been overcome.
Other whole-structure civil engineering deployments
While Western nations have been slow to adopt the technology, there has been a surge of activity in Asia. Mao 33 has identified 31 bridges in China that have been instrumented since 2008 with an average of ∼250 sensors per bridge. It is striking that in all cases, multiple measurements are used, usually including vibration via accelerometers, temperature, strain and corrosion sensors; however, the purpose of the monitoring and the rationale behind the choice of measurement type and location is not always clear. Several standards have also been produced, for example, CECS 333:2012 34 and GB 50982:2014. 35 The standard CECS 333:2012 34 produced by the China Project Construction Association deals with the following:
Sensor selection and placement
Data acquisition, cleansing, normalisation and pre-processing
Data transmission
Damage identification and safety evaluation
Modal parameter identification Damage identification via static parameters such as stiffness, deformation, strain and Young’s modulus; dynamic parameters such as mode shapes and frequencies, modal assurance criterion (MAC); model prediction error Safety assessment, though little detail is given on this
Database management
The standard does not appear to discuss the purpose of the monitoring system (whether, for example, local damage detection, St-Id or load assessment) and this is a vital part of system design, as discussed in section ‘SHM system design, performance assessment and validation’; it appears that instrumentation is mandated without a requirement to interpret the measurements and act on the findings. As indicated above, local damage would have to be very severe before it is reliably detectable from a modest number of vibration measurements; however, such measurements, coupled with loading data, can give valuable information on the performance of the structure. Professor Zhu Mao of University of Massachusetts Lowell who prepared the presentation on work in China 33 says that in practice, local damage is either monitored via visual inspection or with a local monitoring method at location(s) identified by visual inspection; this is discussed further in section ‘Dealing with data’.
The Chinese national standard GB 50982:2014 35 clarifies the aims of monitoring as being to
Provide validation of the assumptions during the design phase
Guarantee the quality of construction
Provide information to enhance maintenance
Provide data to assess the structure after hazards
Foster new technologies
It partitions SHM into monitoring during construction and during operation. In construction, monitoring is often done via frequent inspection rather than permanently installed systems and requires measurement of strain, deformation (including foundation settlement and horizontal/vertical deformation), cracking and environment (including wind and wind-induced response, temperature, moisture and ambient ground motion). Operation monitoring is done via permanently installed online systems and covers the same quantities plus earthquake, traffic loading, cable forces, scouring and corrosion. For high-rise structures, monitoring during construction is mandatory for buildings taller than 250 m, and monitoring during operation is mandatory for buildings taller than 350 m. For large-span structures, monitoring during construction/operation is mandatory for structures with a single span larger than ∼100 m.
There is also significant activity in Japan, Korea36,37 and elsewhere in Asia, 38 the initial focus being on load and environment monitoring rather than Structural-Identification. In the United Kingdom, the Cambridge Centre for Smart Infrastructure and Construction (CSIC) 39 has been very active, particularly on transport systems with a great deal of work on monitoring of tunnels, photogrammetry being an interesting method for monitoring movement. 40
Monitoring for localised damage
Requirements
In many industries, failure is likely to initiate at a relatively small defect. For example, in aircraft, pressure vessels and pipeline welds, critical crack sizes can be a few mm; in the oil and gas industry, the concern is often loss of primary containment (LOPC) due to corrosion and the full-wall thickness can be lost when the area covered by the corrosion is a few plate/pipe thicknesses in diameter. In these cases, the sensitivity of the vibration methods discussed above is unlikely to be adequate and this may also be true of many civil engineering applications where it is necessary to detect, for example, rebar corrosion.
SAE International 41 has produced a standard for the implementation of SHM on fixed wing aircraft and the basic concepts are also applicable to other structures. The first step is the identification of the principal structural elements (PSE) that are considered essential in maintaining the overall integrity of the structure. More than 200 PSEs are usually identified on a commercial aircraft, and obviously, this may be very different for other types of structure. It is then necessary to consider how to assess the extent of any damage in terms of
Its detectability with the possible inspection/monitoring techniques;
Its extent (e.g. crack size);
Residual strength of the element;
Likely damage-extension rate.
The use of SHM technology is particularly attractive in areas where access for conventional NDT inspection is difficult. The standard identifies two types of technology:
Damage detection/monitoring systems– SHM technology that uses sensors to directly monitor a structure for deterioration conditions.
Operation monitoring systems– SHM technology that uses sensors which do not directly check the structure for damage, but instead correlate various measurements (e.g. environmental conditions and loads) to make an inference on the probability or likelihood of damage.
The standard makes clear that it is critical to distinguish between global and local SHM systems; a local SHM system implies that the flaw (structural state) can only be detected at the spot of the sensor application but the system cannot offer any statement about the structural state of the sensor surroundings. Global SHM systems are defined as monitoring systems covering an area much greater than the dimension of the applied sensors, often using a spatially distributed sensor network. (In this article, global is used to describe systems that cover the whole structure, as in section ‘Global monitoring of whole structures’; the large area systems discussed in section ‘Large area monitoring’ correspond to the ‘global’ systems of the standard.) For each specific application, the probability of detection (POD) should be established for an SHM system with respect to flaw size, and the minimum flaw size that can be detected repeatably and reliably should be established. 42 The standard also stresses that environmental and operational conditions should be incorporated in the analysis.
Large area monitoring
Unless the probable damage locations are precisely defined and identified in advance, or the degradation will affect a large area so a few sample points are sufficient to give a reliable estimate of its severity, then successful SHM requires an area monitoring capability; it is unlikely to be practical to cover the structure with point sensors so a method that gives significant area coverage per sensor is needed. Visual and thermal imaging give efficient area coverage and can detect localised defects, though in the case of visual imaging they have to be surface breaking and the sensitivity of thermal imaging is also better for near-surface defects; defects generally have to be very severe before they will be found reliably by passive imaging, so other methods are generally needed. As described above, vibration monitoring is generally insufficiently sensitive for the detection of localised damage, so the two remaining techniques in the large area monitoring for localised damage category are guided wave monitoring and AE.
Guided wave monitoring
Structural vibration modes are formed by travelling guided wave modes interacting with the boundaries of the structure to form standing waves. In most cases, the modes of interest are flexural modes formed by the travelling flexural (A0) mode reflecting from the edges of the structure. One of the difficulties with the use of structural resonance frequencies for local damage detection is that the resonance frequencies are greatly affected by changes in the edge (boundary) conditions. Guided wave inspection uses essentially similar waves but at somewhat higher frequency and hence shorter wavelength. This enables reflections from defects and other features to be captured before they have interacted with the boundaries and so removes the problem of changing boundary conditions affecting the result.
There is a vast literature on guided wave inspection and monitoring with over 2000 papers published in the last 10 years (Scopus search on ‘guided wave inspection/testing/SHM’ from 2008 to 2017 conducted in April 2017). There are many guided wave modes that can propagate in a given structure and the key to successful applications is to manage this complexity, typically by exciting only one mode in a controlled direction. 43 Guided wave inspection has found most application in essentially one-dimensional structures such as pipes and rail. 44 It has been particularly commercially successful on pipes in the oil and gas industry, usually using a torsional wave at low ultrasonic frequencies (<100 kHz) which travels along the axis of the pipe using the walls as a waveguide. The wave has full volumetric coverage and very low attenuation in steel, making it especially suited for long-range screening applications; a single-sensor system can routinely inspect more than 50 m of pipe from a single location. 45 This coverage comes at the cost of lower sensitivity, with commercial guided wave systems typically sensitive to changes in cross section of around 5% and above in a single inspection. 46 This type of sensor is therefore usually used in conjunction with another localised, high-accuracy technique such as ultrasonic thickness gauging 47 to do follow-up inspections of the areas the guided wave sensor has identified as suspect.
There are several commercial guided wave systems for pipework and in all cases, these systems use an array of sensors attached to the outside of the pipe.48–50 These sensors operate in pulse-echo mode, exciting a controlled wave which travels through the structure. When this wave reaches a change in the impedance of the structure, caused by a change in the cross section for example, some of the wave will be reflected back and received by the sensor. A trained operator can then assess the shape, amplitude and mode of these reflections to infer the nature of the feature which caused the reflection. Damage such as corrosion will produce a reflection,51,52 as will benign pipe features such as welds and supports. 53 There can also be signal components due to the excitation and reception of unwanted modes and imperfect direction control. 43 These additional components introduce a background noise which sets the sensitivity of the technique – typically defects must produce a reflection twice as large as the background noise in order to be detected reliably. These unwanted signals are deterministic and cannot be removed through averaging; for this reason, they are often known as coherent noise. 43 Standards exist to guide the collection and interpretation of guided wave data, 54 limiting the impact of coherent noise as far as possible.
In most current commercial applications, guided wave sensors are used in an inspection configuration; a sensor is attached to a section of pipe, an inspection is made and then the sensor is moved to another location. However, it is becoming more common to permanently attach the sensor to the pipe and operate the sensor in a monitoring configuration. 46 This trend is partly motivated by high access costs; pipelines are often buried underground or at elevation, requiring costly digging or scaffolding equipment for access. In many cases, access to the pipe will also have health and safety implications. If the sensor is permanently installed, these access costs need only to be incurred once and an umbilical cord can be run to a safer, more convenient location. 46 The other driver for permanent installation is the potential for improvements in defect detection and classification. Because the sensor is attached to the pipe in a permanent installation, it is possible to obtain highly repeatable readings of the same section of pipe. If an initial inspection of the pipe is made when it is in a known structural condition, this information can be used to subtract out coherent noise from later measurements. This is the principle of baseline subtraction where the early measurement, the baseline, is subtracted from the current measurement. 55
This technique is effective only if the change between baseline and reading is due to a change in the condition of the structure. If there is also a change in the environmental conditions surrounding the pipe, this will introduce additional changes which are difficult to distinguish from those caused by structural change. This can partly be dealt with by collecting a large number of baselines under different environmental conditions and selecting the optimal baseline to compare to a reading. 56 However, in an industrial setting, it is often not possible to collect multiple signals under prescribed environmental and structural conditions. In response to this limitation, the baseline stretch technique was developed, which seeks to compensate for signal changes due to temperature, the most significant environmental change for guided wave signals. 57 When the temperature of a pipe changes, the dimensions of the structure change, as does the propagation velocity of the inspection wave. 57 This causes changes in the arrival time of reflections and leads to imperfect cancellation during subtraction. Baseline stretch attempts to compensate for this change through compression or dilation of the signal and can be applied globally or to windowed portions of the signal.56,58 However, the stretch process does not perfectly compensate for temperature and its performance deteriorates as the temperature difference between the baseline and current readings increases; it also ignores the influence of other environmental effects, which have been found to be significant in guided wave systems. 59
Most current applications of permanently installed guided wave pipe monitoring systems require instrumentation to be brought to site and be plugged into a connector at the end of the umbilical cord connected to the sensor. This means that the major advantage is the saving of repeat access costs; some improvement in sensitivity can be obtained via baseline subtraction but the likely frequency of readings means that environmental conditions are often not sufficiently similar for temperature compensation and baseline subtraction to be reliable. However, the position is transformed if the measurement instrumentation, as well as the transducer hardware, is permanently installed, enabling frequent (e.g. daily) readings. A recent blind trial 60 using an independent component analysis (ICA) processing scheme61,62 showed a factor of five improvement in sensitivity over one-off testing to typically ∼1% cross section area loss, with no false calls. The reducing cost of electronics and low-power wireless communications makes this route increasingly attractive. Permanently installed guided wave monitoring with attached electronics is currently being used to monitor potential cracking in the boiler spines at four UK nuclear power plants 63 and is also installed to monitor rail breaks on a heavy haul freight railway in South Africa. 64
The successful applications above are on essentially one-dimensional structures that are mostly relatively simple, that is, they have a small number of features per unit length. This means that there is no attenuation due to beam spreading, the attenuation due to scattering from features is modest and the received signals usually have clear reflections from features such as welds that do not overlap which greatly simplifies interpretation. There has also been a great deal of interest in applications to two-dimensional (2D) structures such as airframes. Here, there are multiple reflections from the relatively closely spaced ribs and stiffeners that greatly complicate the received signals and reduce the feasible test range; Dalton et al. 65 showed that testing over distances greater than 1 m was unlikely to be feasible at the >100 kHz frequencies required for adequate spatial resolution in these structures. Many schemes have been proposed for imaging damage growth using measurements from sparse sensor arrays, for example, Croxford et al., 55 Lu and Michaels, 56 Clarke et al., 58 Hall et al. 66 and Haynes and Todd 67 but they have not been applied in commercial settings.
Chang at Stanford and an associated spinout company 68 have pioneered a sparse array of piezoelectric sensors mounted on a flexible printed circuit board to form a ‘smart layer’ that can either be embedded in composite materials or surface mounted on any structure.69,70 This is connected to instrumentation that can transmit the data either wirelessly or via wired connections to an analysis centre where bespoke software assesses whether any damage is present and its severity. It was originally developed for aerospace applications but multiple potential applications have been proposed. 68 However, these are mainly at the trial rather than routine industrial deployment stage.
If a dispersive mode is used, it is possible to use transit time measurements to obtain the average wall thickness over a known propagation path; 71 such a system has been developed and is deployed mainly in the oil and gas industry, monitoring the average wall thickness over a range of up to ∼1 m. 72
AE
AE testing involves detecting the stress waves emitted by defects as they grow. These stress waves typically propagate as guided waves, so it has some connection to guided wave testing. The stress waves are typically very broadband and low amplitude, so sensitive transducers and low noise instrumentation are required. Resonant piezoelectric transducers bonded to the structure are often used to give the required sensitivity, so the output signal is very narrow band. If long propagation distances in complex structures such as airframes are required, it is advantageous to operate in the 50–100 kHz region where in thin plate-like structures, the energy is carried mainly in the extensional (S0) and flexural (A0) modes; these will propagate across complex geometries. 73 AE has a number of key characteristics that differentiate it from other inspection and monitoring methods: 4
The source of the ultrasonic waves is internal, originating in the defect itself, unlike techniques which use an external source, for example, conventional ultrasonics or the guided wave testing discussed in section ‘Guided wave monitoring’; it is therefore a passive technique.
Many important AE events are irreversible and intermittent. Monitoring must therefore be continuous, unlike guided wave inspection that can be conducted at chosen intervals; this can have implications for battery life in permanently installed systems at difficult-to-access locations.
Most AE events occur randomly in time and are also transient and broadband. Thus, many routine methods for noise reduction, such as signal averaging in the time domain, cannot be applied to improve sensitivity. There is, however, scope for spatial filtering, based on location, and pattern recognition techniques during prolonged monitoring.
AE only detects defects that are actively growing under stress; it can also be used to detect static defects under cyclic loading if their faces undergo fretting. This makes it well suited to continuous SHM both in service and, particularly, in proof tests.
Unfortunately, AE may also be sensitive to various spurious noise sources such as frictional noise from fasteners, so producing false calls, 74 although these can sometimes be discriminated against.
AE can be sensitive to minute increments in crack length (order of 1 pm) in brittle materials, but insensitive to much larger crack advances in ductile materials where crack velocities are orders of magnitude smaller.
These issues mean that AE has to be applied with care; it was grossly oversold in the 1960s and 1970s, but it now has a number of successful, well-developed applications.75–77 Detection of cable breaks in suspension bridges 78 is a very attractive application since the cables are high tensile steel and so relatively brittle, there are many cables in a bundle so multiple breaks are allowable before action needs to be taken, and the wave propagation is along the bundle and so is essentially one-dimensional, giving good propagation range. Monitoring of corrosion in oil storage tanks has also been very successful. 79 Here, transducers are mounted on the tank walls and fracturing of corrosion product on the tank floor generates stress waves that propagate to the transducers. The objective is to sort tanks into levels of corrosion activity so that full inspection involving draining and cleaning the tank, followed by a full NDT survey, can be intelligently targeted.
Local monitoring
If the probable position of a defect is precisely known, or if degradation is expected to be relatively uniform so a small number of sample points are sufficient to assess the overall structural integrity then local, essentially point monitoring, techniques are attractive. In principle, it is possible to convert a range of ultrasonic and electromagnetic NDT methods to SHM by fixing them permanently to the structure and attaching the instrumentation required for the test, together with communications hardware. However, routine NDT is usually applied at shutdowns under ambient conditions, whereas a permanently installed system has to survive the operational environment. In many cases, this poses little difficulty, but sometimes high temperatures or high radiation must be considered. Many plants also require any permanently installed monitoring system to be intrinsically safe to ensure that it does not generate an explosion risk.
An intrinsically safe, permanently installed thickness monitoring system capable of operating at up to 600°C has been developed 80 and has been very successful with over 14,000 installations at ∼150 sites worldwide, mainly in the oil and gas industry; 81 these have generated over 14-m-thickness readings transmitted via a wireless mesh system. An alternative electromagnetic acoustic transducer (EMAT) that operates at lower temperatures is easier to install and will take measurements through coatings such as fusion bonded epoxy paint has also been developed. 82 Systems involving bonded transducers are also available: Sensor Networks Corp 83 and Cosasco. 84
Permanently installed ultrasonic systems for monitoring the growth of known cracks are available,85,86 as are permanently installed variants of potential drop crack monitors 87 and comparative vacuum crack gauges. 74
While the Chinese standards for large civil engineering structures34,35 call for local monitoring for potential cracking, in practice, this is often achieved by periodic inspection rather than via an automated, permanently installed system. This is probably because it would be too costly to instrument all the required locations, so periodic NDT is more cost-effective. Professor Zhu Mao says that the potential locations of cracks or bolt loosening are suggested by visual inspection or structural analysis (yielding critical locations).
Dealing with data
In most conventional inspection, the data interpretation is done directly by the trained technician operator so those responsible for the integrity management of the structure are only alerted when there is an abnormality. In contrast, SHM data are generated automatically; it is typically much more frequent than NDT inspections (e.g. daily rather than annual) and is transmitted directly to the structure operator. As the number of monitoring locations on a structure or plant increases, this data stream can become unmanageable unless some automatic pre-processing is applied. When the thickness monitoring system80,81 was first deployed at 100s of locations on a plant, operators described the experience of frequent, multi-point data as being like ‘drinking from a hosepipe’. Professor Zhu Mao cites the design lead of a major Asian bridge saying that they do not know exactly what information to keep, neither do they know what intelligent feature(s) to extract, so they measure and save everything they can over many channels with perhaps unnecessarily high sampling rates. This results in terabytes of data every day, and several rooms filled with hard drives for historical data storage. Goulet and Smith 88 note that with increasing availability of communication systems and decreasing cost of sensors, more and more structures are being measured, but our capacity to analyse large amount of data is only marginally increasing.
In a report to the Scottish Parliament investigating whether an SHM system could have detected a problem early enough to prevent the need to close the Forth Road Bridge for urgent repairs, an expert witness, Richard Fish, is quoted ‘The big issue with what is got out of structural health monitoring concerns the translation from data to information. People can get bombarded with millions and millions of bits of data, but they have to be interpreted’. 89
The CSIC 90 stresses the importance of data handling and interpretation and presents a pyramid model, a simplified version of which is shown in Figure 2. Here, data are processed to a digestible form before being passed to the decision-making level that can be more or less automated.
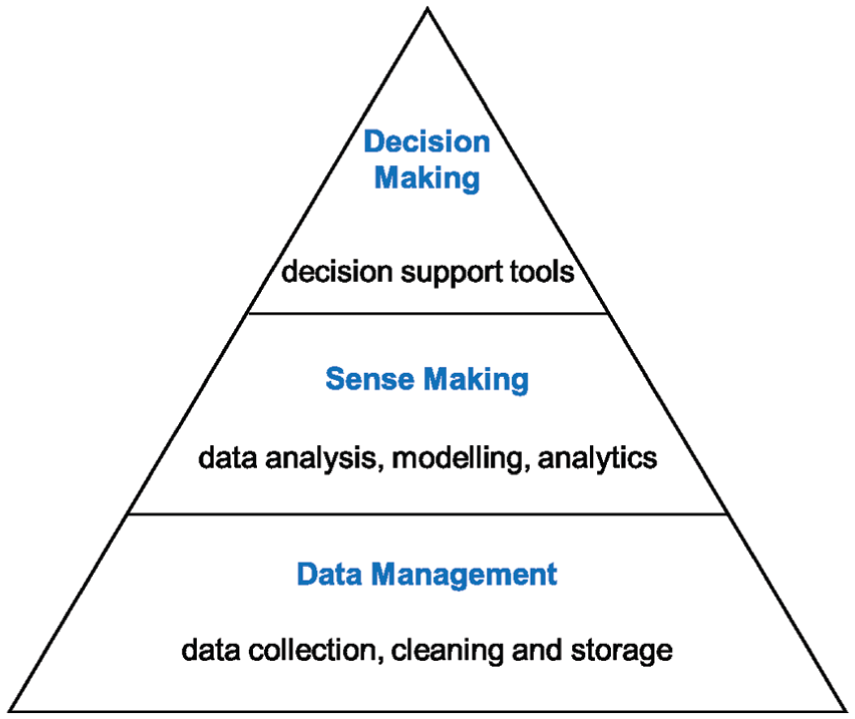
Pyramid model of decreasing data volume and increasing data value (after Cambridge Centre for Smart Infrastructure and Construction (CSIC) 90 ).
This issue was also recognised in the early years of machine condition monitoring.5,91 An article in Aviation Maintenance 8 notes that without trend monitoring, many internal engine problems will not manifest themselves until a turbine blade is shed through the shroud or the engine shuts down. Operators could obtain trend monitoring data through the engine control unit (ECU) data, or by observing temperature and pressure gauges in the cockpit and manually recording the data during each flight. However, to obtain a trend, the operator would need to collect the data from a number of flights, plot the data in a spreadsheet and then analyse it. The amount of work involved with trending a fleet, coupled with the potential for saving substantial sums by catching small failures before they become inflight engine shutdowns, has led to a growth in the number of third-party trend monitoring programmes. Farrar and Worden 13 point out that the success of machine condition monitoring is due in part to
Minimal operational and environmental variability associated with this type of monitoring;
Well-defined damage types that occur at known locations;
Large databases on similar machines that include data from damaged systems;
Well-established correlation between damage and features extracted from the measured data;
Clear and quantifiable economic benefits that this technology can provide.
These factors have allowed condition monitoring to make the transition from a research topic to industry practice several decades ago, resulting in comprehensive, automated condition management systems that handle the huge data flows efficiently.
It seems likely that as the number of SHM systems deployed increases, there will be more interest from third parties in developing the required analysis and decision-making tools. There will probably be a gradually increasing degree of automation; when only a small number of sensors are deployed, it is feasible for an operator to look at the output from each, while as the number increases, displays highlighting those with anomalous signals are useful so that these can be followed up. When a very large number are deployed, automatic decision-making may become feasible, underpinned by validation on the large volume of historic data available from many sites.
Rytter 92 identifies four levels of sophistication in SHM information: existence, location and severity of damage, followed by prognostics – assessment of whether the structure is still fit for service and what its remnant life is. Identification of the type of damage should be added to the second level since severity estimation requires the type of defect to be known. Ultimately, it may be possible to do automatic diagnosis and prognostics, but this requires a very large installed base so that the software can be tested very thoroughly to ensure reliability.
Business case for monitoring
One reason for the slow take-up of SHM technology is lack of attention to the business case for monitoring. Even in the well-established machine condition monitoring field, Mitchell 5 notes that, despite over 50 years of demonstrated success and benefits, condition assessment programmes are still not fully accepted within an industrial operating culture as a permanent, essential business activity. Many successful programmes are reduced or terminated altogether as a ‘cost saving’ measure because there are few failures. He suggests that for many technical specialists, analysis and details such as determining that a bearing is failing due to a defect on the outer race are of far greater interest than demonstrating the business value they contribute to their companies. He concludes that ‘the key to success is not technology but awareness of value, resources and time’. The value identified should also include avoidance of the costs of consequential damage following catastrophic failure. 8 However, machine condition monitoring is increasingly accepted, partly driven by the possibility of online data gathering and central processing (see, for example, Solar Turbines 93 ).
If SHM is to be more widely applied, it is similarly crucial to be clear about the business case for employing the new technology. Both NDT and SHM always compete with a planned replacement strategy, and sophisticated methods compete with, for example, complete strip-down and visual inspection; the added information from SHM must be sufficiently valuable to be worth the cost. SHM will never totally remove the need for intervention, but should enable it to be better targeted and less frequent. It may also be most cost effective to mix SHM and traditional inspection. For example, Professor Zhu Mao says that the bridge monitoring strategy in China can involve a permanently installed approach for global parameters or large changes due to, for example, scour at a pier, and periodic visual inspection for local defects since the number of sensors required to monitor all the critical areas for local defects would be uneconomic. The SAE standard 41 lists the main economic motivations for the use of SHM systems as to
Reduce inspection time and cost;
Improve repair planning;
Increase, optimise or customise inspection intervals;
Extend the economic life of the structure;
Enable new design principles and maintenance concepts.
Another significant motivation is that monitoring may reduce the probability of catastrophic failure and consequent litigation/liability issues, and may also help to satisfy regulators. For example, the boiler spine monitoring 63 was introduced following the detection of a large, unexpected defect on a routine inspection and helped to satisfy the regulator. The rail break detection system 64 was developed in response to past failures and concern that future incidents would lead to very severe consequences for the operators. However, even in these cases, SHM must still compete with periodic, possibly very frequent, NDT inspection or planned replacement. It is therefore important that the costs of an SHM system are properly accounted for; it is easy to concentrate on the initial capital cost, but the system will need maintenance (e.g. battery replacement) and may have a limited life. As discussed above, it is also vital to include the recurrent cost of dealing with the data.
Therefore, for a mature SHM system, cost–benefit analysis would be required to justify replacing conventional NDT tasks with advanced SHM tasks. The cost–benefit analysis should highlight the hidden costs of NDT and quantify the savings of SHM. 41 Hidden costs include access costs that are very high when NDT personnel need to enter a hazardous or inaccessible area. For example, in 2006, Boeing indicated that for a typical fleet of aircraft, 70% of all structural maintenance expenses are incurred inspecting airframes during periodic maintenance tasks; the majority of the inspection expenses are associated with effort spent to access the inspection areas. In 2004, Boeing calculated that for a 747–400 commercial aircraft, 25,000 h are spent inspecting for corrosion, but over 21,000 of these hours are spent gaining access to hard-to-inspect areas, and only 4000 h are spent doing the actual inspection. Because of the initial costs required to develop, produce and install the SHM systems in each aircraft, conclusive evidence confirming the SHM functionality would be required to encourage the procurement of an SHM system. The conclusive evidence would be, for example, structural fault detection capabilities observed during the operation of the aircraft. The occurrences of structural faults such as cracks are infrequent, and hence, years of flight tests might be required to collect validation evidence; small number of flights would only be sufficient to prove the system ‘fitness for flight’ and would be insufficient to prove ‘fitness for purpose’. As a result, SHM systems are yet to be applied routinely on civil aircraft, though the manufacturers continue to invest in development and have ambitious future plans. 94
Aktan and Brownjohn 24 note that it is important that the owner/operator is convinced of the value of SHM (St-Id) in decision-making and that the technical team is competent and experienced; if these requirements are not met, it is best not to expect much from it. They suggest that SHM (St-Id) adds most value:
When a structure is operating outside the normal bounds of applicability of codes;
When an existing structure whose operation is vital exhibits concerns, such as excessive vibrations, cracks and spalls;
In the case of constructed systems that may be managed as a fleet, for example, simple highway overpasses designed and constructed with highly similar materials where St-Id of a select sample may help to manage a much larger population more effectively.
Similarly, the CSIC stresses the importance of setting out the business case for digital investment in infrastructure, noting that it is a hard fight to get backing to switch cash from capital projects to invest in digital tools for existing infrastructure. They suggest that shared case studies backed by strong financial data setting out the benefits of a whole-life approach in terms of longer lifespan and greater utilisation of existing infrastructure are required. 90
The benefits identified for SHM tend to concentrate on cost reduction via, for example, only incurring access costs once for the installation of the system, rather than repeatedly for periodic inspection. Randall 3 also points out that maintenance is often regarded as a cost centre, but that condition-based maintenance via machine condition monitoring can convert it to a profit centre; this idea has been promoted by Al-Najjar and Alsyouf. 95 Similarly, permanently installed corrosion monitoring giving sufficiently frequent readings to enable rapid estimation of corrosion rate enables the effect of changing feedstock on the plant to be evaluated. This makes it possible to use cheaper, higher total acid number (TAN) crude oil while still being confident that the corrosion rate is within safe limits. 81 Monitoring therefore enhances the profitability of the plant while giving the operators and regulators confidence that the more corrosive feedstock will not lead to a catastrophic failure. Similarly, increased availability of plant is a significant benefit in helicopter operations. 96
SHM system design, performance assessment and validation
In formulating an NDT procedure for the inspection of a critical structure, it is routine to specify a required POD for a critical defect size and this must be demonstrated (see, for example, Department of Defense). 42 Goulet and Smith 88 identify the importance of understanding the potential effectiveness of an SHM system and the SAE standard 41 stresses that environmental and operational conditions should be incorporated in the analysis of the system. However, the standard also recognises that POD methodologies developed for NDT may not always be directly applicable to SHM systems, so new approaches may be required.
When considering implementation of an SHM system rather than a traditional periodic inspection approach, it is vital to consider the design of the whole system not just, for example, the transduction. Todd and Flynn 97 propose a structured design approach for SHM systems, starting with key questions:
What are the failure modes the system is being designed to monitor, and, to whatever degree possible, what are their expected probabilities of occurrence? This is vital as it is imperative that the system detects all critical forms of damage but also that it is not overdesigned and so unnecessarily expensive. An idea of the probability of occurrence is important as it will be an important factor in determining an acceptable false call rate – if damage is very unlikely to occur then a very low false call rate will be required in order to ensure that there is a reasonable probability that a positive damage call correctly indicates that damage is present.
What specific actions will the SHM system direct in response to the failure mode(s)? This forces consideration of the decision-making process and who will be authorising actions, for example, mandating closure of a bridge.
What are the costs associated with the actions/decisions that the SHM system takes/makes and with the deployment and operation of the SHM system itself? This highlights the need to identify the capital and revenue costs both of the SHM system itself and of the decision-making process. It is particularly important to understand the implications of false alarms, for example, the cost of responding to an indication at an inaccessible location in a nuclear reactor will be extremely high so a key design criterion will be a very low false alarm rate.
What are the constraints present in the design space? for example, temperature range and intrinsic safety requirement.
Todd and Flynn 97 then go on to use a Bayesian approach to the design of the system, further details on an optimal sensor placement study being given by Todd and colleagues.98,99
Farrar and Doebling 14 note that the ability to discriminate changes in the modal properties as a result of damage from those due to variations resulting from changing environmental conditions and from the repeatability of the tests has received very little attention; they point out that a high level of uncertainty in the measurements will prevent the detection of low levels of damage. Peeters and De Roeck 21 present one of the very few modal-based damage detection studies to report statistical variations associated with the measured modal parameters, and there are even fewer reports of false positive studies. Additionally, research should be focused more on testing of real structures in their operating environment such as that done in Doebling et al., 100 rather than laboratory tests of representative structures; 14 attention to these issues is crucial if SHM is to avoid the false call problems that plagued some early implementations of machine condition monitoring.
Farrar and Worden2,13 view SHM in a statistical pattern recognition or machine learning paradigm, and Stull et al. 101 discuss how the robustness of an SHM method might be assessed. They identify the receiver operating characteristic (ROC) curve as a particularly valuable metric as it plots the POD against the probability of false alarm (PFA). Unfortunately, producing the ROC curve for an SHM system is even more difficult than for an NDT inspection as the effect of environmental variations and potential transducer/instrumentation drift over a long period, as well as the changes due to damage of different types and severity at different locations must be evaluated. This would involve an impractical number of test structures in the operational environment and an extensive programme of damage introduction over a long period. Another approach is to simulate the received signal; modern computational resources mean that it is relatively straightforward to reliably predict the signature produced by damage in vibration, guided wave, ultrasonic or magnetic measurements, even when it has complex shape. However, reliable prediction of signal changes due to environmental and other variability is much more difficult, whereas obtaining experimental data with environmental variation on an undamaged structure is easy. Liu et al. 62 proposed a methodology of measuring data over multiple environmental cycles on an undamaged structure and synthetically adding damage to the resulting signals as shown schematically in Figure 3. This approach enables the addition of damage at different locations with different growth patterns, and the investigation of other practical parameters such as the extent of environmental changes, damage severity and frequency of readings. They illustrated the approach on the guided wave monitoring of a pipe system; measurements were taken on an undamaged pipe over multiple cycles of heating and cooling and the effect of damage was modelled using FE analysis, the damage signature being added to the real measurements on the undamaged structure. Figure 4 shows estimated damage growth and ROC curves for one particular case of damage growing from 0% to 1% cross section loss at a particular location over the course of 100 readings with a 10°C random temperature variation over the period of the measurements. The same data were processed using baseline subtraction (Figure 4(a) and (b)), singular value decomposition (Figure 4(c) and (d)) and ICA (Figure 4(e) and (f)). The results show that ICA provides a virtually perfect detector with almost unity POD even at very low PFA (note that the PFA is plotted on a log scale in Figure 4(f) and the corresponding graphs for the other processing methods); the estimated damage amplitude of Figure 4(e) also tracks the true amplitude very closely. Singular value decomposition also performs well, whereas baseline subtraction gives much poorer performance with the lower 95% confidence bound giving very low POD at a false call rate of over 1%. The framework has therefore enabled robust identification of the best data processing methodology and this has since been demonstrated in a blind trial. 60
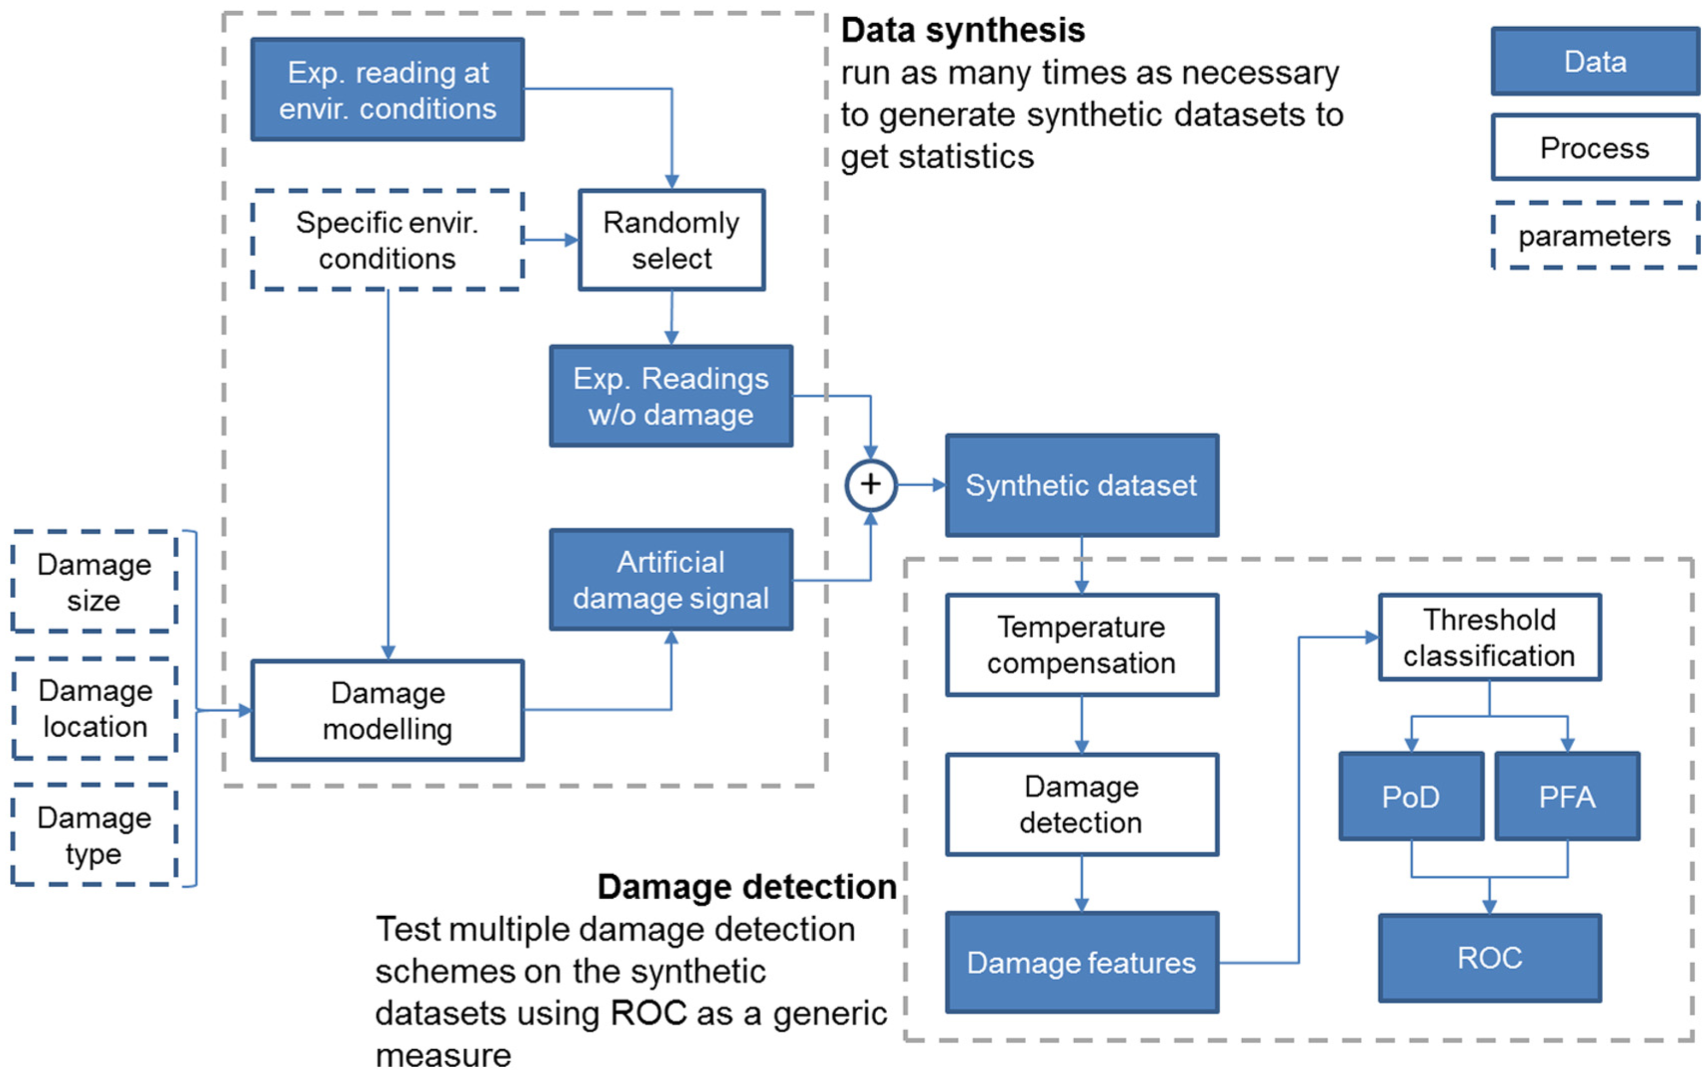
Schematic diagram of the SHM system evaluation framework proposed in Liu et al., 62 with dashed boxes indicating parameters, dark-shaded boxes indicating raw/processed data and white boxes indicating data operations. Synthetic datasets are generated using undamaged experimental signals and predicted damage signals. The ROC curve is then generated after damage detection is performed on the synthetic datasets.
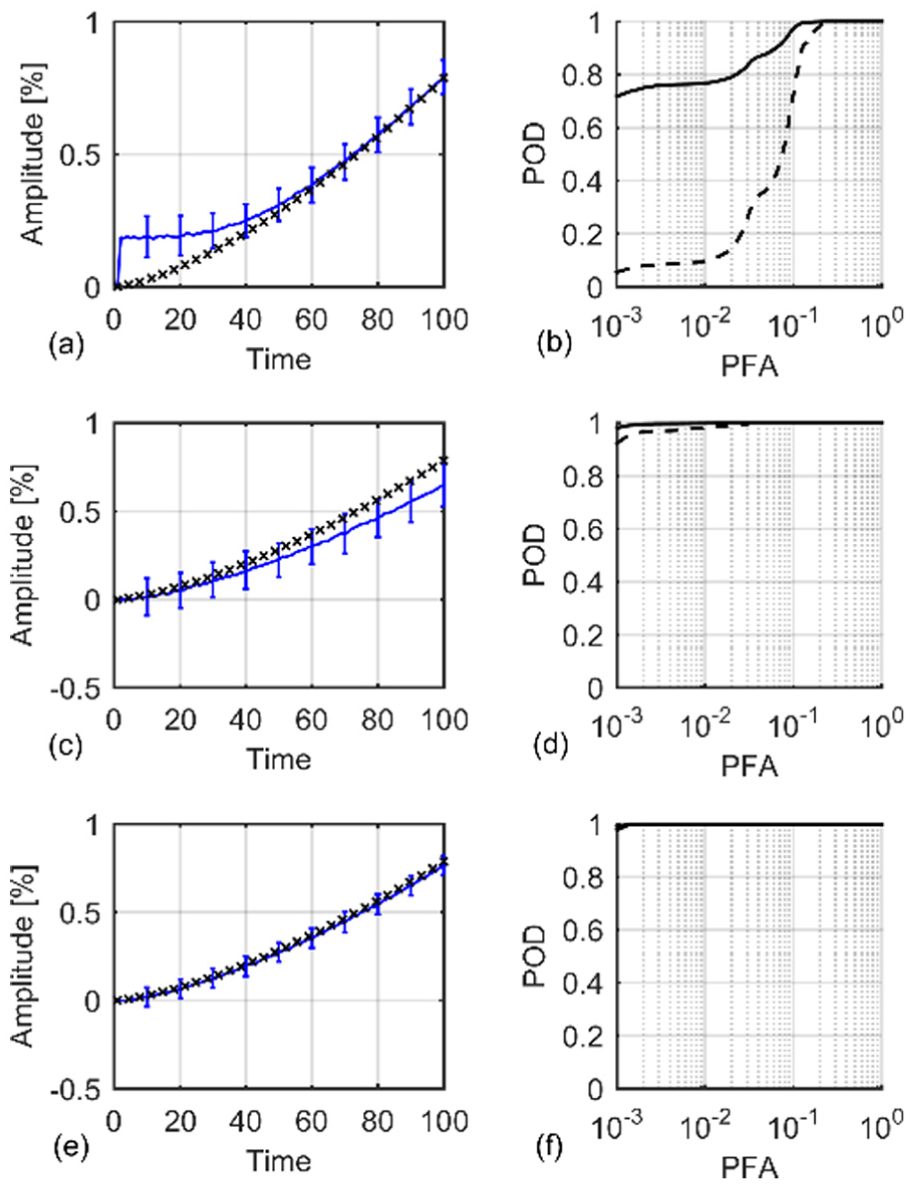
Results from guided wave monitoring of a pipe system. Case shown is for 100 readings taken while damage at a particular location grew to 1% cross section loss and the temperature varied randomly over a 10°C range. Data processed using (a, b) baseline subtraction algorithm; (c, d) singular value decomposition; and (e, f) independent component analysis. (a) Amplitudes of baseline-subtracted residual at damage location as a function of time (blue) and true damage reflection amplitude (black). Reflection amplitude is not a linear function of cross section loss so linear ramp cross section loss does not produce linear ramp of reflection amplitude; (c, e) weights from SVD and ICA (blue) over time, along with true damage amplitude (black). (b, d, f) Receiver operating characteristic (ROC) curves showing probability of detection (POD) versus probability of false alarm (PFA). Solid lines show mean ROC curve and dashed lines show lower 95% confidence bound (adapted from Liu et al. 62 )
The framework of Figure 3 can take data from any installed monitoring system to predict its damage detection performance. This makes it possible, for example, to assess whether a defect of a given size at a particular location would be detected reliably at a given data collection frequency. This enables the system to be tuned to meet particular requirements and it could be used in a safety case to provide assurance that had a defect of a given size and location been present, it would have been detected.
Conclusion
There are multiple reasons for the slow transfer of SHM research into routine industrial application; key areas that should be considered to improve the adoption rate are as follows.
Lessons from monitoring of rotating machines
Machine condition monitoring is now a mature technology and is sometimes regarded as SHM applied to rotating machinery. In this article, I have defined SHM more narrowly to mean the monitoring of non-rotating structures. On this definition, SHM is at a much earlier stage of development than machine condition monitoring, with a great deal of research but a relatively small number of routine industrial applications. The longer history of machine condition monitoring, the small number of sensors required for full coverage and the large installed base on similar machines facilitating fleet statistics are probably the main reasons for the much larger number of practical applications of machine condition monitoring compared to the rest of SHM.
Machine condition monitoring increasingly uses measurements of multiple parameters such as load, speed, vibration amplitude and debris level in lubricating oil to produce a condition assessment. It would potentially be fruitful to consider combining operating measurements such as load, pressure and temperature with SHM measurements such as vibration or ultrasonic response to provide better information on damage growth. The choice of process parameters to measure will be very dependent on the failure mechanism of concern with, for example, load cycles being important in fatigue, whereas environmental conditions such as moisture and salinity will be more important in corrosion.
SHM system design
One reason for the disappointing rate of transfer of research to industrial practice is that much research has been done on simple beam and plate structures in the laboratory, whereas many practical problems are only manifest on real, complex structures with typical field environmental variations. Considering an SHM deployment, it is essential to define
The structure to be monitored and the environmental conditions that the system must operate in;
The type and size of defects or other problems that the system needs to detect;
The a-priori probability of damage being present as this will be an important factor in determining an acceptable false call rate;
What is to be measured, how often, and whether data collection and transmission is to be automated;
How the resulting data will be analysed;
How the performance of the system will be predicted/validated, including consideration of both POD and false call rate;
What decisions are to be made from the results, and who will make them. It will be very important to ensure that appropriately trained staff are available and this may be a challenge since broad training is required to understand the multiple technical fields that must be integrated to form a complete SHM system;
The capital and operating costs of the system and the value it gives relative to alternative strategies such as planned replacement or periodic inspection.
The full SHM system, including data handling and decision-making, must therefore be designed carefully at the planning stage. It would be fruitful for the research community to acknowledge this and to consider practical use cases, rather than simply sensitivity to idealised defects on simple structures, often without consideration of false calls. Performance evaluation requires measurements on a real structure and a methodology has been presented that combines measurements on an undamaged structure with predictions of damage signatures. This enables multiple damage scenarios to be simulated without the need for an unrealistic number of test structures, and so greatly reduces the cost of performance validation.
Business case
SHM will tend to be attractive where access costs for periodic inspection are a large fraction of the overall inspection cost, and it is also important to consider whether frequent monitoring data adds further value by, for example, inputting to process control. The number of sensors required for reliable coverage will always be a key component of the business case for SHM so research aimed at increasing area coverage per sensor for a given sensitivity is very important; given the tendency for there to be a trade-off between area covered and sensitivity, it is important to consider the damage level that must be detected very carefully so that the system is not over-specified. It is also crucial to recognise that the detectability of damage is a function of the signal-to-noise ratio, that is, the ratio of the signal due to damage to that due to the variations seen on an undamaged structure. Methods giving a small change due to damage but that are insensitive to other effects may be preferable to methods that give a large change due to damage but are also sensitive to other effects, and so give a large spread of readings in the absence of damage.
Efficient, robust data handling to give reliable information in a digestible form to the structure operator is an essential component of SHM that is often neglected in research. Data handling can be a substantial component of the overall system cost and would benefit from more research attention; it may appear as operating expenditure rather than as part of the capital cost of the system and may not be properly accounted for at the planning stage.
SHM adoption path and research needs
SHM adoption will be a gradual process and it may be fruitful to consider what makes potential applications likely candidates for early adoption. Favourable cases include structures where 102
There is no enormously over-designed reliability built-in (like a bridge) where the economic case is likely to be weak;
Structural failure will have severe economic consequences, but is not likely to lead to loss of life;
Critical damage occurs on relatively short time scales so replacing the frequent inspections that would be necessary if standard NDE is used is attractive;
Current inspection methods are inadequate in some way, for example, access is difficult and so expensive and disruptive;
Regulations/standards govern (at least some aspects of) the process.
Many machinery condition monitoring applications have these characteristics. Given better focused research and development considering the key factors identified here, SHM has the potential to follow the path of machine condition monitoring. For example, it has been predicted that the use of non-intrusive monitoring systems will overtake the use of corrosion probes within 5 years 103 and aerospace companies have aggressive roadmaps for deployment of the technology. 94 Key areas for future research are as follows:
Methods to increase area coverage per sensor at the required sensitivity and low probability of false call;
Techniques for performance validation including both probability of defect detection and false call rate;
Development of use cases including both the technology and business case;
Efficient data handling to give operators information on which decisions should be taken, rather than raw data;
Fusion of data from multiple sources to provide better prognostic information.
Footnotes
Acknowledgements
The author gratefully acknowledges input from Professor Zhu Mao, University of Massachusetts, Lowell on bridge monitoring in China and very helpful comments from Dr Chuck Farrar, Los Alamos National Laboratory, Professsor James Brownjohn, University of Exeter, and Professor Mike Todd, UCSD. He also thanks Michael Leung of Imperial College for doing the finite element predictions of ![]() .
.
Declaration of conflicting interests
The author(s) declared no potential conflicts of interest with respect to the research, authorship and/or publication of this article.
Funding
The author(s) received no financial support for the research, authorship and/or publication of this article.