
Abstract
A common problem in aircraft maintenance is the development of fatigue cracks at fastener holes due to stress concentration. High-frequency guided ultrasonic waves allow for the structural health monitoring of critical areas of a structure and can be measured with high accuracy using a noncontact laser interferometer. The use of a specific type of high-frequency guided ultrasonic wave that has good sensitivity for the detection of small defects, excited using a standard Rayleigh wedge transducer and propagating along the structure, has been investigated. Fatigue crack growth at the side of a fastener hole in a tensile, aluminum specimen was induced by cyclic loading of the structure. The crack length was monitored optically and showed good correlation with fracture mechanics calculations of the expected growth rate. The changes in the guided wave signal due to the fatigue damage were monitored using a noncontact laser interferometer and quantified. The measurements show a good sensitivity for the early detection of fatigue damage and for the monitoring of fatigue crack growth at a fastener hole. The propagation and scattering of the high-frequency guided ultrasonic wave has been simulated numerically using a three-dimensional finite difference code. Good agreement was found between the measured and predicted changes of the ultrasonic signal for the increasing fatigue crack area, allowing in principle for the approximate sizing of the defect.
Keywords
Introduction
For aerospace structures, the development of fatigue cracks at fastener holes due to stress concentration presents a common maintenance problem, necessitating structural health monitoring. 1 The detection of fatigue cracks before they have reached a critical length is a safety requirement for aircraft, which have to be inspected regularly during their service life. 2 Ultrasonic bulk waves possess the necessary sensitivity for the detection and sizing of cracks, 3 and sensors can be integrated into the fasteners. 4 An ultrasonic-based structural health monitoring method has been developed for the real-time, in situ monitoring of fatigue cracks at fastener holes using an angle beam through transmission technique. 5 However, bulk wave ultrasonic testing necessitates local contact measurements on the damaged area of the inspected structure. 6 Guided ultrasonic waves allow for the monitoring of hard to inspect areas of large structures with limited access7,8 and have been successfully employed to monitor fatigue crack growth.1,9 The potential for noncontact measurement of the guided waves using a laser vibrometer has been demonstrated for fatigue crack detection in metallic structures.10,11 Both the excitation and measurement of guided ultrasonic waves can be performed using noncontact laser technology. 12 However, the wavelength of the employed guided waves is usually significantly larger than in bulk wave ultrasonic testing, thus limiting the sensitivity for the detection of small defects. 13 Surface acoustic waves have been used for enhanced fatigue crack monitoring. 14 Guided ultrasonic waves in the higher frequency-thickness range have been investigated for defect detection over medium long distances,15,16 allowing good sensitivity for the detection and localization of small surface defects.17,18
In this contribution, fatigue crack growth monitoring has been performed using noncontact laser interferometry of high-frequency guided waves. Full three-dimensional finite difference (FD) simulations of the scattering of the high-frequency guided wave modes had shown that the scattering at the crack leads to an amplitude reduction in the area behind the crack. 19 The laser measurement was thus performed with high precision in the shadow area behind the expected fatigue crack location. The changes in the signal resulting from the fatigue crack growth were quantified on the basis of the variation of the energy of the high-frequency guided ultrasonic wave pulse.
High-frequency guided ultrasonic wave propagation
Working in the frequency region where its wavelength is approximately half of the plate thickness (around 6.75 MHz mm in aluminum), the first anti-symmetric and symmetric Lamb modes A0 and S0 have mode shapes with stress and displacement fields similar to a Rayleigh wave on each plate surface. As the first anti-symmetric and symmetric Lamb modes propagate with slightly different phase velocities (0.5% at 6.75 MHz mm), they continually shift in relative phase during propagation, causing the transfer of the energy between plate sides over a distance called the beatlength 20 or beating wavelength. 21 The beatlength L is calculated as

where kA0 and kS0 are the wave numbers of the first anti-symmetric and symmetric Lamb modes. The beat length depends on the difference between the wave numbers kA0 and kS0 in the denominator term. With increasing frequency, the difference between wave numbers decreases, and thus, the beatlength increases. For large frequency-thickness products, the wave numbers of A0 and S0 converge to the wave number of a Rayleigh wave, and the beatlength tends toward infinity, corresponding to the propagation of a Rayleigh wave at the surface of a semi-infinite medium. The Rayleigh-like anti-symmetric and symmetric Lamb modes A0 and S0 are easily generated selectively above the cutoff frequencies of the higher Lamb wave modes using standard Rayleigh wave angle beam transducers. 17 The associated beating phenomenon can be used for the detection of small cracks on both plate sides or, selecting appropriate excitation frequency and position, for the inspection of structures where access is restricted by regularly spaced features such as stiffeners or stringers. 18
Experiments
The fatigue crack growth monitoring was performed using four tensile specimens, which are 3 mm thick, 70 mm wide, and 600 mm long, made of aluminum alloy 2014 T6. A ¼-in-diameter hole (r0 = 3.17 mm) was drilled on the center line 200 mm from the specimen end (see Figure 1(a)). The specimen was subjected to cyclic tensile loading in a servo-hydraulic testing machine (see Figure 1(b)). A maximum load of 26 kN was selected so that the maximum stress in the vicinity of the hole is about 95% of the yield strength (stress concentration factor
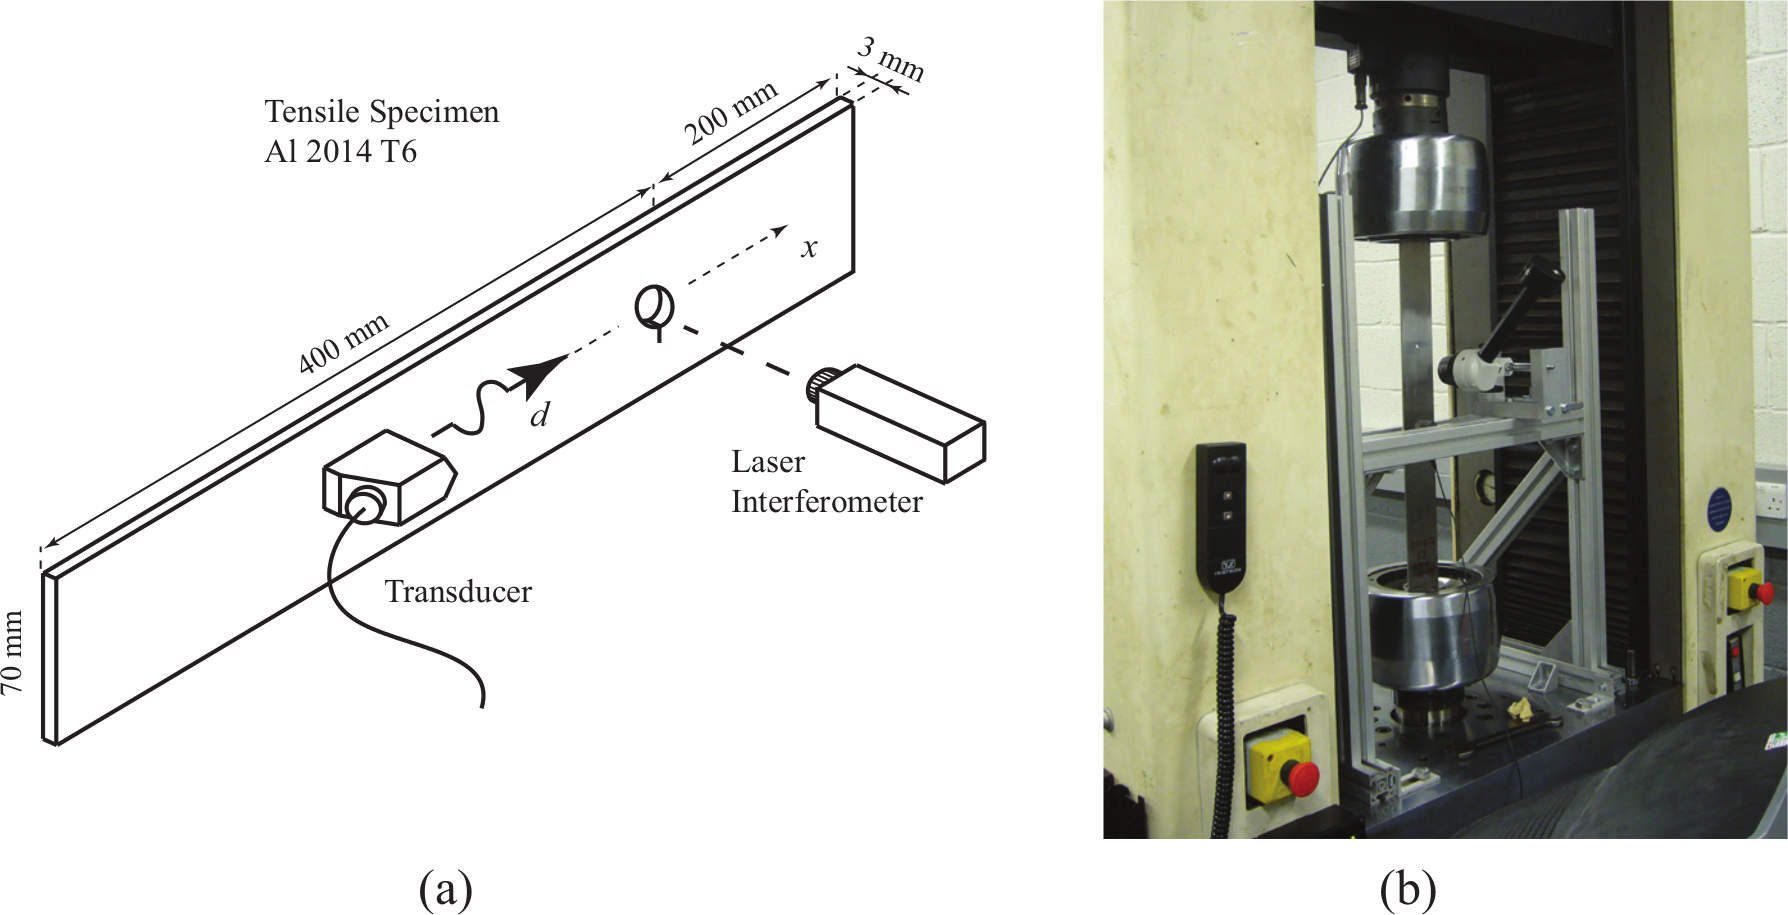
Experimental setup: (a) schematic representation of high-frequency guided wave excitation and measurement and (b) photograph of the cyclic tensile loading setup with optical microscope.
A standard Rayleigh wave angle beam transducer and wedge (Panametrics A540S/ABWML-5T-90°) with a center frequency of 2.25 MHz (Rayleigh wavelength λR = 1.3 mm) were clamped (propylene glycol couplant, screwed clamp) at a distance d = 125 mm from the hole center on the specimen surface opposite to the side where the starter notch was made. The distance, corresponding to half a beatlength at center frequency (L = 250 mm), was selected so that the energy is mainly concentrated on the notched specimen side when reaching the hole. The transducer was positioned in such a way that the main propagation line crossed the center of the hole, as displayed in Figure 1(a). The specimen was wide enough so that the sides did not significantly affect the propagation of the incident wave field. The transducer was driven using a standard ultrasonic pulser/receiver. The frequency content of the generated ultrasonic pulse was wide band up to about 3.5 MHz. A noncontact heterodyne laser interferometer (Polytec OFV 5000/505) was used to measure at a spot approximately 1 mm sideways from the hole and 1 mm behind the expected fatigue crack location on the same side of the plate as the starter notch. At this measurement location, the energy of the wave pulse that propagates past the fatigue crack is expected to be highly affected by the crack growth. The out-of-plane component was measured using a displacement decoder. The laser demodulator output was band-pass filtered (1–5 MHz) around the center frequency and averaged (100 averages). The noncontact measurement allows for a very sensitive measurement with high spatial resolution (measurement spot diameter less than 0.1 mm) of the influence of the fatigue crack on the propagating high-frequency guided wave pulse. The measurement was repeated every 1000 cycles, holding the specimen under maximum tensile load to avoid crack closure. The crack size was measured optically on the front surface (crack length) and through the hole thickness (crack depth) by means of an optical microscope.
Finite-difference scattering simulation
A full three-dimensional FD code was used to simulate the scattering of the high-frequency guided ultrasonic wave modes at the hole and the crack. The geometry was discretized on a Cartesian, staggered grid 22 using cubic elements with a side length of 50 µm (approximately 20 nodes per Rayleigh wavelength). The hole geometry was approximated with the right-angled Cartesian grid, the grid size being small compared to the 6.35-mm-diameter hole. The fatigue crack was implemented at the edge of the hole at an angle of 90° relative to the main propagation axis. For crack sizes smaller than the plate thickness of 3 mm, the crack contour was quarter-circular with point of origin at the hole corner. A through-thickness crack with constant length starting from the hole edge was implemented for crack sizes above the plate thickness. The stress-free boundary conditions at the specimen and hole boundaries as well as in the crack were implemented as described in Masserey and Mazza. 23
To reduce the computational effort, the 600 mm × 70 mm specimen was reduced to a 50 mm × 70 mm aluminum plate as displayed in Figure 2. The simulation was performed separately for A0 and S0 Lamb modes using a 5-cycle sinusoid in a Hanning window with a center frequency of 2.25 MHz as the excitation signal. The incident wave was generated 10 mm from the hole center by imposing the displacement field for the A0 or S0 mode in the two initial simulation steps as described in Munasinghe and Farnell. 24 The simulation was repeated for crack sizes from 0 to 4 mm with a step size of 0.5 mm. The out-of-plane displacement component was recorded on the specimen surface where the crack was initiated for all grid points in a square area of 2 mm × 2 mm with center point corresponding to the laser spot (1 mm sideways from hole and 1 mm behind the fatigue crack location) as shown in Figure 2. To be consistent with the measurements, the evaluation of the corresponding time signals as a function of the crack size was done on the basis of the combined results from the A0 and S0 simulations. As the 5-cycle tone burst used as excitation signal has a bandwidth Δf = 1.8 MHz (width of the main lobe), the dispersive behavior of the first Lamb modes was considered in the reconstitution of the time signal. Fast Fourier transform (FFT) was applied to the out-of-plane displacement signals recorded for the A0 and S0 simulations. The resulting complex, discrete frequency spectra were subsequently phase shifted to take into account the additional propagation distance of 115 mm. The phase shift was calculated for every frequency of the discrete spectra as the product of this distance with the wave number of the corresponding mode at that frequency. The resulting frequency spectra for the first anti-symmetric and the first symmetric Lamb mode simulations were added together and transformed back into the time domain by means of inverse FFT. Neglecting the influence of the beam spread, the resulting time series corresponds to the experimental configuration with the out-of-plane displacement component measured behind the crack for a Rayleigh-like wave generated at 125 mm from the hole center on the specimen surface opposite to the side where the crack initiated.
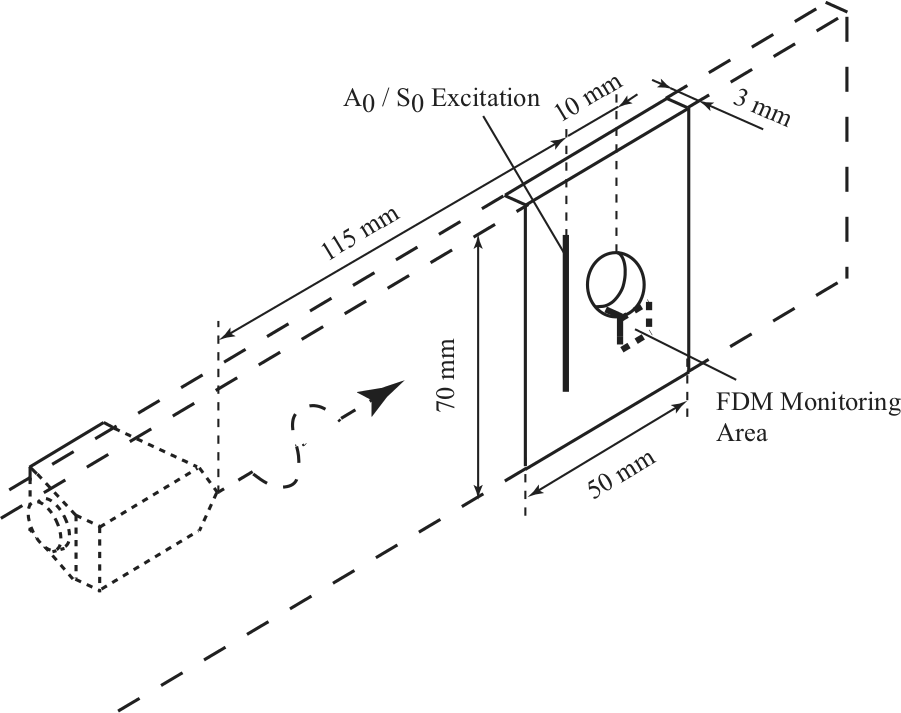
Specimen geometry implemented in the FD (Finite Difference) simulation: excitation position and monitoring area behind the fatigue crack.
Fracture mechanics prediction of crack growth
The fatigue crack growth was predicted by means of a simple analytical model, assuming Forman law. 25 This model can be used to describe stable and unstable propagation for cracks when the plastic zone ahead of the crack tip is large compared to the mean grain size. The mathematical relationship describing Forman law is
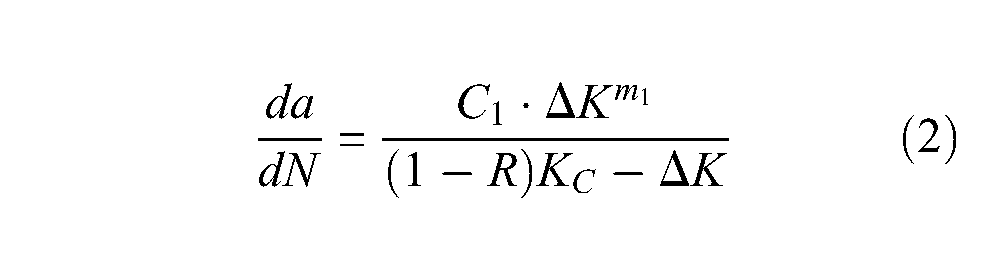
where the crack growth rate da/dN is given as a function of the stress intensity factor range ΔK, the stress ratio R, the material fracture toughness KC, and two material parameters m1 and C1. For cyclic loading, the stress intensity factor range is defined as the difference between maximum and minimum stress intensity factors Kmax and Kmin, computed as
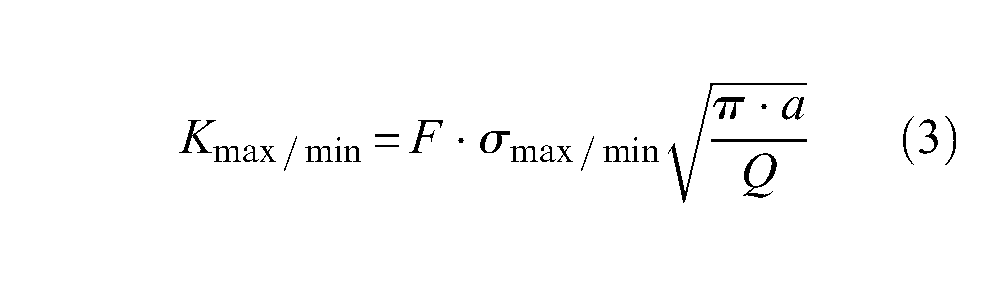
where σ is the nominal stress, a is the crack depth, Q is the shape factor for an ellipse, and F is a factor depending on crack depth, crack length, plate thickness, plate width and hole radius.
26
The stress intensity factors for crack depth and crack length are different, even though each of them depends on both axes of the quarter-elliptical defect. The stress intensity factor equations proposed in Newman and Raju
26
are valid for a ratio of crack depth to crack length between 0.2 and 2; all other geometrical parameters were within the valid range. Crack growth prediction has been performed incrementally on the basis of equation (2). A convergence analysis was performed to ensure that the selected cycle increment ΔN is small enough to obtain an accurate solution. A typical fatigue rate figure representing the measured crack growth rate da/dN as a function of the stress intensity factor range ΔK was used to determine the material parameters required for Forman propagation law. Initial parameter values for Al 2014 T6 were taken from Berger et al.
27
(
The number of cycles for which crack initiation occurred varied for the four investigated specimens, but due to the identical loading conditions, the fatigue crack growth was repeatable between the specimens. To account for this and allow for a comparison between the four specimens, crack growth is shown as a function of the number of cycles before the crack was observed to have grown through the thickness of the specimen, which, unlike crack initiation, could be found exactly (accuracy of 1000 cycles). The optically observed crack lengths and crack depths are shown for the four specimens in Figure 3. Despite an initially larger notch length on the specimen surface, the crack growth through the hole thickness is faster and leads to a through-thickness defect before a crack length of 3 mm can be observed on the specimen surface. Shown in Figure 4 are photographs taken using an optical microscope on the surface and through the hole thickness of one specimen when the fatigue crack initiation and growth occurred. For this specimen, the fatigue crack was first observed optically at 52,000 cycles (16,000 cycles before a through-thickness crack was observed) as a quarter-elliptical crack with a length of 0.39 mm on the front surface. Only the starter notch (0.26 mm × 0.17 mm) is visible in the pictures for 40,000 and 50,000 cycles (28,000 cycles and 18,000 cycles, respectively, before a through-thickness crack was observed), while in the pictures for 60,000 cycles (8000 cycles before a through-thickness crack was observed), the quarter-elliptical crack can be seen with a length of 1.05 mm on the front surface and a depth of 1.06 mm through the thickness. The crack had grown through the thickness of the specimen at 68,000 cycles (length on front surface: 2.48 mm) and then continued to grow as a through crack with similar lengths on the front and back surfaces. The through-thickness crack is shown at 70,000 cycles with a length of 3.13 mm on the front surface.
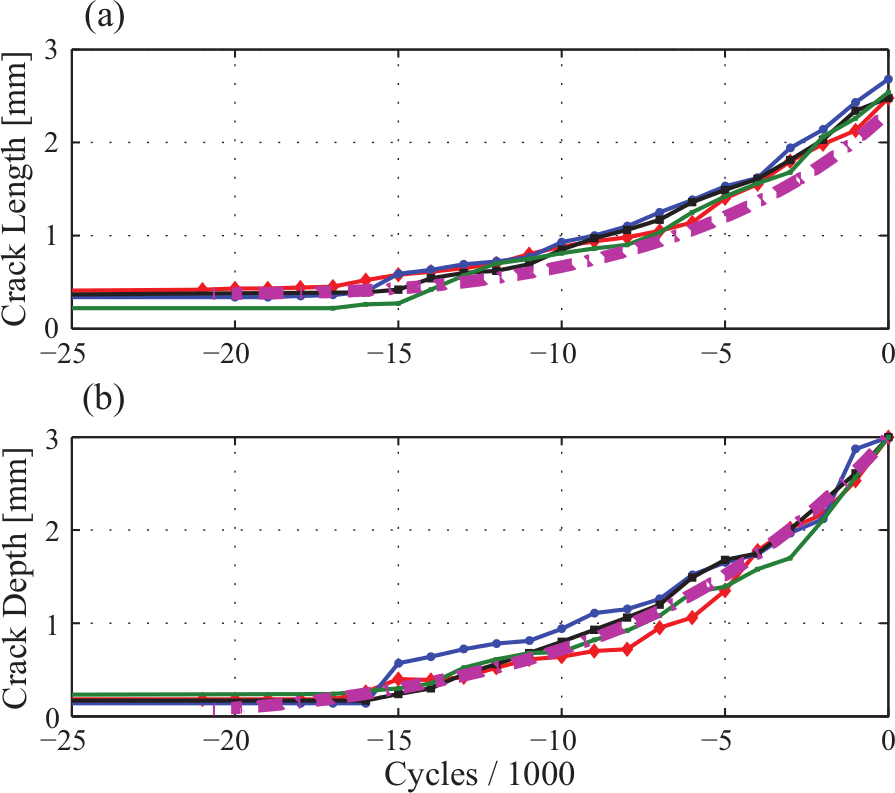
Optically measured fatigue crack growth for four specimens (solid lines) and predicted fatigue crack growth (dash–dotted): (a) crack length on specimen surface and (b) crack depth in fastener hole interior, plotted against number of cycles before crack grown through thickness.
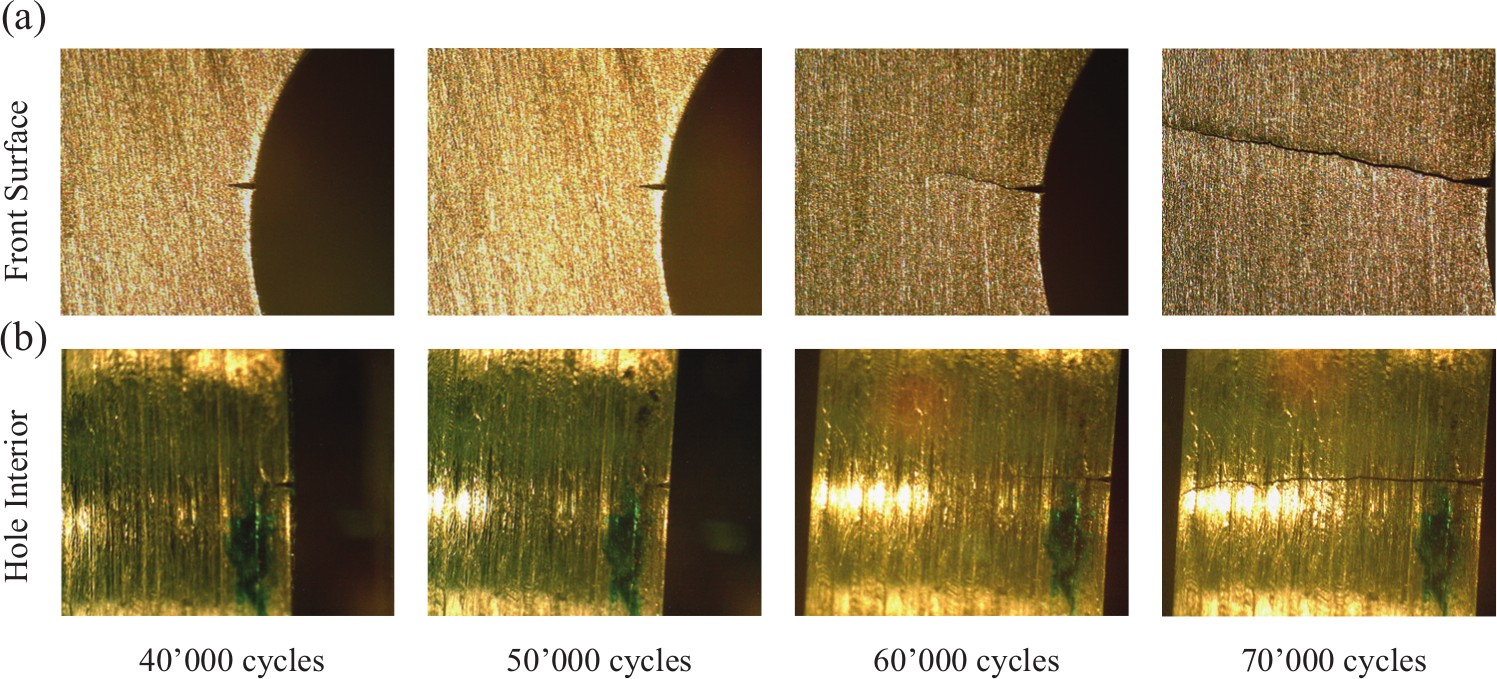
Photographs for one specimen of starter notch and fatigue crack growth (a) on front surface and (b) in hole interior.
The crack growth calculation for crack length and crack depth is shown in Figure 3 (dash–dotted line). For each specimen, the number of cycles when the crack was first observed optically both on the specimen surface and in the hole thickness was taken as reference to define the initial crack length and depth. The resulting crack sizes for all specimens were averaged to obtain initial values of 0.34 mm for crack depth and 0.45 mm for crack length. As the fatigue crack growth was comparable between the four specimens, a value of 15,500 was taken as the average number of cycles before a through-thickness crack was observed (observed range: 15,000–17,000 cycles). Based on these data, the fatigue crack growth was computed until the quarter-elliptical crack had grown through the specimen thickness. The resulting curves show excellent agreement for crack depth and good agreement for crack length. Similar to the measured crack growth, the predicted crack growth rate is more pronounced for the crack depth in the hole thickness, becoming larger than the crack length 12,500 cycles before a through-thickness crack is observed. Starting from the same initial values, a backward crack growth calculation was performed to estimate the defect size before the crack was observed optically. The calculation was stopped 21,000 cycles before a through-thickness crack was observed, as the criterion based on the ratio between crack length and crack depth was not satisfied anymore, and thus, the crack geometry was out of the valid range for stress intensity factor calculations. Based on the available backward prediction, an estimation of the crack size 20,000 cycles before a through-thickness crack (and 3000–4000 cycles before a crack was observed optically) yields a crack length of 0.38 mm, a crack depth of 0.09 mm, and a corresponding quarter-elliptical crack area of less than 0.05 mm2.
Noncontact laser measurement for improved detection sensitivity
The measured high-frequency guided wave pulses behind the fatigue crack location are shown in Figure 5 for the same specimen and the same number of cycles as shown in Figure 4. The signal measured using the noncontact laser interferometer showed some variations and noise, partially due to a not perfect reflection of the laser beam from the specimen surface. Another potential source would be a movement of the measurement spot relative to the hole as the specimen moved or expanded (due to heat) in the clamps of the testing machine, while the laser interferometer was fixed to an external positioning system. The maximum amplitude of the ultrasonic pulse measured with the laser interferometer showed small variations of up to 5% until 40,000 cycles (Figure 5(a), 28,000 cycles before through-thickness crack). A significant reduction of the pulse amplitude can be seen in Figure 5(b) at 50,000 cycles (18,000 cycles before through-thickness crack), when no crack was observed optically. The decrease in pulse amplitude and energy continues for a part-through crack as can be seen for the pulse at 60,000 cycles (8000 cycles before through-thickness crack) in Figure 5(c). When the crack has grown through the thickness, almost no guided ultrasonic wave pulse can be measured any more directly behind the fatigue crack (Figure 5(d), 70,000 cycles). In principle, the drop in amplitude of the measured pulse is the expected behavior, as the noncontact monitoring location is behind the crack location from the excitation point and the growing fatigue crack blocks the path of the ultrasonic wave, leading to a shadow area behind the crack.
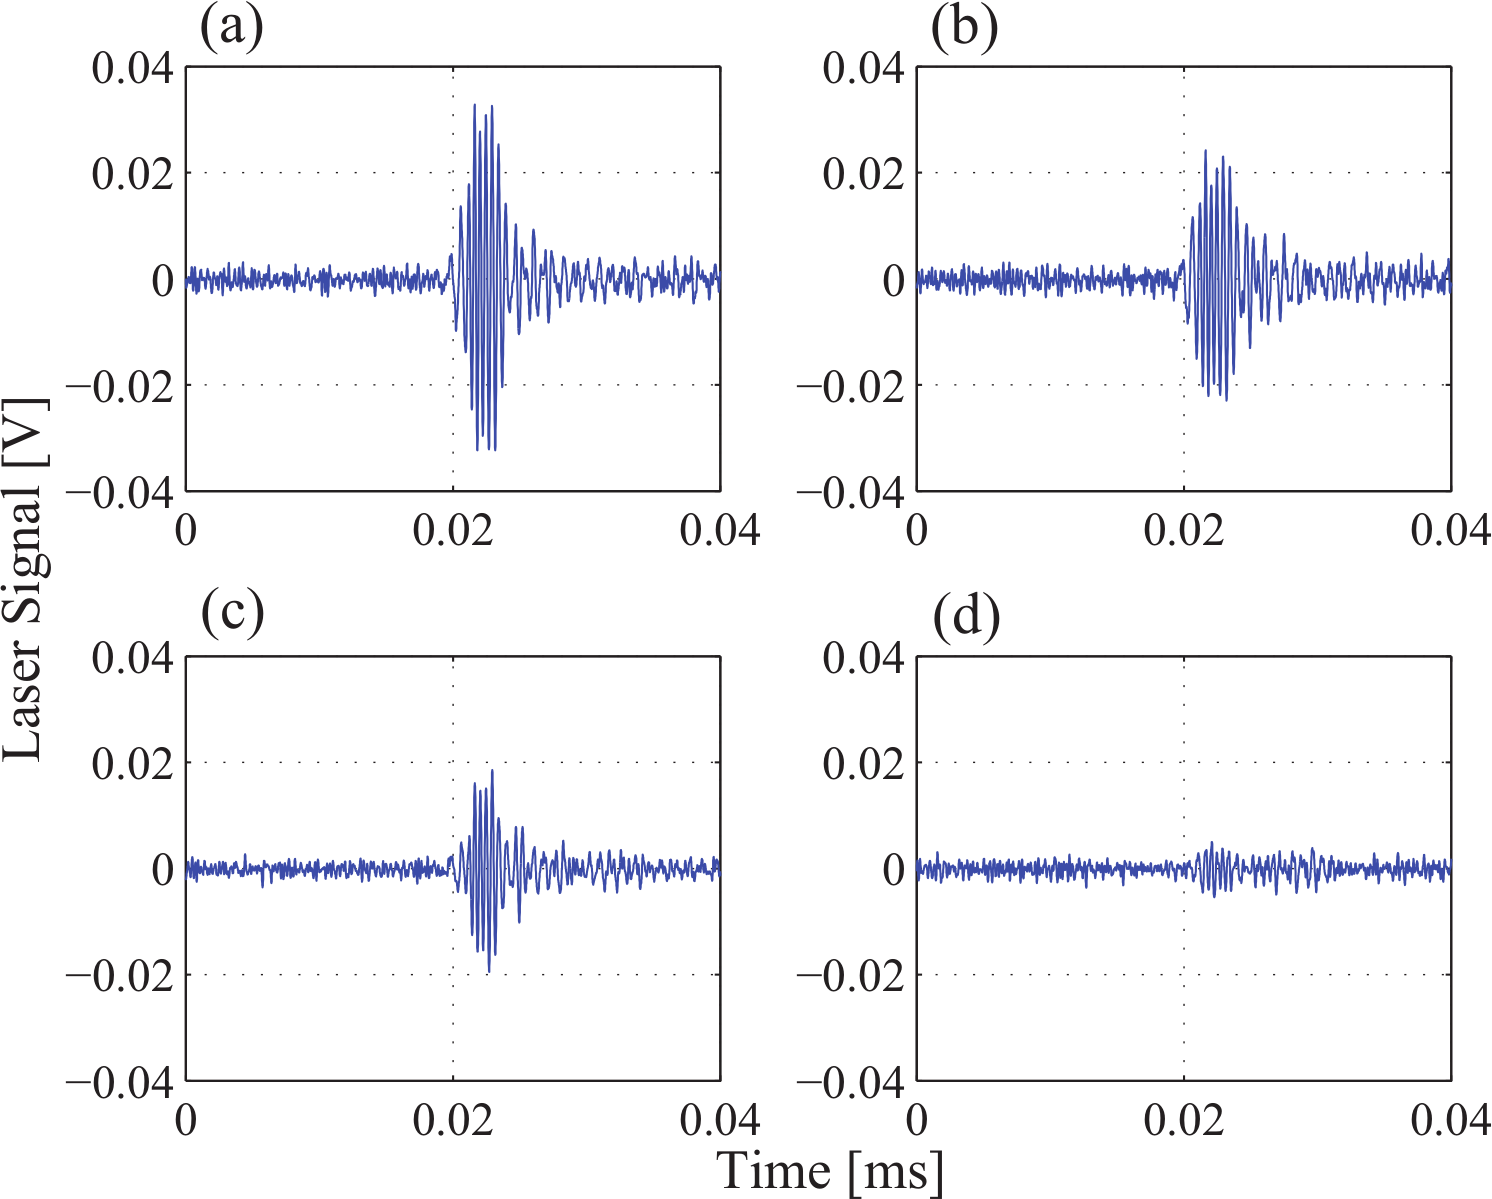
Time traces of high-frequency guided ultrasonic wave pulse measured on same specimen as in Figure 4 with laser interferometer at location behind fatigue crack close to hole (f0 = 2.25 MHz, d = 125 mm): (a) 40,000 cycles, (b) 50,000 cycles, (c) 60,000 cycles, and (d) 70,000 cycles.
In order to quantify this, the changes in the guided wave pulse were evaluated for each measurement (every 1000 cycles), for the fatigue experiments on the four specimens, using three different methods, extracting the maximum amplitude of the pulse, an energy-based parameter of the pulse, and the amplitude of the frequency spectrum at 2.25 MHz using FFT. The pulse was time-gated (0.02–0.025 ms in Figure 5) to reduce the influence of noise on the measurement for the energy and FFT calculations. The amplitude maximum was extracted for each of the time traces. The maximum amplitude showed some short-term fluctuation between individual measurements within a range of up to 5% until −40,000 cycles (40,000 cycles before through-thickness crack) and 8% until −30,000 cycles. However, as expected from the observed time traces shown in Figure 5, this evaluation method proved to be less sensitive to quantify the change in the guided wave pulse, as between Figure 5(b) and (c), only a small drop in the maximum amplitude but a more significant drop in the pulse energy can be observed. The energy of the pulse was thus calculated according to equation (4)
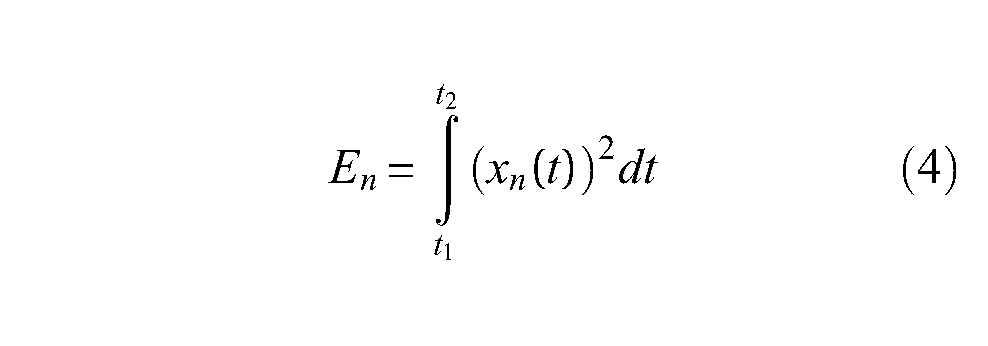
where t is the time and xn(t) is the pulse at fatigue cycle n. The energy ratio RL was obtained by normalizing the energy parameter En with the baseline energy parameter E0

with

where x0(t) is the baseline signal (averaged from the first 10 measurements). Calculating the energy parameter instead of taking the peak amplitude was found to be less sensitive to noise in the signal and to more accurately represent the signal, for example, between Figure 5(b) and (c), the significant drop in the pulse energy can be well quantified. This showed less short-term fluctuation between consecutive measurements with a variation of up to 7% until −40,000 cycles and 15% until −30,000 cycles. Furthermore, the amplitude of the pulse at the center frequency of 2.25 MHz was extracted using FFT. This showed a variation of up to 5% until −40,000 cycles and 11% until −30,000 cycles, and overall, this gave very similar results to the energy calculation. The increased variation after −40,000 cycles was due to the measurements for one specimen, with a drop in both energy and amplitude of the frequency spectrum. The reasons for this drop could not be related to any measurement variations or optically observed crack growth.
The energy ratios of the pulse measured with the noncontact laser interferometer for the four tensile specimens are shown in Figure 6(a). The energy ratio and the approximate optically measured crack area (Figure 6(b)) are shown against the number of cycles before the crack grew through the plate thickness as detailed above to account for variations in the crack initiation. In Figure 6(b), it can be seen that the crack growth was repeatable between the four specimens, with the crack optically visible 15,000–17,000 cycles before a through-thickness crack was observed. Evaluating the energy ratio of the signal from the start of the fatigue experiments until 30,000 cycles before a through-thickness crack, a variation of the energy ratio of up to 15% can be observed, as described above. However, for all four specimens, a significant drop in the ultrasonic pulse and thus energy ratio can be seen from about 25,000 cycles before a through-thickness crack was observed. After 6000 cycles (at −19,000 cycles), this drop was at least 30% for all specimens and therefore significantly larger than the maximum variation observed (twice as large). For none of the specimens, the crack could be observed visually at this stage; the fatigue defect was only detected using the optical microscope 2000–3000 cycles later. From the averaged data of the smallest optically measured crack length for the four specimens, a backward calculation was performed to estimate the crack size when the amplitude drop was observed in the guided ultrasonic wave signal. As mentioned in section “Fracture mechanics prediction of crack growth,” this predicted a maximum macroscopic crack area of less than 0.05 mm2 at this stage (−20,000 cycles, 3000–4000 cycles before a crack was observed optically). It appears that the employed measurement configuration with the local noncontact laser interferometer measurement of the guided wave pulse just past the expected crack location is very sensitive to detect small macroscopic cracks with good repeatability. It is assumed that additionally, the microscopic damage around the macroscopic crack will have the effect of reducing the energy of the high-frequency guided ultrasonic wave pulse.
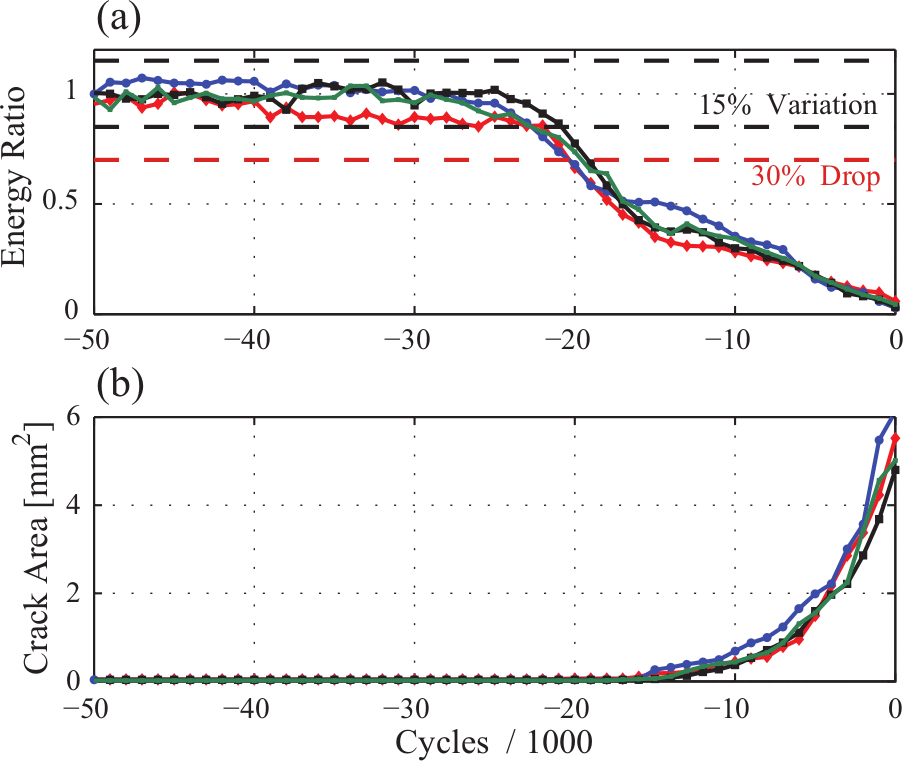
(a) Energy ratio of high-frequency guided ultrasonic wave pulse measured with laser interferometer at location behind fatigue crack close to hole for four specimens (solid lines), with 15% variation and 30% drop shown (dashed) and (b) optically measured crack area for four specimens, plotted against number of cycles before crack grown through thickness.
Comparison of measurements with FD predictions for defect sizing
The energy ratio drops to about 0.5 when the crack was first seen using the optical microscope and then drops close to 0 when the crack has grown through the thickness of the specimen and blocks the path of the guided ultrasonic wave pulse. This phenomenon can be seen more clearly in Figure 7, where the energy for all four specimens was plotted against the optically visible crack area. This was observed consistently for the four tensile specimens, with some variation between the four specimens for small, part-thickness cracks (up to 2 mm2) and very good repeatability for larger fatigue cracks. The interesting observation was the significant drop in pulse amplitude and thus energy ratio before the crack had grown large enough to be observed optically. A 30% drop in amplitude occurs around the number of cycles when an estimated macroscopic crack area of less than 0.05 mm2 was predicted from the crack growth model. This drop is twice as large as the maximum variation of the measurements without damage (15%).
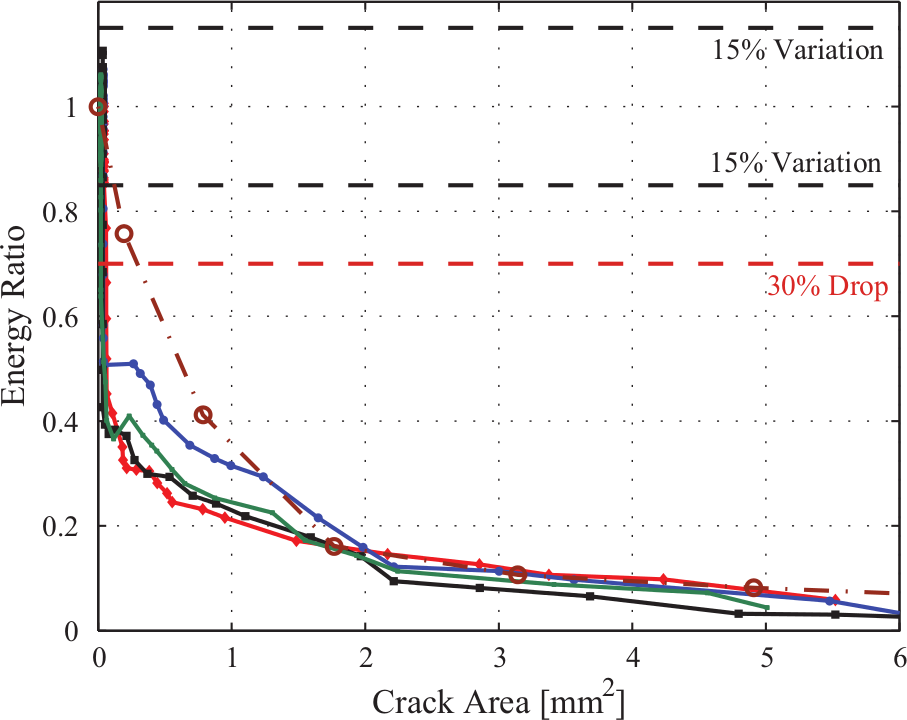
Energy ratio of high-frequency guided ultrasonic wave pulse measured with laser interferometer at location behind fatigue crack close to hole for four specimens (solid lines), with 15% variation and 30% drop shown (dashed), and with FD calculation (dash–dotted, circles), plotted against approximate optically measured crack area.
Using the FD model described earlier, the high-frequency guided ultrasonic wave signal was predicted in the vicinity of the hole and crack. For the location of the noncontact laser interferometer measurement just behind the fatigue crack location, the evaluated energy ratio against the crack area is shown in Figure 7 as the dash–dotted line. The predicted drop in ultrasonic signal due to the shadow effect of the crack can be observed. For small fatigue cracks (up to 2 mm2), the FD simulations predict a smaller energy drop than measured experimentally. It is expected that this is due to fatigue damage that has not been observed and modeled. Micro-structural damage typically occurs around the macroscopic fatigue crack. Combined with the small (less than 0.05 mm2) macroscopic fatigue crack predicted from the crack growth model (but not observed optically), this leads to the observed drop in ultrasonic pulse amplitude. This is consistent with the observed drop in the ultrasonic signal before the fatigue crack was detected using the optical microscope. This noncontact measurement close to the defect location gives an early indication of the fatigue crack before the crack is large enough to be observed optically with the employed microscope. From Figure 7, it can be seen that for a crack area larger than 2 mm2, the predicted and measured energy ratios for the fatigue cracks correlate well, when plotted against the crack area. This allows in principle an approximate sizing of the fatigue damage for a known configuration.
From the FD simulations, the influence of the geometric configuration and signal evaluation was investigated. The choice of the time window (in the absence of noise) has almost no influence on the energy drop for small (less than 2 mm2) cracks. For larger cracks, the removal of the time window leads to a slightly larger predicted energy, as additional scattering phenomena lead to some energy arriving later in time than the direct ultrasonic wave pulse. The distance d between the excitation location and fastener hole (damage location) was varied to investigate the influence of the beating effect and thus energy variation through the depth of the specimen. While some variation in the energy ratio curves was found, overall the curves show a similar dependency on the fatigue crack area. It was concluded that small inaccuracies in the positioning of the excitation wedge transducer will have a negligible influence on the observed results. Furthermore, the influence of the exact location of the laser measurement spot relative to the fastener hole and fatigue crack location was investigated for a variation of up to 2 mm in each direction. As long as the measurement spot remains in the shadow area of the fatigue crack (i.e. behind the crack in the propagation direction of the guided wave pulse), only a small influence on the drop in the energy ratio was predicted. However, for a variation of the measurement location in the width direction of the specimen, a significant influence on the pulse energy was predicted. Placing the measurement spot too far from the hole, it would not be possible to detect small fatigue cracks (less than 2 mm2) as the energy drop is significant only above that crack size. This illustrates the necessity of high-precision, local noncontact measurements for the early detection of fatigue damage before it can be observed optically.
Conclusion
The noncontact measurement of high-frequency guided ultrasonic waves for fatigue crack growth monitoring at fastener holes has been studied. The propagation and scattering of the high-frequency guided ultrasonic wave modes were simulated using the FD method. Experimentally, the guided ultrasonic wave pulse was measured in the shadow area behind the expected fatigue crack location using a laser interferometer, holding the specimen under tensile load. The changes in the ultrasonic signal were quantified on the basis of the energy ratio of the high-frequency guided ultrasonic wave pulse to the undamaged case. The resulting energy drop due to the blocking of the guided ultrasonic wave path was repeatable between the four measured specimens. A significant drop of the energy of more than 30% had occurred before the crack had grown large enough for optical detection using a microscope. From fatigue crack growth calculations, it was predicted that this corresponds to a macroscopic fatigue crack area of less than 0.05 mm2 (and the micro-structural damage around the macroscopic fatigue crack). This noncontact measurement close to the defect location therefore gives an early indication of fatigue damage. For small fatigue cracks, the simulations predict a smaller energy drop than measured experimentally. This is consistent with the observed drop in the ultrasonic signal before the fatigue crack was detected using the optical microscope. For larger cracks, the predicted and measured energy ratios correlate well with the optically measured crack area, showing the potential for crack sizing. Further measurements should investigate the relevance of the load (and the resulting crack opening) on the early detection of fatigue cracks and the applicability of the methodology for the long-term monitoring of complex, multi-layered aerospace structures in real applications.
Footnotes
Declaration of conflicting interests
The authors declare that there is no conflict of interest.
Funding
This work was partially supported by the Swiss National Science Foundation (grant number PBEZ2-114186) and the UK Engineering and Physical Sciences Research Council (EPSRC) (grant number EP/D065011/1).