
Abstract
Single-subjects design has the advantage of providing detailed, individualized analyses of intervention. However, creating a tutorial for single-subject design (SSD) is challenging, and an effective version for online delivery is currently unavailable. Here, we developed an experiential SSD tutorial designed for online delivery and evaluated its pedagogical effectiveness. Fifty-nine undergraduate students participated by completing a three-item online questionnaire, and their free-text responses were analyzed using summative content analysis. The quantitative results indicated that most students found the tutorial highly beneficial. Qualitative findings revealed four key learning points: the SSD design process, types of intervention, the concept of SSD, and behavioral changes. Additionally, two main features—experiential learning and the ability to interpret personal data—facilitated student engagement. We also explore ways to further enhance the teaching of SSD, highlighting the tutorial as a versatile tool for online education that offers students a practical and realistic introduction to single-subject designs.
Creating a Dot-Counting Single-Subject Design Tutorial
Single-subject design (SSD), also known as a single-case experiment, small-n study, or N-of-1 trial, focuses on a single or small number of subject(s), repeated measurements across time, separated by interventions (Kratochwill & Levin, 2010). From the simplest form of SSD, the AB design, where an intervention happens between the pre-and post-intervention phases, SSDs can be expanded in various ways (e.g., ABA, multiple baseline design, changing criterion design, and alternating treatment designs; Morley, 2018). Unlike group designs, SSD's primary focus is on whether an intervention successfully changes outcomes of a specific individual (Manolov & Moeyaert, 2017). As such, it is an important methodology in many applied fields of psychology, including clinical (Vlaeyen et al., 2020), educational (Walsh & Kemp, 2012), and social psychology (Heward et al., 2022). SSDs also have an intuitive personal appeal to psychology students because humans are often interested in changing the affect, behaviour, or cognition of a specific individual, be it themselves or another person they know.
It is ideal that psychology education equip students with the ability to assess the dynamics of an individual's psychological processes (Blech & Gaschler, 2017; for a detailed argument, see Hamaker, 2012; Lewin, 1931). Surprisingly, SSD receives minimal emphasis in many psychology curricula, despite a growing advocacy among psychology educators for a more pronounced focus on SSD in undergraduate psychology programs (e.g., Kemp & Fisher, 2023). Additionally, there is a scarcity of published tutorial activities on SSD, prompting our initiative to create an innovative tutorial on SSD. Our tutorial activity, outlined in this paper, offers a different pedagogical method for psychology educators teaching this research design within the field of psychology.
The Challenges of Creating SSD Tutorial Activities
Creating an engaging SSD tutorial activity is challenging for many reasons. First, it is recommended to include experiential activities, as integrating active learning into research methods pedagogy (i.e., where students participate in data analysis, synthesis, and evaluation) enhances students’ critical thinking and understanding of research (Bell, 2016). Despite this, many SSD tutorials (e.g., Lovett et al., 2011; Walker & Rehfeldt, 2012), including what we had been using in our classes (“Design a single-subjects study to investigate if enriched zoo environments reduce stereotypy in chimpanzees”), tend to focus primarily on the theoretical aspects of SSDs, missing opportunities for hands-on engagement. Although understanding theoretical aspects is important, such understanding may be boosted if it follows from an experiential learning phase (Heinrich & Green, 2020).
Second, any effects must be large enough to be obtained within a single tutorial session for (nearly) every student. Students learn better when a classroom demonstration is “successful” (Huck et al., 1985), which is why pedagogical books such as Activities Handbook for the Teaching of Psychology (Benjamin et al., 1999) and Handbook of Demonstrations and Activities in the Teaching of Psychology (Ware & Johnson, 2000) share tried-and-tested teaching activities. Paradoxically, the effect should not be so certain that it obviates the necessity for additional substantiation. Take, for example, a published SSD tutorial activity (Carr & Austin, 2000) where participants’ heart rate was measured at resting state (A), after engaging in jumping jacks (B), and after a cooling down period (A), in that sequence. The consistent and predictable pattern of heart rate elevation during physical activity aligns with the universally acknowledged physiological response to exercise. When the connection between increased heart rate and physical activity is so unequivocally established, students may question the imperative for further scientific scrutiny (Medawar, 1981), potentially perceiving the tutorial as lacking depth when executed as an instructional activity. Therefore, a pedagogically beneficial SSD activity ought to yield a robust, consistent effect that is not entirely straightforward.
Third, and perhaps most importantly, given the variation in delivery mode, it is ideal that the same SSD tutorial can be executed effectively in both physical and online classrooms. This is especially crucial in universities with a mix of student groups doing either fully online or fully face-to-face learning. With the above three considerations in mind (i.e., activity should be experiential, effect should be large, but not entirely straightforward), at initial thought, a tutorial based on the famous McGurk effect (McGurk & MacDonald, 1976), originally established using traditional group-level approaches, could be adapted for an SSD tutorial. The McGurk effect is a perceptual phenomenon (i.e., highly experiential) that occurs when the auditory component of one sound is paired with the visual component of another sound, leading to a perception of a third, distinct sound. People are highly susceptible (i.e., effect is large) to the McGurk effect (Politzer-Ahles & Pan, 2019), yet often react in disbelief when confronted with the truth (i.e., effect is not entirely straightforward). In principle, an SSD tutorial activity, where participants view several video clips of auditory and visual pairings of sounds with their eyes open (A), then closed (B), and then open again (A), would be an effective demonstration. While effective in face-to-face settings, our experience found that implementing this activity online tended to be inconsistent because some students inadvertently looked away or close their eyes at inappropriate times.
It is also tempting to co-opt multiple-trial within-participant classic classroom demonstrations such as the Stroop (1935), Navon (1977), and flanker tasks (Eriksen & Eriksen, 1974) because they have large but not straightforward effects, and can be conducted in various delivery modes easily. But to adhere to the spirit of SSDs as applied in real life, it is crucial that the intervention of an SSD tutorial induces changes to an individual, not changes to the stimuli as is the case of Stroop, Navon, and flanker tasks. Even simulating a basketball “free throw” by having students throw objects into a bin of varying distances still involves a change in the stimuli, not the person, and as such, cannot capture the flavour of basketball coaching where coaches aim to change something about an individual (e.g., physical/mental conditioning) to impact basketball performance.
Lastly, the activity must be psychologically meaningful, connecting well with psychological theory and/or practice. Indeed, it is ideal that students learn not just the methodology, but how the methodology can be used to answer interesting questions in psychology. The more interesting the question is (Gray & Wegner, 2013), the better they learn (Linnenbrink-Garcia et al., 2012). An SSD activity that requires participants to record changes in heart rate from performing jumping jacks (Carr & Austin, 2000) fits well with learning about physiology but bears little relevance to psychology theory or practice.
In sum, we propose five guidelines for devising an engaging SSD tutorial activity. It should ideally (1) be experiential; (2) have large but not straightforward effects; (3) be suitable for both online and face-to-face delivery modes; (4) involve changes to the person (e.g., teaching them a new technique to do things), not changes to the stimuli; and (5) must connect well with psychology theory and/or practice. In this paper, we created an experiential activity in SSD that meets these five criteria.
Overview of our Activity
Our activity sought to capture a fascinating but often taken-for-granted human ability, numerosity perception (Beran et al., 2006). Humans are sensitive to information about the number of units of a particular object (Pelham et al., 1994), concerning things as “trivial” as the number of pimples on one's skin, to socially important things like the number of people who turned up at Trump's 2016 presidential inauguration, to medically important information such as the number of sperms seen under a microscope, to things as life-threatening as the number of enemies in a battlefield. When making such numerosity estimates, should they literally count the number of pimples, attendees, cells, or enemies? Or can there be more efficient ways? In our tutorial activity, we examine numerosity judgments using the A-B-A design with the students themselves as the participants. Specifically, we attempt to examine the accuracy of counting random dots one-by-one (the baseline phase - A), whether a learning intervention helps improve accuracy in numerosity judgments (the intervention phase - B), and if so, whether the improvement in numerosity judgments persisted after the intervention was lifted (generalization phase - A).
First, we had students estimate the number of dots without grids (A). To enhance accuracy, we then gave instructions for students to count only dots within a designated subset of grids (B), subsequently multiplying this count by the total of grids (Figure 1). Lastly, students are asked to estimate the dots again without grids (A), leveraging on the assumption that learning persist once the learning strategy has been learnt. This assumption often mirrors reality and forms the basis of many real-life applications of SSDs (e.g., Koegel et al., 2010). More importantly, our task meets all five criteria we outlined earlier, i.e., experiential, potentially large but not straightforward effects, suitable for online or face-to-face classes, changes the person (not the stimuli), and connect well with psychology theory (i.e., numerosity judgments) and practice (learning paradigms).
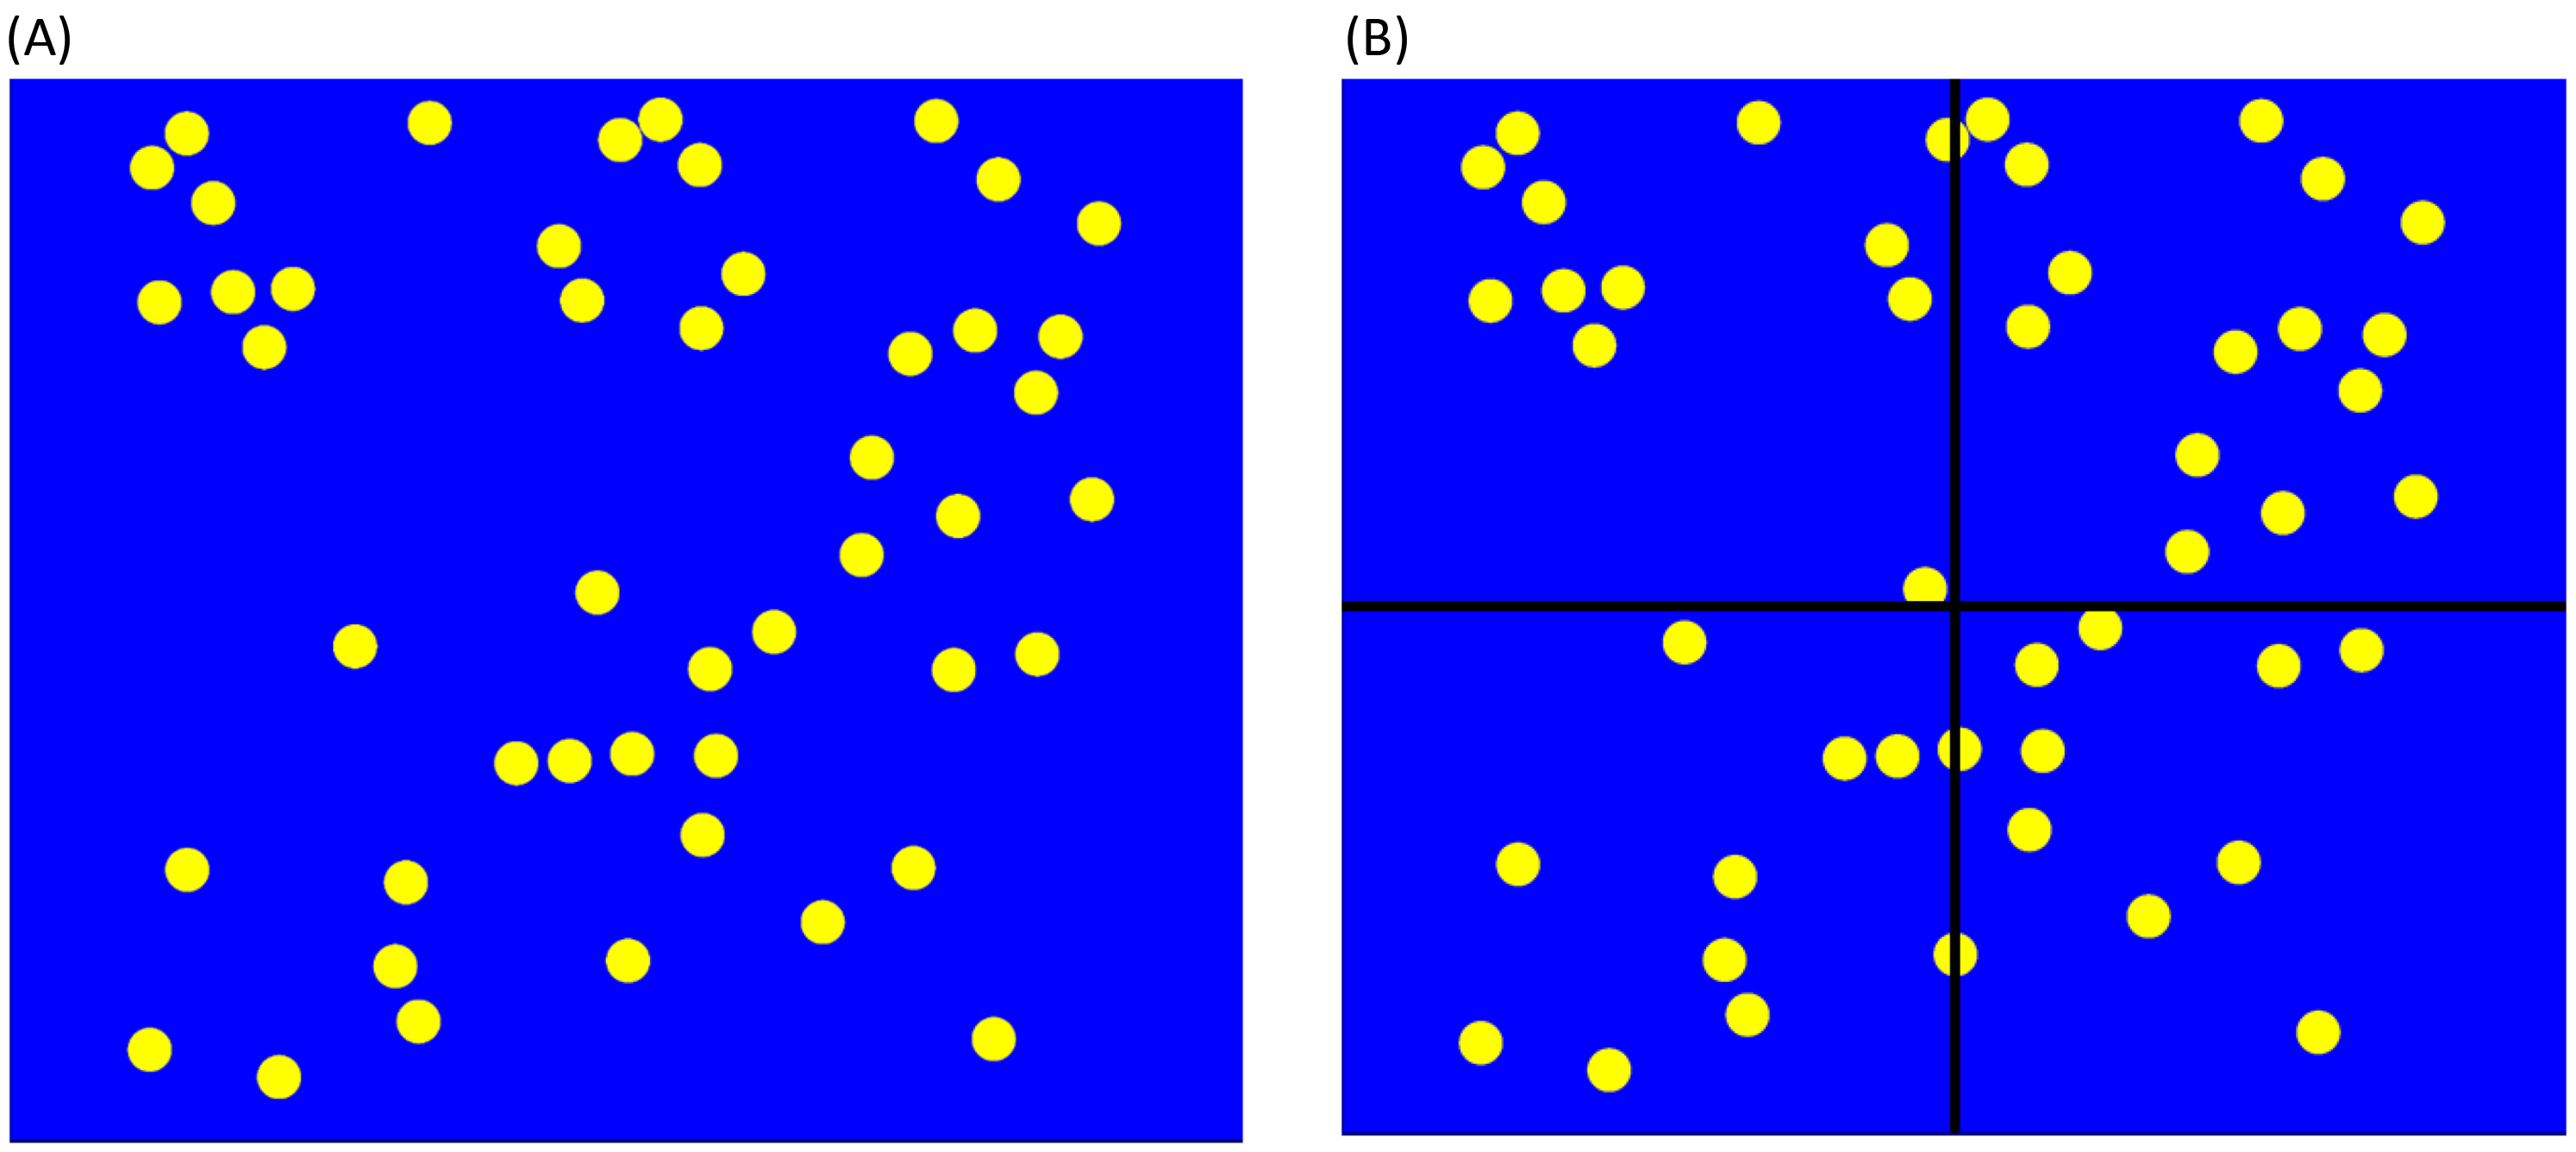
Sample stimuli for phase A (left) and B (right).
Method
Participants
Seventy students enrolled in a research methods course attended the tutorial activity 1 , of which 59 students (84%) gave informed consent and provided data for this study. As the class size is small for each tutorial (sometimes as small as 5 students), we did not collect demographic details to ensure participant anonymity.
Stimuli Preparation
Forty-five random-dot stimuli were generated using the spatstat (Baddeley & Turner, 2005) R package. The R script and stimuli are available at https://osf.io/nk65q/. Each random-dot stimulus consisted of 20 to 60 yellow dots against a blue background (Figure 1). The number (M = 40.5, SD = 10.5) and positioning of the yellow dots were random. For the stimuli used in Phase B, x-y centered gridlines were superimposed such that they split the stimuli into four smaller quadrants; stimuli used in the first Phase A (baseline) and second Phase A (generalization phase) did not have any gridlines. We presented all stimuli for 2 s each. We used Inquisit 2 (Millisecond Software, 2016) to present the stimuli and the free Open Broadcasting Software (https://obsproject.com/) to record the entire stimuli-presentation sequence as a video file. For in-person classes, each participant saw the video file on a big screen; for online classes, each participant saw the video file on their own computers via the screen-sharing application within the learning management system controlled by the tutor.
Procedure
All students who attended the tutorial went through the ABA activity as students initially. We evaluated the activity in five tutorial classes (1 online and 4 in-person) and regarded only those who agreed to contribute their data collected after the activity ended as “research participants”. The authors’ institution research ethics committee (Approval ID: H8743) approved the study.
We presented each stimulus for 2 s, with 6-s inter-stimuli pause (https://youtu.be/ifWQRmGw-Ms). In phase A, we presented 15 stimuli (Figure 1), followed by a 6-s break for participants to write down their responses on paper. Before starting phase B, we presented an instruction on the screen (i.e., “Count the number of dots in one quadrant, then multiply your answer by four”). Then we started Phase B where we presented 15 stimuli with gridlines superimposed on each stimulus (Figure 1). Finally, in the second Phase A, we presented another set of 15 stimuli without the gridlines. When this phase ended, students transferred their answers to an Excel template provided to them (see Excel template in OSF), which automatically plotted their data. Subsequently, students interpreted their results with guidance from the tutor. Figure 2A to 2C display three common patterns of results (i.e., no effect, ideal but temporary effect, ideal and sustained effect) that were discussed in class. Other graphical possibilities were also discussed, such as how a graph depicting one's tendency to over- or underestimate the number of dots might look like (e.g., Figure 2D). 3
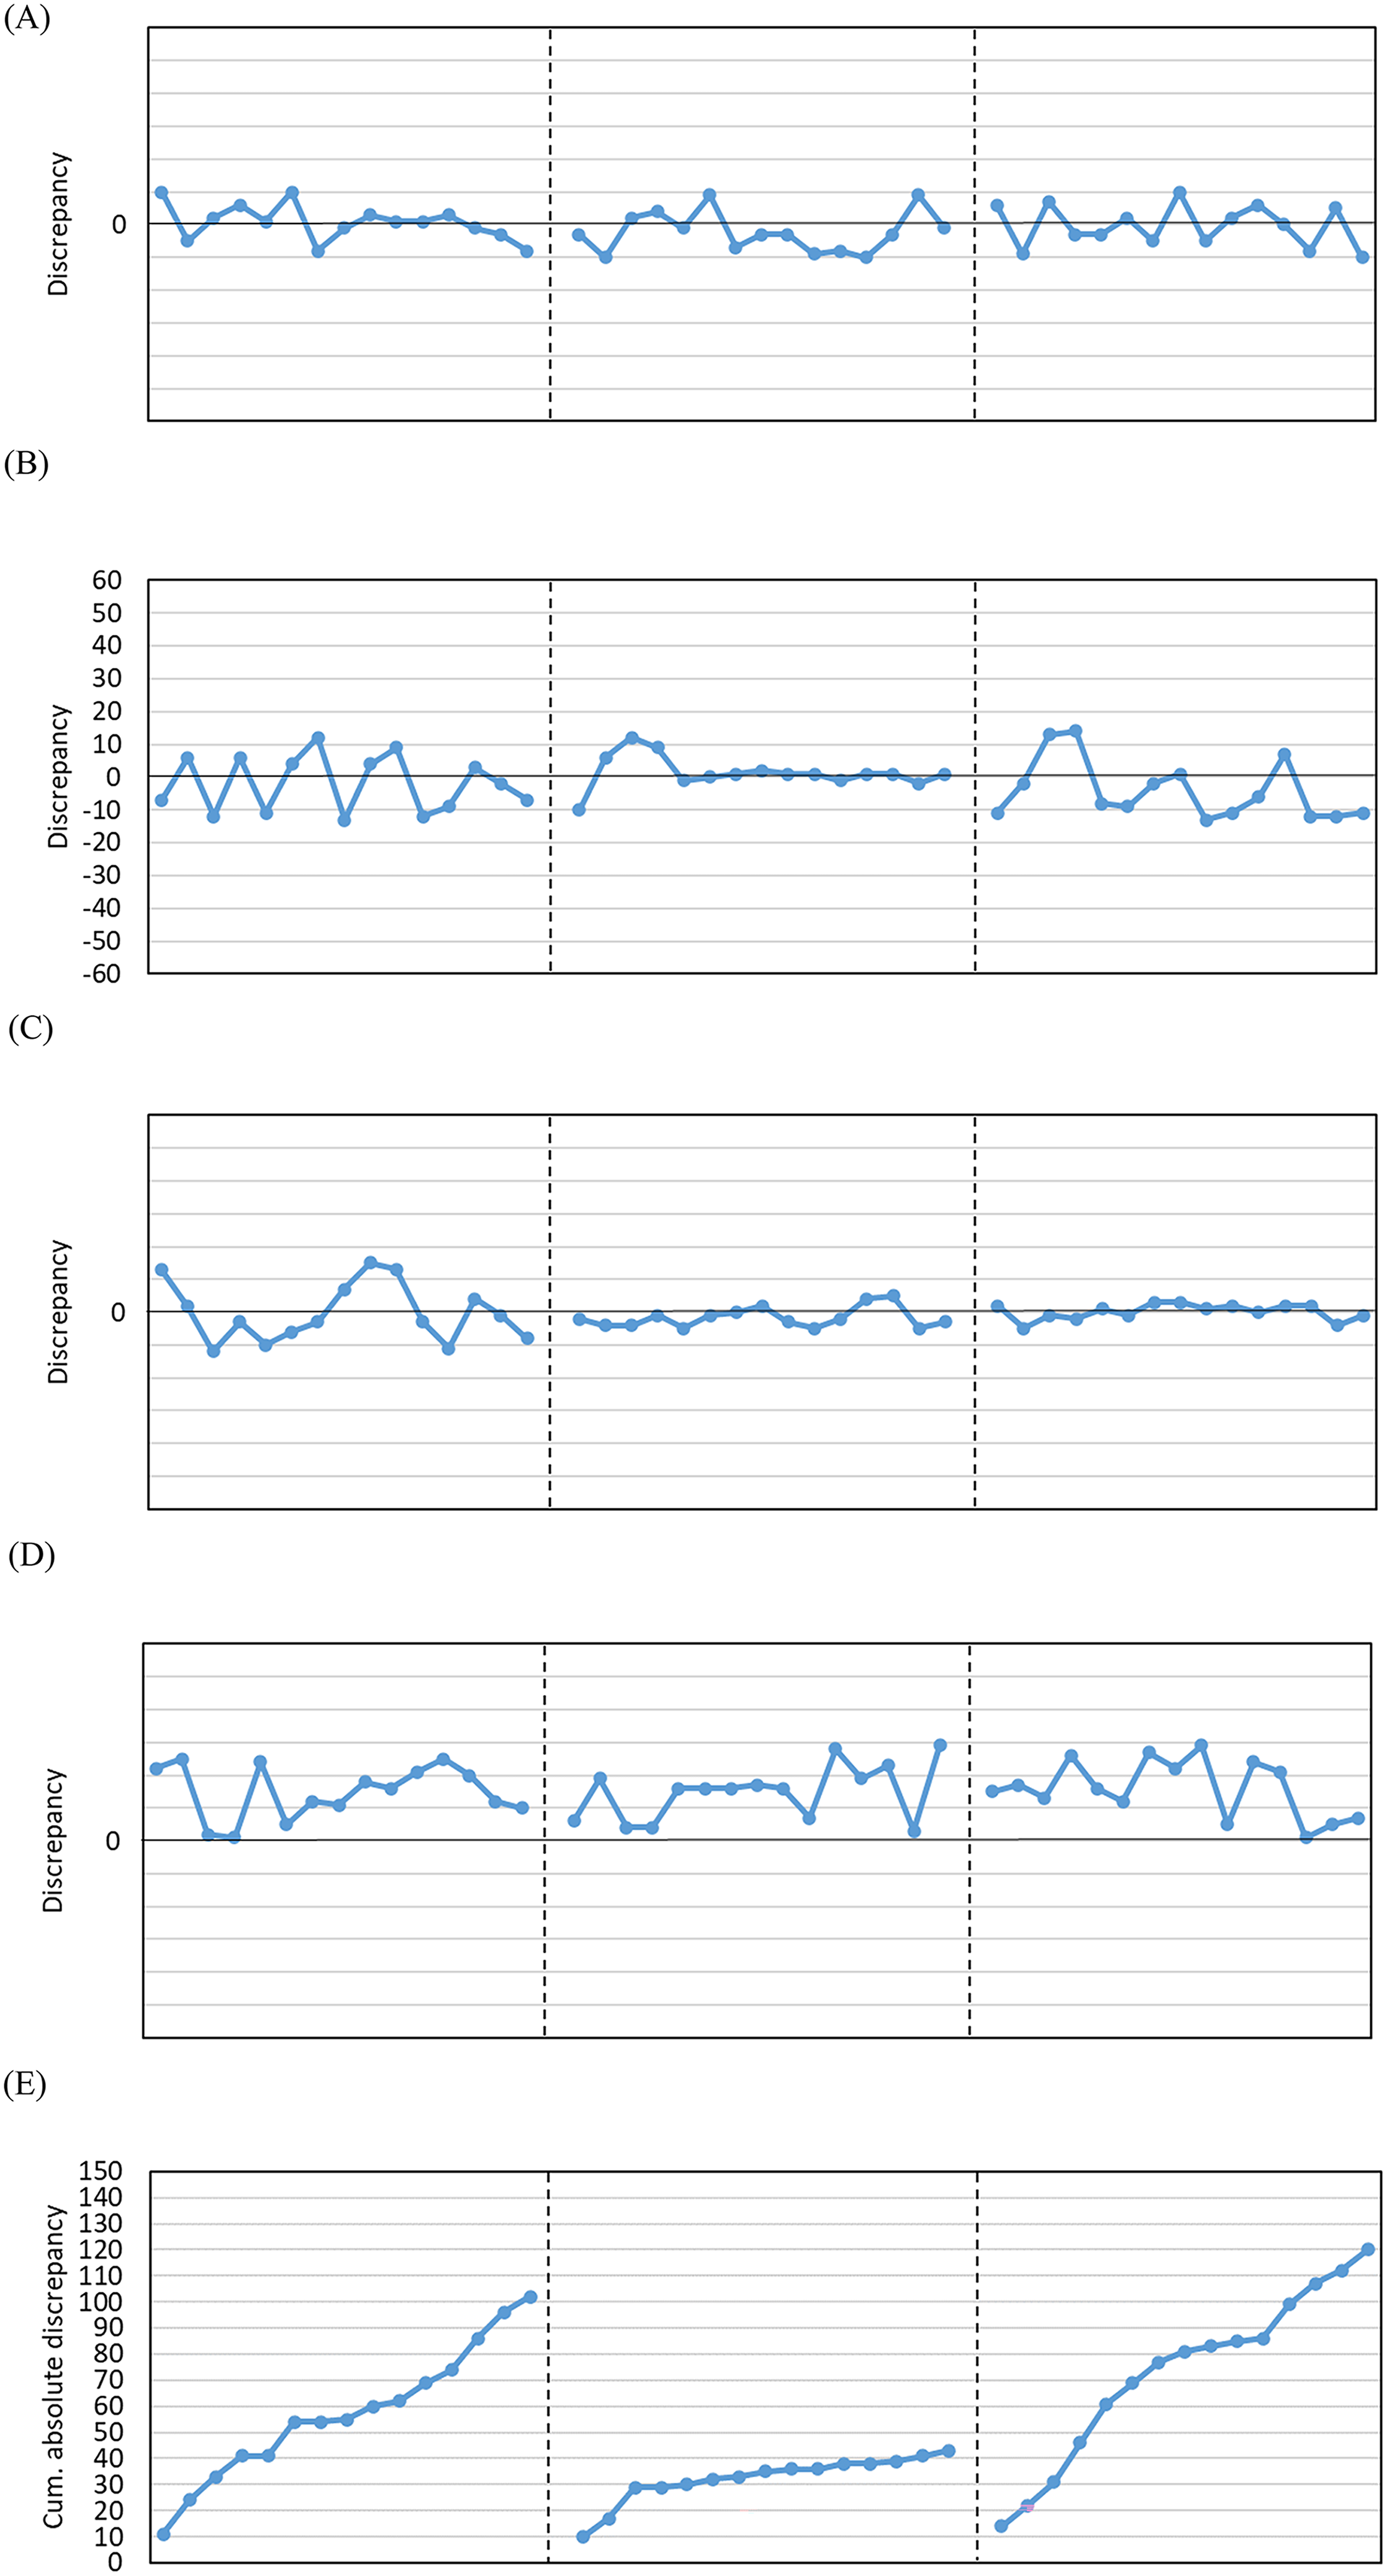
Examples of plots. (A) No effect in all phases. (B) Ideal, but temporary effect. (C) Ideal, sustained effect. (D) No effect + over-estimation tendency. (E) Ideal, but temporary effect cumulative absolute discrepancy plot.
Lastly, to evaluate the pedagogical effectiveness of our activity, we asked all students to provide evaluative feedback through two open-ended questions (i.e., “What have you learnt from this tutorial”, and “Please describe what aspects of this tutorial helped you learn about single-subject designs?”), and one 5-point Likert scale item (i.e., “How useful was this tutorial in helping you understand single-subjects designs?”) from 1 (not useful at all) to 5 (very useful).
Results
All data are available at https://osf.io/nk65q/. Among the 59 students who contributed feedback and gave consent for publication, results revealed that these students found the tutorial activity useful in understanding SSDs (M = 4.61, SD = 0.52). We subsequently analyzed the qualitative feedback of the two open-ended questions by conducting a summative content analysis (Hsieh & Shannon, 2005).
Specifically, the second author (WJ) screened the responses for relevancy and analyzed the text using manifest and latent content analysis (Green & Thorogood, 2004, pp. 177–180). Firstly, WJ analyzed students’ responses for keywords and phrases (‘manifest codes’; Kondracki et al., 2002; Potter & Levine-Donnerstein, 1999). Single-worded or ambiguous responses that did not contain meaningful information were excluded from analyses. Then, WJ interpreted the contexts associated with these keywords to ascertain the underlying meanings of these key words and phrases (‘latent codes’; Griffiths, 2016). To demonstrate the credibility of the ‘latent codes’ (i.e., textual evidence is consistent with the interpretation), the first author (DX) cross-checked the keywords emerging from the responses and the interpretations of these keywords. Responses to the open-ended questions were summarised according to the following two domains: learning points and usefulness, and facilitators for learning SSDs.
Learning Points and Usefulness
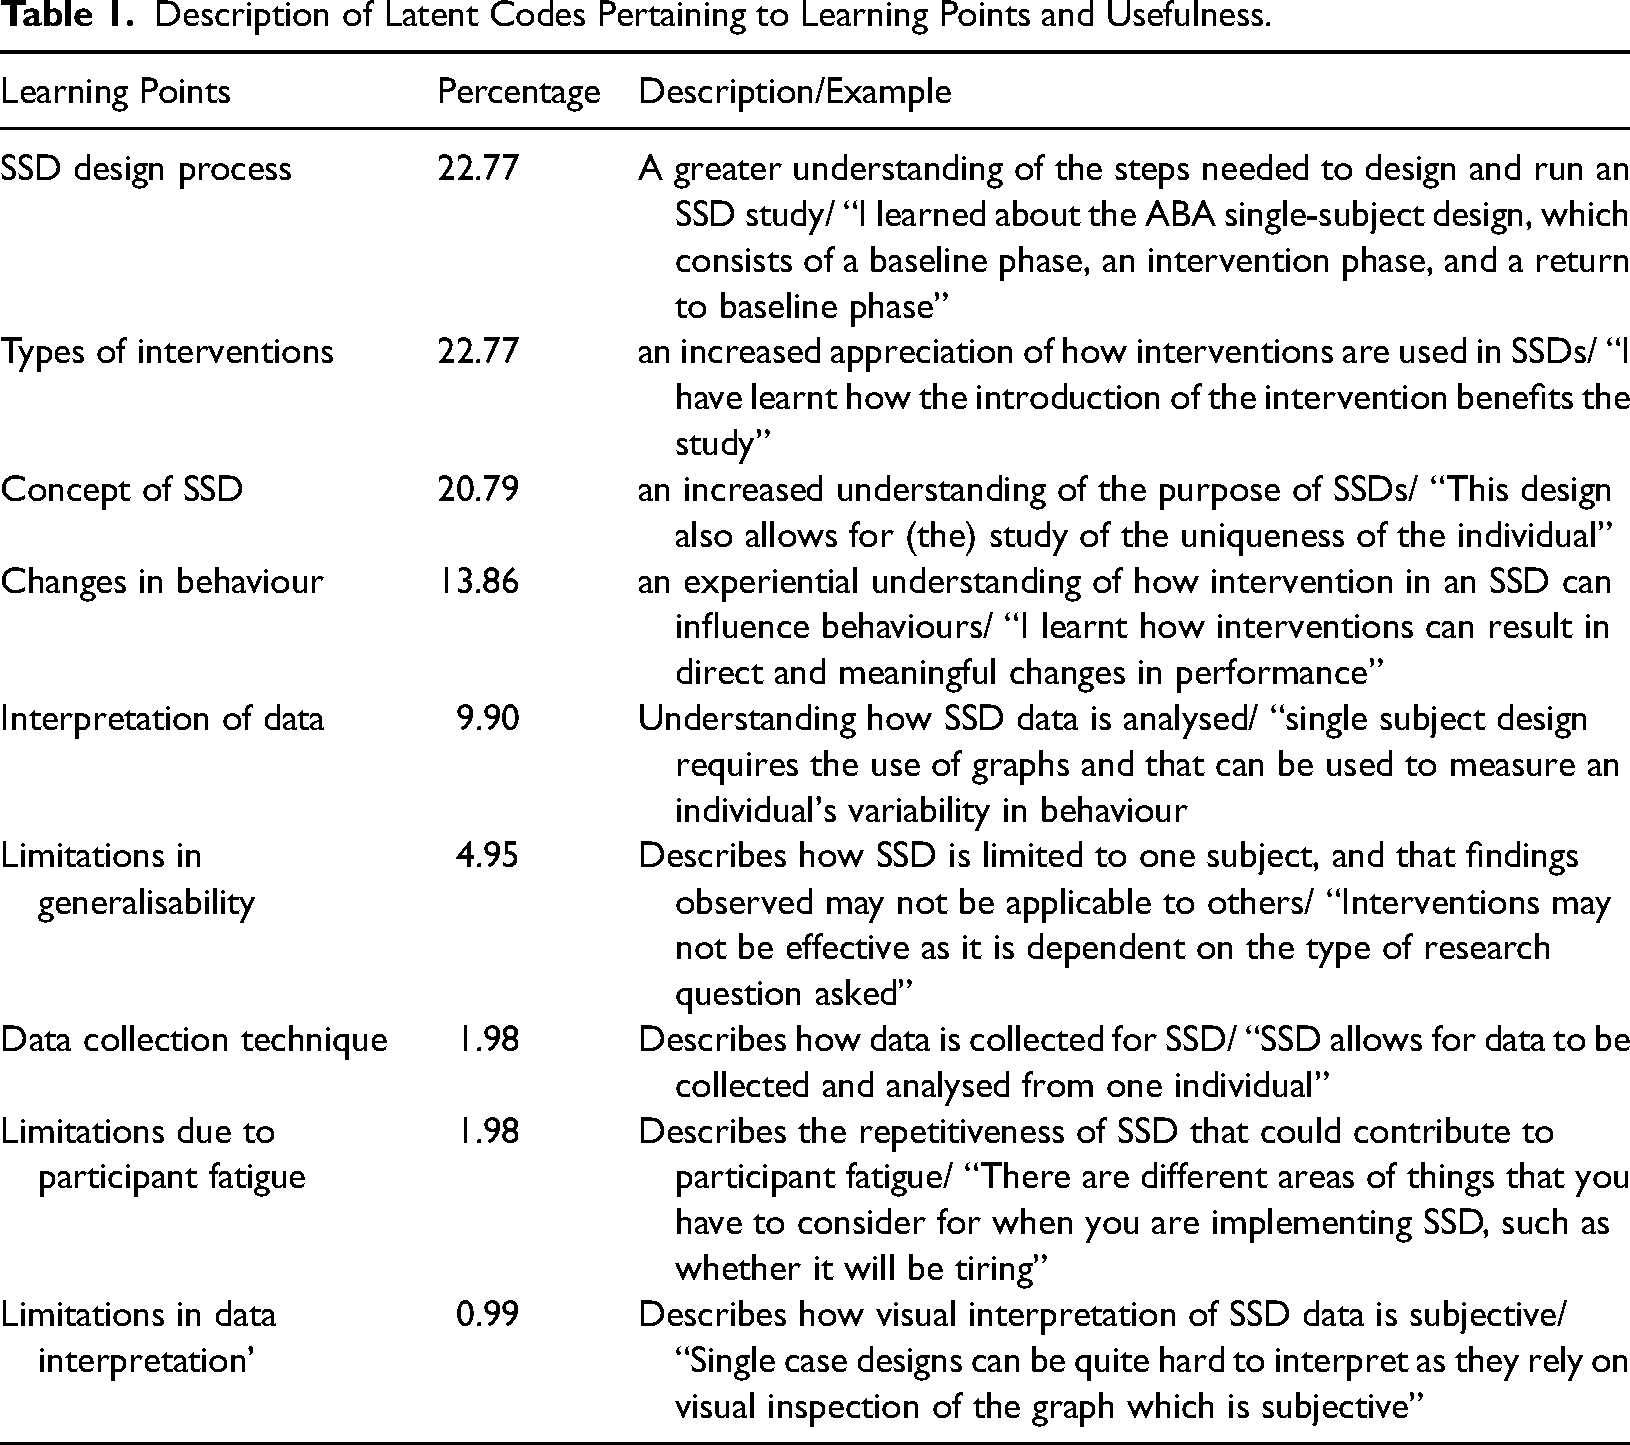
From the responses to the question (“What have you learnt from the tutorial?”), we identified a total of 101 manifest codes. Examples of manifest codes include “need to consider the number of trials needed” and “if the intervention implemented is helpful towards what we are doing”. From the manifest code, nine latent codes were further identified (Table 1). Results suggested that the key learning points of our SSD tutorial activity were ‘SSD design process’ (22.77%), ‘types of interventions’ (22.77%), ‘concept of SSD’ (20.79%), and ‘changes in behaviour’ (13.86%), because these latent codes explained more than 80% of the manifest codes.
Description of Latent Codes Pertaining to Learning Points and Usefulness.
Facilitators for Learning SSDs
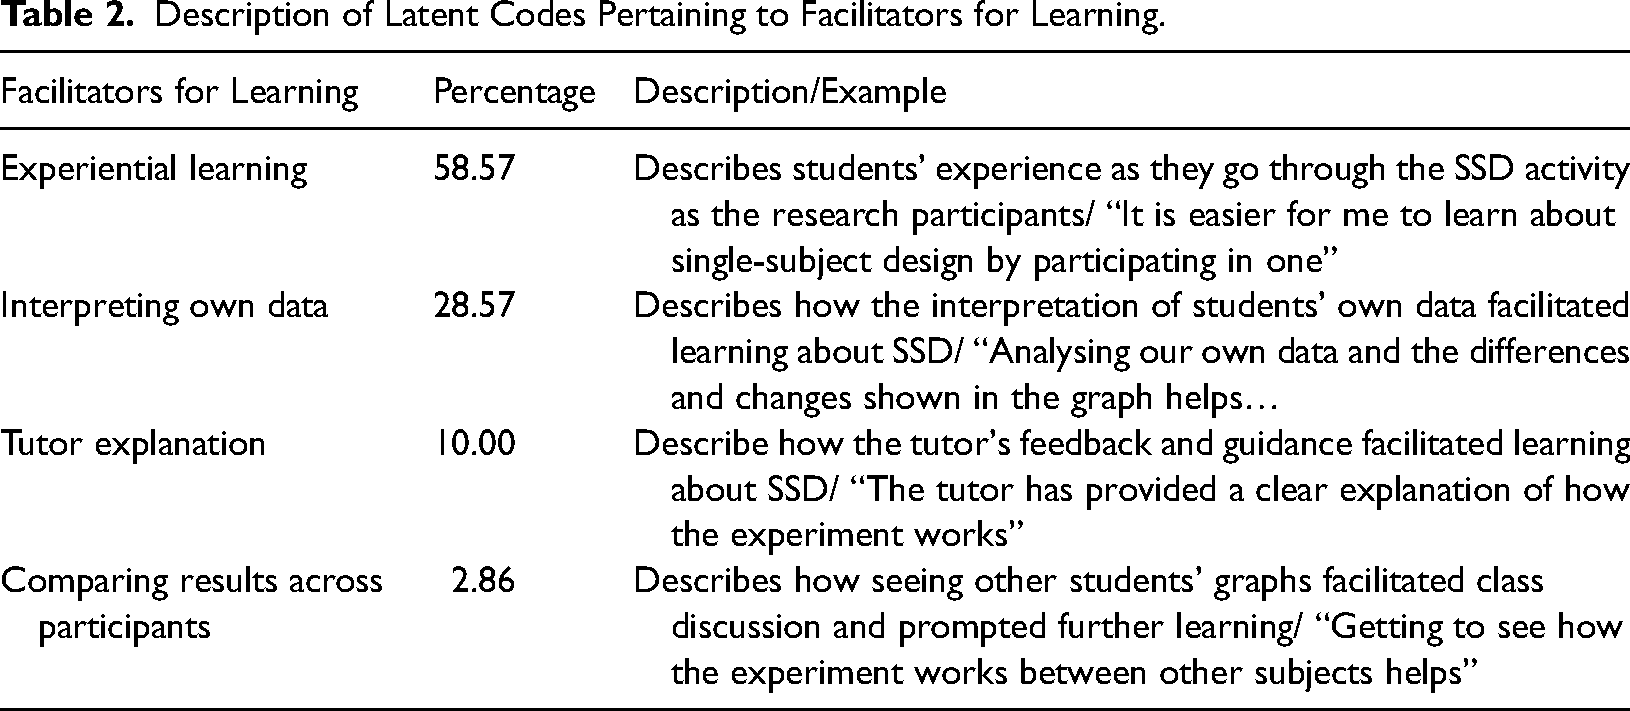
From the responses to the question (“Please describe what aspects of this tutorial helped you learn about single-subject designs?”), we identified a total of 70 manifest codes. Examples of manifest codes include “by participating in one” and “plotting my own graph”. Four latent codes were further identified, where the ‘Experiential learning’ (58.57%) and ‘Interpreting own data’ (28.57%) explained more than 85% of the manifest codes and represented the key facilitators to learning SSDs in our tutorial activity (Table 2).
Description of Latent Codes Pertaining to Facilitators for Learning.
Discussion
In this paper, we introduce a unique tutorial activity, guided by five considerations: experiential learning, the incorporation of substantial but not straightforward effects, adaptability for both online and face-to-face delivery, the capacity to induce personal changes, and relevance to psychology. Through the tutorial activity, students gained an understanding of the ‘SSD design process’, the ‘types of interventions’ typically used in SSDs, the research purpose and rationale for using SSDs (‘concept of SSD’), and the types of outcomes assessed in SSD research (‘changes in behaviour’). Overall, most students found the tutorial activity useful in enhancing their understanding of SSD and humans’ number sense, with all but one student rated its usefulness at 4 or higher on a 5-point scale. Key features of the tutorial activity that facilitated students’ understanding were the experiential learning component, where students experienced an SSD experiment as a participant (‘Experiential learning’) while observing their own performance change through analyzing their own data (‘Interpreting own data’). Should an instructor wish to infuse even more psychological relevance into the activity, either as a teaser to hook students into the tutorial at the start, or to stoke the flames of curiosity at the end of the tutorial, information regarding the developmental aspects of numerosity (Izard et al., 2009), how accuracy varies across age (Halberda et al., 2012), how numerosity predicts mathematical proficiency (Halberda et al., 2008), or the mechanisms behind numerosity judgments could be introduced (e.g., Cicchini et al., 2016).
The tutorial activity presented in this paper gives psychology educators another way to teach SSD, broadening their teaching options. That is, while there are teaching options that focus on theoretical aspects of SSD (e.g., Walker & Rehfeldt, 2012) or involve interventions that are time-consuming (e.g., personalized behavior change projects; Morgan, 2009), the tutorial activity described in this paper is experiential, can be conducted within a single tutorial session, easily adapted to various contexts (e.g., physical, asynchronous, or synchronous teaching formats), and can be easily adjusted to cater to different levels of understanding. For more advanced students, the SSD tutorial activity can be expanded to include more SSD paradigms, such as the multiple baseline design (where the intervention phase begin differently for participants), changing criterion design (where the color or the shape of the dots are changed), and examine additional constructs, such as assessing whether student's belief in accuracy changes across the phases (Rollwage et al., 2018). Educators may also use our activity as an introductory activity to SSD, which takes about 15 min to implement, before getting students to work on other projects that are personalized to the curriculum.
Educators may use our stimuli (https://osf.io/nk65q/) or use our codes as a template for creating their own stimuli. There are at least 54 different patterns of results that could be plotted because there were 3 (type of effect: no, temporary, sustained) × 3 (estimation tendency: underestimation, accurate, overestimation) × 3 (type of computed scores: discrepancy scores, absolute scores, cumulative absolute scores) × 2 (temporal effects: delayed vs immediate) permutations. Our Excel templates contain enough information for users to modify the formula to suit their needs. We emphasized that the efficacy of the tutorial activity may be effective for some but not all students, given that there were eleven students who chose not to give consent. It is possible that these non-consenters may hold negative feedback towards the activity but chose not to disclose their feedback out of respect for their tutors. Nevertheless, psychology educators can easily adapt this newly developed tutorial activity based on students’ characteristics and level of understanding.
In summary, the online experiential activity shared in this paper provides a versatile pedagogical tool for teaching students about single-subject designs. The activity allows students to experience the SSD design process themselves while providing tutors with the autonomy to run the activity across online and physical classrooms. The activity (i.e., presenting stimuli in the ABA phases) can be executed in less than 15 min and may be a useful addition to the instruction on psychological research methods. Lastly, with the five guidelines we outlined earlier, we hope to inspire educators to devise other meaningful SSD activities.
Supplemental Material
sj-docx-1-plj-10.1177_14757257241302565 - Supplemental material for Creating a Dot-Counting Single-Subject Design Tutorial
Supplemental material, sj-docx-1-plj-10.1177_14757257241302565 for Creating a Dot-Counting Single-Subject Design Tutorial by Da Xuan Ng, Wei Jun Marc Chao and Kai Qin Chan in Psychology Learning & Teaching
Supplemental Material
sj-docx-2-plj-10.1177_14757257241302565 - Supplemental material for Creating a Dot-Counting Single-Subject Design Tutorial
Supplemental material, sj-docx-2-plj-10.1177_14757257241302565 for Creating a Dot-Counting Single-Subject Design Tutorial by Da Xuan Ng, Wei Jun Marc Chao and Kai Qin Chan in Psychology Learning & Teaching
Supplemental Material
sj-xlsx-3-plj-10.1177_14757257241302565 - Supplemental material for Creating a Dot-Counting Single-Subject Design Tutorial
Supplemental material, sj-xlsx-3-plj-10.1177_14757257241302565 for Creating a Dot-Counting Single-Subject Design Tutorial by Da Xuan Ng, Wei Jun Marc Chao and Kai Qin Chan in Psychology Learning & Teaching
Footnotes
Declaration of Conflicting Interests
The authors declared no potential conflicts of interest with respect to the research, authorship, and/or publication of this article.
Funding
The authors disclosed receipt of the following financial support for the research, authorship, and/or publication of this article: This research was published under a Read and Publish agreement between James Cook University and SAGE Publishing, which covered the article processing charges (APC) for this publication.
Supplemental Material
Supplemental material for this article is available online.
Notes
Author Biographies
References
Supplementary Material
Please find the following supplemental material available below.
For Open Access articles published under a Creative Commons License, all supplemental material carries the same license as the article it is associated with.
For non-Open Access articles published, all supplemental material carries a non-exclusive license, and permission requests for re-use of supplemental material or any part of supplemental material shall be sent directly to the copyright owner as specified in the copyright notice associated with the article.