
Abstract
Although research literacy is necessary for the competent delivery of psychological services, many psychology students hold negative attitudes toward research subjects. The current study explored undergraduate students’ perceptions of research subjects relative to nonresearch subjects. A sample of 249 Australian (45.4%) and Singaporean (54.6%) first-year university students (Mage = 21.27, SDage = 5.14, females = 75.9%) indicated their interest in, and perceived value of, 32 psychology subjects (based on title and a short description). They also nominated their most/least interested and valued subject and provided a free-text explanation for their selections. Participants perceived research subjects as significantly less interesting and valuable relative to nonresearch subjects (d values were indicative of a large difference for interest and a small-to-medium different for value). Cluster analysis indicated that research subjects are seen as distinct, forming their own cluster. This finding was supported by thematic analysis of participants’ open-ended responses. Students considered research subjects to be especially difficult, requiring skills they did not possess or enjoy using (e.g., mathematics), and lacking relevance to their future studies and intended careers. The findings suggest that research methods instructors should aim to emphasize the relevance of research to practice in high interest areas (e.g., psychopathology).
Keywords
An evidence-based approach is crucial for the competent delivery of psychological assessments and interventions (International Association of Applied Psychology and International Union of Psychological Science, 2016). Employing an evidence-based approach to the provision of psychological services necessitates the ability to identify, comprehend, and critique empirical research. Accrediting bodies in Australia, Canada, the UK, and the US all identify research literacy as a vital competency for psychology graduates (American Psychological Association, 2013; Australian Psychology Accreditation Council [APAC], 2019; Canadian Psychological Association, 2021; Quality Assurance Agency for Higher Education, 2019). The importance of this graduate competency is reflected in university curricula. In the US, practically all undergraduate psychology programs offer research methods subjects 1 and the vast majority offer statistics subjects (Norcross et al., 2016). Similarly, in Australia, all accredited three-year psychology programs include at least one dedicated research methods and statistics subject (Maher et al., 2023), and all accredited fourth-year (preprofessional) programs require students to carry out a substantive research project (APAC, 2019).
Despite the importance of understanding research to psychological practice, students tend to dislike research methods and statistics subjects (Rajecki et al., 2005; Vittengl et al., 2004). This aversion may stem from the inherent difficulty of the topic or anxiety about having to employ statistical analyses. Indeed, students report finding fundamental research methods concepts difficult to comprehend (Stoa et al., 2022) and perceive statistics to be more difficult than other subject areas (Zeidner, 1991). In one study, over half of Finish students reported difficulties learning quantitative methods (Murtonen, 2005). Mathematics and statistics anxiety are common among students (Dowker et al., 2016; Ruggeri et al., 2008) and can lead to study procrastination or even total avoidance (Dowker et al., 2016; Onwuegbuzie, 2004). Many students identify performing statistical analyses as a major challenge to their ability to successfully complete research subjects (Strohmetz et al., 2023). Related to statistics anxiety is research process anxiety, concerning fear of research language and the broader application of research knowledge (Balloo, 2019; Onwuegbuzie, 1997).
Another potential cause of students’ aversion to research methods is the perception that the topic lacks relevance (Vittengl et al., 2004). A survey of US research methods instructors found that most believe the primary purpose of research methods subjects is to develop students’ capacity to think scientifically (Ciarocco et al., 2017). In contrast to faculty, students are more likely to view the primary purpose of research subjects as learning how to conduct research (Strohmetz et al., 2023). While scientific thinking and research skills/practices are related, many authors do conceptualize these as being distinct (see Diaz et al., 2023; Garcia-Carmona, 2023). For example, in Murtonen and Salmento's (2019) model of scientific thinking, research skills are just one component of scientific thinking alongside critical thinking, epistemic understanding (recognizing the limitations of scientific knowledge), evidence-based reasoning, and contextual understanding (situating knowledge in certain contexts, e.g., within one's discipline).
Students who view the primary purpose of research subjects as learning to conduct research may undervalue such subjects if they believe that they will not engage in research activities in the workforce. Indeed, many students do believe that they will not engage in research in their careers (Murtonen et al., 2008). Further, many students are largely unaware of careers available to psychology graduates beyond counseling, such as market research or data analytics (Collisson & Eck, 2022). Mere exposure to research methods content may not be enough to shift students’ perceptions of the value of research. One longitudinal study found that students’ perceptions of the utility of research methods and statistics actually declined after taking a research methods subject (Sizemore & Lewandowski, 2009).
A dramatic demonstration of students’ lack of interest in research subjects comes from Uttl et al. (2013). As part of this study, Canadian first-year undergraduates were presented with a list of psychology subjects—three of which focused on statistical analysis methods—and asked to rate their interest in each. Students reported far less interest in quantitative subjects than nonquantitative subjects (in fact, of 43 subjects, the three quantitative subjects were rated lowest in terms of interest). These findings held among both psychology and nonpsychology majors. This lack of interest is problematic as subject area interest promotes deep learning (Harackiewicz & Hulleman, 2010).
It is commonly assumed that perceiving a subject area to have utility value (an object's usefulness to one's current or future goals; Harackiewicz & Hulleman, 2010) will promote interest in that area. Indeed, models of interest typically recognize both feeling-related valences (feelings associated with an object) and value-related valences (perceived personal relevance of an object) as fundamental aspects of interest (Eccles & Wigfield, 2002). For example, Hidi and Renninger's (2006) model of academic interest development posits that individual interest in an academic domain develops from positive affective experiences with that domain, increased domain knowledge, and perceiving the domain to have value. The success of utility-value interventions (which manipulate perceptions of the utility value of an academic subject area) further indicates a link between value and interest. Such interventions have proven effective in promoting academic interest and achievement (Hulleman & Harackiewicz, 2021). There is even evidence to indicate that utility-value interventions are effective with undergraduate students studying psychology specifically (Hulleman et al., 2010). Drawing on this literature, we anticipated that students’ perceptions of the value of research subjects would be strongly linked to their interest in taking research subjects. Nonetheless, it is also possible that students could perceive research subjects as uninteresting, while also recognizing that they are of value to their future studies, desired careers, or the cultivation of a scientific mindset.
Current Study
The present study aimed to extend the work of Uttl et al. (2013) on research subject interest in three ways: 1) by investigating if Australian and Singaporean psychology students similarly show a lack of interest in research subjects relative to nonresearch subjects (as students’ perceptions of research can differ between countries; Murtonen, 2005), 2) by additionally measuring students’ perceptions of the value of research subjects (so that the relationship between value and interest can be explored in the context of research instruction), and 3) by qualitatively exploring the factors which drive subject interest and perceived value. The study employed a mixed-method approach in which undergraduate student participants were asked to rate a list of subjects in terms of interest and perceived value. Participants were also provided with an opportunity to elaborate on their reasoning for these ratings via open-ended questions. Specifically, we considered the following research questions and hypotheses:
RQ1: Do subjects cluster in relation to student interest and perceived value? H1: Participants will be less interested in research subjects relative to nonresearch subjects. H2: Participants will perceive research subjects to be less valuable than nonresearch subjects. H3: Participants’ perceptions of the value of research subjects will positively correlate with research subject interest. RQ2: What factors influence students’ perceptions of how interesting and valuable they perceive subjects to be?
Method
Design and Procedure
The present study employed an online survey design with a convenience sample of first-year undergraduate students. This study was approved by the Human Research Ethics Committee of James Cook University (approval ID: H8730).
A student research participation platform (SONA) was used to recruit students undertaking first year psychology subjects at the Australian and Singaporean campuses of James Cook University. First-year students were targeted for recruitment because they would not yet have taken a research subject (due to the sequence of the degree program at the authors’ institution); thus, their perceptions were less likely to be influenced by actual experiences of learning research methods. Participants were given course credit in exchange for their participation. A link to the study was also posted to social media groups aimed at Australian psychology students. The study was open from March 2022 to January 2023. It was administered through Qualtrics and took most participants around 20 min to complete.
Participants
Participants living outside of Australia or Singapore, and those who indicated that they were not in their first year of a bachelor or diploma degree program, were excluded from the final dataset. The final sample consisted of 249 student participants residing in Australia (n = 113, 45.4%) and Singapore (n = 136, 54.6%), aged between 17 and 61 years (M = 21.27, SD = 5.14). The majority of the sample identified as female (n = 189, 75.9%), whereas 53 participants identified as male (21.3%), and five participants identified as gender fluid or nonbinary (2.0%). Most participants (n = 194, 77.9%) were doing a psychology degree (e.g., Bachelor of Psychological Science, Bachelor of Psychology, Bachelor of Arts majoring in Psychology, etc), followed by a sports and exercise science (n = 22, 8.8%), speech pathology (n = 15, 6.0%), or social work degree (n = 12, 4.8%). Six (2.4%) participants were undertaking a degree related to some other subject area. Most participants were studying a bachelor's degree (n = 228, 91.6%), although some participants were studying at the diploma level (n = 10, 4.0%) and 11 participants (4.4%) did not provide this information.
Materials
Subject List
A list of 32 psychology subjects was generated based on the subjects offered at the authors’ institution, those listed in the Uttl et al. (2013) study, and the subject catalogue of the University of Melbourne (which is a much larger university than the authors’ institution). This was done to ensure that the list covered subjects taught across most Australian psychology degree programs (e.g., Personality) but also more niche electives offered at larger institutions (e.g., Psychology of Death and Dying). Each entry consisted of a title and a short (one-to-two sentence) description. An example subject title and description is “Environmental Psychology: This subject explores the psychological implications of natural and human-made and modified settings.” See Table 1 for the list of subjects and Supplementary Materials (Table S1) for subject descriptions in full. Participants were presented with this list twice: once in relation to subject interest and once in relation to perceived value. The order in which the subjects were presented was randomized.
Interest in, and Perceived Value of, Each Subject.
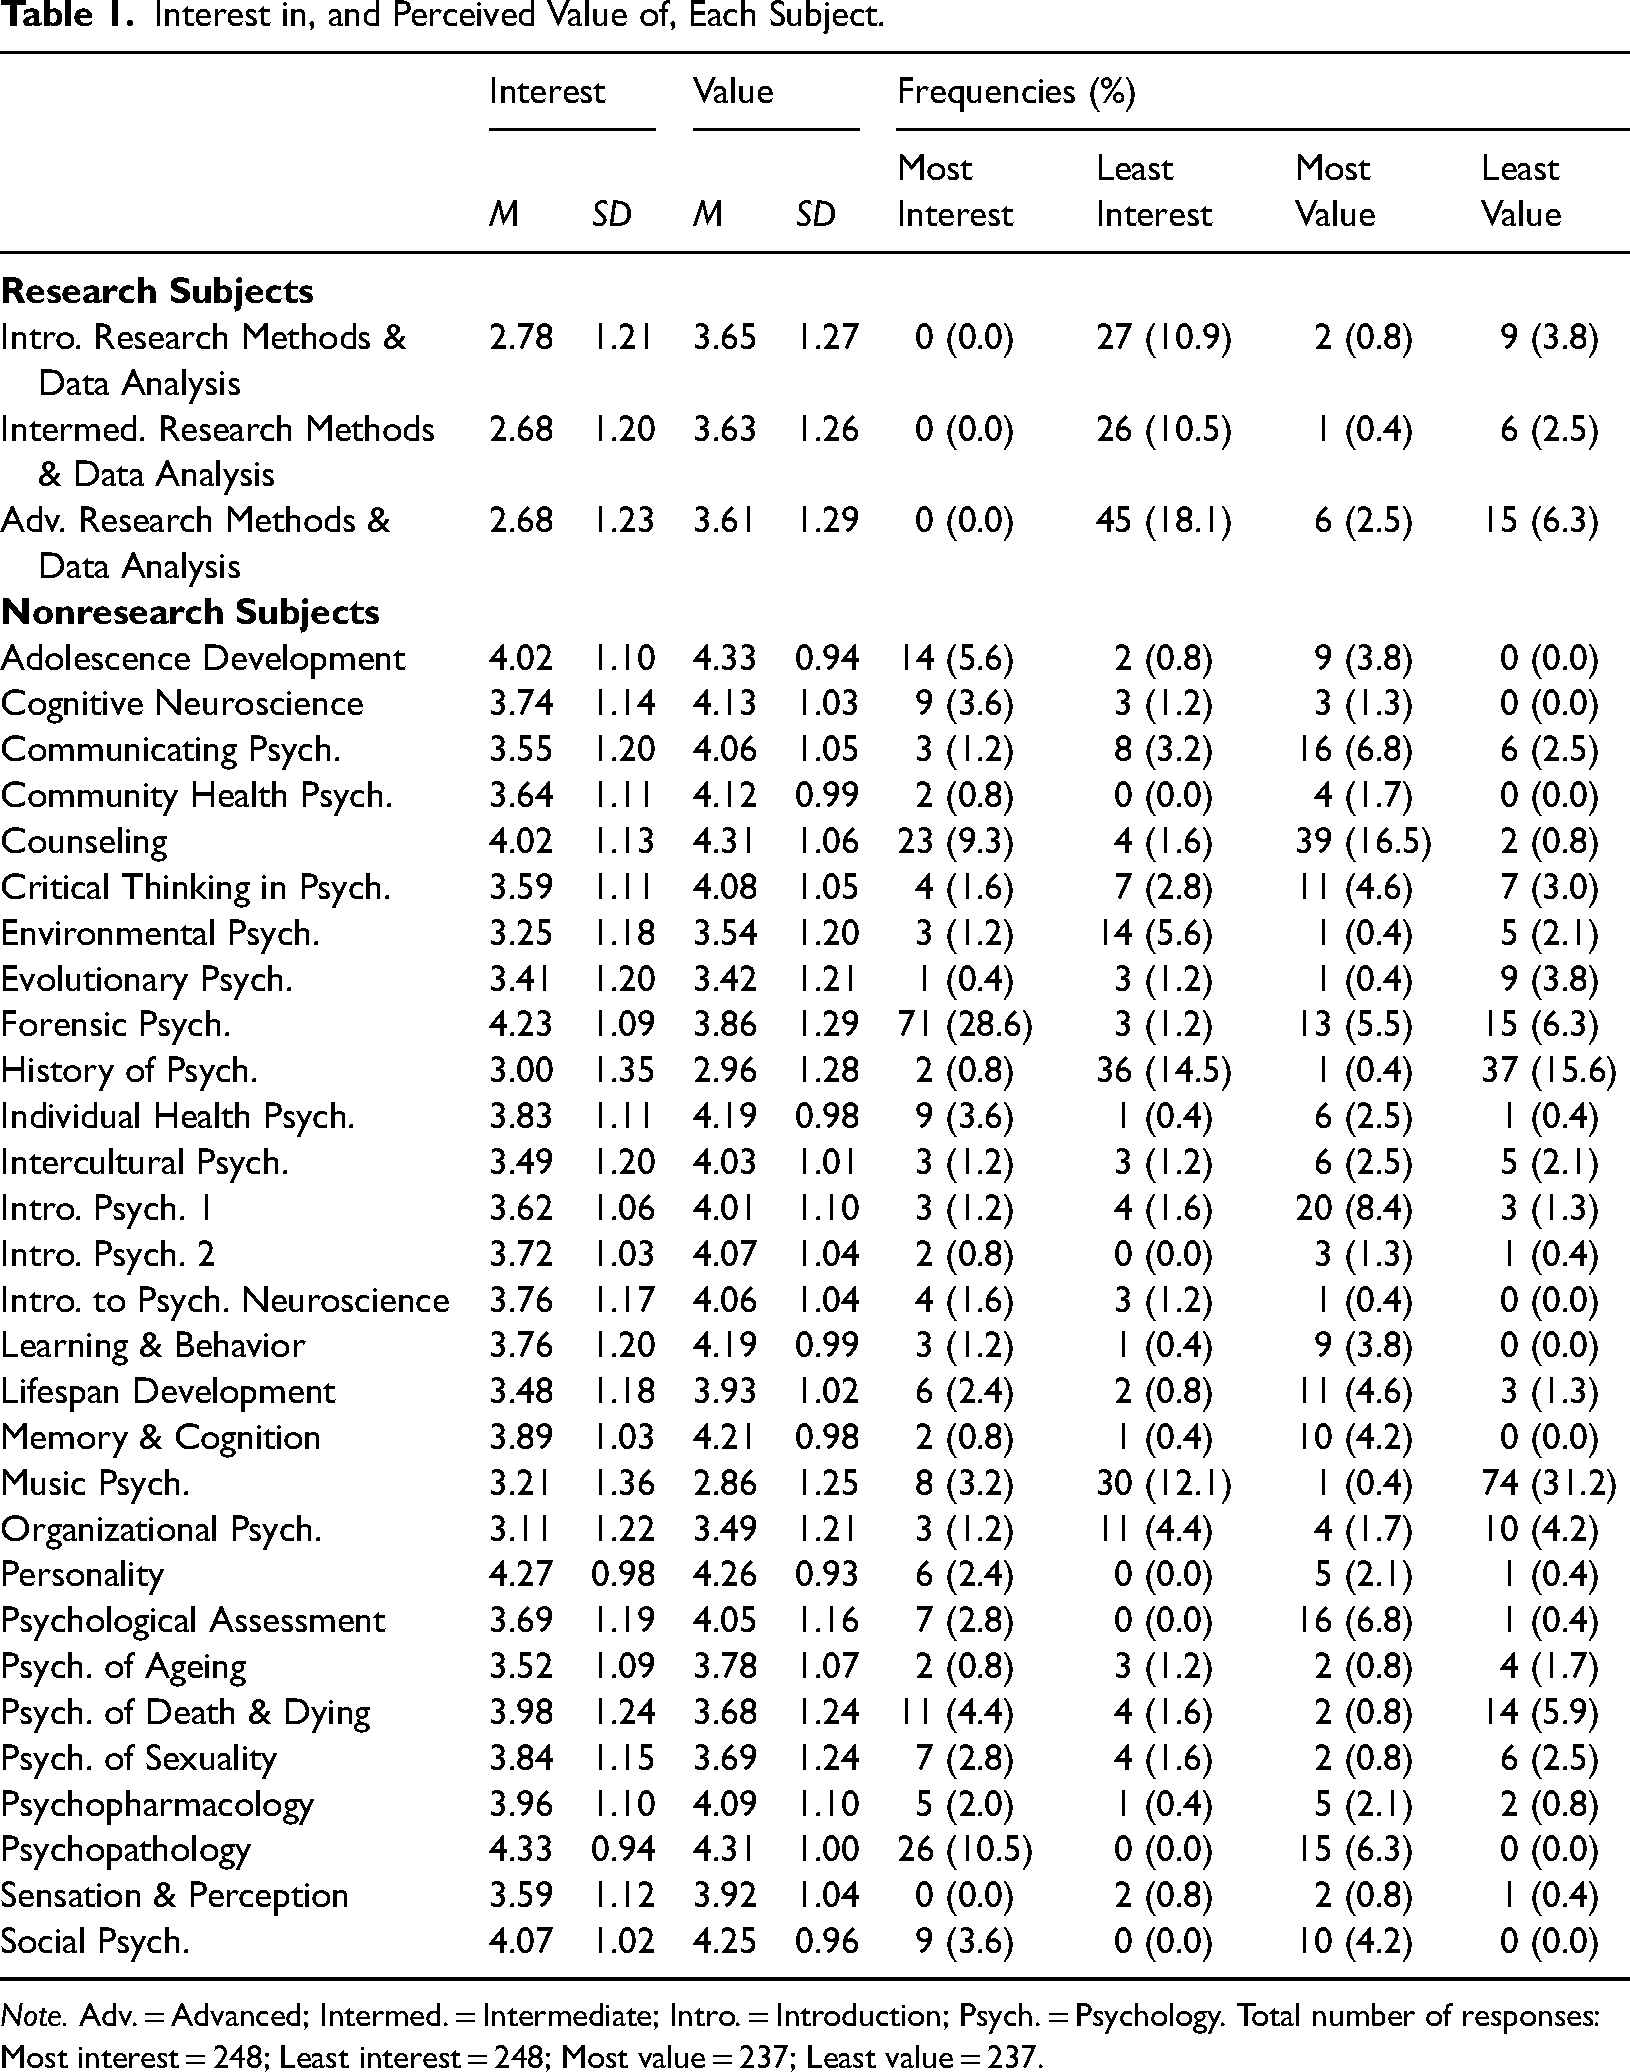
Note. Adv. = Advanced; Intermed. = Intermediate; Intro. = Introduction; Psych. = Psychology. Total number of responses: Most interest = 248; Least interest = 248; Most value = 237; Least value = 237.
Subject Interest and Value
Subject interest was measured on a 5-point scale where 1 = not at all interested and 5 = very interested. Participants were also asked to rate how valuable they believe each subject to be to their future career on a 5-point scale where 1 = not at all valuable and 5 = very valuable. Participants were instructed to respond based on “the information provided about the subject's content/focus, rather than who you might have as a teacher and/or at what point in your degree you may be at when taking the subject.”
Of the 32 subjects listed, three subjects related directly to research methods and statistical analysis: Introduction to Research Methods and Data Analysis, Intermediate Research Methods and Data Analysis and Advanced Research Methods and Data Analysis. Following Uttl et al. (2013), interest scores were averaged across these three subjects to produce an index of research subject interest. We followed the same method to get research subject value scores. The other 29 subjects were categorized as “non-research” 2 with responses being averaged across these subjects to produce nonresearch subject interest and nonresearch subject value scores. In all cases, high scores (range: 1–5) indicate greater interest or perceived value.
Participants were also asked to select (from drop-down lists) the subject they are most interested in taking, least interested in taking, believe will be most valuable to their future, and believe will be least valuable to their future. Four open-ended questions were also included to probe participants’ reasoning for these choices: “Thinking about the subject description you ranked highest [on interest]/ranked lowest [on interest]/ranked most valuable/ranked least valuable, what is the reasoning behind this ranking?”
Demographics
Participants were asked their age, gender, country of residence, degree of study (open-ended question), and their year level of study within this degree.
Data Analysis
Missing data were minimal across the 32 subject interest items (with no more than two missing datapoints for any one item). Across the 32 subject value items, all items were missing between 11 and 13 datapoints. For the purposes of creating scores representing research subject interest, research subject value, nonresearch subject interest, and nonresearch subject value, it was determined that if a participant had responded to at least 80% of relevant items (e.g., gave a value rating for at least 23 of the 29 nonresearch subjects) that a score would be calculated by averaging their available responses.
Participants’ perceptions of subject offerings were explored using descriptive statistics (means, standard deviations, frequency counts). RQ1 was investigated using k-means cluster analysis. k-Means clustering is a method for assigning datapoints to subgroups (clusters) based on their similarity on specified quantitative variables. It requires the researcher to indicate the number of clusters (k) in advance. Specifically, we performed cluster analysis using mean interest and value scores, treating each subject as a unit of analysis (see Perkovic et al., 2022, for a similar analytic approach). The analysis was performed in R using the factoextra package (v.1.0.7; Kassambara & Mundt, 2020). The NbClust package (v.3.0.1; Charrad et al., 2014), which produces 30 cluster number indices, was used to determine the optimal number of clusters in the dataset. We then applied the “majority rule” by determining the cluster solution with the greatest number of indices supporting it. Data were scaled prior to performing k-means clustering.
H1 and H2 were assessed via paired-sample t tests, with Cohen's d values being generated as effect size measures. H3 was assessed via Pearson's correlation coefficients. An auxiliary analysis in relation to H3 was conducted using the cocor R package (v.1.1-4; Diedenhofen & Musch, 2015). Specifically, the package was used to formally compare the magnitude of two dependent, nonoverlapping correlations. Following Silver et al.'s (2004) recommendations, Dunn and Clark's z test was employed for this purpose. Confidence intervals reported for this analysis were calculated according to the method recommended by Zou (2007). For all inferential tests, an α level of .05 was applied.
Reflexive thematic analysis (Braun & Clarke, 2019) was applied to the open-ended responses (RQ2). Braun and Clarke's (2013) six-step procedure was followed, such that the first author, third author and research assistant first familiarized themselves with the data, then generated codes. Clustering codes led to tentative themes. We adopted a reflexive, recursive approach, which was not focused on a specific theoretical underpinning. Rather, semantically similar responses guided the formation of themes and implicit concepts were also explored. Once themes were identified, the second author participated as a critical friend (Sparkes & Smith, 2014) working with the other two authors to refine, finalize, and label the themes. Because participants were asked to nominate a specific subject and, thus, were explaining their reasoning in relation to different subjects for each free-text response, four separate thematic analyses were performed. The final theme structures are supported by indicative participant quotes.
Results
Exploratory Quantitative Findings
Table 1 presents mean interest and value scores for each subject offering (a scatterplot detailing this information is depicted in Figure 1). Table 1 also reports the frequency with which participants nominated each subject offering as the subject they are most and least interested in taking and believe will be the most and least valuable to them. The greatest number of participants (n = 71, 28.6%) nominated Forensic Psychology as the subject they are most interested in taking, followed by Psychopathology (n = 26, 10.5%) and Counseling (n = 23, 9.3%). No participant was most interested in taking any of the three research subjects. Participants most frequently nominated Advanced Research Methods & Data Analysis as the subject they are least interested in taking (n = 45, 18.1%), followed by History of Psychology (n = 36, 14.5%) and Music Psychology (n = 30, 12.1%). In terms of most valuable subject, participants most frequently nominated Counseling (n = 39, 16.5%), Introductory Psychology 1 (n = 20, 8.4%), with Communicating Psychology and Psychological Assessment tying for third place (n = 16, 6.8%). For least valuable subject, the modal response was Music Psychology (n = 74, 31.2%) followed by History of Psychology (n = 37, 15.6%). Forensic Psychology and Advanced Research Methods & Data Analysis tied for third place (n = 15, 6.3%).
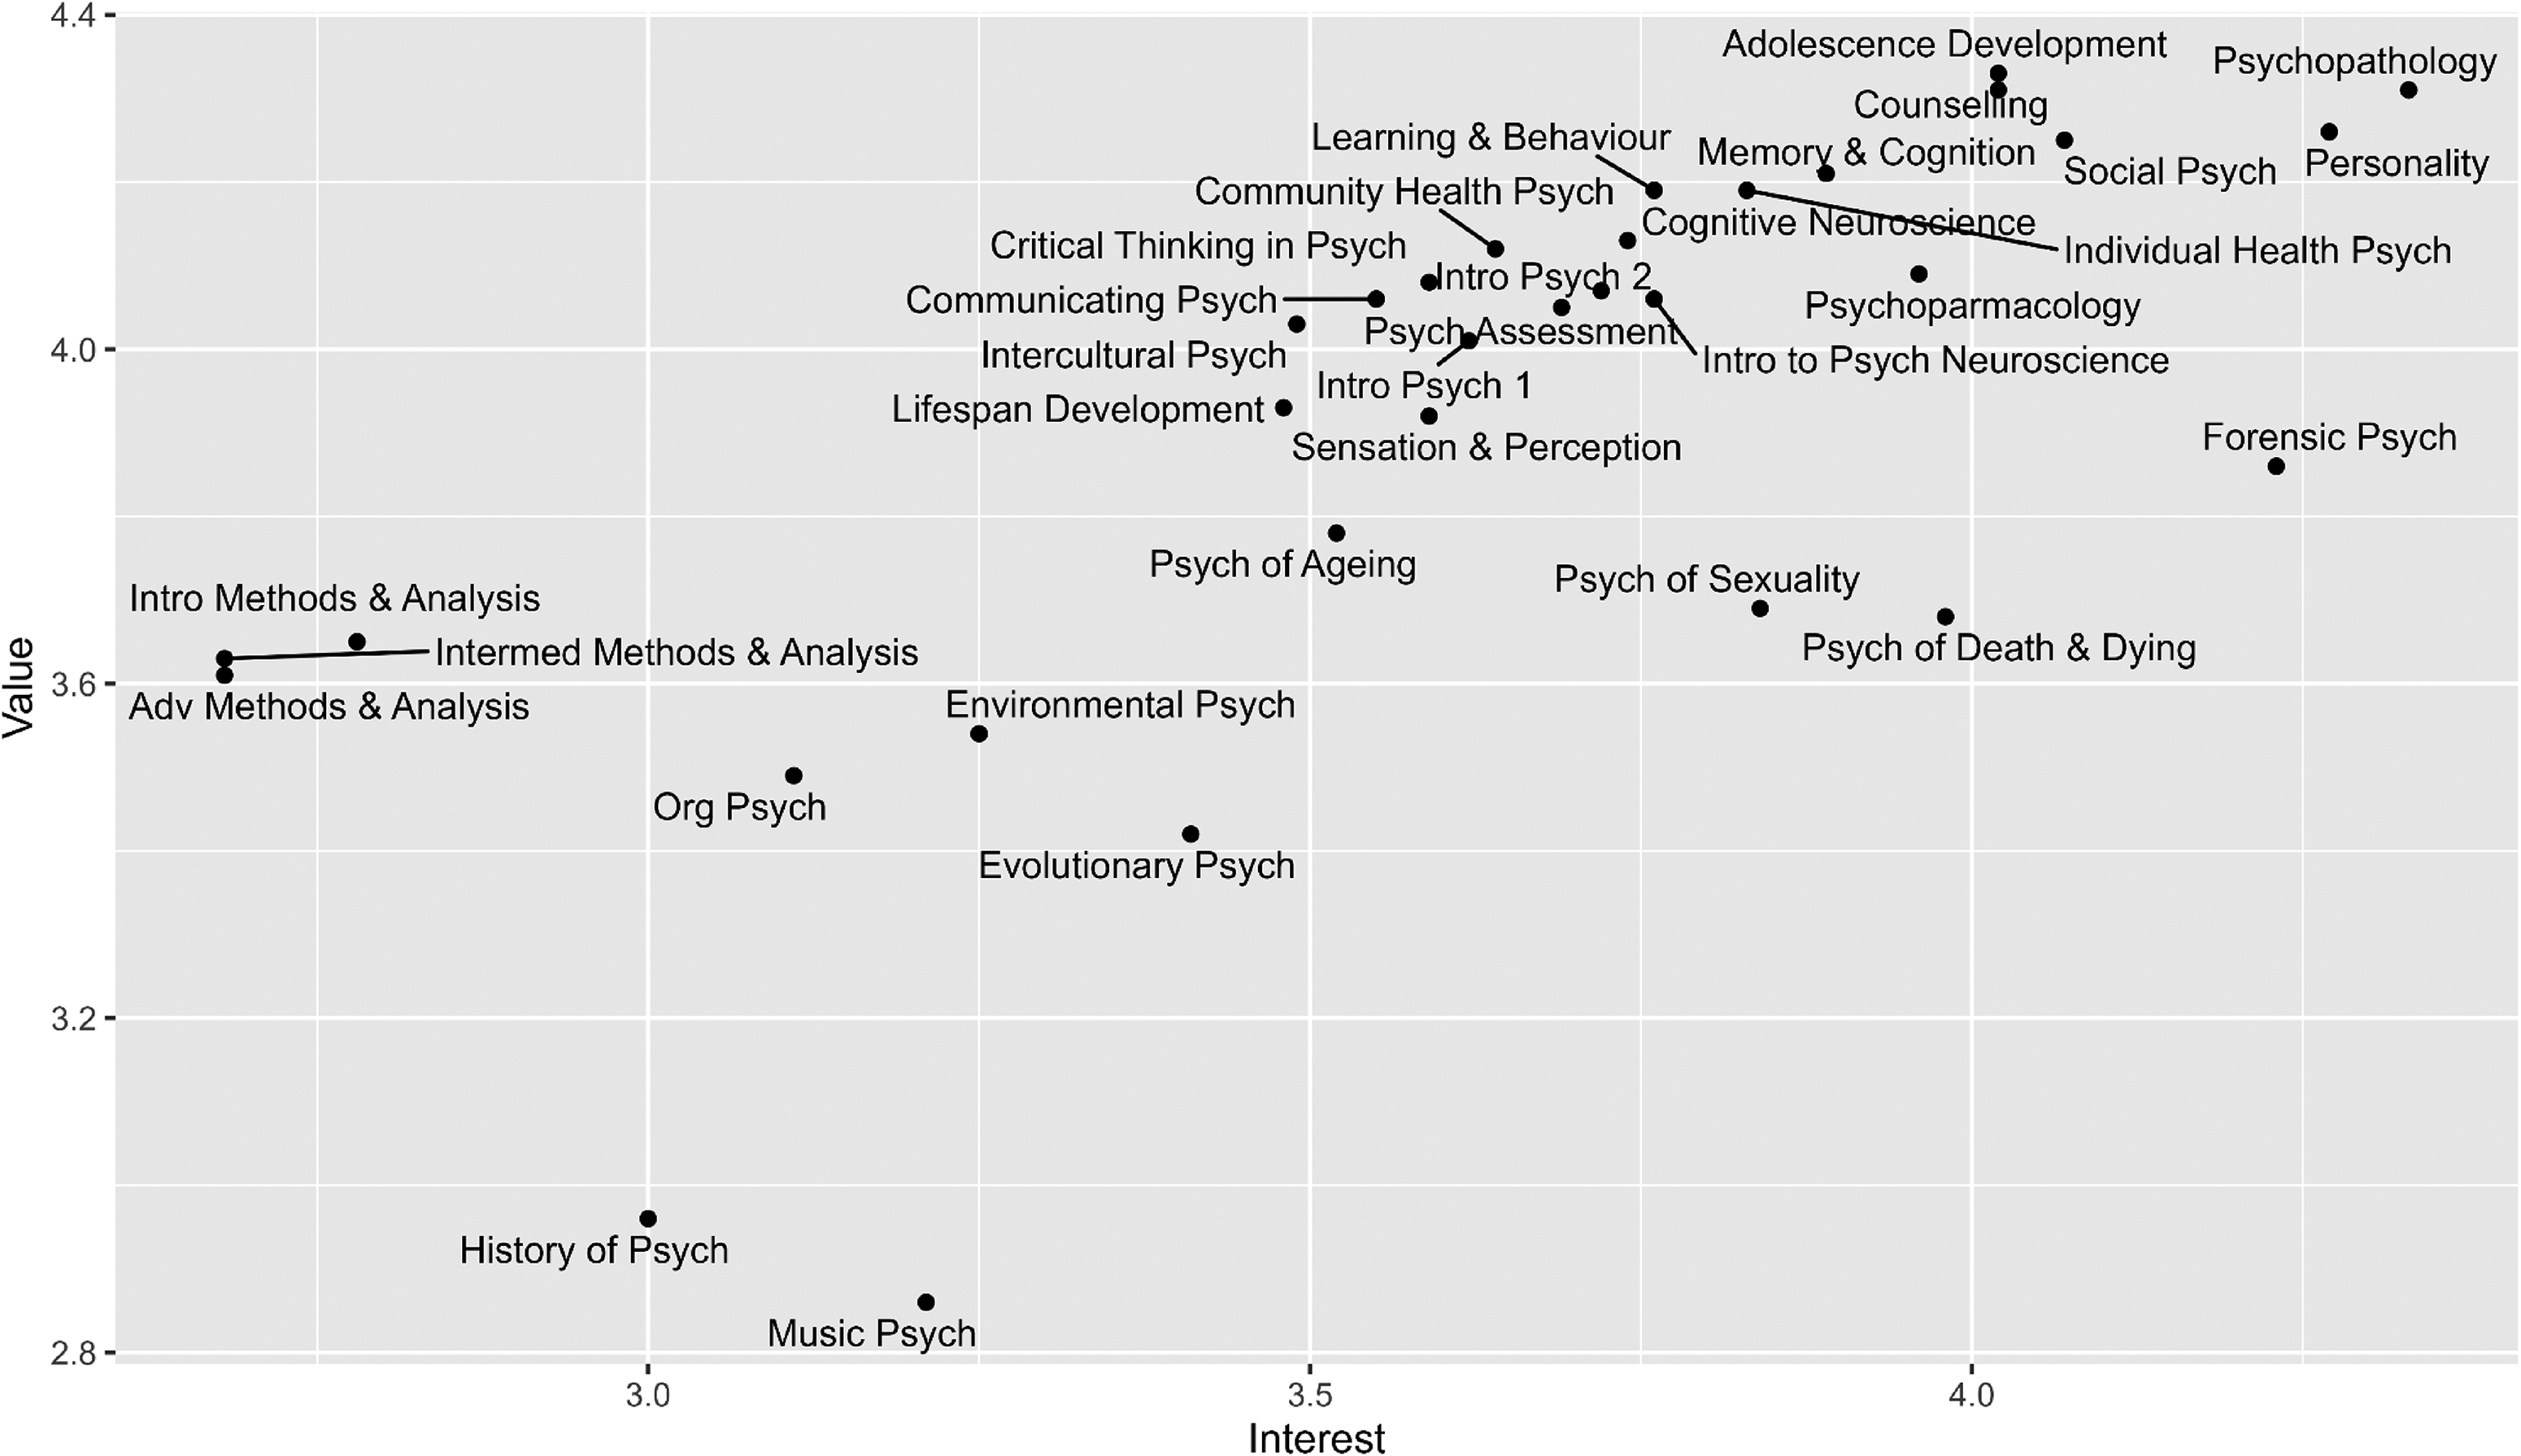
Scatterplot showing mean interest and perceived value for each subject.
Cluster Analysis
k-Means cluster analysis was applied to further explore the way subject offerings are perceived by first-year students (RQ1). Using the NbClust package (Charrad et al., 2014), 30 cluster tests were applied to the dataset. The majority rule indicated that 2 was the optimal number of clusters in the dataset (with 10 indices suggesting 2 as the optimal number of clusters—see Supplementary Materials, Table S2). However, five indices indicated that the dataset contained six clusters. Accordingly, it was reasoned that 6 might also be an informative number of clusters to extract and two cluster analyses were performed: k = 2 and k = 6.
The k = 2 analysis (see Supplementary Materials, Figure S1) produced a “high interest and high value” cluster exemplified by clinically oriented subjects such as Psychopathology and Counseling. A second “low interest and low value” cluster was observed consisting of subjects such as History of Psychology and Environmental Psychology. All three research subjects sat within this low interest and low value cluster.
In brief, in the k = 6 analysis, the two clusters from the k = 2 analysis separated into three clusters each (see Figure 2, and for a summary, see Table 2). Following the cluster numbering in Figure 2, Cluster 2 was composed of high interest and high value subjects, many of which have broad applicability to practice as a psychologist (e.g., Psychopathology, Personality, Social Psychology, Counseling, and Adolescent Development). Situated next to this (Cluster 3) was a cluster of middle interest and middle value subjects, many of which relate to academic skill development (e.g., Communicating Psychology and Critical Thinking in Psychology), or have utility for specific areas of clinical practice (e.g., Cognitive Neuroscience and Sensation & Perception) or work with specific populations (e.g., Intercultural Psychology and Psychology of Ageing). Cluster 6 consisted of subjects which are of high interest but mid-to-low perceived value (Psychology of Sexuality, Psychology of Death & Dying, and Forensic Psychology). Cluster 5 represented a low interest and low value cluster composed of Environmental Psychology, Organizational Psychology, and Evolutionary Psychology. Cluster 1 represented a low interest and very low value cluster composed of History of Psychology and Music Psychology. Finally, the three research subjects formed their own very low interest and low value cluster (Cluster 4).
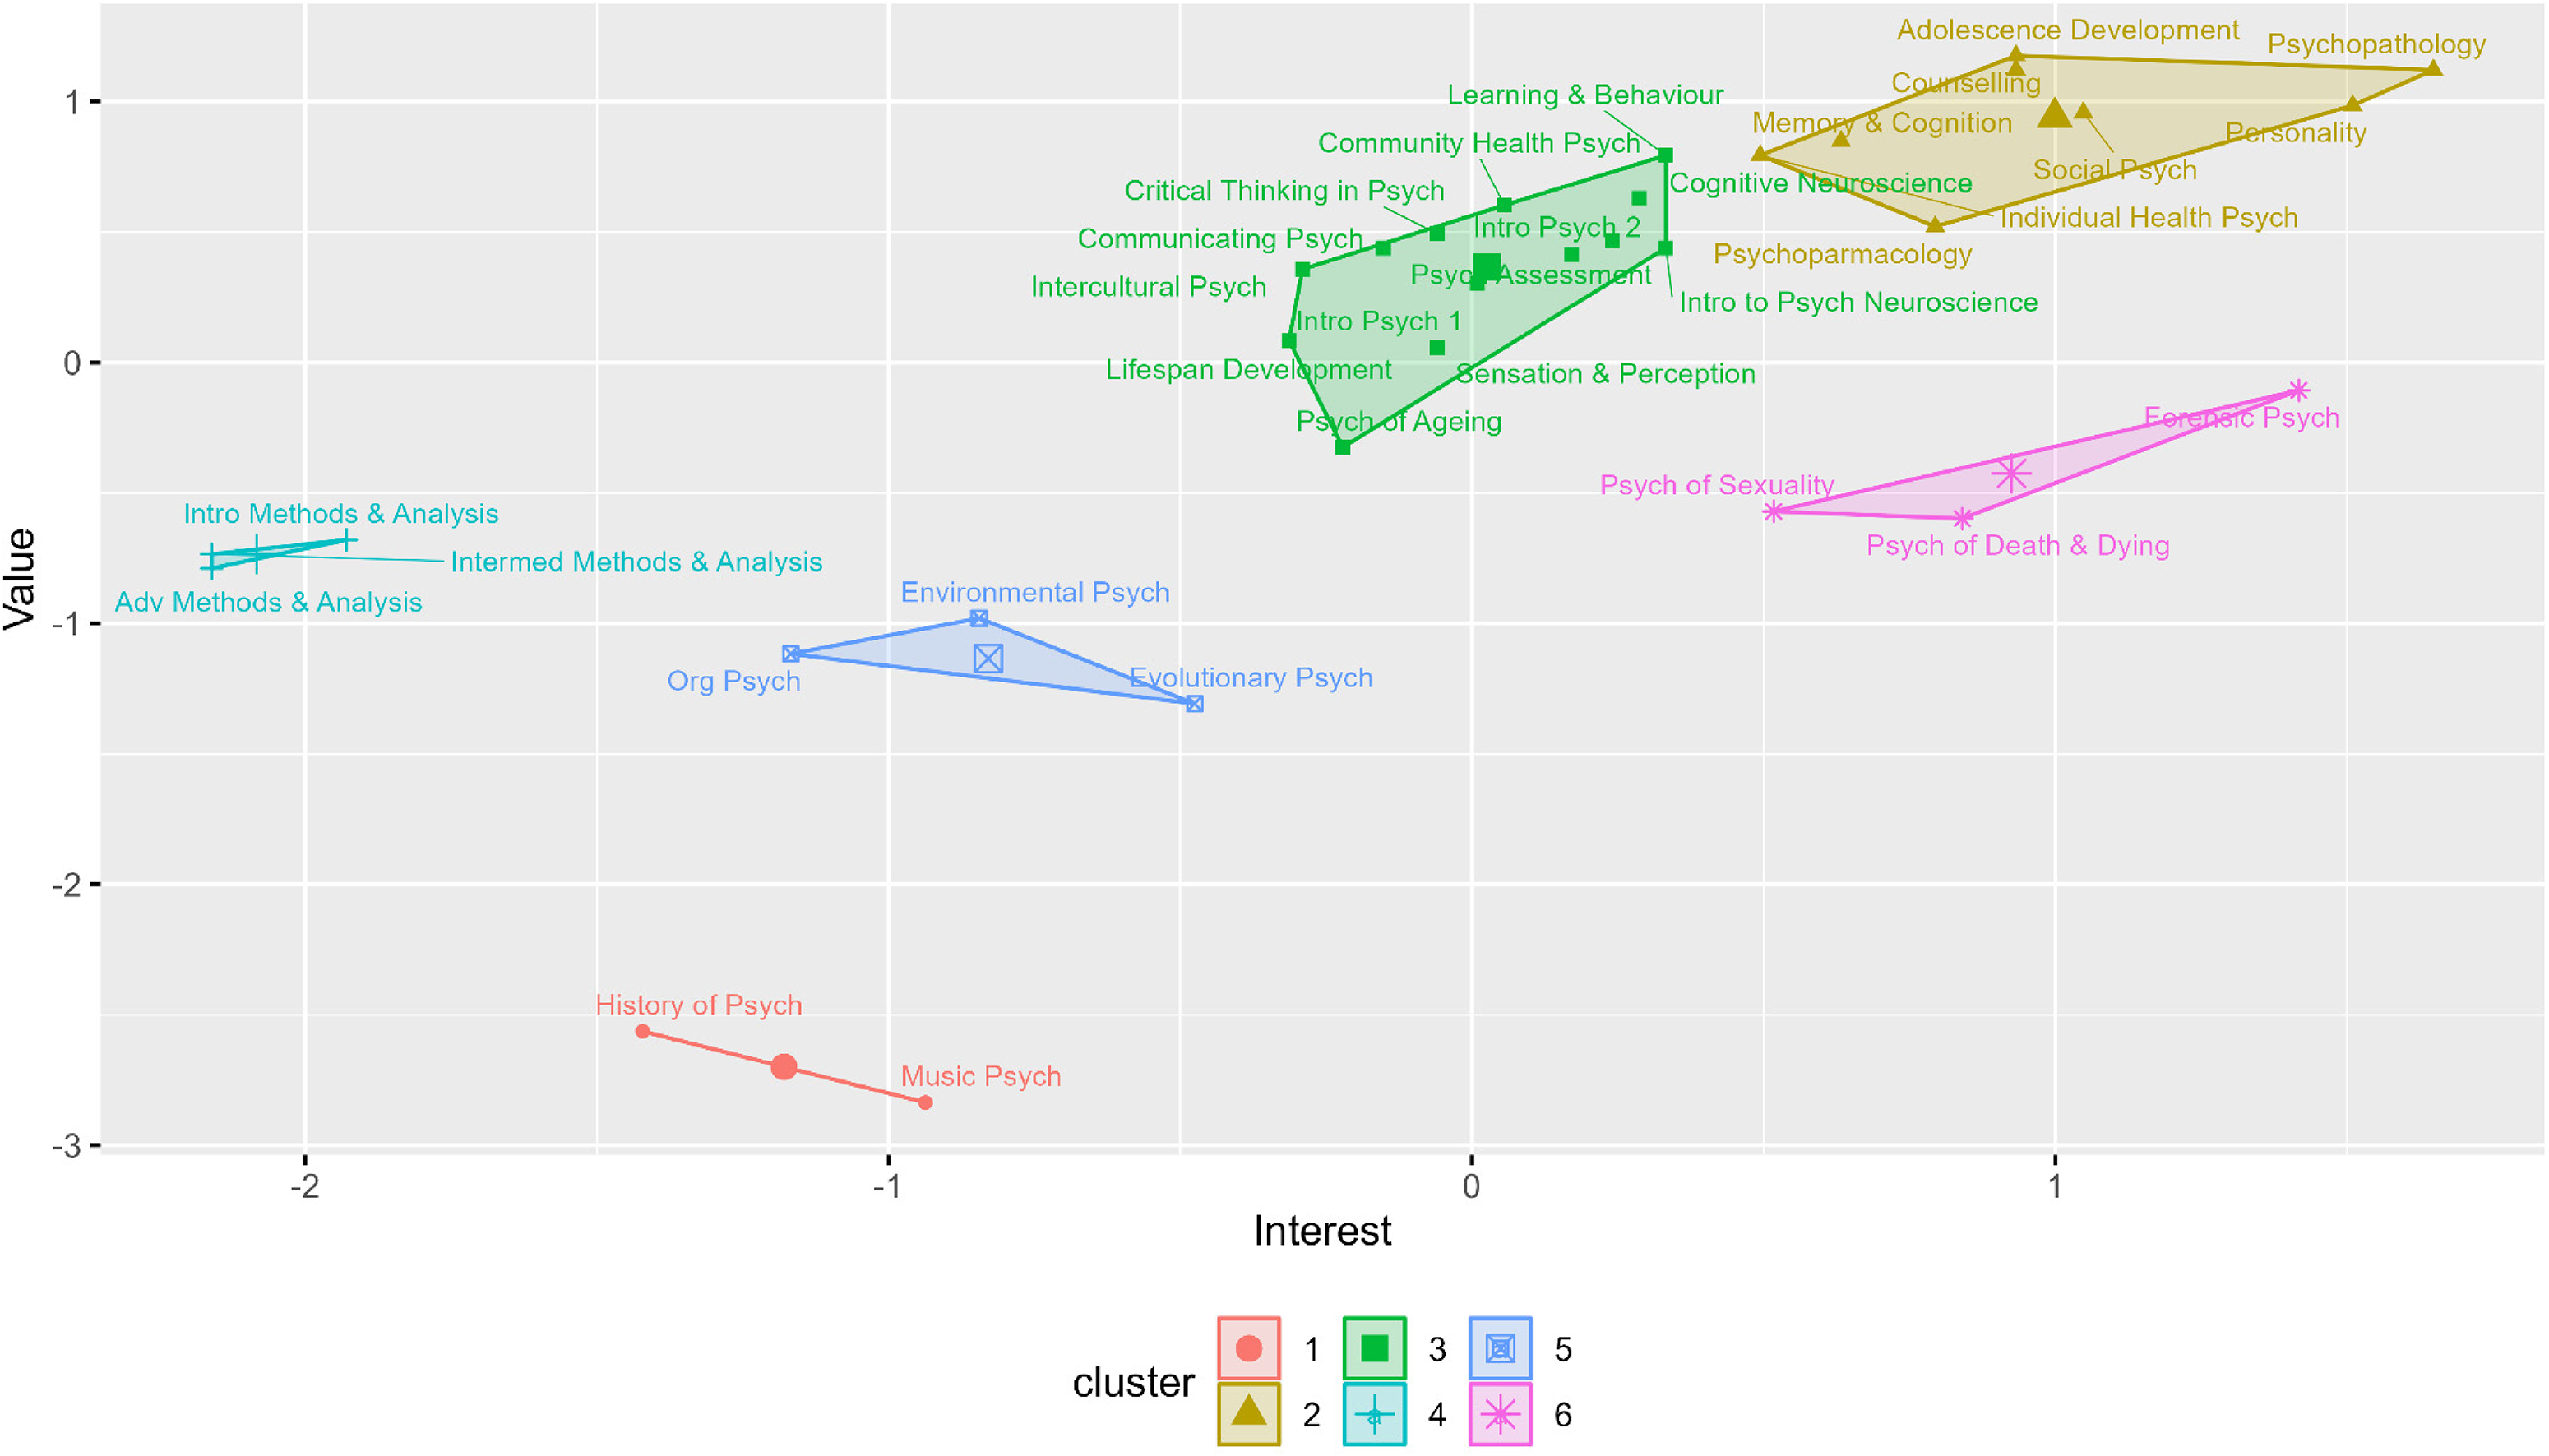
Visualization of k-means cluster analysis when k = 6.
Summary of Clusters Produced as Part of the k = 6 Cluster Analysis.
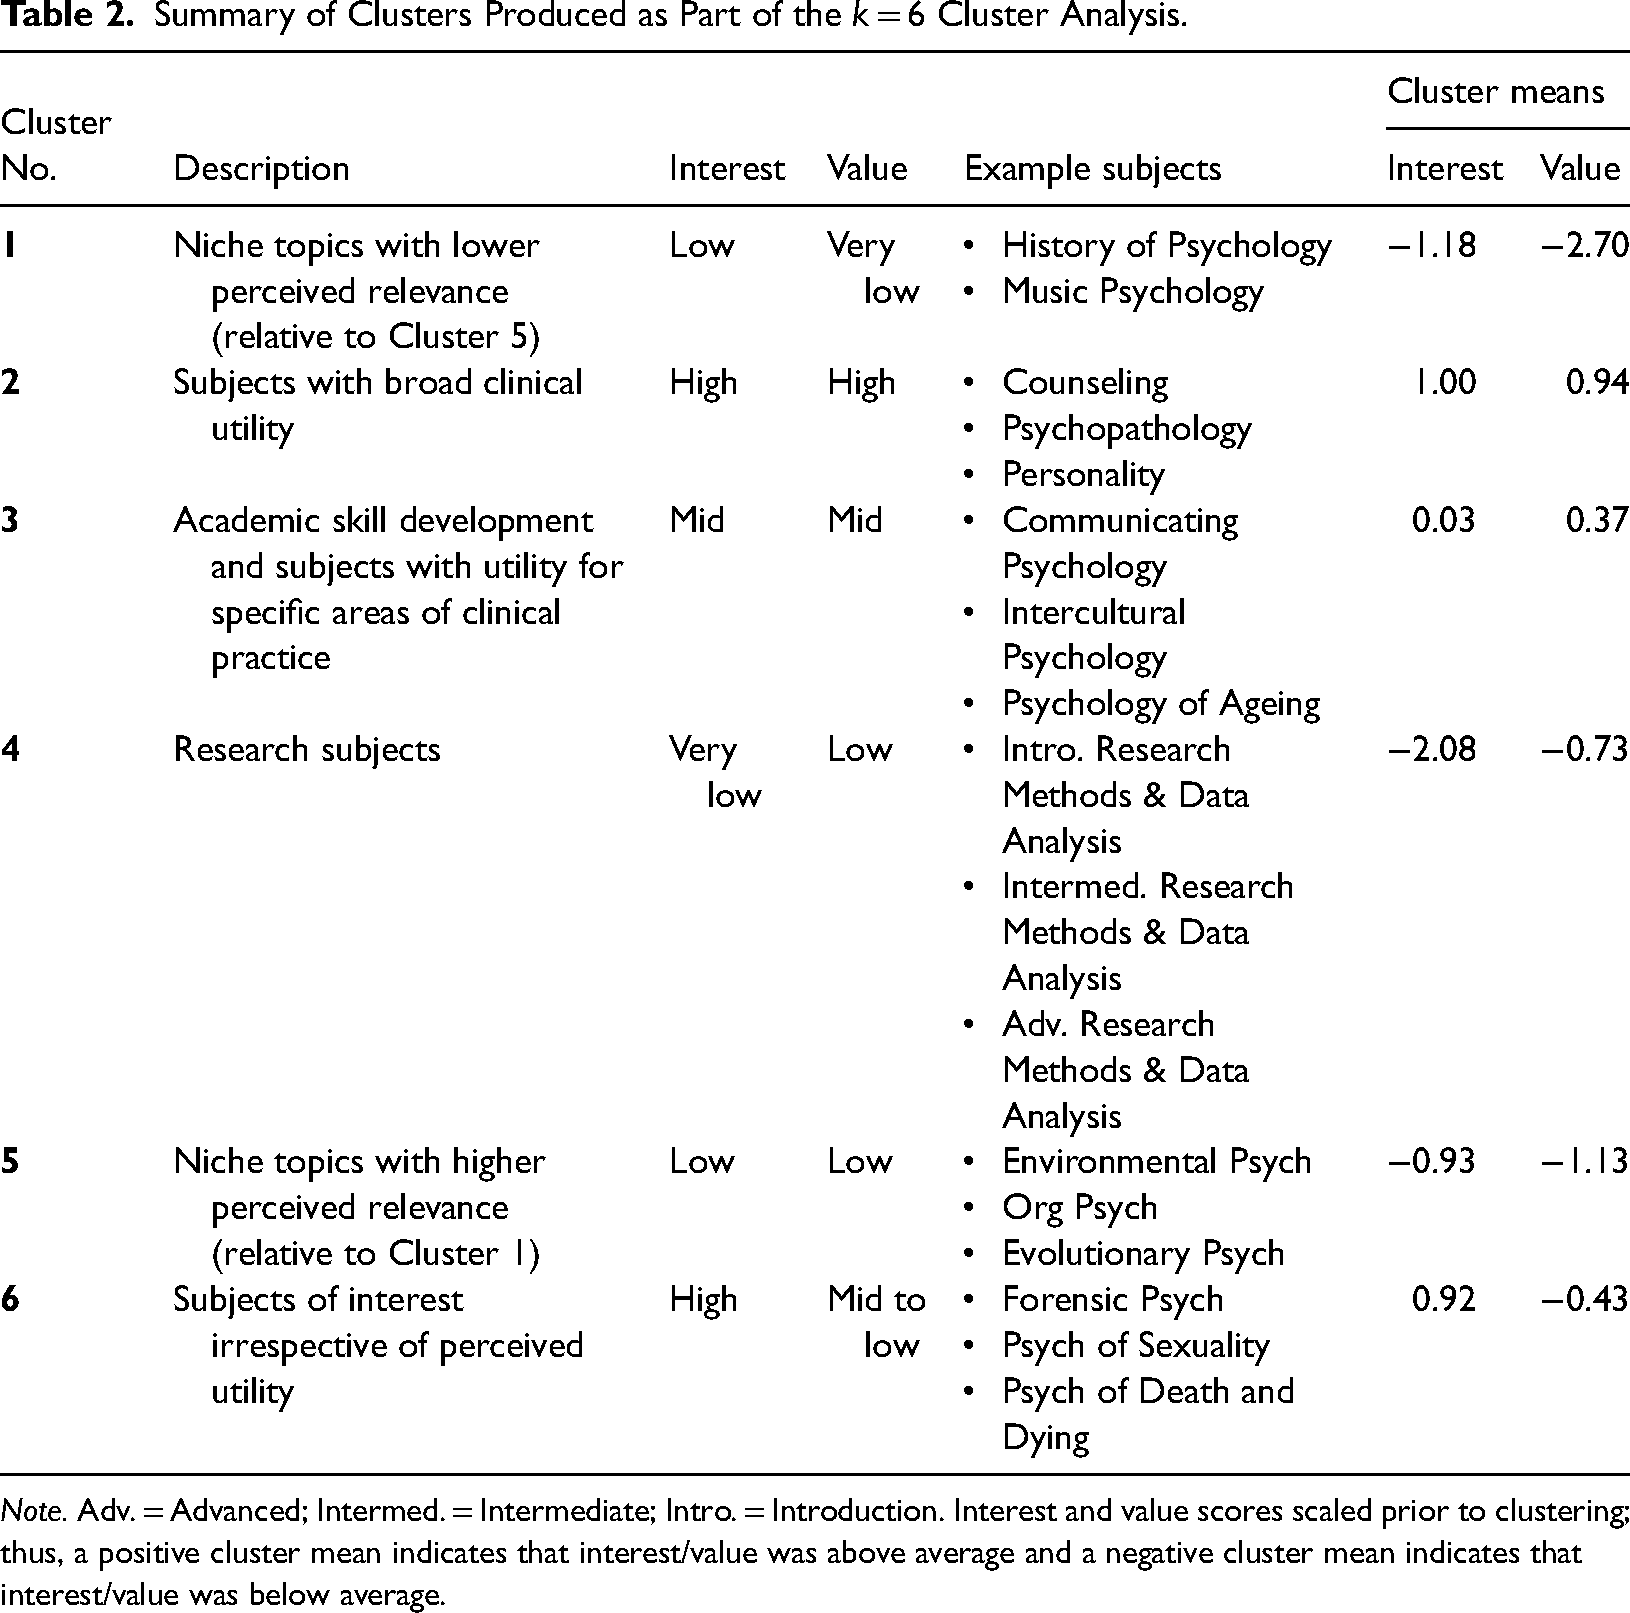
Note. Adv. = Advanced; Intermed. = Intermediate; Intro. = Introduction. Interest and value scores scaled prior to clustering; thus, a positive cluster mean indicates that interest/value was above average and a negative cluster mean indicates that interest/value was below average.
Comparing Interest and Value for Research and Nonresearch Subjects
Paired-sample t tests were used to formally compare participants’ interest in, and perceived value of, research subjects against nonresearch subjects (H1 and H2). Prior to this, difference scores were examined and found to be acceptably normally distributed (based on the visual inspection of histograms and the absolute values of skewness and kurtosis being far below |2.00| and |9.00|, respectively; Gignac, 2019). Participants were significantly more interested in nonresearch subjects (M = 3.71, SD = 0.70) relative to research subjects (M = 2.71, SD = 1.11), t(251) = 16.87, p < .001, mean difference = 0.99, 95% CI [0.88, 1.11]. The associated Cohen's d value was 1.07, indicative of a large effect (Cohen, 1992). Participants perceived nonresearch subjects (M = 3.93, SD = 0.75) as being more valuable than research subjects (M = 3.61, SD = 1.20), t(240) = 5.38, p < .001, mean difference = 0.30, 95% CI [0.19, 0.41]. The observed d was 0.35, indicative of a small-to-medium effect.
Consistent with H3, research subject interest had a large positive correlation with research subject value, r(236) = .46, 95% CI [.35, .55], p < .001. With regard to nonresearch subjects, interest and value scores also positively correlated, r(237) = .75, 95% CI [.69, .80], p < .001. A formal comparison indicated that the correlation between subject interest and value was significantly larger for nonresearch subjects compared to research subjects, z = 6.50, p < .001, r difference = .29, 95% CI [.20, .40].
Qualitative Findings
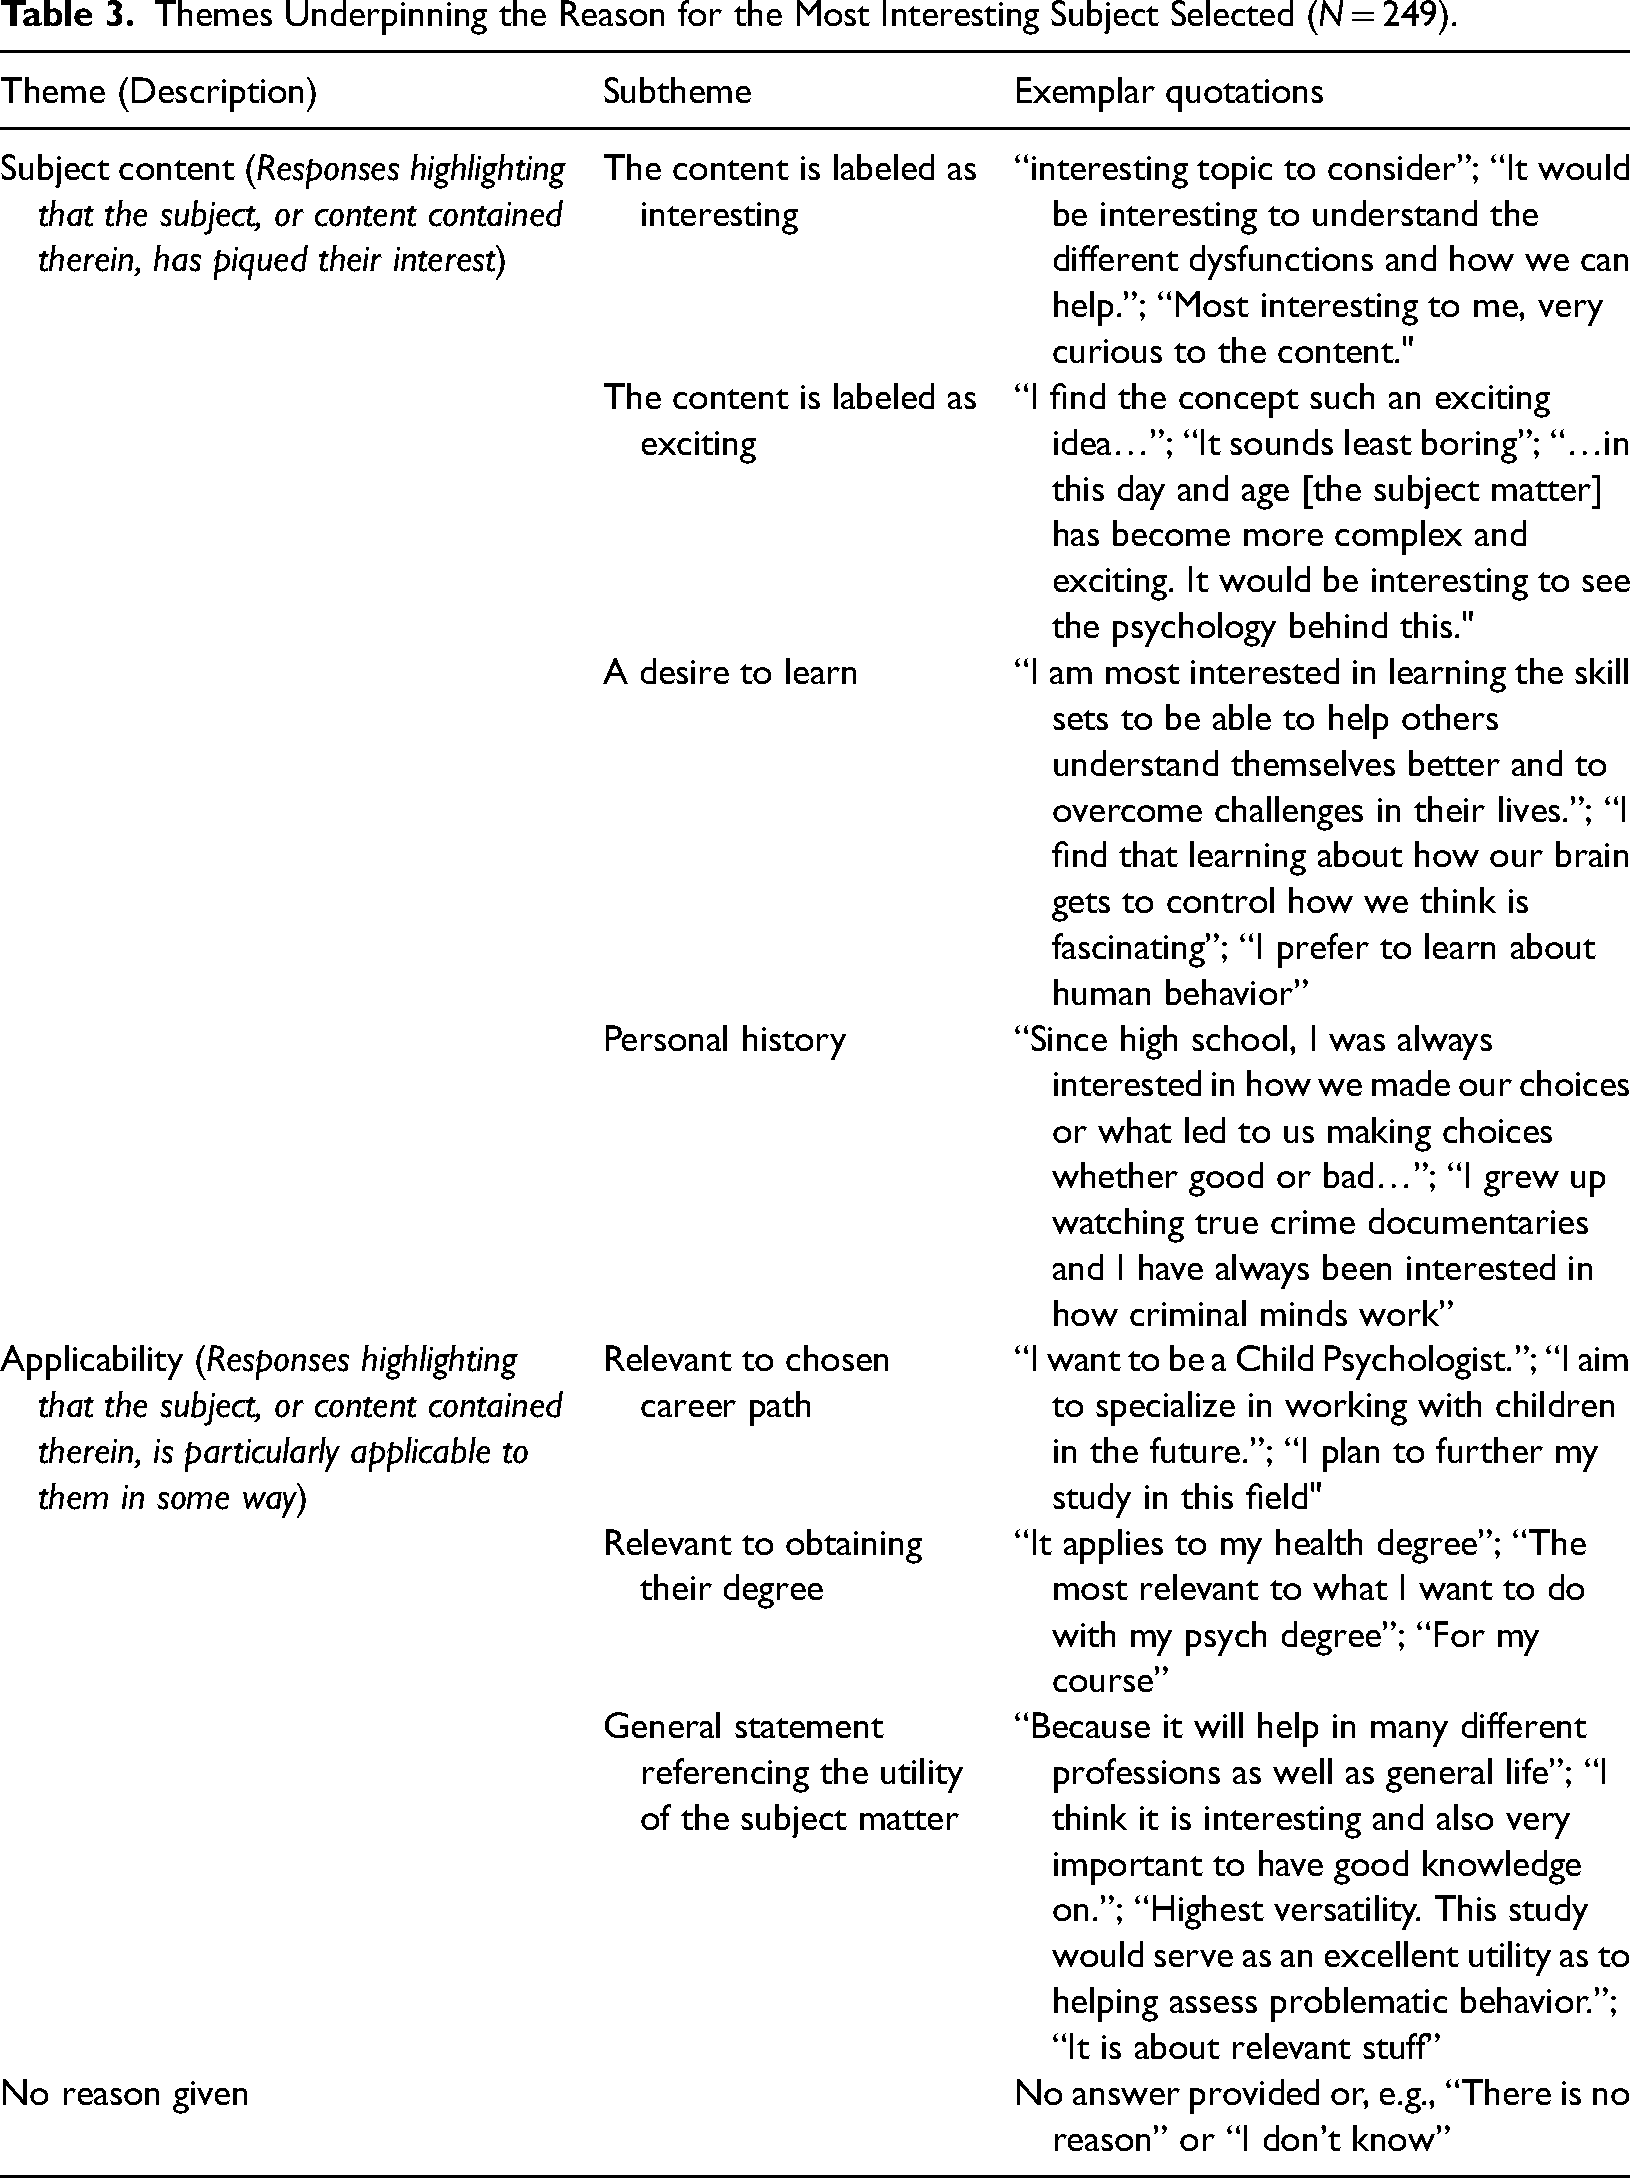
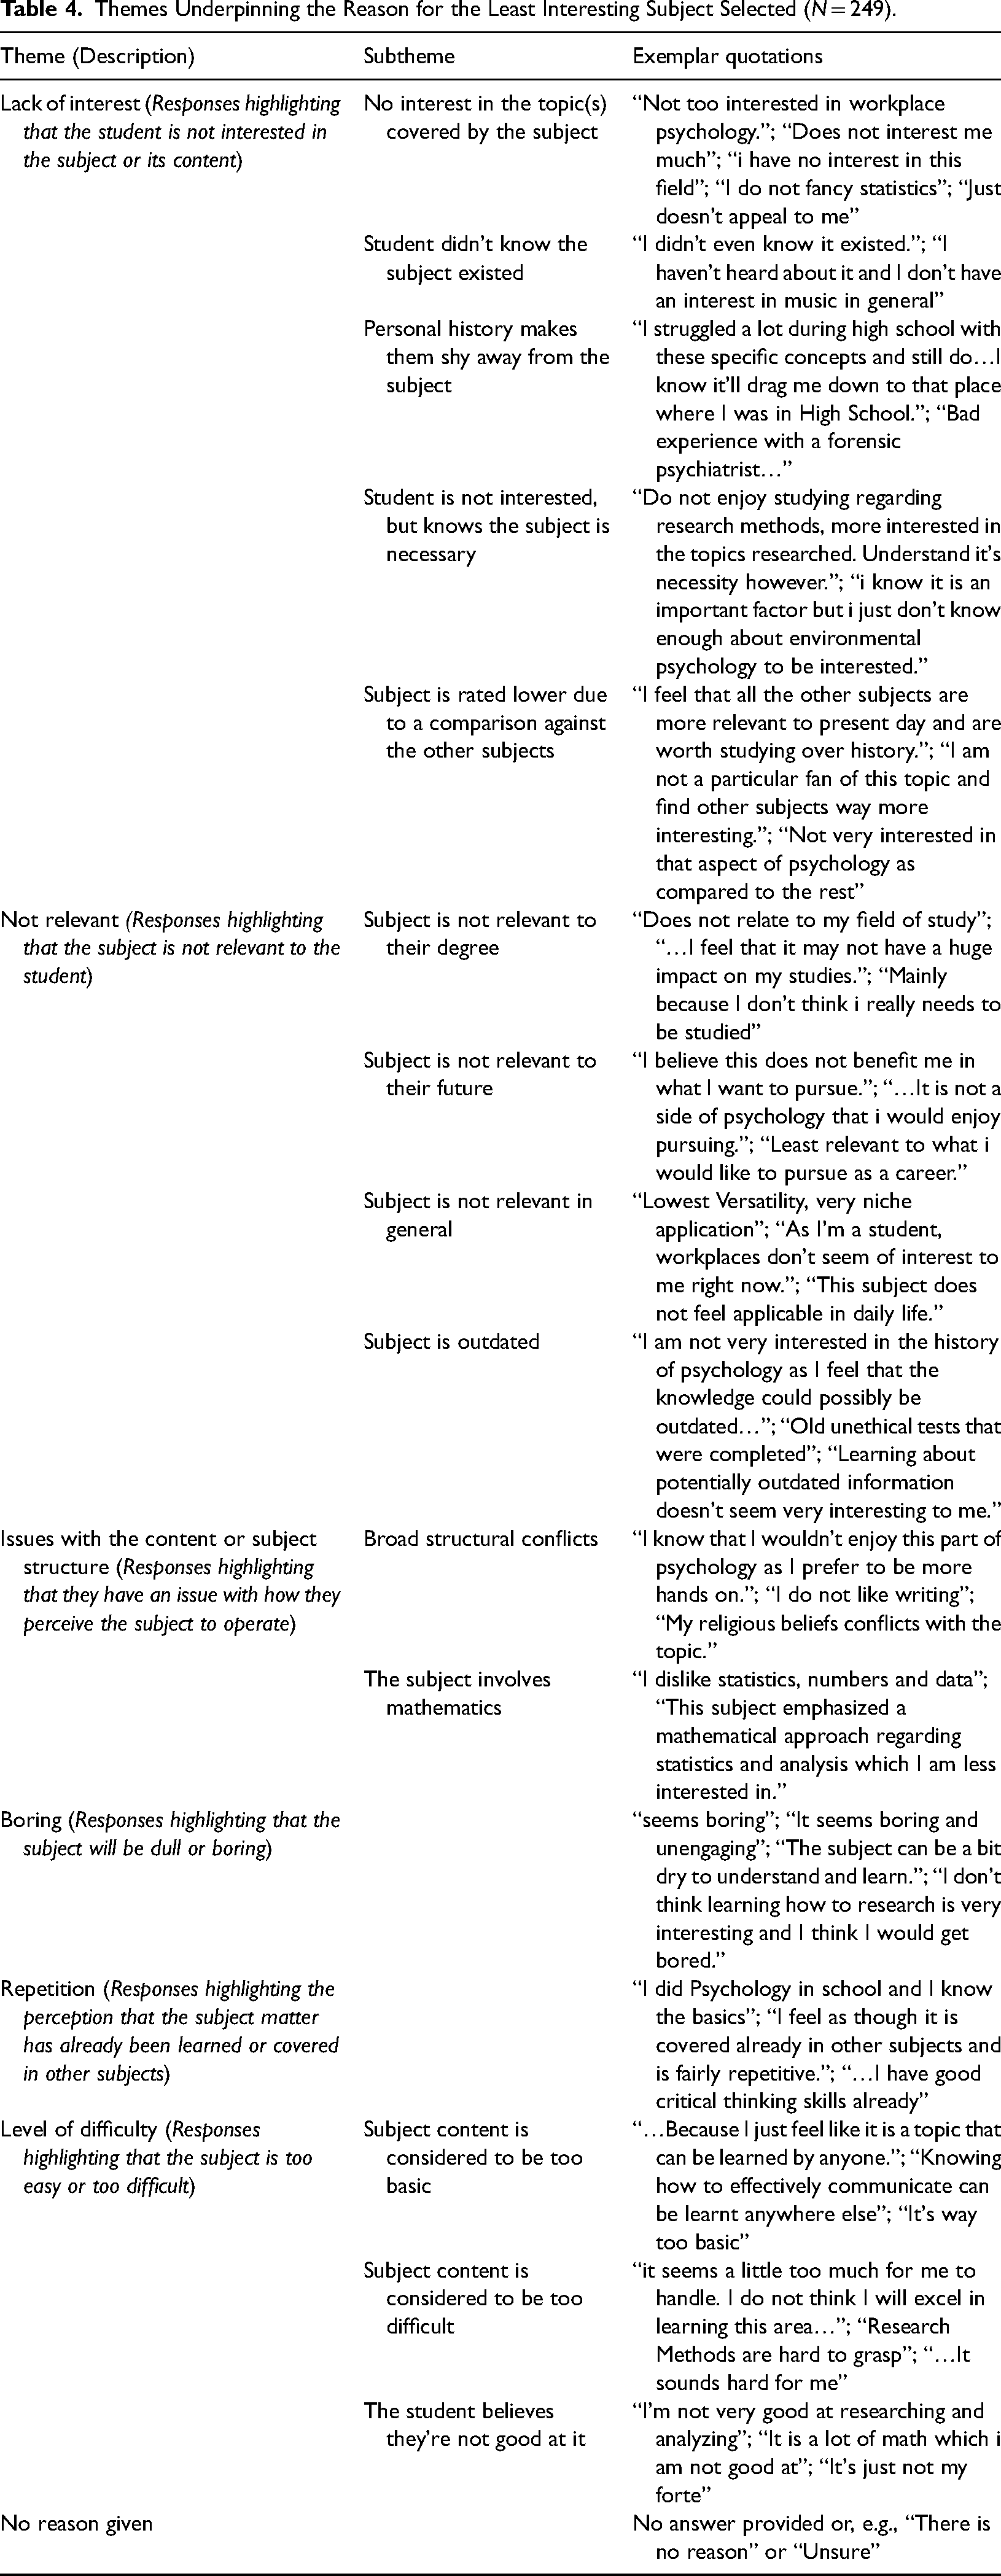
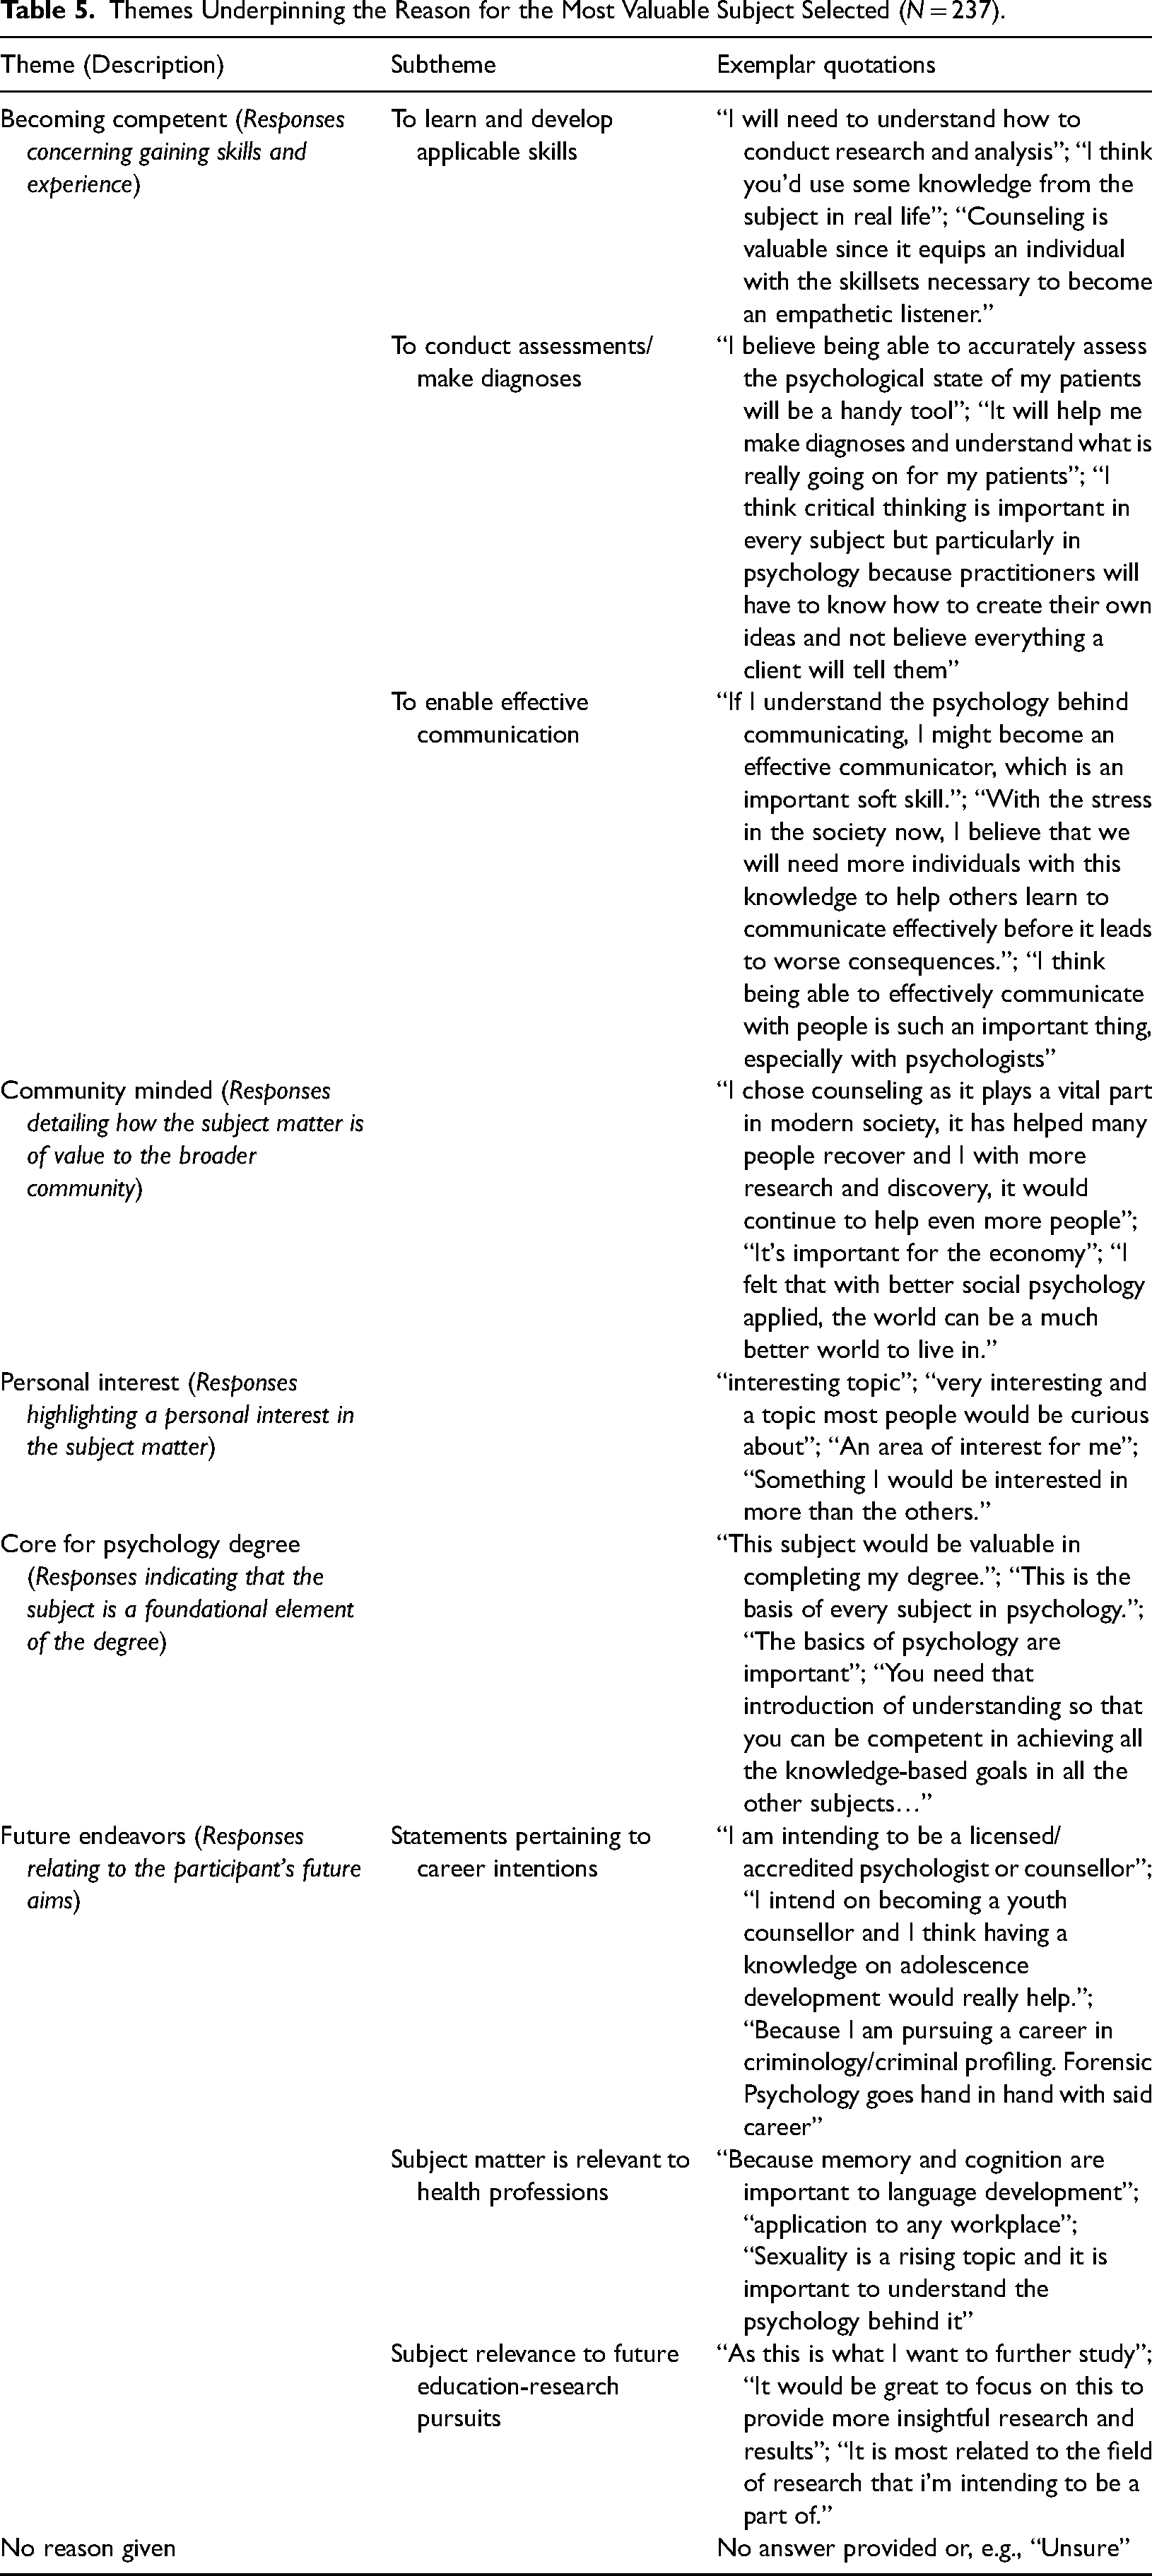
Participants’ reasoning for their most interested subject selection were characterized by two top-level themes: subject content and applicability (Table 3); while participants’ explanation for their least interested subject were characterized by five top-level themes: a lack of interest, not relevant, level of difficulty, repetition, issues with the content or subject structure, and finding the subject boring (Table 4). Regarding both the most/least interesting subject, the majority of responses simply pointed to the subject (or content covered with the subject) as interesting (n = 180) or uninteresting (n = 107). When considering subjects’ perceived value, explanations for the subject with the most value were characterized by five themes: becoming competent, community-minded, personal interest, core for psychology degree, and future endeavors (Table 5); and explanations concerning the least valued subject were characterized by four themes: irrelevance, of lesser importance, no personal interest, and no useful application (Table 6). The majority of responses regarding the perceived value of subjects were focused on considering the applicability of the subject's content to building their skills for future endeavors, especially people's intended careers (n = 151), or perceived irrelevance or absence of an application for the subject content (n = 162).
Themes Underpinning the Reason for the Most Interesting Subject Selected (N = 249).
Themes Underpinning the Reason for the Least Interesting Subject Selected (N = 249).
Themes Underpinning the Reason for the Most Valuable Subject Selected (N = 237).
Themes Underpinning the Reason for the Least Valuable Subject (N = 238).
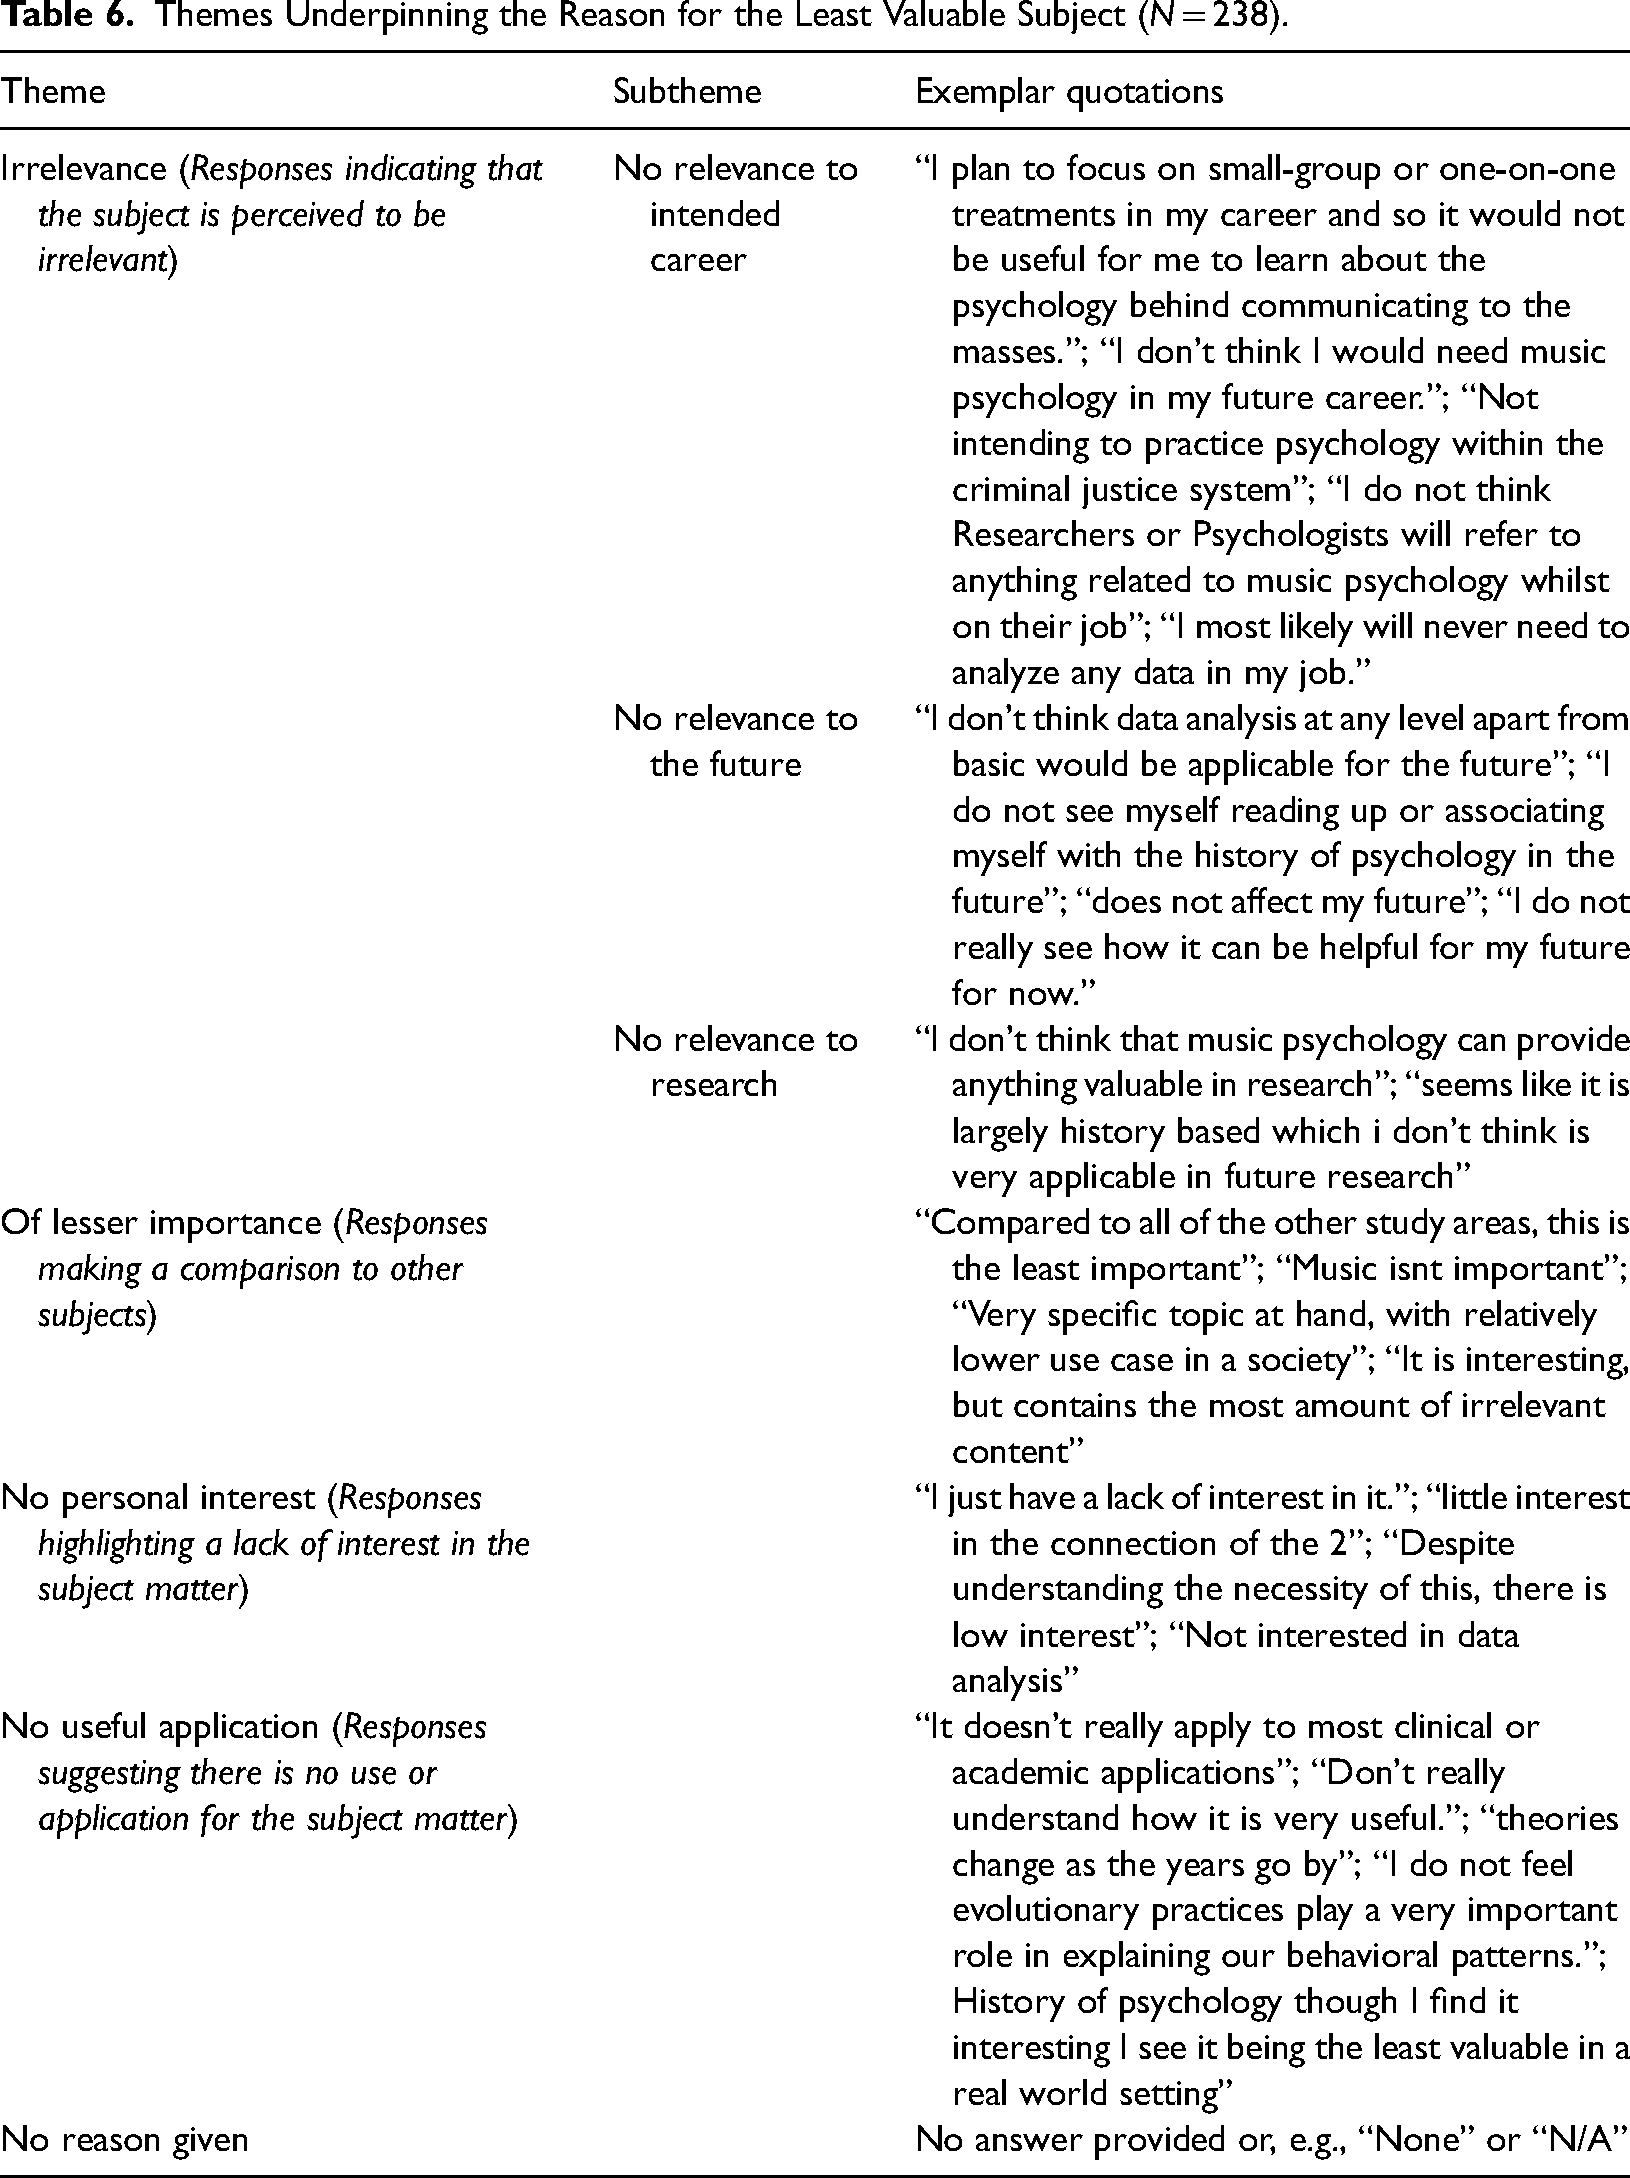
Interestingly, the presence of some themes (i.e., the applicability theme [n = 60] and not relevant theme [n = 31] for explaining one's interest level and the personal interest [n = 17] and no personal interest theme [n = 35] for perceived value) implies that interest and perceived value are not completely distinct. Rather, for some individuals, these concepts are intertwined concerning subject preferences. In other words, part of what makes a subject interesting is how it is deemed to be relevant or useful for the future and vice versa. This finding is consistent with the correlational analysis reported above.
In looking particularly at the pattern of responses for the research subjects (Table 7), it appears that beyond a lack of interest in research subject content, these subjects are considered to be too difficult, disliked because they involve mathematics, and are subjects students believe they are not good at. These reasons were allocated to research subjects far more than to nonresearch subjects. Moreover, it appears that very few students consider research subjects as applicable to their future endeavors.
The Frequency with Which Themes Were Observed in Relation to Research Subjects (Introductory, Intermediate, and Advanced Research Methods & Data Analysis).
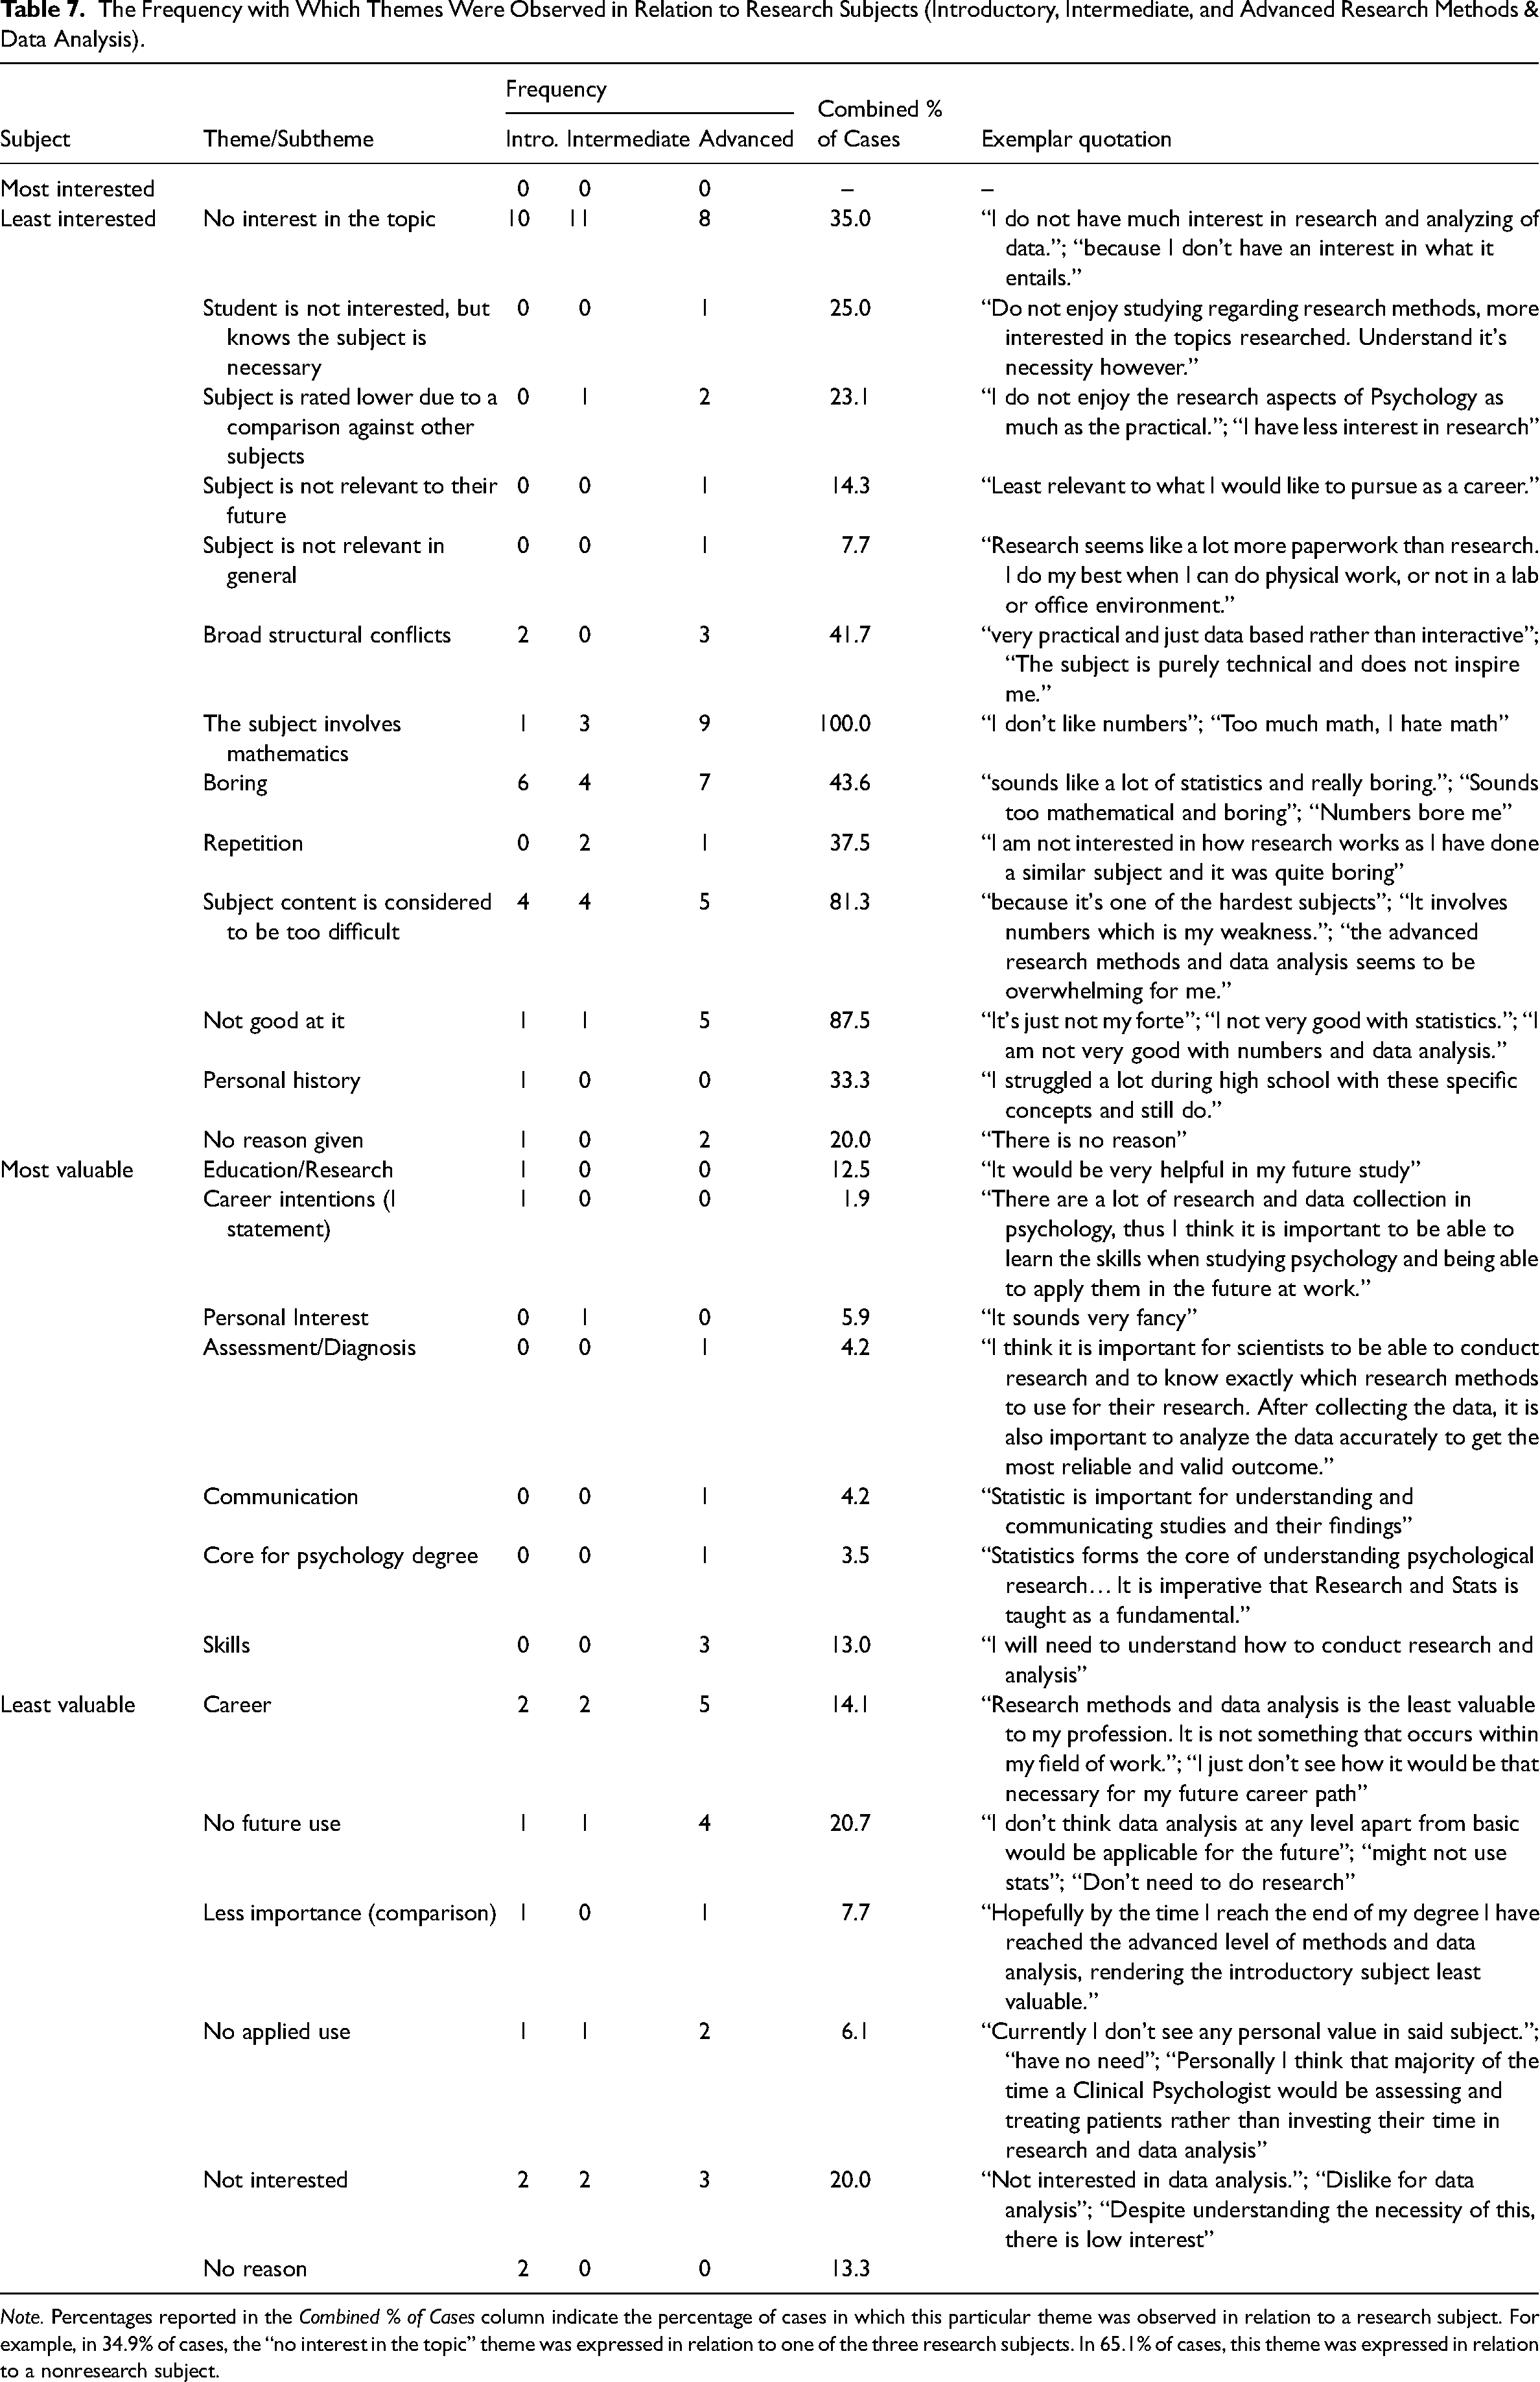
Note. Percentages reported in the Combined % of Cases column indicate the percentage of cases in which this particular theme was observed in relation to a research subject. For example, in 34.9% of cases, the “no interest in the topic” theme was expressed in relation to one of the three research subjects. In 65.1% of cases, this theme was expressed in relation to a nonresearch subject.
Discussion
The present study presented first-year university students with a list of subject titles and their descriptions in order to explore students’ perceptions of research and nonresearch psychology subjects. Like their Canadian counterparts (Uttl et al., 2013), the Australian and Singaporean students sampled in the current study were far less interested in research subjects compared to nonresearch subjects (H1). They also perceived less value in research subjects (H2). As expected, a positive relationship was observed between subject interest and value for both research subjects (H3) and nonresearch subjects. However, the interest-value relationship was significantly stronger for nonresearch subjects compared to research subjects.
As outlined in the Introduction, models of academic interest typically assume that perceived value of a subject area is a strong driver of interest in that area (Eccles & Wigfield, 2002; Hidi & Renninger, 2006). The findings of the current study are important as they demonstrate that the interest-value relationship may differ by subject domain. Specifically, the relationship between interest and value appears to be less prominent for research subjects. This finding calls into question the potential efficacy of utility-value interventions (Hulleman & Harackiewicz, 2021) to increase interest in research subjects among psychology students. Interventions to increase research subject interest may do better to focus on modifying feeling-related valences (e.g., involvement, stimulation, and flow), rather than value-related valences.
The findings also highlight the degree to which students perceive research subjects as distinct from other subjects. Quantitatively, this is most apparent from looking at the k = 6 cluster analysis (Figure 2), where the three research subjects clustered together (RQ1) at lower levels of interest and value, showcasing the contrast in students’ perceptions of these subjects relative to nonresearch subjects. This “distinctness” is further demonstrated in the reasoning provided by the students who were least interested, or perceived the least value, in a research subject (Table 7). The explanations provided hinged on students finding research subjects too difficult, involving mathematics, and including topics they believe they are not good at (RQ2).
A small number of students appeared to perceive that research has some utility value, despite also perceiving research subjects to be uninteresting. Such students may view learning research as a “necessary evil” to be tolerated in order to achieve one's academic or career goals or enhance one's ability to “think like a scientist.” However, the takeaway of the qualitative data is that most students do not see the relevance or applicability of research subjects to their degree or intended careers. This finding resonates with prior work suggesting that because quantitative subjects are depicted as research and theory-focused, students consider these to have minimal practical application (Uttl et al., 2013; Vittengl et al., 2004; Wathen & Rhew, 2019). Further, this finding highlights disconnect between educators’ (and accrediting bodies’) opinions and those of students. It seems that the importance of research literacy as a graduate competency (e.g., APAC, 2019) is not effectively communicated to, or shared between, psychology students and instructors (Dempster & McCorry, 2017; Landa-Blanco & Cortés-Ramos, 2021; Uttl et al., 2013). As Strohmetz et al. (2023) found, students tend to perceive these subjects to be about learning how to conduct research, an activity that many students believe they will not do after graduation (Murtonen et al., 2008). The quantitative and qualitative findings of the current study reinforce Uttl et al.'s (2013) argument that undergraduate students would benefit from developing a greater understanding of what competencies are necessary for a career in psychology (although, as discussed above, this may not be enough to drive interest).
Lastly, students perceiving research subjects as distinct from other subjects, such that they are not considered applicable nor interesting, have implications for tertiary psychology educators. As Uttl et al. (2013) argue, the lack of interest in quantitative subjects is so large that it should be accounted for when evaluating faculty based on student ratings of teaching. Solely relying on student ratings of teaching to assess faculty performance may disproportionately disadvantage educators who teach research subjects. Alternative methods of teaching evaluation should be considered for these instructors, or, at the very least, these student evaluations of teaching should be viewed in the context of the “uphill battle” faced by research methods instructors.
Limitations and Future Directions
Collectively, the findings raise questions as to how to help students gain a greater interest in, and appreciation for, research subjects. With participants comprising of first-year students only, the present study does not acknowledge that students’ perceptions of research subjects may change as they progress in their studies and gain more experience conducting (and consuming) research. Most of the students participating in the present study would not have taken a research subject (research subjects start in the second year of study at the authors’ institution); therefore, their lack of exposure to this content may have influenced their ratings. Future research is well-placed to undertake longitudinal testing across years of tertiary study to help identify if exposure and experience can change students’ perceptions of research subjects and whether this is impacted by the learning approach used (e.g., active learning approaches which make use of “real-life” data, Allen & Baughman, 2016; Landa-Blanco & Cortés-Ramos, 2021).
Another limitation of the current study is that the subject descriptions presented to participants did not explicitly state whether the listed research subjects covered qualitative methods, quantitative methods, or both. Research indicates that some students prefer qualitative over quantitative approaches, and vice versa (Murtonen, 2005). Future research could present students with subject descriptions which more explicitly indicate whether subjects cover qualitative and/or quantitative methods (or even subject syllabi comprehensively listing the topics covered in each subject), to explore differences in students’ perceptions of qualitative and quantitative research. If students do show a clear preference for qualitative over quantitative approaches, this would suggest that students’ opposition to research subjects is more about an aversion to statistics than to the process of research. Alternatively, if students also perceive qualitative subjects to be uninteresting and lacking in value, this could indicate that greater consideration should be given to research process anxiety (Onwuegbuzie, 1997), as opposed to just statistics anxiety.
The relatively small number of participants enrolled in degree programs outside of psychology in the sample meant that it was not possible to compare the perceptions of students across different degree programs. Future research may purposely sample students enrolled in degrees outside of psychology so that these kinds of comparisons can be made. Assessing the impact of career intentions on perceptions would also be informative.
Finally, future research could extend the present findings by examining whether utility-value manipulations of research subject descriptions (e.g., to emphasize career applicability of the content or perhaps the applicability of research content to high interest and value subject areas, such as psychopathology and counseling) can shift students’ perceptions. This could have implications for not only how instructors “package” research methods subjects but also contribute to our understanding of how to bridge the gap between faculty and student perceptions of the relevance of research subjects.
Supplemental Material
sj-docx-1-plj-10.1177_14757257231222647 - Supplemental material for Against All Odds: Students’ Interest in, and Perceived Value of, Research and Nonresearch Psychology Subjects
Supplemental material, sj-docx-1-plj-10.1177_14757257231222647 for Against All Odds: Students’ Interest in, and Perceived Value of, Research and Nonresearch Psychology Subjects by Benjamin L. Lloyd-Lewis, Dan J. Miller and Amanda E. Krause in Psychology Learning & Teaching
Footnotes
Acknowledgments
The authors wish to thank the individuals who participated in the research, Jude McQuire who worked on the project as a Research Assistant, and JCU staff members for their early feedback on this project.
Authors’ Contribution
AK, DM, and BLL collaboratively developed the study and BLL conducted data collection. BLL conducted the data analysis, with input from AK and DM. BLL drafted an initial version of the manuscript, with AK and DM offering input and revisions. All authors collaborated to approve the final version of the manuscript.
Declaration of Conflicting Interests
The author(s) declared no potential conflicts of interest with respect to the research, authorship, and/or publication of this article.
Data Statement
Funding
The author(s) received no financial support for the research, authorship, and/or publication of this article.
Supplemental Material
Supplemental material for this article is available online.
Notes
Author Biographies
References
Supplementary Material
Please find the following supplemental material available below.
For Open Access articles published under a Creative Commons License, all supplemental material carries the same license as the article it is associated with.
For non-Open Access articles published, all supplemental material carries a non-exclusive license, and permission requests for re-use of supplemental material or any part of supplemental material shall be sent directly to the copyright owner as specified in the copyright notice associated with the article.