
Abstract
Statistics is not the subject most psychology students are feverishly looking forward to. Fears and doubts about its relevance are quite common. This is especially pronounced at our institution, a large distance-teaching university with highly heterogeneous students. We recognized three clusters of students that might need special support: (1) students with fear of statistics, (2) students whose school time was a long time ago, (3) students who already failed the statistics exam. We gave those students the opportunity to participate in small, supervised groups to discuss learning strategies, problems, or fears. Students who did not participate served as a control group. We exploratively evaluated which kind of students were interested, and if the groups affected attitudes towards statistics, general self-efficacy, and exam-related variables. Interest and activity in the groups were low. No unique effect of participation in the groups on attitudes and grades were observable. Students stated that the groups did not help them to deal with the course. If these results prove stable in further studies with an improved design, one might conclude that setting up such small groups is not worth the effort.
Statistic skills are of great relevance for a professional career in psychology, and a profound knowledge of statistics and research methods is seen as an important element of professionalization (Deutsche Gesellschaft für Psychologie, 2005). However, psychology students often dislike or fear the statistics course, or do not see its relevance (Davies et al., 2015; Field, 2014; Mutz & Daniel, 2013). As described by Conners et al. (1998), statistics would be the first subject most psychology students would drop from their study list, if possible. These are important findings as some studies show that statistics anxiety is related to procrastination (Macher et al., 2012; Onwuegbuzie, 2004; Rodarte-Luna & Sherry, 2008), and leads to a worse course performance (Macher et al., 2012; Onwuegbuzie & Wilson, 2003) although the picture is not clear (Hanna & Dempster, 2009).
The tough stand of statistics is aggravated in the BS psychology statistics course at the FernUniversität in Hagen, Germany's only state distance-learning university. Students vary a lot in age and in educational background. There is no minimum GPA to enroll in the BS psychology program, so students can even enroll without A-levels (at all other German universities there is a very strict admission system and excellent grades are needed). Moreover, most of the students work full- or part-time, and/or take care of children, some are imprisoned, and some suffer from chronic illnesses. Thus, for many students, the resources that can be spend to their studies are limited (as has been described for other disciplines in distance learning settings, Dzakiria, 2008). It is therefore reasonable to assume that students are strongly focused on the outcome of the program (i.e., getting their degree) and/or on those topics that interest them most. As a result, many might see statistics as some unwelcome obstacle. Mutz and Daniel (2013) find that especially older students, and students with lower GPA hold more negative attitudes towards statistics, two characteristics with a large proportion among students at the FernUniversität. Furthermore, the course is large and there is little contact between the students. Each semester, between 3,000 and 4,000 students are enrolled. Only a few of them actively participate in the course's online environment. This lack of communication might negatively influence students’ sense of belonging with negative impact on academic motivation and performance (Suhlmann et al., 2018).
We approach these challenges by addressing fears that might arise, by using humour as other statistic teachers have discussed (Field, 2009; Lomax & Moosavi, 2002), and – most importantly – by encouraging students to ask questions and participate in discussions on the learning platform. Indeed, the possibility to ask questions while working on the material (and not only during a two-hour seminar or lecture) is quite unique and exceeds the amount of supervision at a brick and mortar university.
However, looking at the retrieval of activities and at the small numbers of students who actively participate in the discussion forums, it is clear that not all students use the materials and offers we provide. Some postings suggest that they struggle to navigate efficiently through the course, lose their focus, and procrastinate especially working with R. Indeed, many students linger in the statistics course for several semesters.
When asking students about their needs, many wished for a one-on-one tutoring. This, however, is not feasible in such a large course. Students also admit that they are too self-conscious to participate in online discussions.
Because of the university's focus to provide all students with the same learning materials, instructions and explanations, it is not possible to provide additional material or lectures to only a fraction of the students, or answer questions of struggling students in smaller settings. However, it is possible to work on obstacles that are not related to the course content itself. That in mind, we regarded fear and learning strategies as possible starting points for improvement. Targeting those, we hoped to improve commitment and course performance. Considering the literature (Davies et al., 2015; Field, 2014; Mutz & Daniel, 2013; Onwuegbuzie & Wilson, 2003), and also our experience with students at the FernUniversität over the past couple of years, we identified three clusters of students who might have special needs in this regard: students with fear of statistics, students who went to school a long time ago, and students who already failed the exam. We gave those students the opportunity to participate in small groups, supervised by a tutor, to discuss problems, fears, learning strategies etc. Small groups have been applied in online learning environments with some success. However, they mostly focus on discussing and mutually explaining course materials (e.g. Krasny et al., 2018; Li et al., 2014), although “off-topic” themes that emerge while working on the materials are important as well (e.g. Paulus, 2009). We wanted to find out whether participating in a small group that explicitly does not purport discussing the course materials, may be of help to struggling students by enhancing activity, increasing a sense of belonging (it has been shown that even minimal social relationships can effect academic motivation, Walton et al., 2012), and providing an opportunity to share fears and reservations. Limiting small group exchange to such a metalevel is in our opinion a new approach that has not been evaluated elsewhere.
We evaluated this approach in order to find out which students were attracted by the offer and how participation influenced attitudes towards statistics, self-efficacy expectation, and course performance. The overall intention was to elicit if the additional effort organizing and implementing the groups was worth the cost.
Method
Design and Participants
The statistics course for BS psychology students in the fall semester starts October 1st and ends with a written exam at the beginning of March. After a month of settling in, we informed the students about the possibility of participating in small groups in November 2020. All students who claimed that their schooling was a long time ago, that they had fear of statistics, or that they failed the statistics exam before, were eligible to register for the groups. We did not validate the provided information. Students that participated in the course but did not register for the groups served as a control group, and completed the same questionnaires as the students in the small groups. The baseline questionnaire was administered before the groups started in November 2020. The second questionnaire was administered after completion of all course units in February 2021, and the third was administered after the exam was over and the grades were released in March 2021.
Questionnaires at all time points were administered using UniPark and matched via a pseudonymization code. All students provided written informed consent and received credit as a subject for participation, no matter if they registered for the groups or not.
The implementation and evaluation of the small groups was part of a project funded by an internal grant promoting innovations in teaching which enabled us to employ the tutor who organized and moderated the groups.
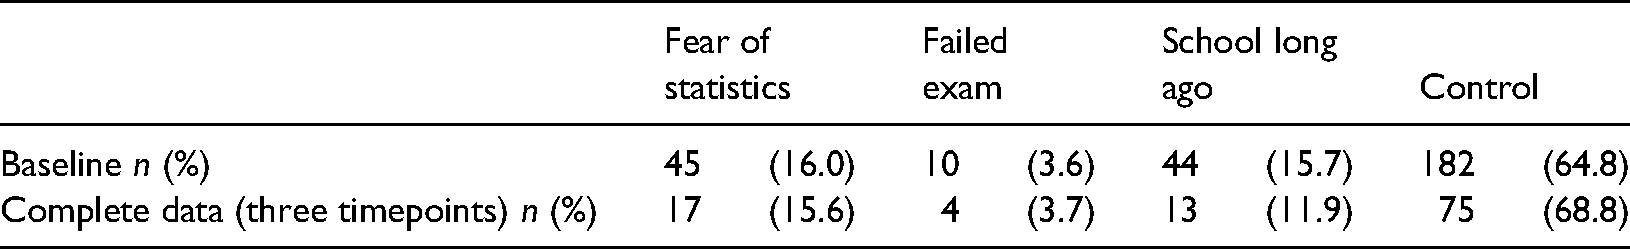
There were about 3,900 students enrolled in the statistics course in the fall semester 2020/21. Originally, 311 students (105 group participants, 206 control group participants), took part in the study, 198 completed the second, and 219 completed the third questionnaire. However, there were many flawed questionnaires regarding the pseudonymization codes. After eliminating all questionnaires with incomplete or not matching codes, data of 281 students (99 group participants and 182 control group participants) could be analyzed at baseline. Only 109 participants provided three valid questionnaires for the follow-up analyzes. Table 1 shows the frequencies of the different groups.
Frequencies of different groups.
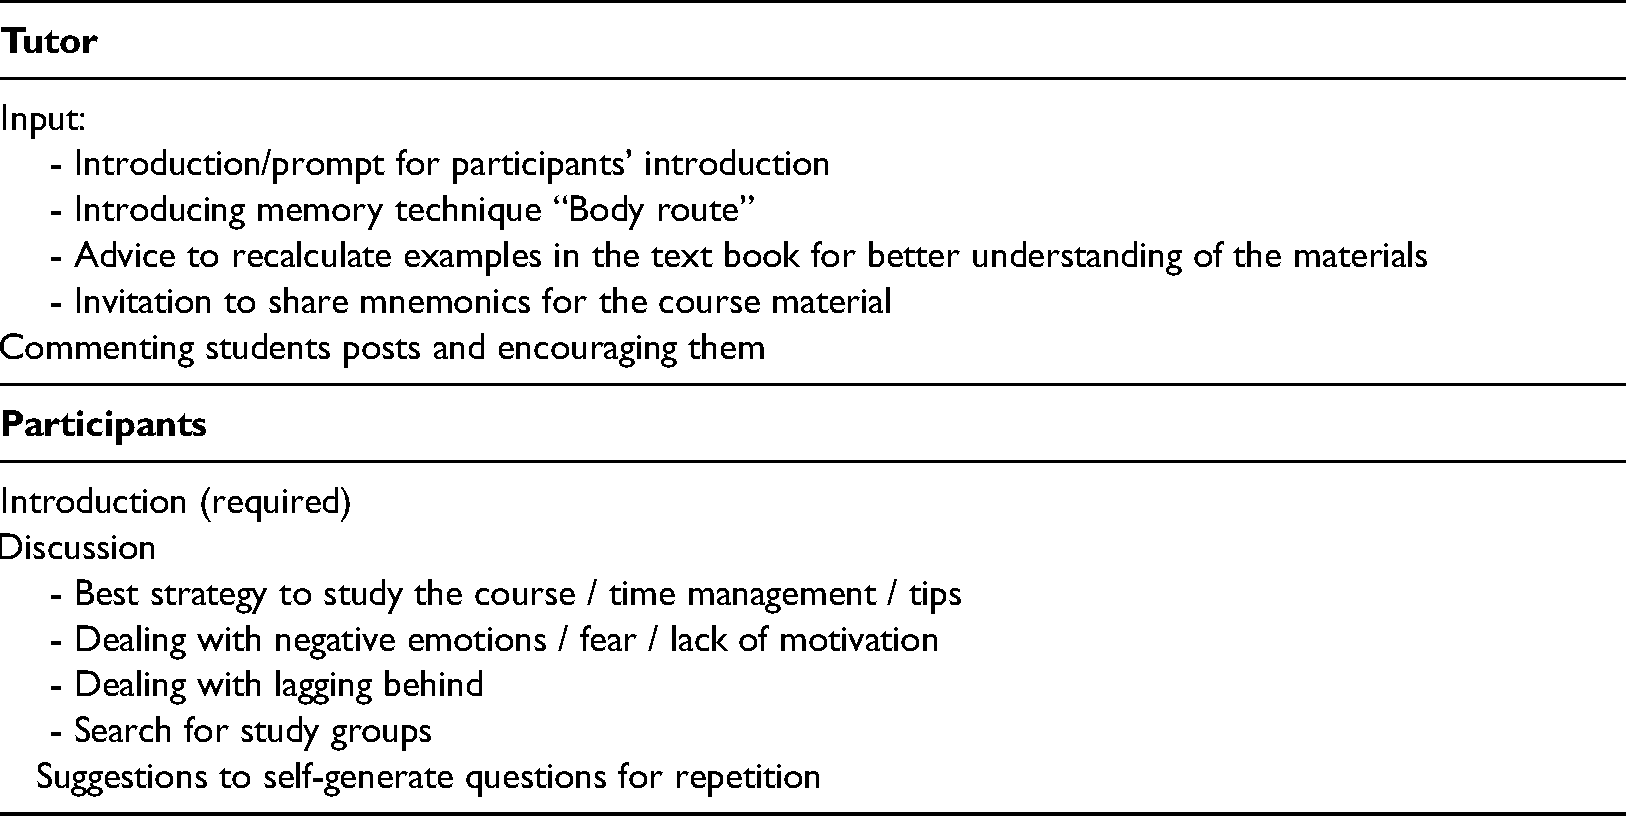
Each cluster had their own discussion group with the tutor moderating discussion and also providing input in terms of suggestions for learning strategies, or memory aids (see Table 2, upper part). All interaction took place via posts and comments in online discussion forums. In the beginning, students were asked to introduce themselves. If they did not do so within the first week, they were excluded from the group in order to provide an active environment with less “silent listeners” than in the global course environment.
Input and topics in small groups.
Dependent Variables
Attitudes Towards Statistics
We assessed attitudes towards statistics with a self-generated questionnaire that we tested in other studies as well (publication in preparation). Attitudes towards statistics are assessed via three 6-item-subscales, each item rated on a five-point-Likert scale: (1) Fear of statistics, e. g. “I am afraid of statistics”, ω = .90, 95% CI [.88;.91] (2) Interest in statistics, e. g. “I am interested in analyzing data”, ω = .91, 95% CI [.89,.93] and (3) Meaningfulness of statistics, e. g. “For my professional goals I do not need statistics”, ω = .70, 95% CI [.64,.75]. Items were coded so that higher values indicate a more positive attitude towards statistics (note that the Fear-subscale therefore rather is an Absence-of-Fear-subscale).
General Self-Efficacy Expectation
General self-efficacy expectation was assessed with the German version of the General Self-Efficacy Scale (GSES, Schwarzer & Jerusalem, 1995, 1999). Items (e.g. “I can solve most problems if I invest the necessary effort”) are rated on a four-point Likert scale, ω = .86, 95% CI [.84,.89].
Exam Participation and Grade
At baseline, we asked the students whether they planned to participate in the exam that semester. After the exam we asked about their actual participation and grade.
Open Question
We asked via an open question if and how the small groups helped the students.
Analysis
The study was throughout exploratory. Therefore, only descriptive statistics and confidence intervals are reported. All data were analyzed using R, version 4.1.1 (R Core Team, 2019).
Results
Table 3 shows numbers and demographics of the participants at baseline. Not surprisingly, students whose school time was long ago were older than other students, however, that was also true for students with fear of statistics. The control group approximately corresponds to psychology students at the FernUniversität in general (FernUniversität in Hagen, 2020).
Group description at baseline.
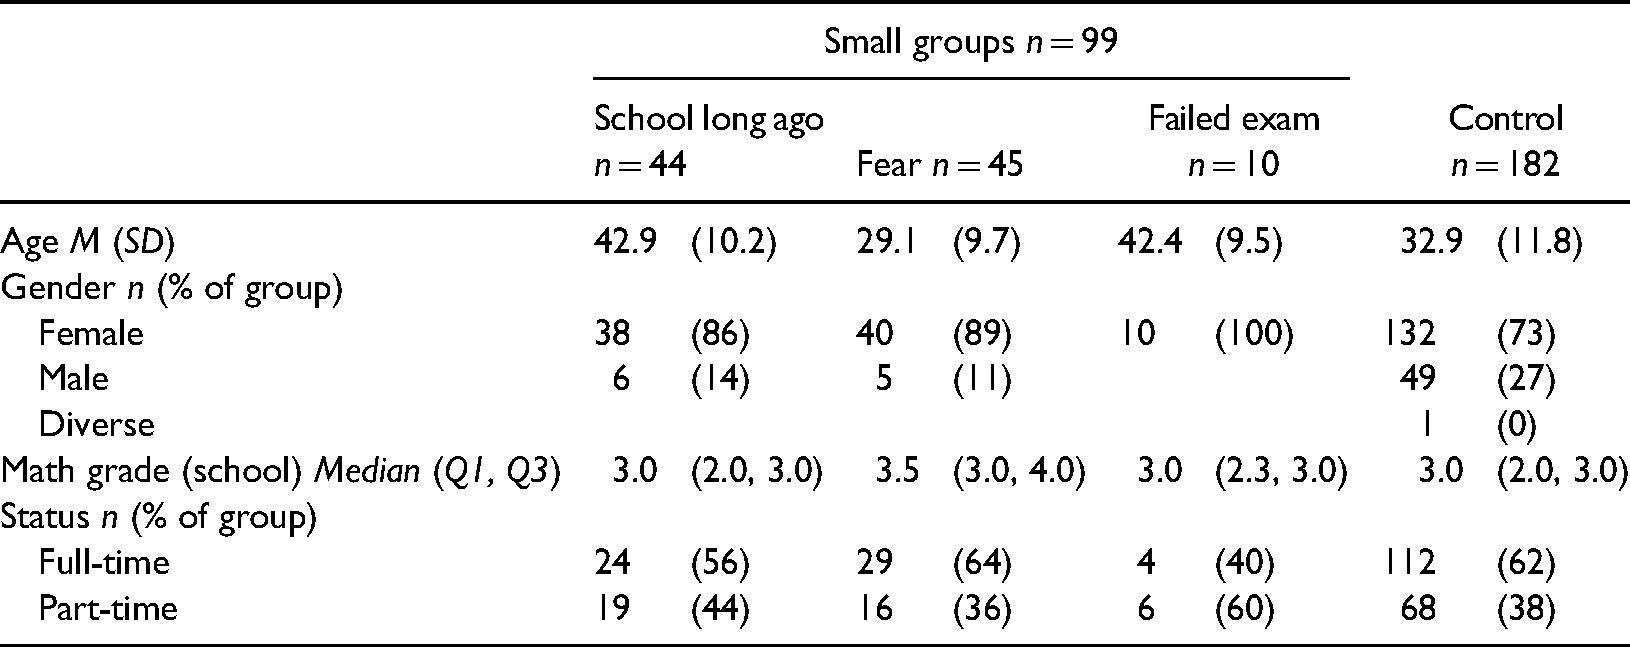
Figure 1 shows students’ attitudes and self-efficacy values at baseline, comparing the groups. Validating the students’ self-assessment, those who allocated themselves to the fear group indeed showed more fear than the students in the other groups. They also showed less self-efficacy expectation than the other groups.
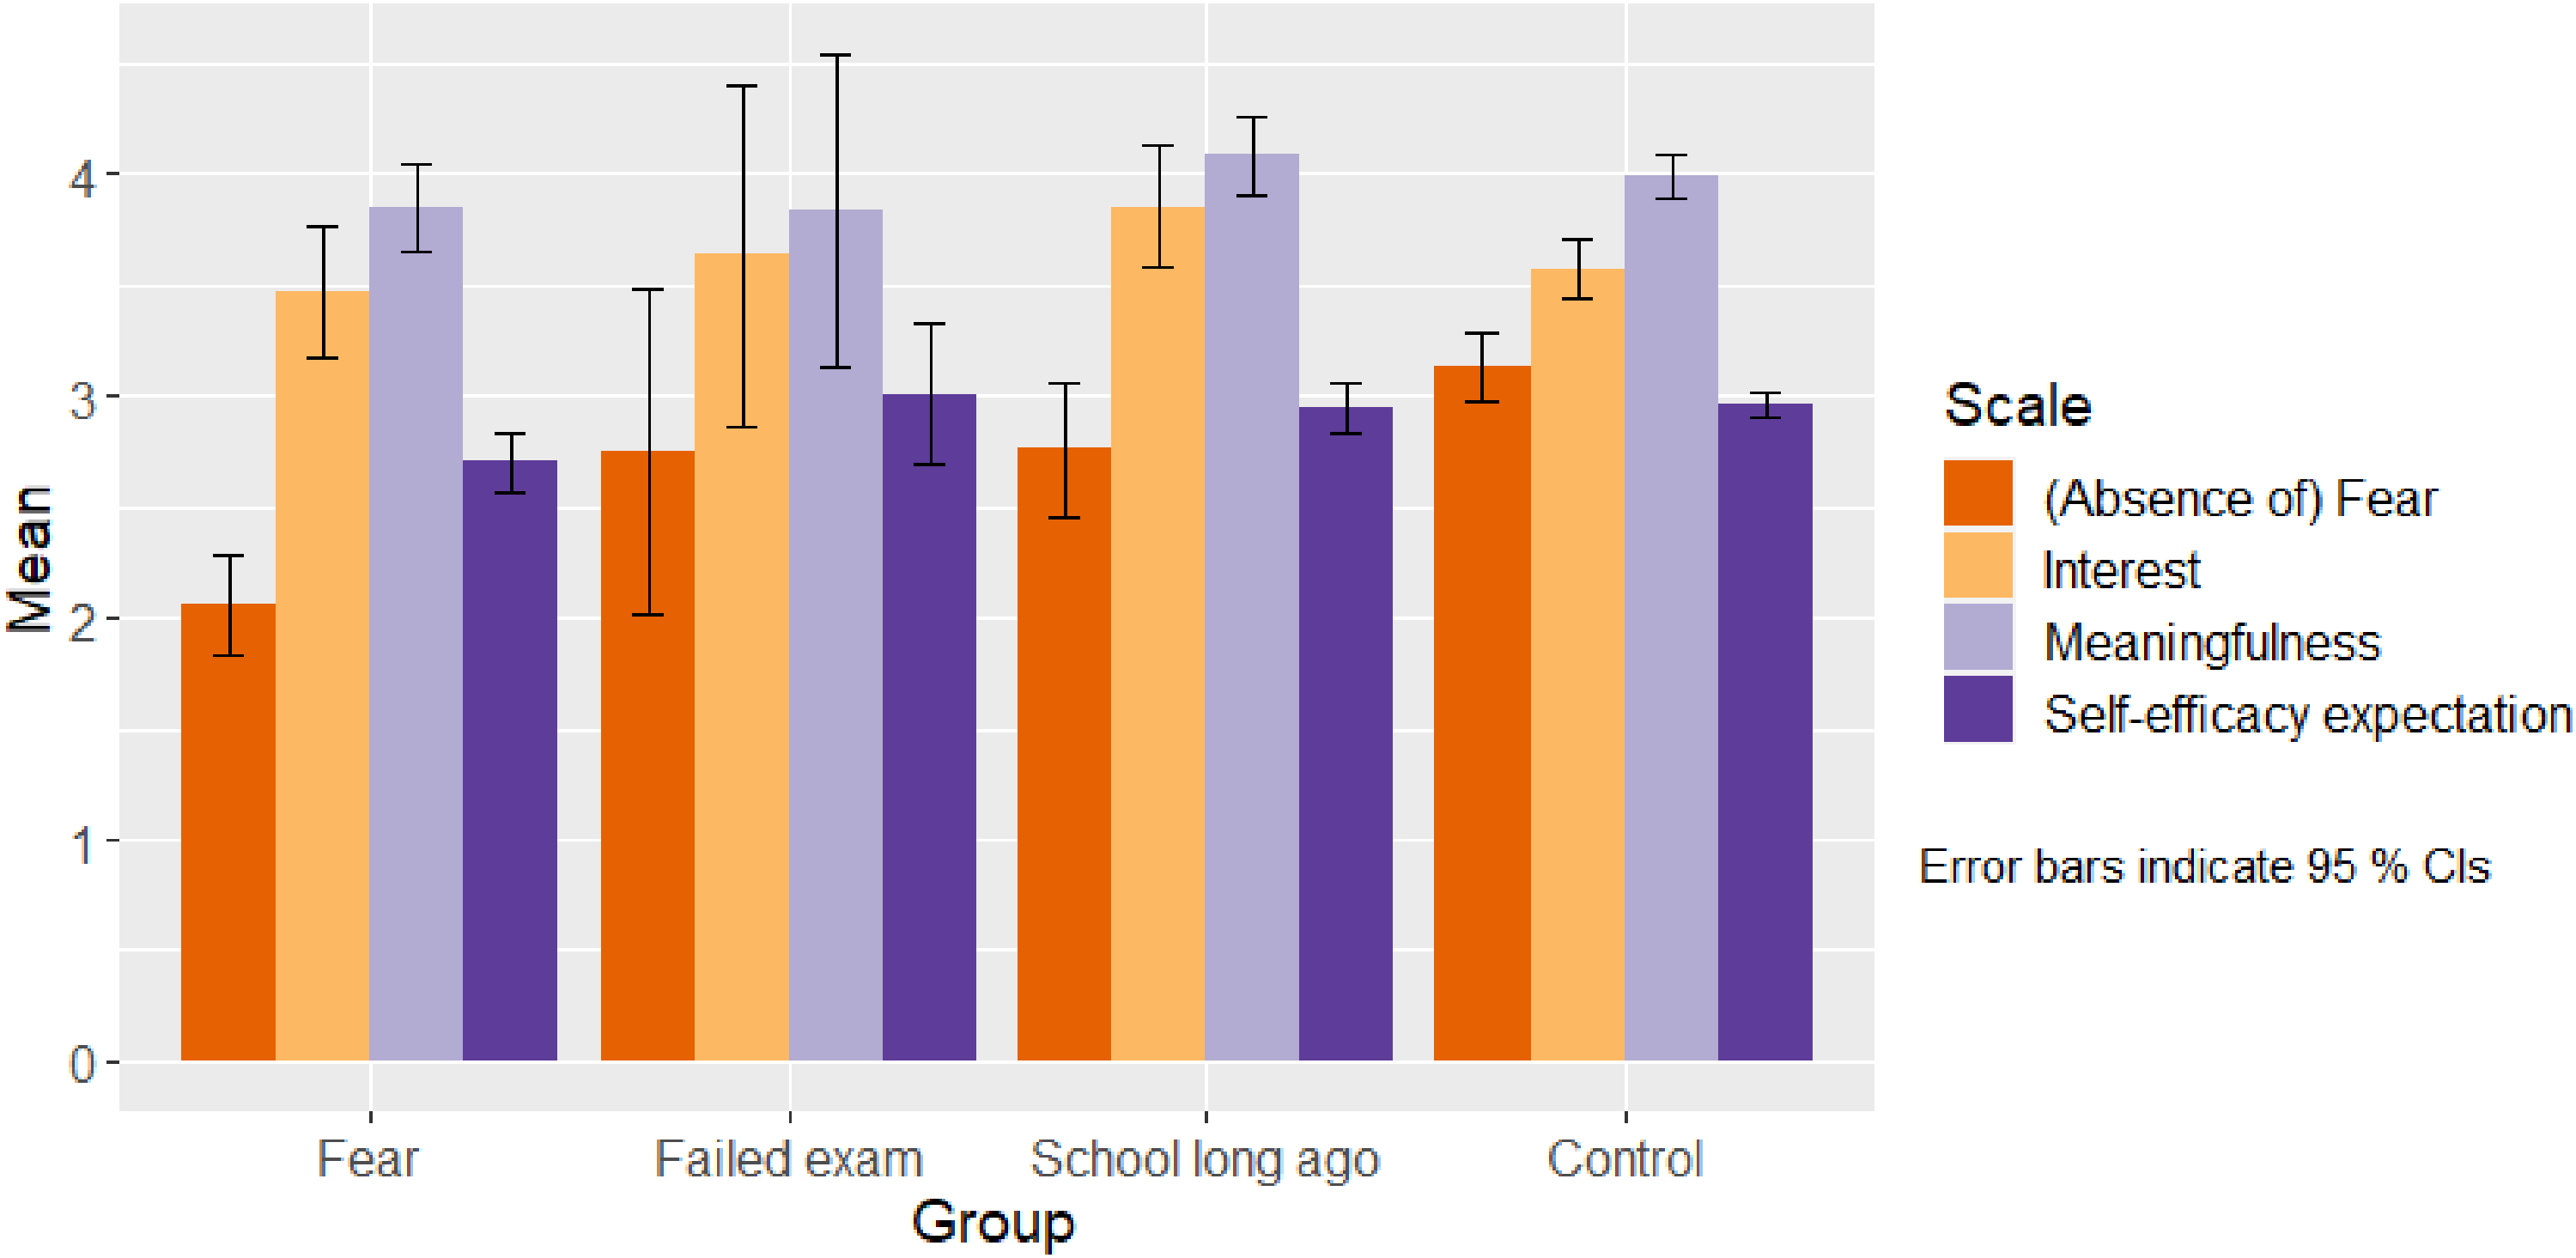
Groups’ attitudes at baseline.
There was very little activity in the groups. Students could contribute to their group until the end of the semester, i.e. from November till March. However, after introducing themselves, most students did not write any post. The most active group was the group of students who went to school some time ago with 12 threads that had at least one comment (i.e. did not only consist of the first post). Comparably active was the group of students who already failed the exam with 11 such threads. In the group of students with fear of statistics, there were only 5 such threads. Table 2 (lower part) shows the themes that were brought up by the students.
Figure 2 and Table 4 show the change of attitudes and self-efficacy expectation over time. We constructed adjusted Cousineau-Morey Confidence Intervals as described by Baguley (2012) using the syntax he provided. These are indicated by the inner tiers of the confidence intervals (indicated by the small horizontal line) in Figure 2. Non-overlapping intervals correspond to differences in means over time which are also indicated by unequal superscripts in Table 4. The group of students who had failed the exam before was too small to interpret the results (note the quite broad confidence intervals). There is a decrease in fear comparing baseline and after the exam in the three remaining groups. However, this is not the case comparing baseline and after the course units. No change was seen for interest in neither group, while the control group attributed more meaningfulness to statistics after the exam. The control group as well as the group of older students showed an increase in self-efficacy expectation between baseline and after the course units which persisted after the exam.
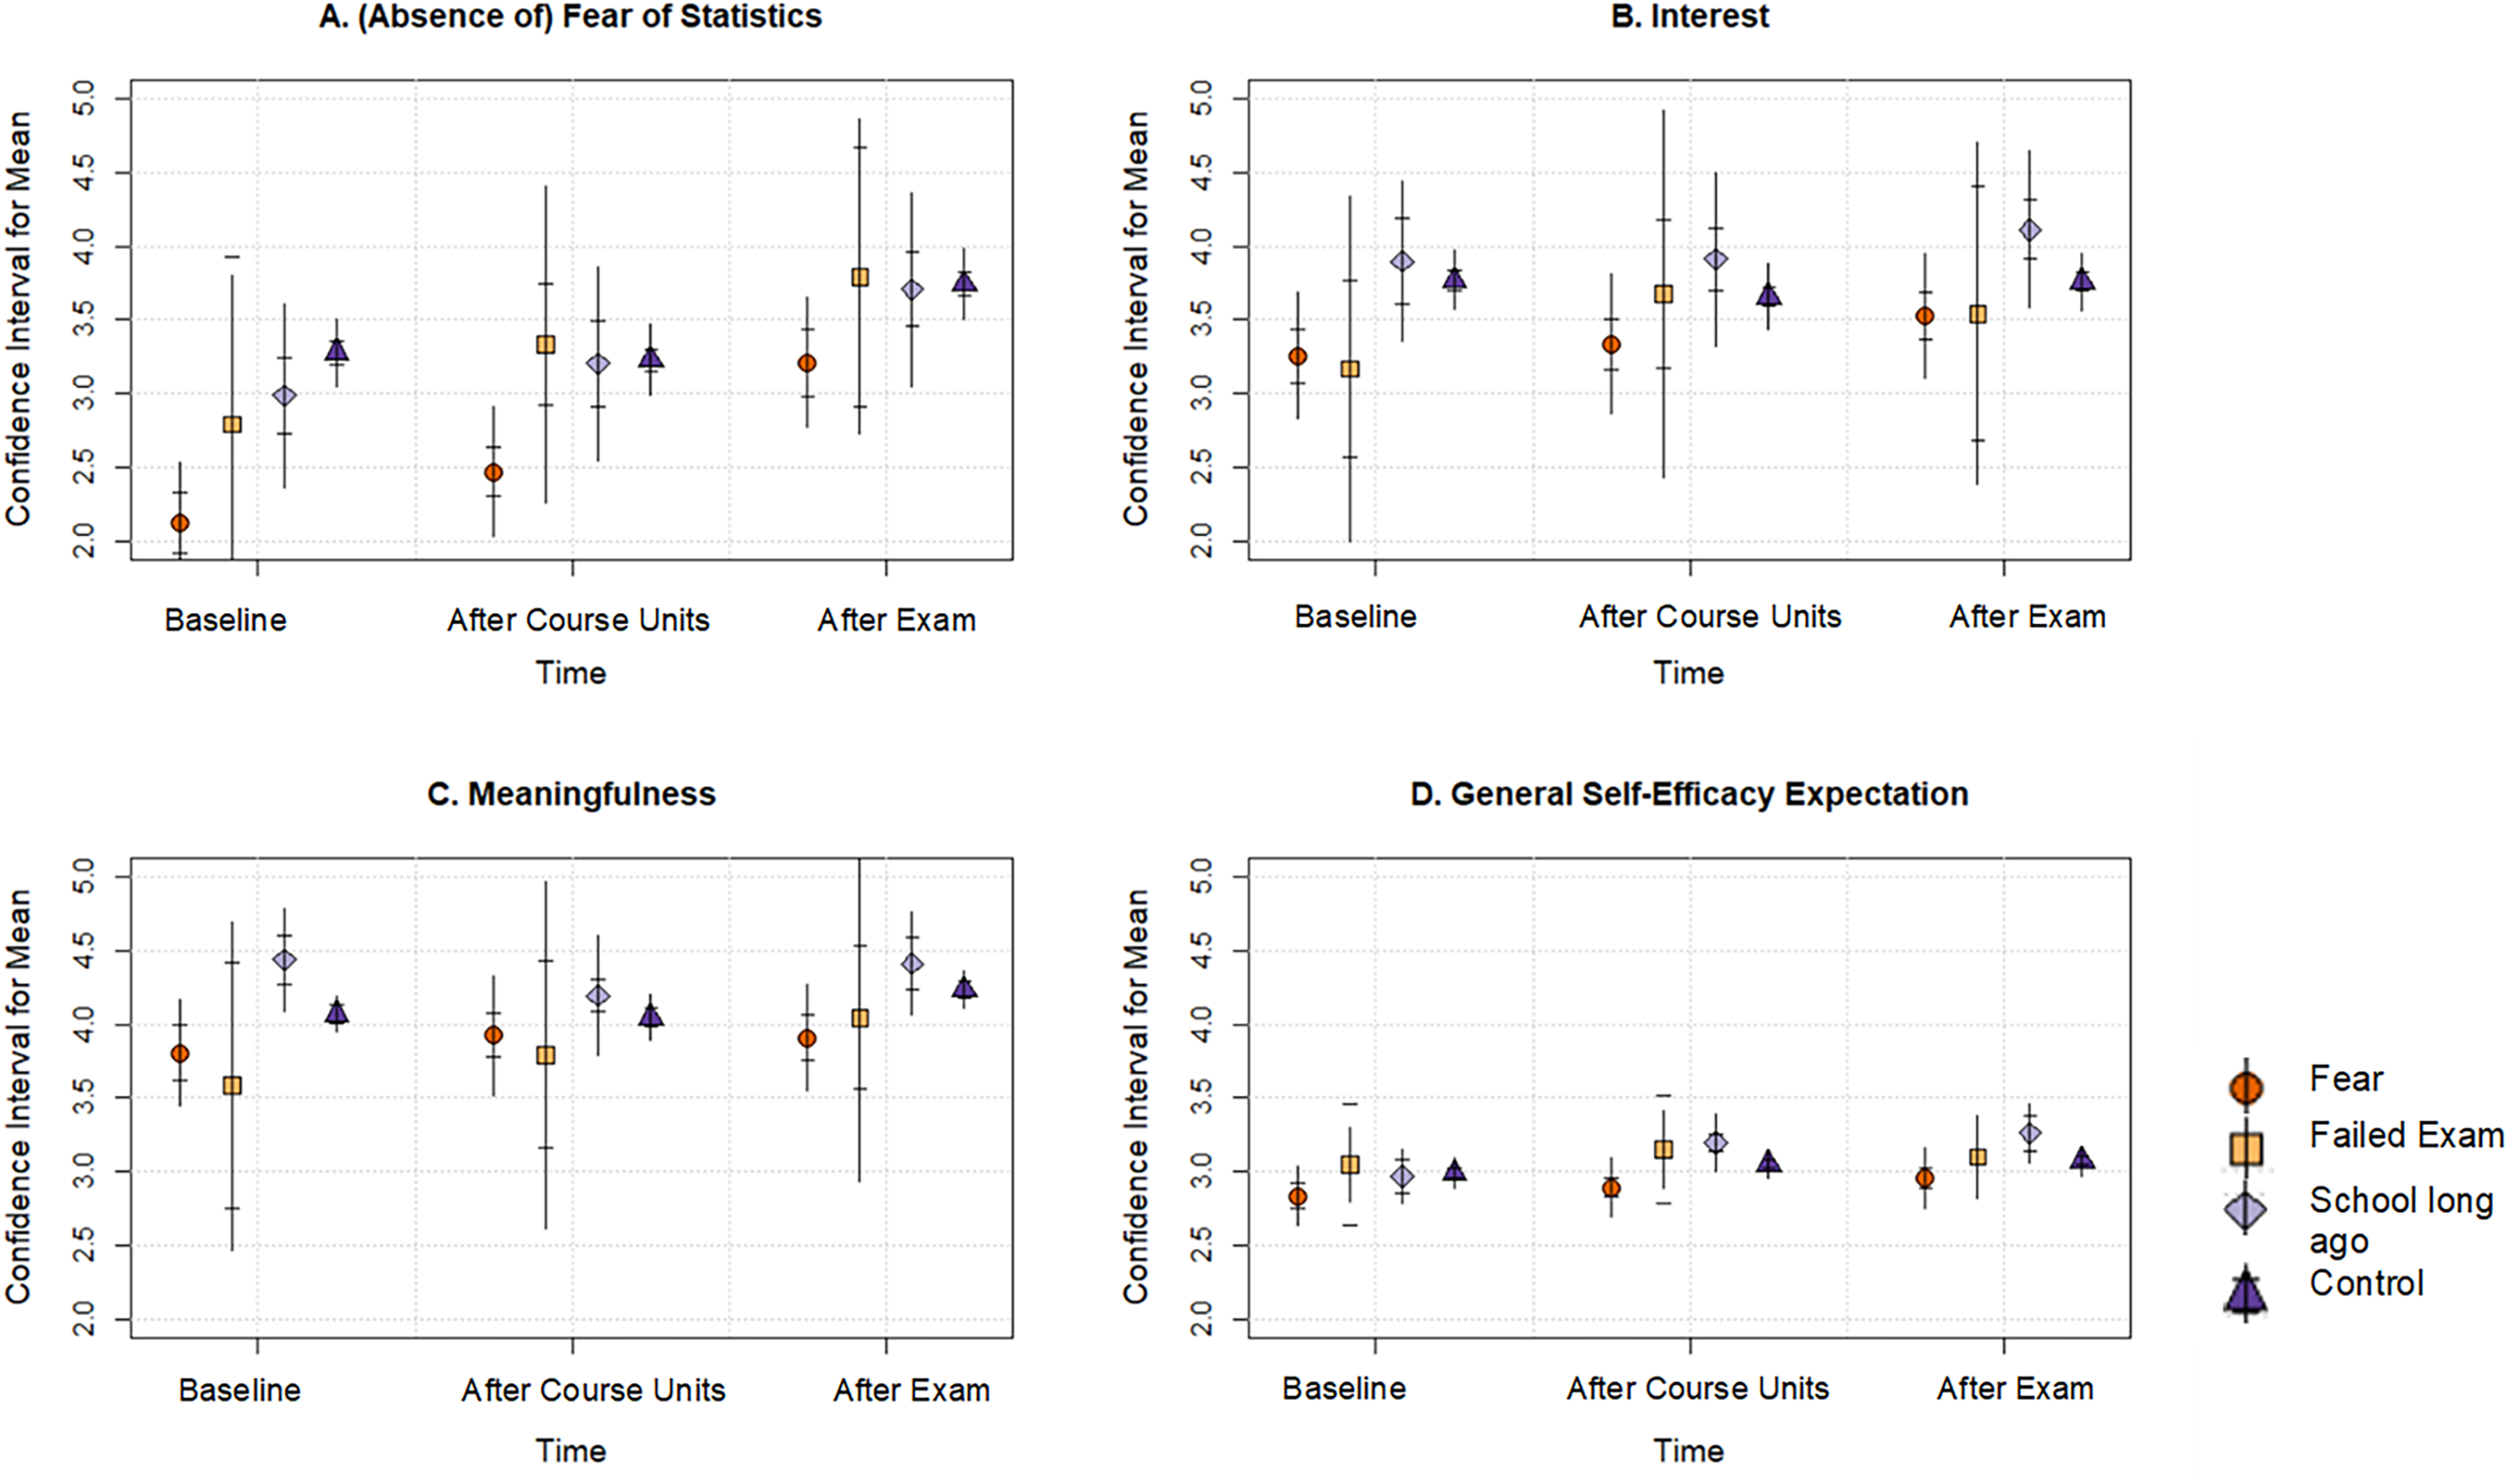
Change of attitudes and general self-efficacy expectation over time.
Means and Cousineau-Morey confidence intervals of groups over time.
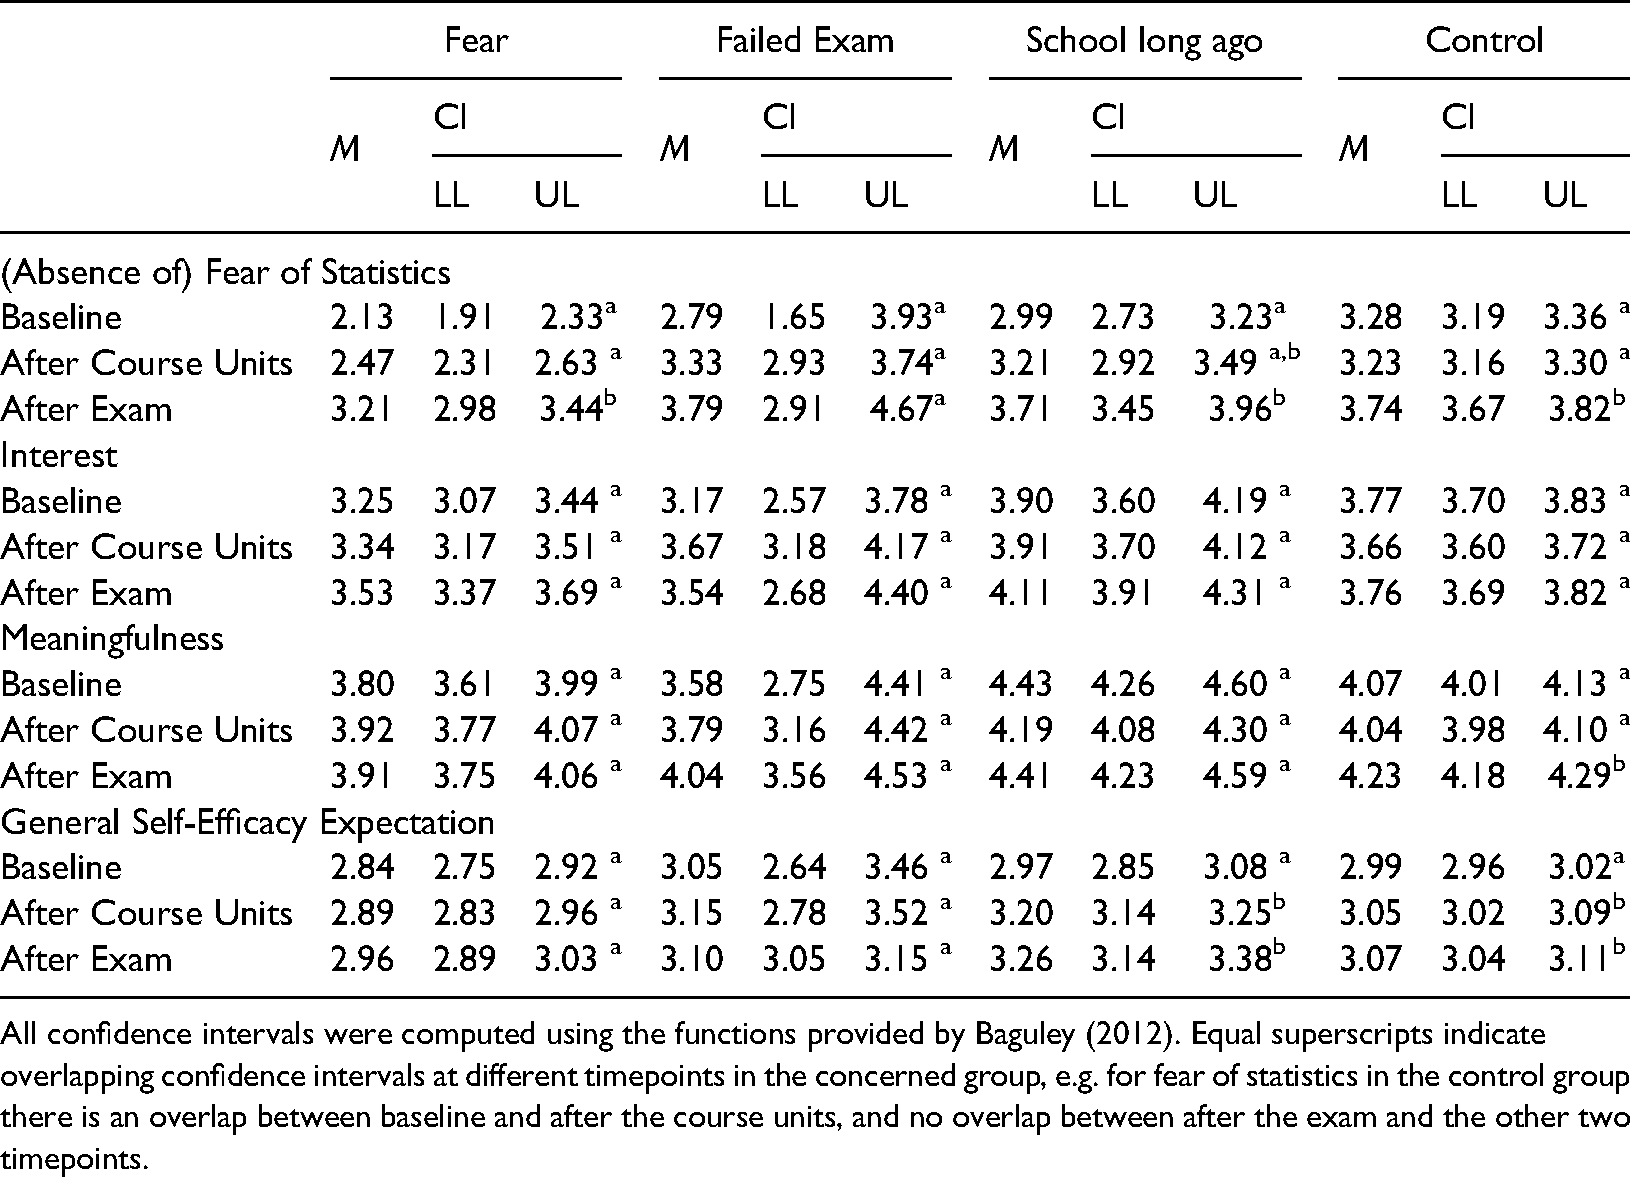
All confidence intervals were computed using the functions provided by Baguley (2012). Equal superscripts indicate overlapping confidence intervals at different timepoints in the concerned group, e.g. for fear of statistics in the control group there is an overlap between baseline and after the course units, and no overlap between after the exam and the other two timepoints.
Most of the students who planned to take the exam, actually did so (Table 5). The grade point average was quite low; however, this is not unusual at the FernUniversität. The control group as well as the fear group performed better than students who failed the exam before or whose school time was a long time ago.
Exam participation and grades.
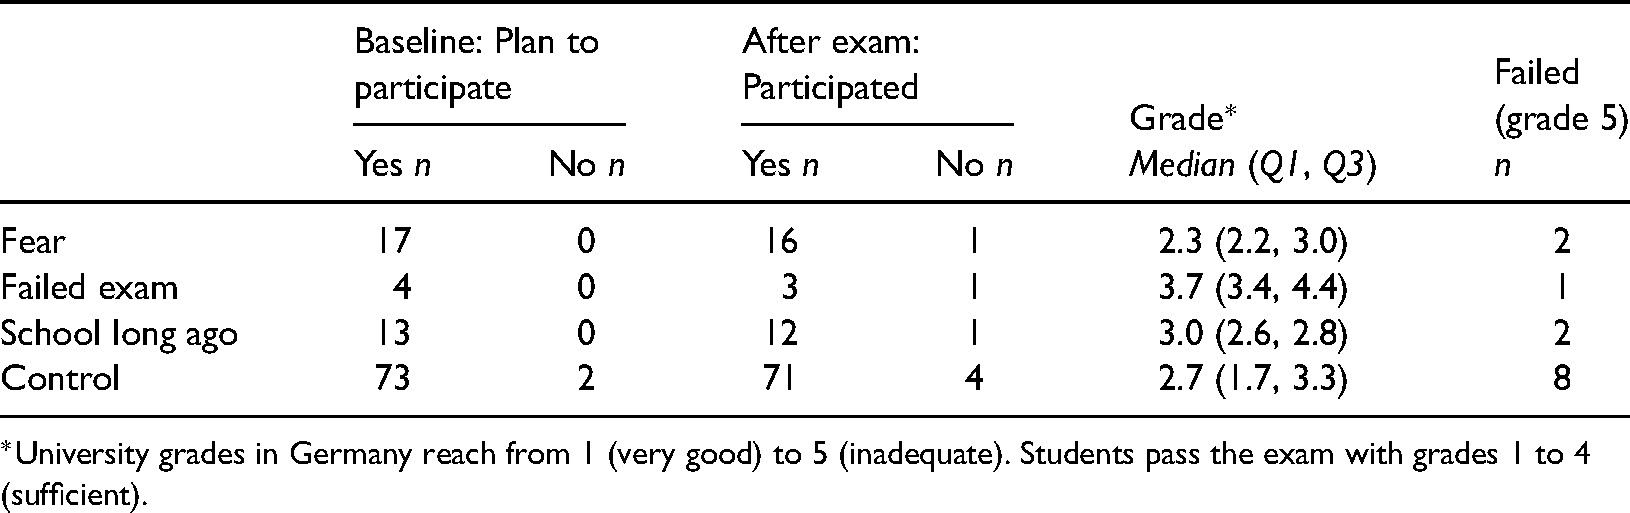
*University grades in Germany reach from 1 (very good) to 5 (inadequate). Students pass the exam with grades 1 to 4 (sufficient).
In their answers to the open question, some students stated that it was a good experience not being alone and exchanging thoughts and feelings with others. However, most of the students stated that the groups did not help them at all (e.g. “The small group was of no advantage at all.”), that they did not actively participate (“I did not use it actively”), and that they almost forgot their group existed (“I forgot that there was a small group, therefore I only wrote once, and that was introducing myself.”).
Discussion
Facing the challenge of teaching statistics for distance-learning university students with highly heterogeneous backgrounds and different personal constraints, we identified three clusters of students that might profit from supervised small discussion groups in an otherwise quite large learning environment. We offered these groups to students whose school time was long ago, who had fear of statistics, and who failed the exam before. The groups were limited to topics other than the course material and aimed at fostering discussion and exchange about learning strategies, fears and struggles. We hoped that participating in the groups might lessen fear and empower the students to make better use of the existing course material and discussion forums. Since such special settings require quite a few resources, it is worthwhile to evaluate if they do have any effect. We were interested in effects regarding attitudes, fear, and especially course performance.
All in all, the small groups were not very well attended. Of the almost 4,000 enrolled students – many of them likely belonging to one of the clusters the groups aimed at – only about 100 were interested in participating in the first place. Of those who did participate, many did not write any post or comment besides their (required) initial introduction. Moreover, most students stated that the groups did not help them at all culminating in some students forgetting that the groups even existed. More instructions on behalf of the tutor, or synchronous meetings via chat or a video conference tool might have been helpful. Hrastinski (2008) shows how synchronous discussion increases collaboration. However, in our experience synchronous offers are not very welcome within the student body of the FernUniversität because of the students’ many other obligations.
There was a reduction of fear between baseline and after the exam in both the group of students with fear and the control group. However, this was not the case comparing baseline and after the course unit. Assessing fear of statistics after the statistics exam with the grades already released might be a disadvantageous time point. The students might mostly fear the exam, so it is no surprise that fear is less afterwards, the more so, if they actually passed the exam. Anyway, the reduction of fear was not limited to the group participants, but occurred in the control group as well.
Regardless the fact that there was no benefit of the small groups compared to the control group, it is interesting that general self-efficacy expectation increased in the group of older participants and the control group. Successfully completing a course that one might not be very fond of might lead to an increase in general self-efficacy expectation, particularly in older participants. General self-efficacy expectation usually is considered a quite stable construct (Luszczynska et al., 2005). However, succeeding in the statistics course, students might get the feeling of “If I did that, I can do almost anything.”
Why there was an increase in meaningfulness after the exam in the control group is worth further investigating.
We did not find any benefit of the groups regarding the grades. The control group and the students with fear tended to perform better than the other groups. Statistics anxiety has been shown to be less related to actual test scores than to students’ (mis)perceptions of their competence in other studies as well (Hanna & Dempster, 2009).
Our results are limited insofar that only about 1/40 of the course participants signed up for the groups. This raises the question if the results can be generalized, and – even more important – what was up with the rest of the course participants: Did they manage the course well on their own? Did they not, but were not interested in the groups? Did they miss the deadline for signing up? Did they not want to participate in a study? Further, the control group consisted of participants who were not interested in participating in the small groups anyway (and therefore might not consider themselves belonging to one of the target clusters, or if so, might not consider group work to be helpful for them). Besides that, the groups were rather small, especially the group of students who already failed the exam. We plan to repeat the study with a waiting list control group, a preferably larger sample, and – to address the beforementioned problem of assessment after the exam – with an additional measuring time point just before the exam.
The moderated small groups were only possible due to an internal research fund that allowed us to employ the necessary tutor. If the results prove stable, it is questionable if they are worth the effort, given the effort invested, and considering how little the students valued the groups, participated in, or profited from them.
Footnotes
Declaration of Conflicting Interests
The author(s) declared no potential conflicts of interest with respect to the research, authorship, and/or publication of this article.
Funding
The author(s) disclosed receipt of the following financial support for the research, authorship, and/or publication of this article: This work was supported by internal funding, We received internal funding for the teaching intervention described in this manuscript.