
Abstract
With the objective to improve the understanding of the dominant fan noise source mechanisms, a comprehensive experimental study was conducted at a low speed fan test rig. The aerodynamic fan map as well as the acoustic characteristics of the fan was measured for a new blade integrated disk (Blisk) rotor with systematic variation of the shaft speed and throttling. The interpretation of the results is supported by simulations of the experiment with a physics-based analytical in-house tool for fan noise prediction. For the acoustic measurements, an array of wall-flushed microphones was used in the inlet section. By means of radial mode analysis techniques, the broadband and tonal sound powers are calculated for each operating point. In the obtained comprehensive database, systematic variations of the tonal and broadband sound power with the flow rate are found. These patterns can only partly be correlated to the varying incidence angle of the rotor blades. Comparing the mode distributions of the measured noise and the analytical models then allows conclusions on the predominant noise sources of rotor–stator interaction and inflow-rotor interaction.
Keywords
Introduction
The goal of the present work is to assess the impact of different fan operating points on fan noise generation. For that purpose, a comprehensive experimental study was performed in a small-scale low-speed aeroacoustic fan test rig. 1 The fan aerodynamic performance map and its acoustic characteristics were assessed by measuring the fan at several operating points. The test rig is equipped with a new blade integrated disk rotor (Blisk). This type of rotor is milled from one piece, enabling virtually unlimited variations in the blade number and reducing the number of assembly parts. Thus, also the weight can be significantly reduced. 2 From an aerodynamic and aeroacoustic point of view, the arbitrary shape opens new optimization spaces, but most evident is the improvement of the flow properties at the hub, where there are no gaps that can affect the flow.
The experimental study is accompanied by calculations with an analytical fan noise prediction method. 3 In previous studies, this method has been used for acoustic optimization in the design process of turbofans4–6 and helped to derive noise reduction measures. 7
In the present paper, the analytical method is used to help analyze the measured sound radiation upstream of an existing model fan. The measurements were simulated on the basis of the measured flow parameters and different noise sources were calculated. First results showed that the dominant sources that radiate in upstream direction are the inflow-rotor interaction and the tonal and broadband rotor–stator interaction (RSI); hence, we focus on these sources.
The interdependency of fan design, loading condition, and fan noise has been the topic of manifold experimental, analytical, and numerical studies, some are found in Refs. 3, 4, and 8–11. While the source of tonal RSI noise is well known since the study of Tyler and Sofrin, 12 it is still the subject in recent studies. The propagation and radiation properties of the fully correlated tonal RSI noise behave very sensitively to changes in the operating conditions or geometry.6,10
While it is known that the broadband noise increases with the fifth power of the rotor speed,3,9,11 the correlation between fan loading and broadband noise is more complex.8,9,13 Decomposition into radial modes of measured broadband noise showed that the sound power can in fact not be assumed to be a uniform distribution over the duct modes and frequencies. On the contrary, an asymmetry of the mode spectrum was found as well as frequency bands with elevated sound power, that were not always related to cut-on frequencies of duct modes. 1
The authors see the need for further research and advanced analysis techniques, to interpret the results of in duct measurements and to trace the findings back to specific noise source mechanisms as this is a prerequisite to develop noise reduction measures. 7 This paper provides a systematic parameter study with the objective to identify specific sources on the basis of their respective radiated mode pattern. For that purpose, established mode analysis techniques are applied on a comprehensive set of measurement data, enabling accurate computations of the modal sound power for a variation of loading conditions. By combining the experimental results with the modeled noise sources, the contribution of these sources is evaluated.
In the scope of this paper, the test rig and model fan are briefly described and an outline of the signal processing chain is given. The experimentally determined tonal and broadband sound powers at varying loading conditions are then presented. Finally, the behavior of different noise sources at varying loading conditions is physically interpreted with the help of physics-based source models. Thus, the complex behavior of the measured broadband sound power at varying loading conditions is traced back to the superposition of the inflow-rotor interaction and the broadband RSI noise sources.
Experimental Setup
The test rig is described in the next subsection, followed by a brief description of the Blisk rotor.
Fan Test Rig
Experiments were performed in a small-scale low-speed fan stage test rig with a conventional rotor–stator arrangement without core stream. A Blisk rotor was designed to provide an optimized performance in combination with an already existing stator. All measurements were performed in the duct with a diameter of 453.6 mm. In order to reduce inflow distortions, a simplified inflow control device (ICD) was attached to the bell mouth (see Figure 1). The test rig is located in a laboratory environment with no special acoustic or aerodynamic treatment, except for the abovementioned ICD. Overview of the test rig and the used ICD.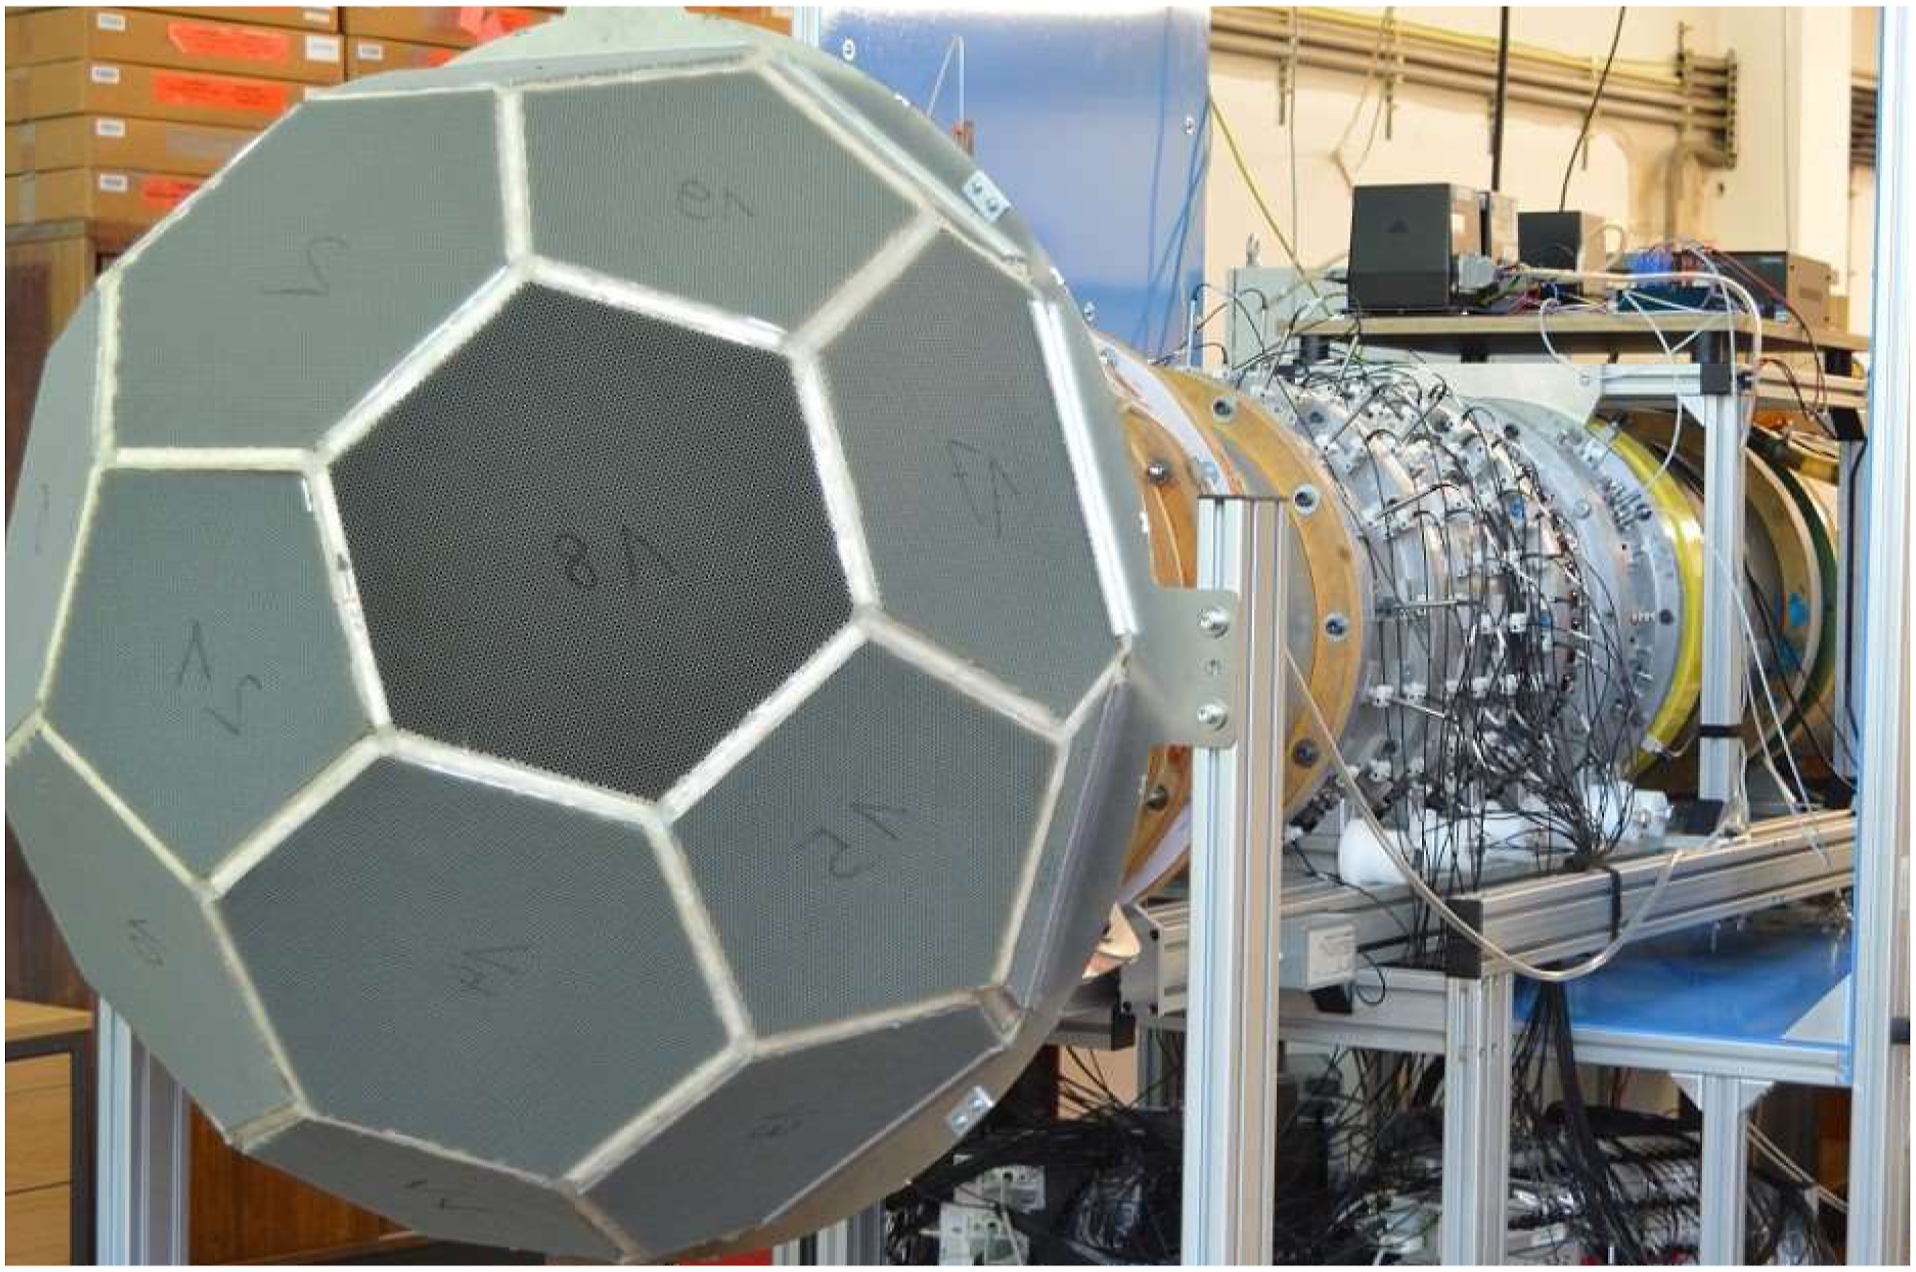
The turbulence intensity and the non-stationary and non-homogeneous inflow distortions are reduced significantly compared to the measurement without ICD as was shown by Oertwig.
14
Downstream of the bell mouth, in a nozzle the diameter is reduced to match the rotor diameter. The acoustic measurement section is located between the rotor casing and the inlet nozzle (see Figure 2). Acoustic measurement section and Blisk rotor.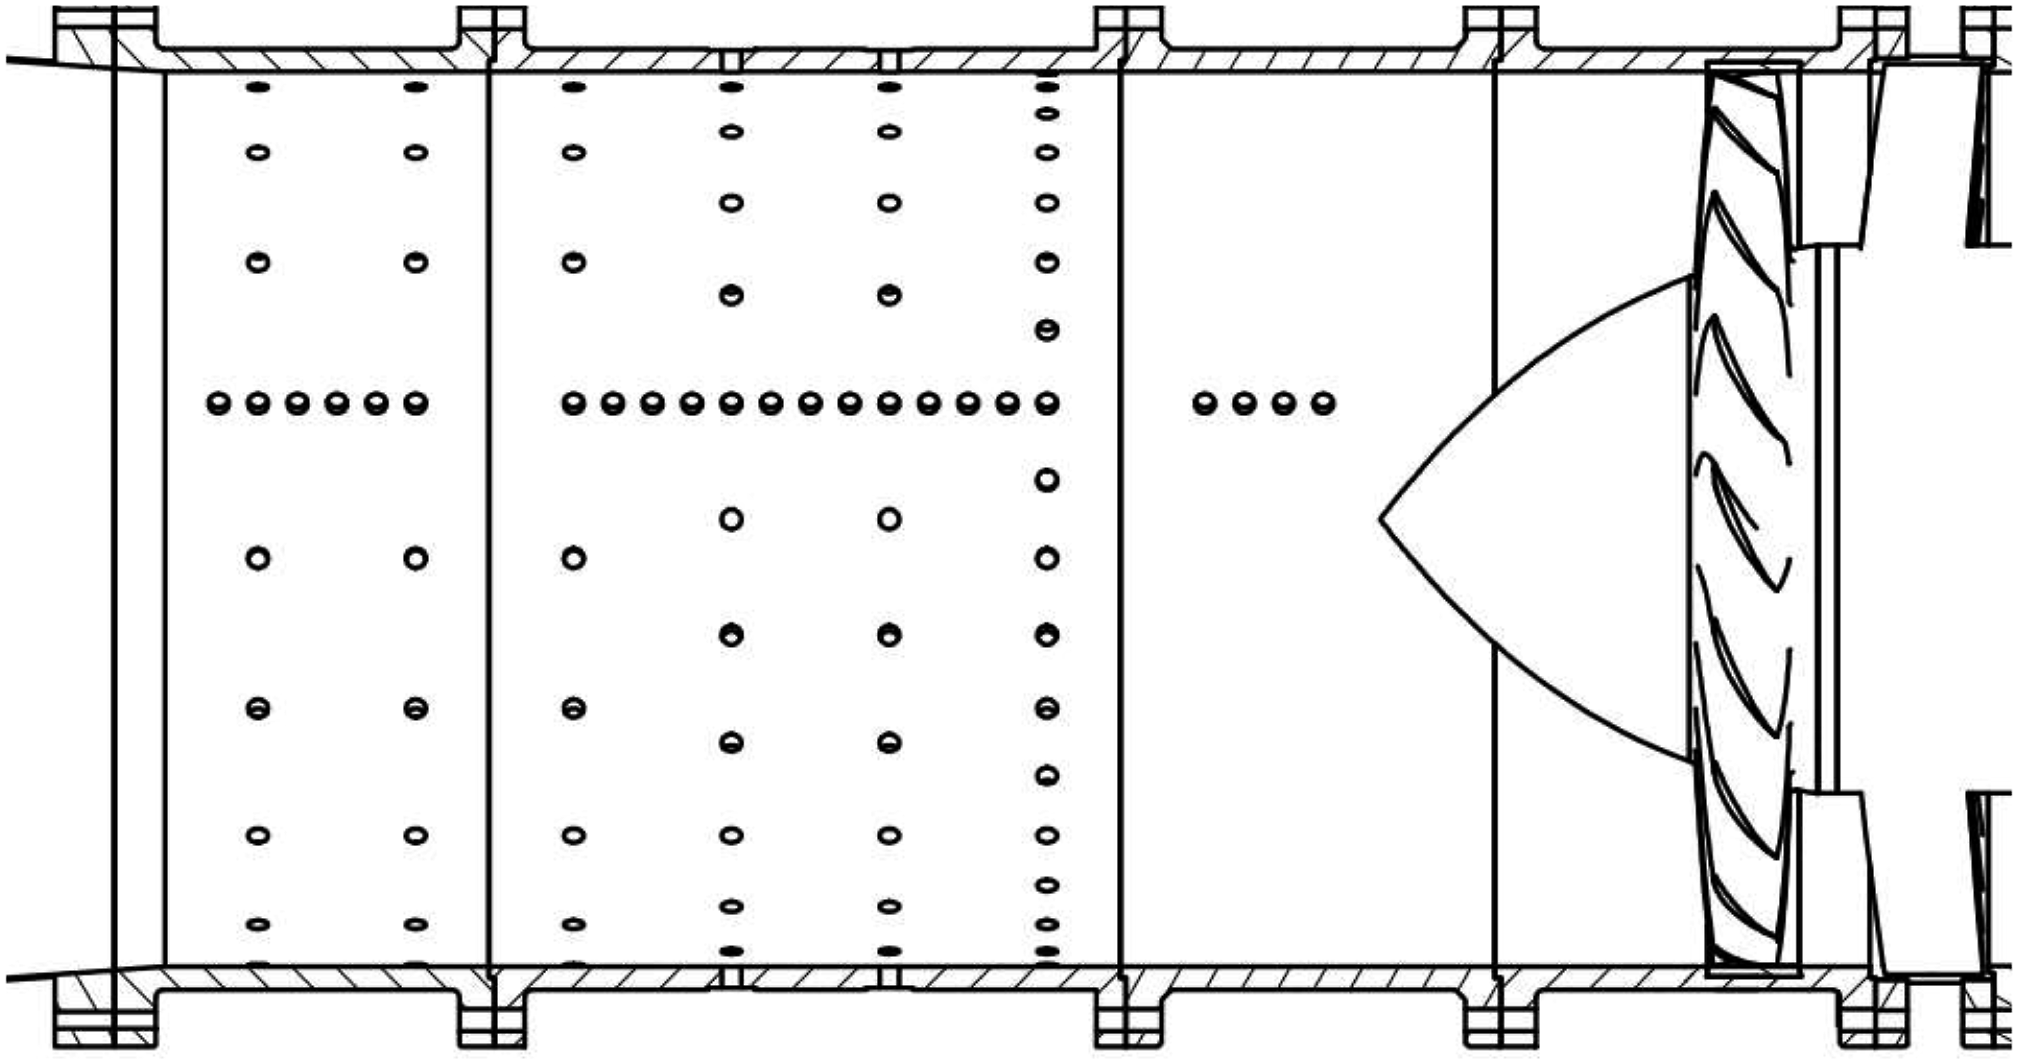
The microphones are mounted wall flushed in six ring arrays and one line array. The first three rings (from left to right) are equipped with 18, the fourth and fifth rings with 24, and the sixth ring with 36 microphones, that are uniformly distributed in azimuthal direction, respectively. Additionally, a line array is used with 23 equally spaced microphones, except for two gaps caused by the duct flanges. Downstream of the stator follow a diffusor, the outlet measurement section, an anechoic outlet, and the throttle, that is used to adjust the operating point; this allows a systematic parameter variation. Further information on the test rig can be found in reference. 1
Blade-Integrated Disk Rotor
The integrated disk rotor was designed with the goal of achieving a representative configuration in terms of relative Mach numbers and without flow detachments. The design boundary conditions are given by the rig maximum rotational speed of 3200 r/min, the flow channel outer and inner diameter, and the already existing stator consisting of V = 32 curved plates with an inflow angle of 34°. The blade count was chosen as B = 18. Following the findings of Tyler and Sofrin, 12 the rotor–stator interaction mode of the first BPF is cut off at the design operating point. This means that the mode that is excited due to the phase relations between the rotor wakes and stator leading edges with azimuthal mode order m = V − B = 14 does not propagate in upstream direction but decays exponentially. For the design of the blade shape, a semi-analytical approach for the design of low-Mach number fans developed by Jaron 15 was used.
In this approach, NACA65 profiles are generated discretely distributed along the span (see Figure 3(a)) by using the correlations empirically found by Lieblein
16
regarding the design incidence, deviation, and lift coefficient. By stacking the profiles along their center of gravity, a 3D blade shape is generated (see Figure 3(b)). The vortex design was manually adapted to fit the constant inflow angle of the stator. The aerodynamic stability is ensured by using the empirical blade loading criteria of de Haller
17
and Lieblein.
18
Design of the blade integrated disk rotor.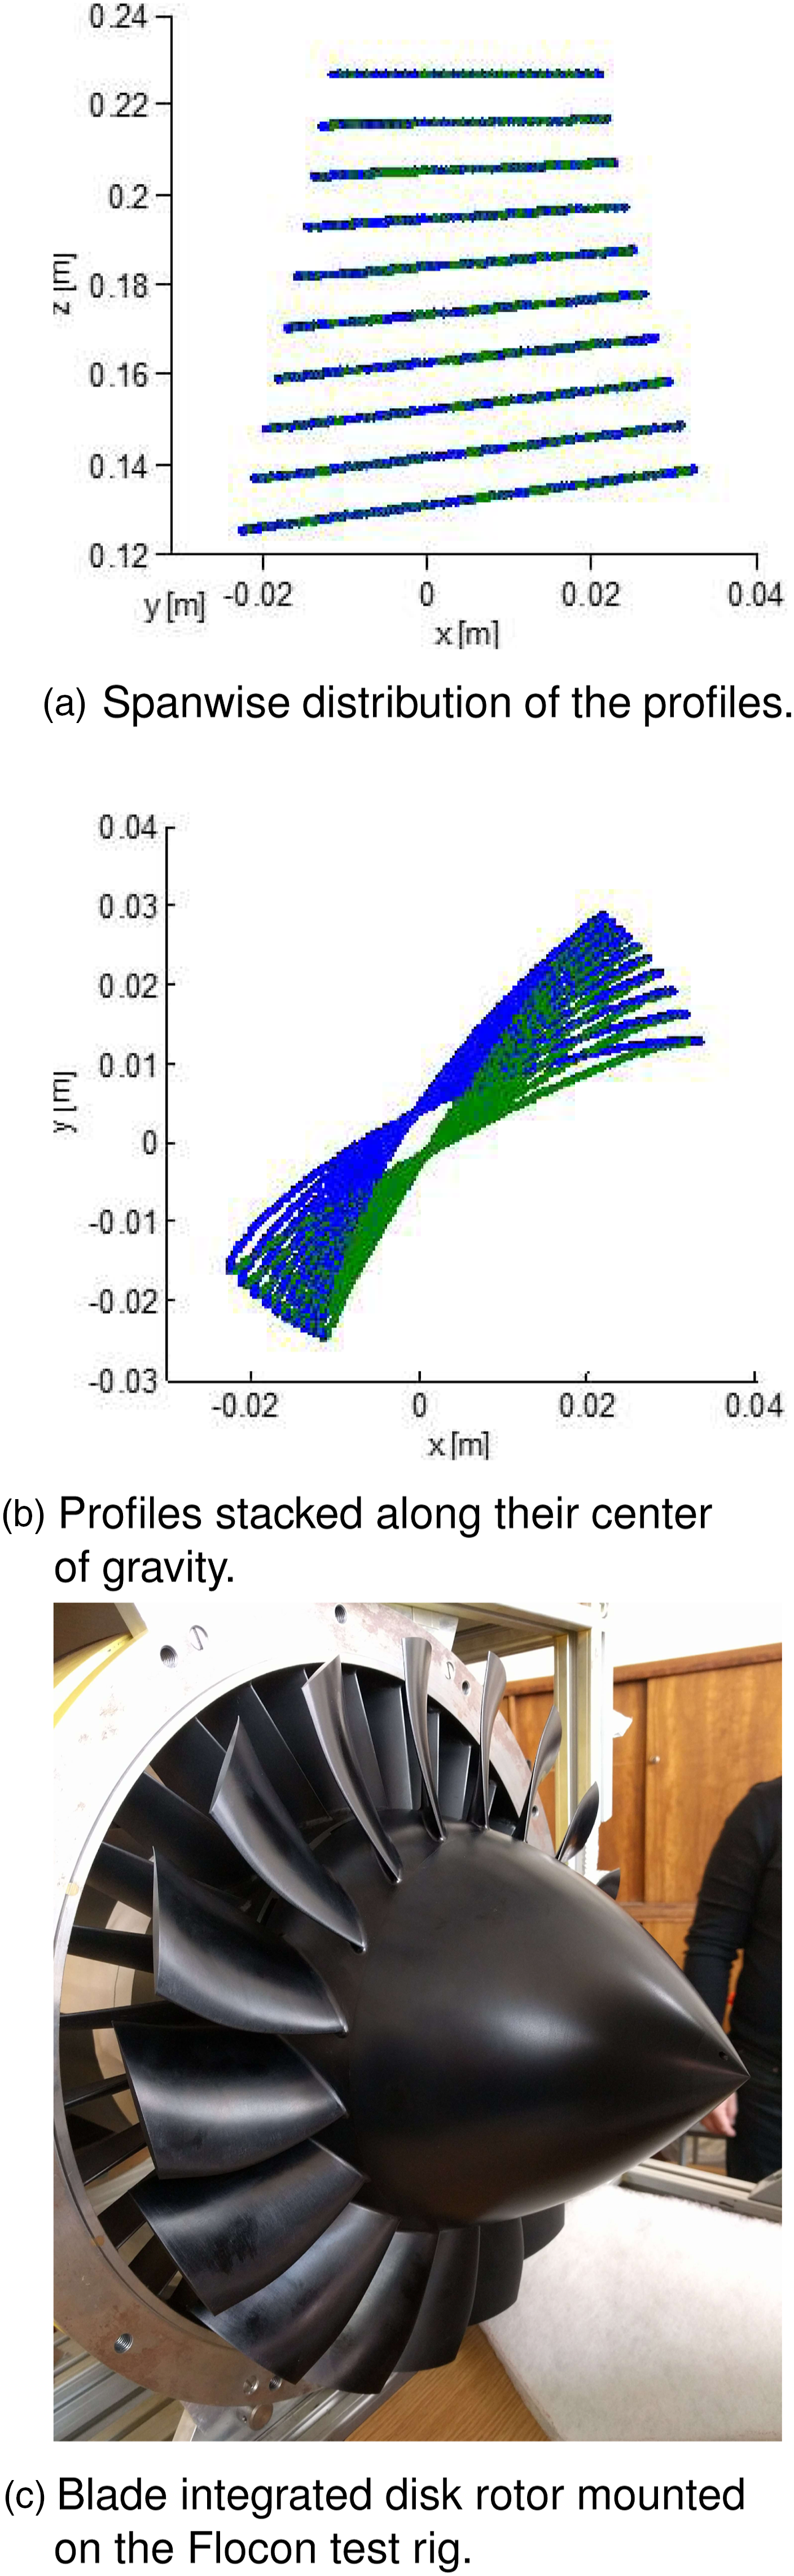
The aerodynamic efficiency and the mechanical stability of the final design (see Figure 3(c)) were validated by means of CFD and FEM simulations, respectively. The flow simulation showed no rotor flow detachment and a stator inflow angle without significant incidence. The mechanical simulation confirmed that the occurring highest static stress has a sufficient safety factor.
Aerodynamic fan map
The aerodynamic operating conditions were measured by means of a Pitot tube in the inlet, and four circumferentially distributed static pressure holes in the inlet and the outlet section of the test rig. The total pressure upstream and downstream of the fan is calculated considering the ambient pressure and air density ρ in the laboratory. The performance map in terms of the ISA sea-level corrected value for the mass flow Qcorr and total pressure ratio PR is shown in Figure 4. Performance map of the operating points.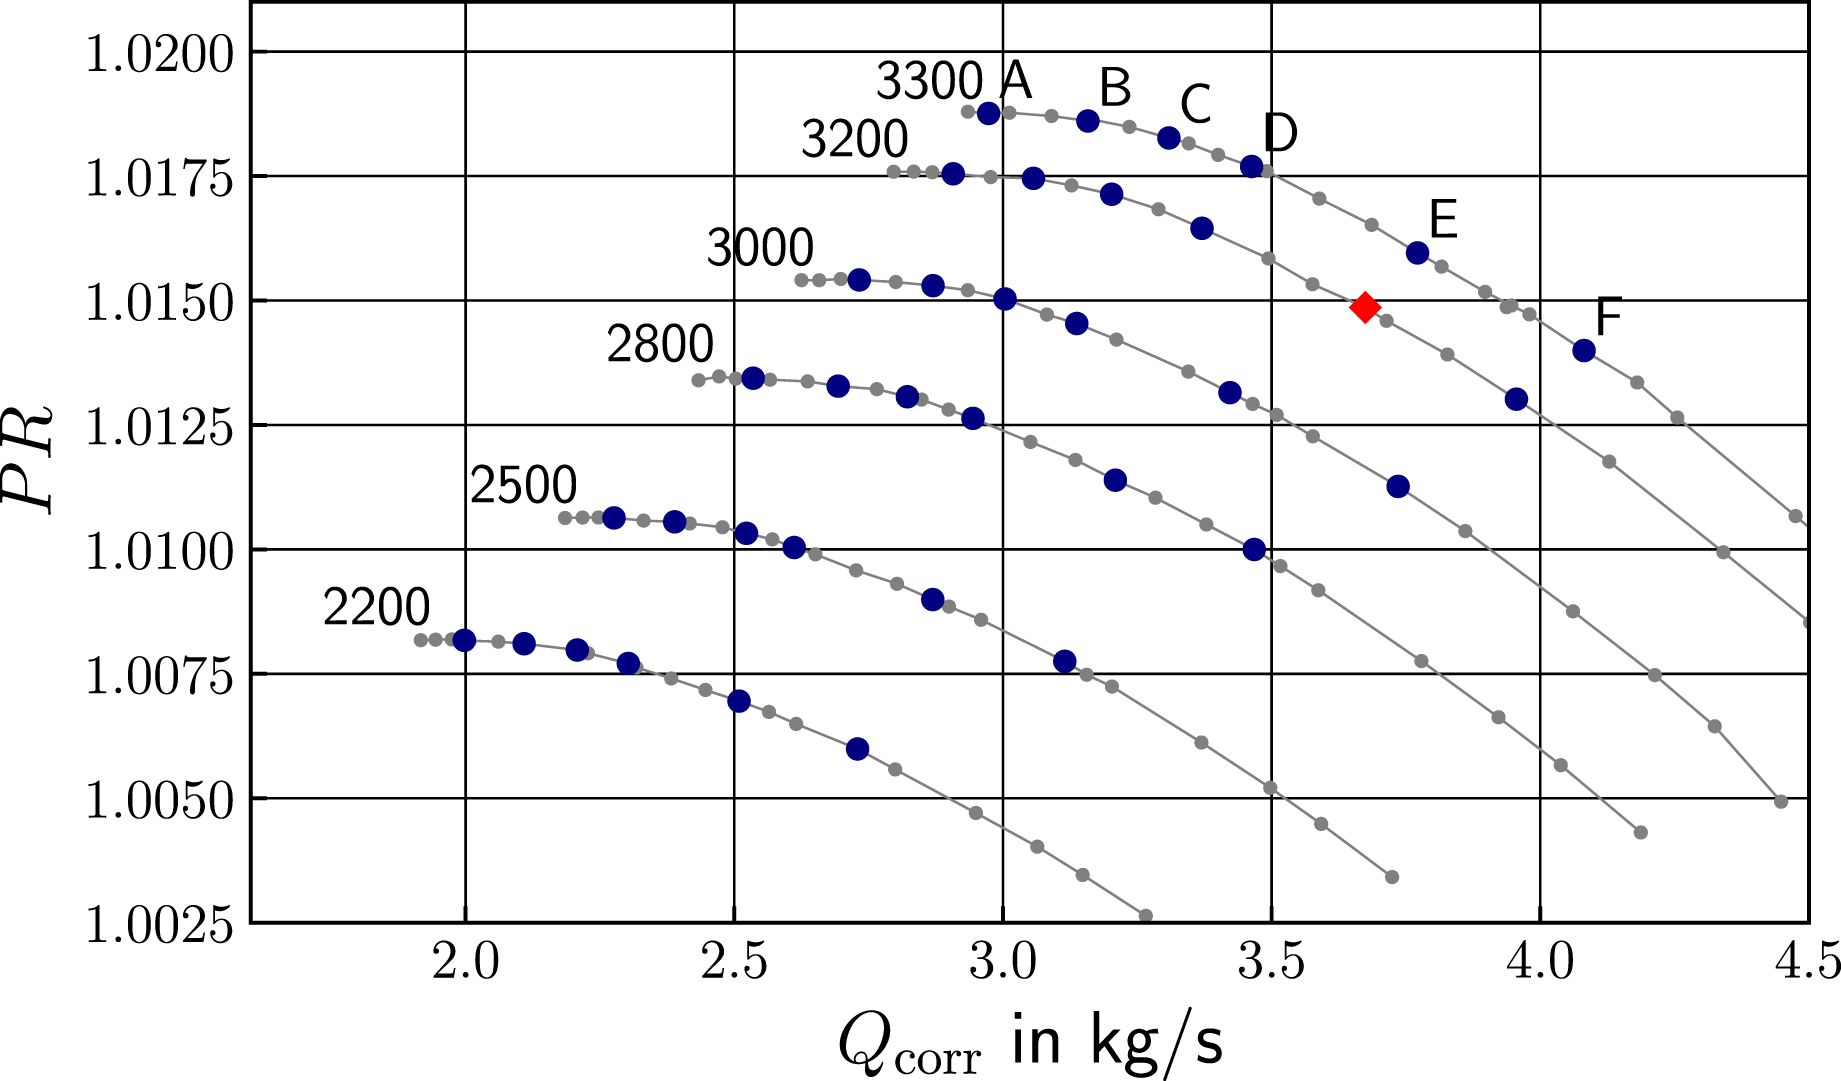
The small grey dots indicate aerodynamic measurements, while the larger blue dots indicate operating points where acoustic measurements were also performed. For each of these points, 60 s of data sampled at 50 kHz was simultaneously acquired using the inlet microphone array. Each fan operation point was set with the help of a throttle device. By setting its axial position at the rig’s exhaust, the mass-flow can be adjusted. By doing that, different flow coefficients can be stablished. In order to address the impact of fan loading on fan acoustics, in this work six flow coefficients were measured and analyzed. The flow coefficient is a non-dimensional ratio of the axial flow speed and the rotor tip speed defined by
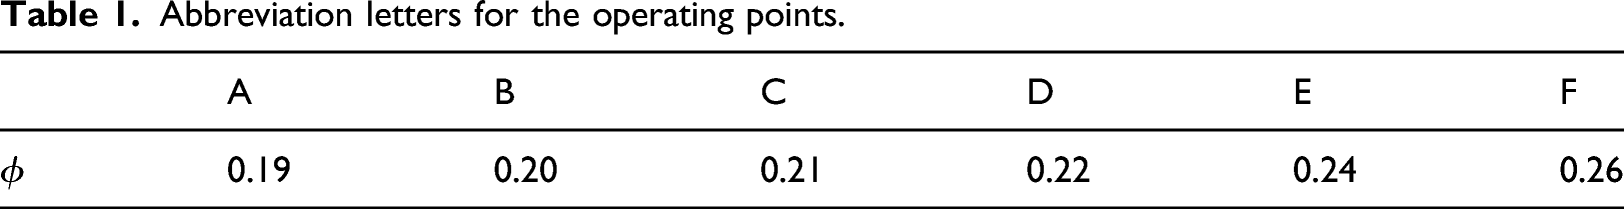
Abbreviation letters for the operating points.
Signal Processing
The signals are firstly resampled using the rotor trigger signal as reference. This approach compensates fluctuations of the rotor speed and suppresses incoherent pressure fluctuations. 19 Signals are subsequently split with the help of a cyclostationary analysis into: one part with a locked phase relative to the rotor, and a second with the fluctuating component.20,21 Through this averaging procedure in the time domain, only pure tones remain in the rotor-locked spectrum. It is therefore also referred to as tonal spectrum. The fluctuating spectrum contains rotor-incoherent fluctuations with random phase and is also referred to as broadband spectrum. The cross-power spectra S pq for each combination of microphone positions are calculated for the fluctuating components.
As described comprehensively in Ref. 12, the sound field in a hard-wall annular duct with uniform axial mean flow can be represented as a superposition of acoustic modes. Each mode is characterized by its azimuthal and radial mode orders m and n, direction of propagation, wave number, and shape function. With these parameters, the modal amplitudes 
The noise sources and therefore also the propagating modes of the fluctuating components cannot be assumed to be fully correlated. The cross-modal matrix 
The least squares fit solution of equations (2) and (3) is calculated with the pseudo-inverse of the transfer matrix. The expected values of the squared-mode amplitudes are found on the diagonal of the cross-modal matrix. With the array used, a full radial mode decomposition up to 2000 Hz is accurate and robust for both the correlated and uncorrelated methods, as was shown by means of the condition number of the array. 1
For the radiated noise, the acoustic energy that is transported by all propagating modes is crucial. The sound power of each mode 
Measurement Results
In this section, experimental results are exemplarily presented for the design operating point. As the rotor–stator interaction (RSI) mode of the BPF tone is cut off, the results of the parameter variation are presented for the sound power level at two BPF, the tone with highest amplitude, and the integrated broadband sound power level.
In Figure 5, the mean over the auto power spectra of all microphones is shown for the total signal, the tonal rotor-locked component, and the broadband-fluctuating component. The dominant tone is the second blade passing frequency. The rotor-locked component is about 20 dB above the fluctuating component. The RSI mode is excited by collisions of the rotor wakes with the stator leading edge. This source mechanism is rotor-coherent and is the reason for the high amplitude of the rotor-coherent two BPF tone. Thus, the rotor–stator interaction is identified as the source of this tone, which will also be confirmed in terms of a radial mode analysis further below. The first BPF is also excited, but for a large part with random phase relation to the rotor. This may be an indicator for remaining inflow distortions in the flow profile near the outer duct boundary which were not sufficiently equalized by the ICD.
26
Also visible are multiple pure tones above the second and fourth BPF. The third BPF is excited rather weakly. This can be linked to the propagation angle of the RSI mode at three BPF. Here the excited mode is of the azimuthal order m = 10 and has a propagation angle of 35.8°, using Rices formula
27
and therefore is nearly parallel to the stator vane leading edge with an angle of 34°. This effect is explained with dipole-shaped sources on the stator leading edge: the dipole distribution cannot excite modes with a propagation angle perpendicular to the dipole axis.10,28 Averaged sound pressure level of all microphones separated into tonal (rotor-locked) and broadband (fluctuating) components at operating point 3200E.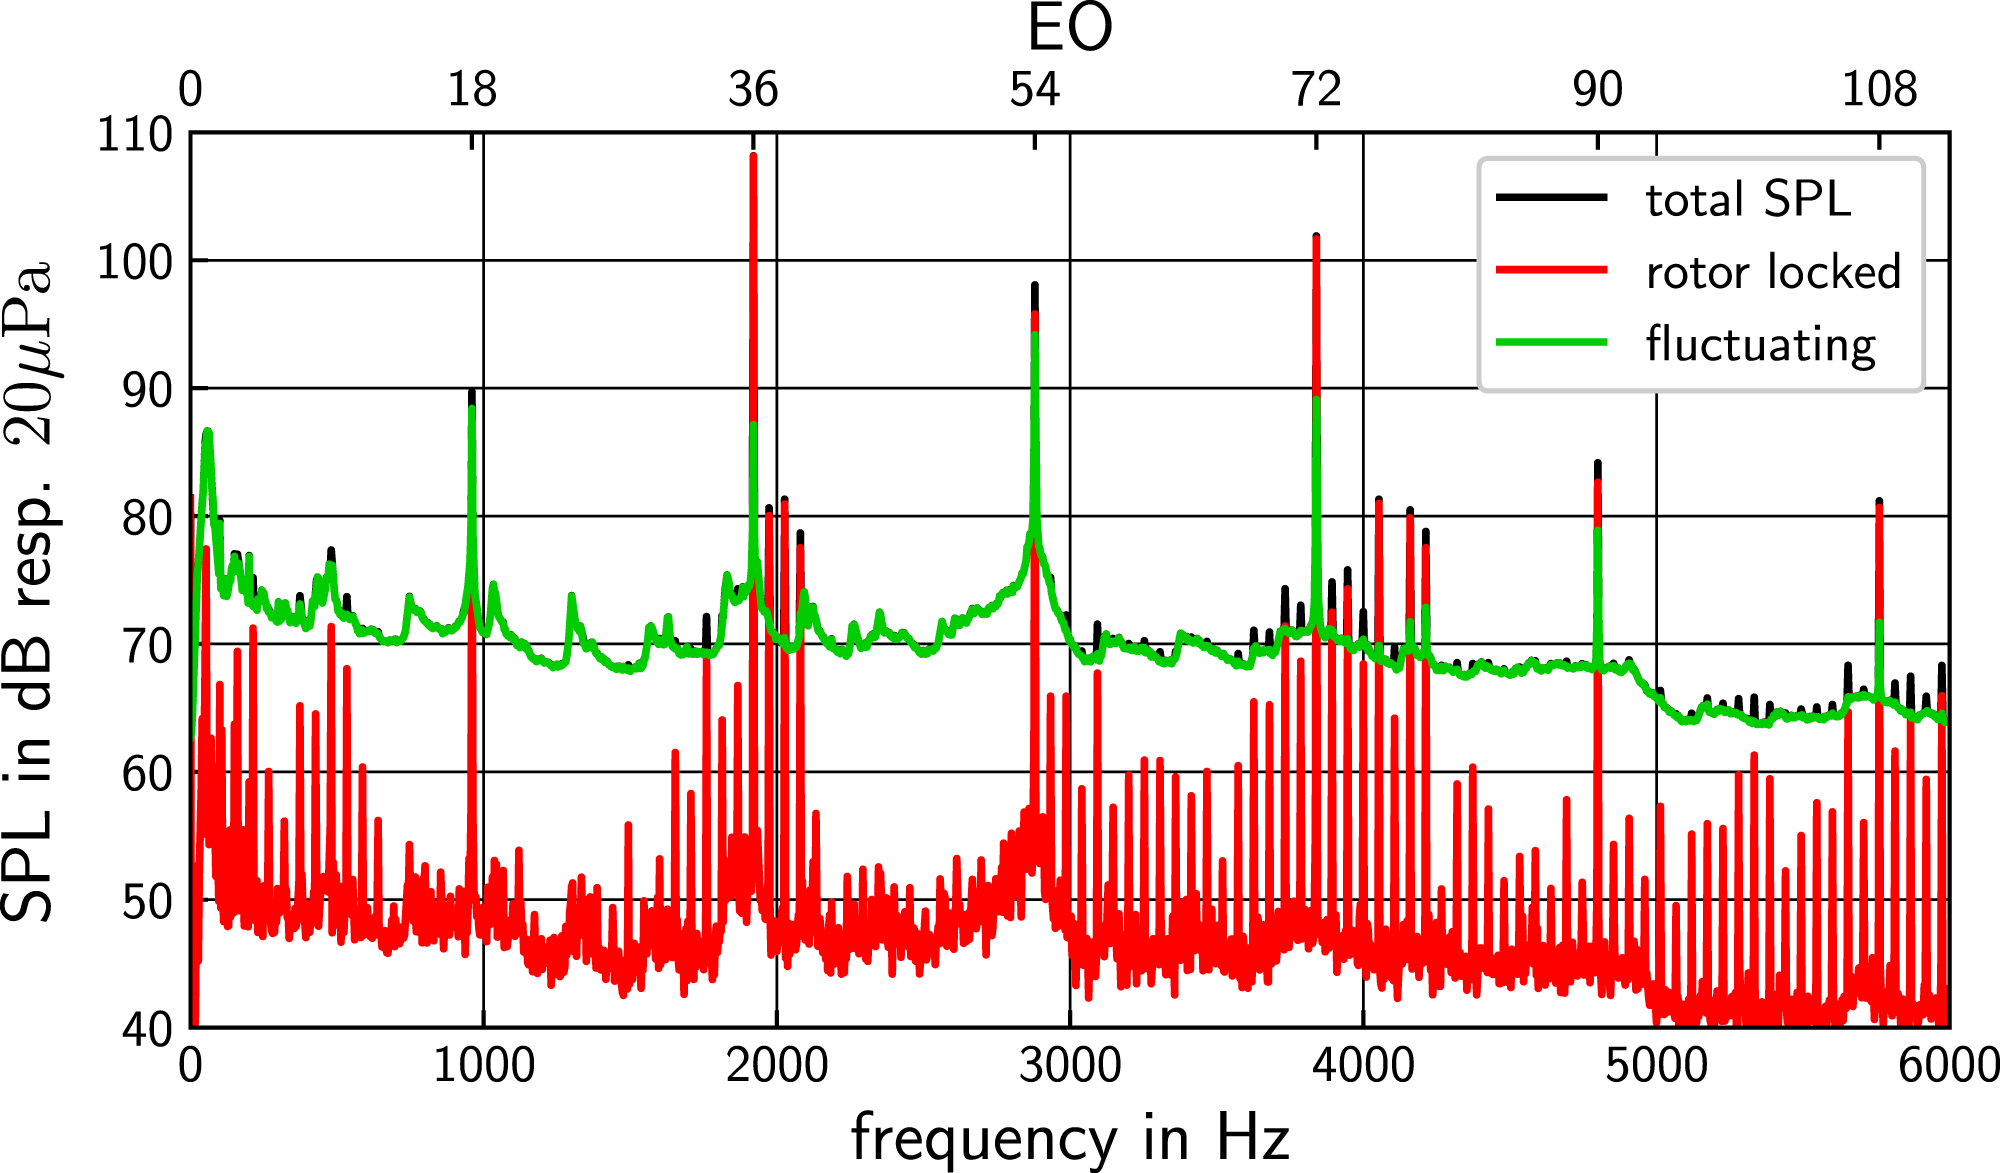
In the fluctuating component, a high SPL is visible around the first engine order. The authors suppose that this is related to the turbulent inflow rather than to the rotor. In the rotor-locked spectrum however also a tone at engine order one is visible, that is about 30 dB below the level of two BPF. This tone propagates in the form of a plane wave and is suspected to be radiated directly from the motor that is located inside the hub.
Tonal Mode Analysis Results
As the tonal spectrum only contains the rotor phase–locked components, solving equation (2) is applicable. In Figure 6(a), the result of a tonal RMA is visualized for the aerodynamic design point. Modal decomposition of the sound field at test point 3200E.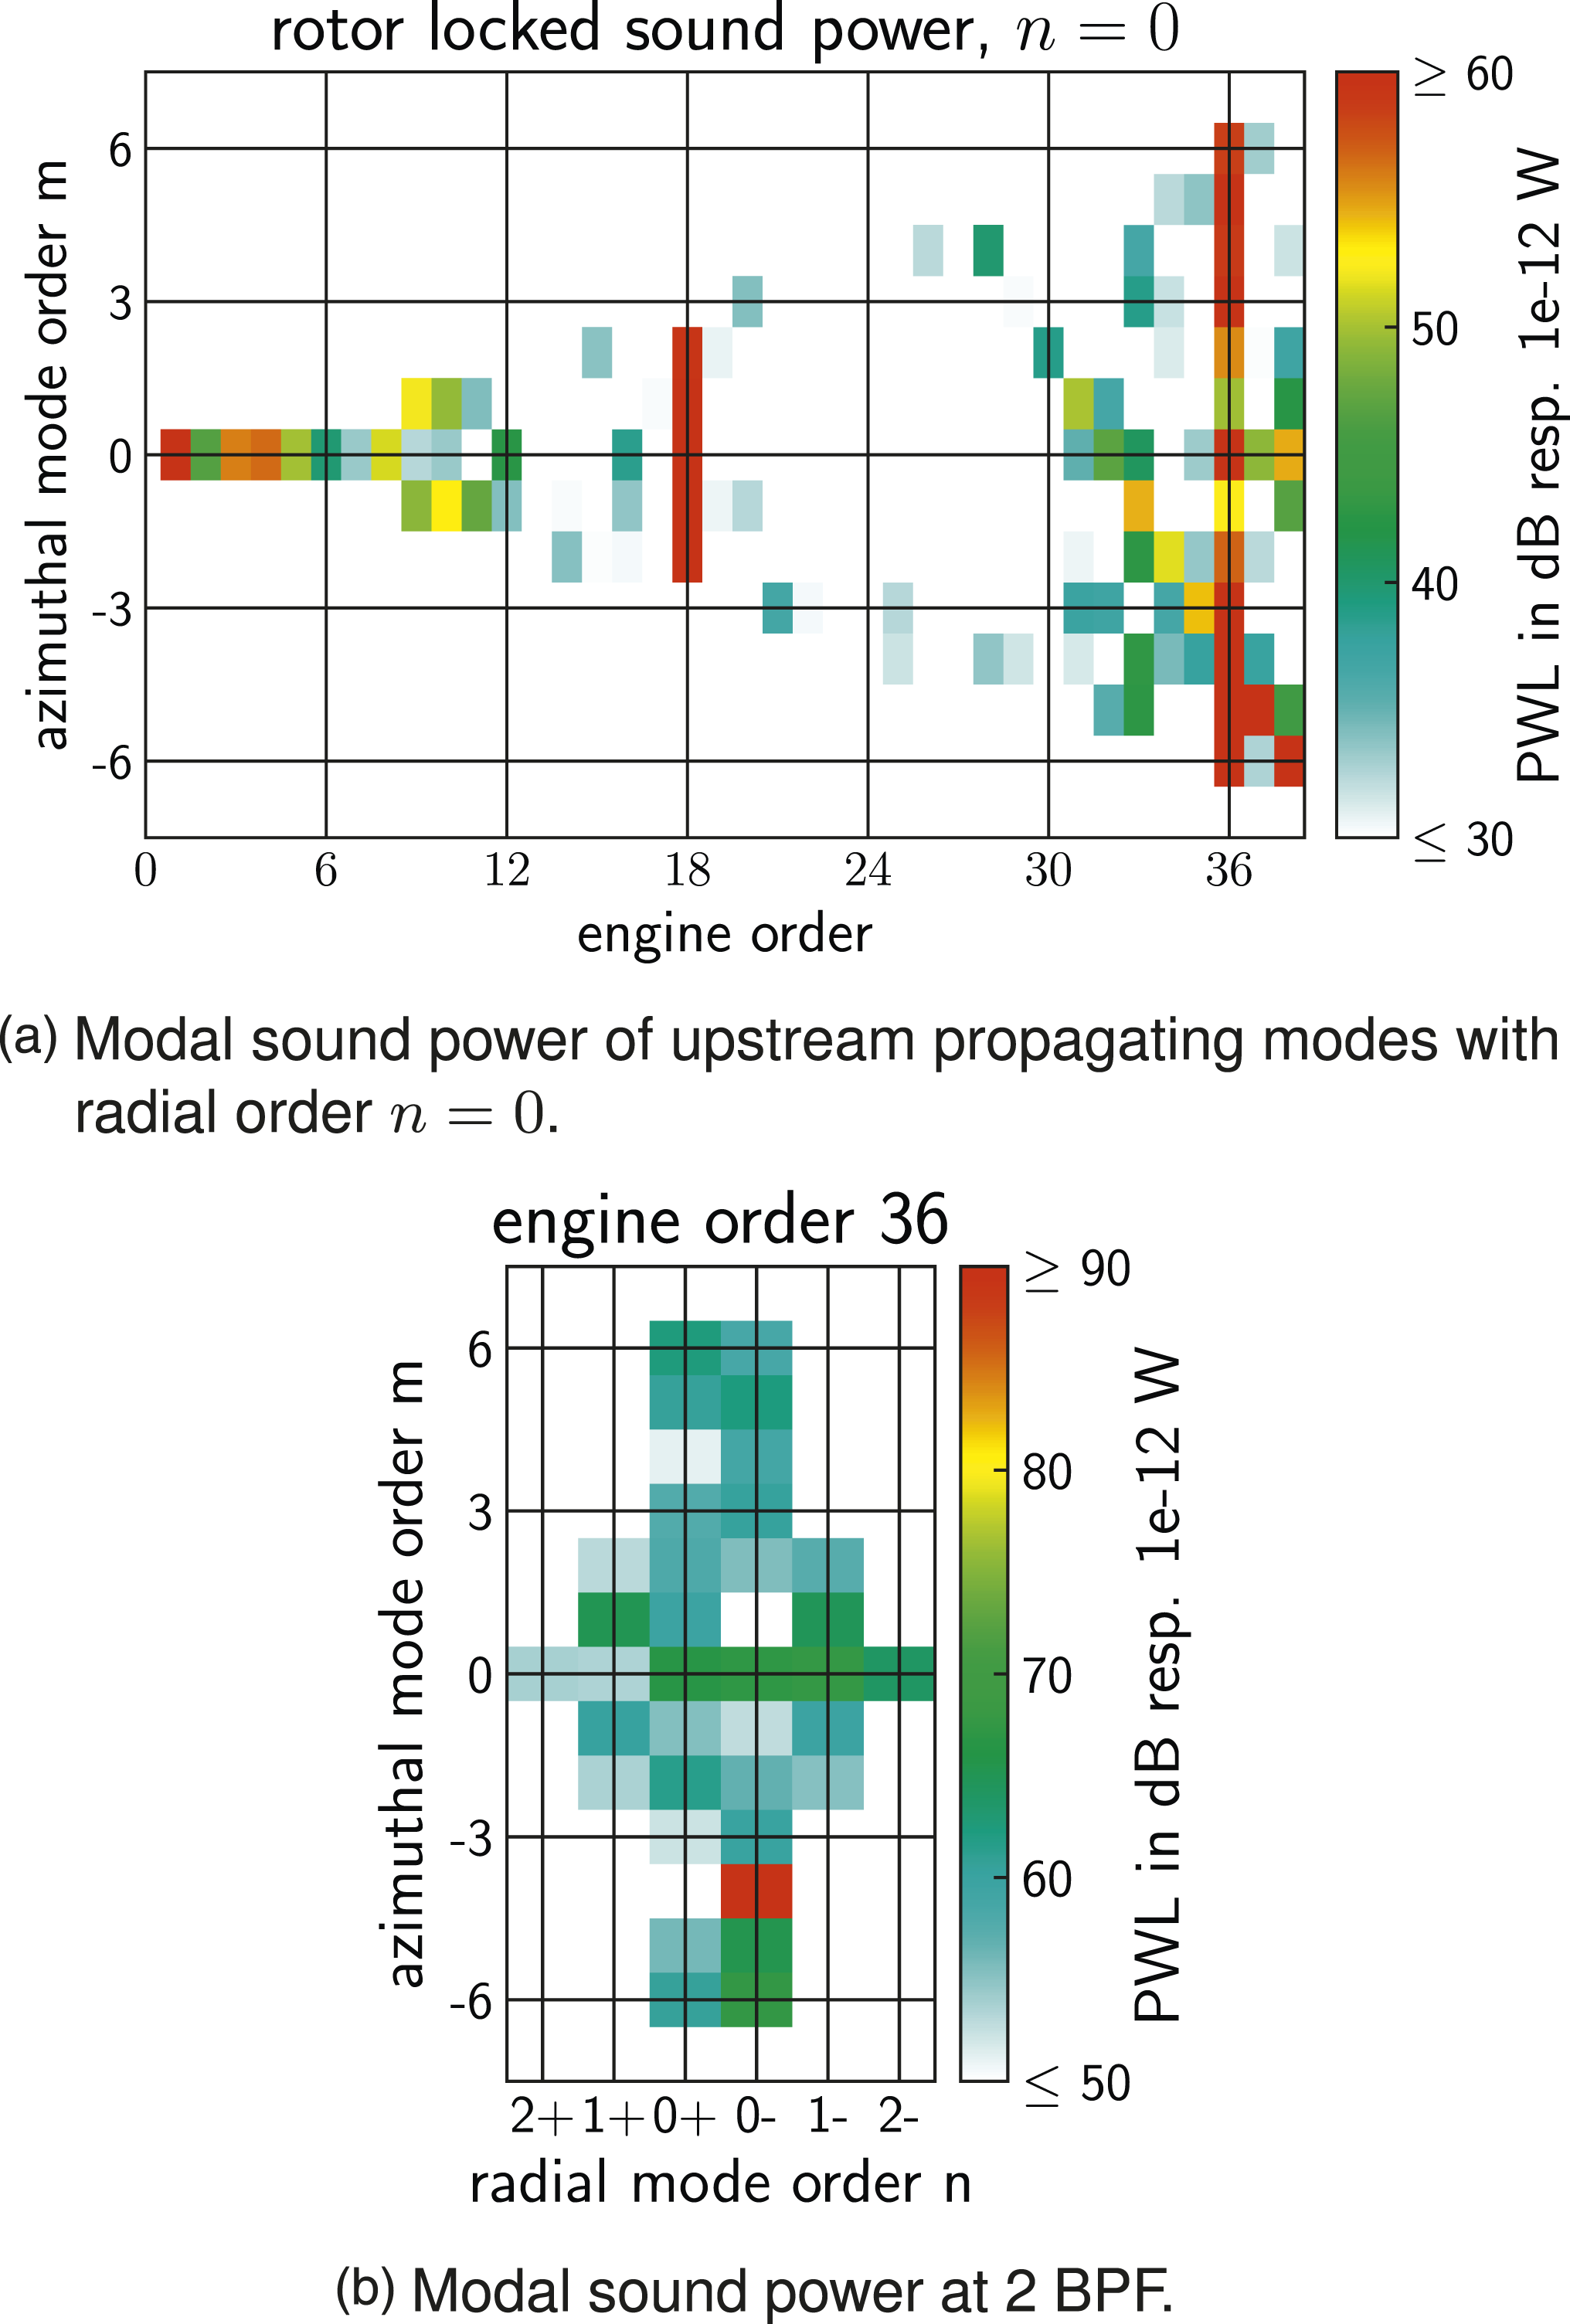
The modal sound power levels of all upstream propagating modes with radial mode order n = 0 are shown. The highest sound power levels are emitted at BPF and two BPF, although the RSI mode is cut off at BPF. In the average rotor-locked spectrum in Figure 5, multiple pure tones around two BPF at engine orders 30–39 are visible. The results of the mode analysis show that the azimuthal mode order of these tones is m = V − engine order. One possible reason for these tones might be due to irregularities in the rotor wakes, 9 which can arise from the combination of inflow distortion and irregularities in the rotor blades. As the Reynolds number of the blades is relatively low (88k @70% of blade span), 29 it is expected that the boundary layer transition from laminar to turbulent might happen at different chord length positions from blade to blade, leading to non-identical rotor blade wakes. Meyer et al. 30 showed, by means of hot-wire measurements for a different fan, that indeed the velocity deficit differs from blade to blade not only statistically but also in the ensemble average as well. It is assumed that small deviations in the blade geometry cause the differences between individual wakes. For that configuration also a step-like azimuthal mode pattern was found in acoustic measurements that was connected to the wake irregularities. It was shown that the resulting rotating pressure distribution scattered in the respective engine orders through the Doppler shift. 31
The inflow distortions that remain in the inflow in spite of the ICD, the geometric irregularities of the blades, and the rotor wake inhomogeneities are still to be investigated. This is however outside the scope of the present work. The authors argue, however, that the same mechanism is the source of the extra “spurious” tones in the rotor-locked spectrum in Figure 6(a).
In Figure 6(b), the modal sound power levels of all modes at engine order 36 are shown. The sign behind the radial mode order indicates the propagation direction of the mode, that is,‘−’ for up- and ‘+’ for downstream propagation. Note the different scaling of the color bar. The RSI tone at m = −4 is about 20 dB above all other modes.
In order to compare all the operating points, the modal sound power of the upstream propagating RSI tone at two BPF is shown in Figure 7 for all operating points. Modal sound power of the Tyler–Sofrin mode and broadband noise for all test points.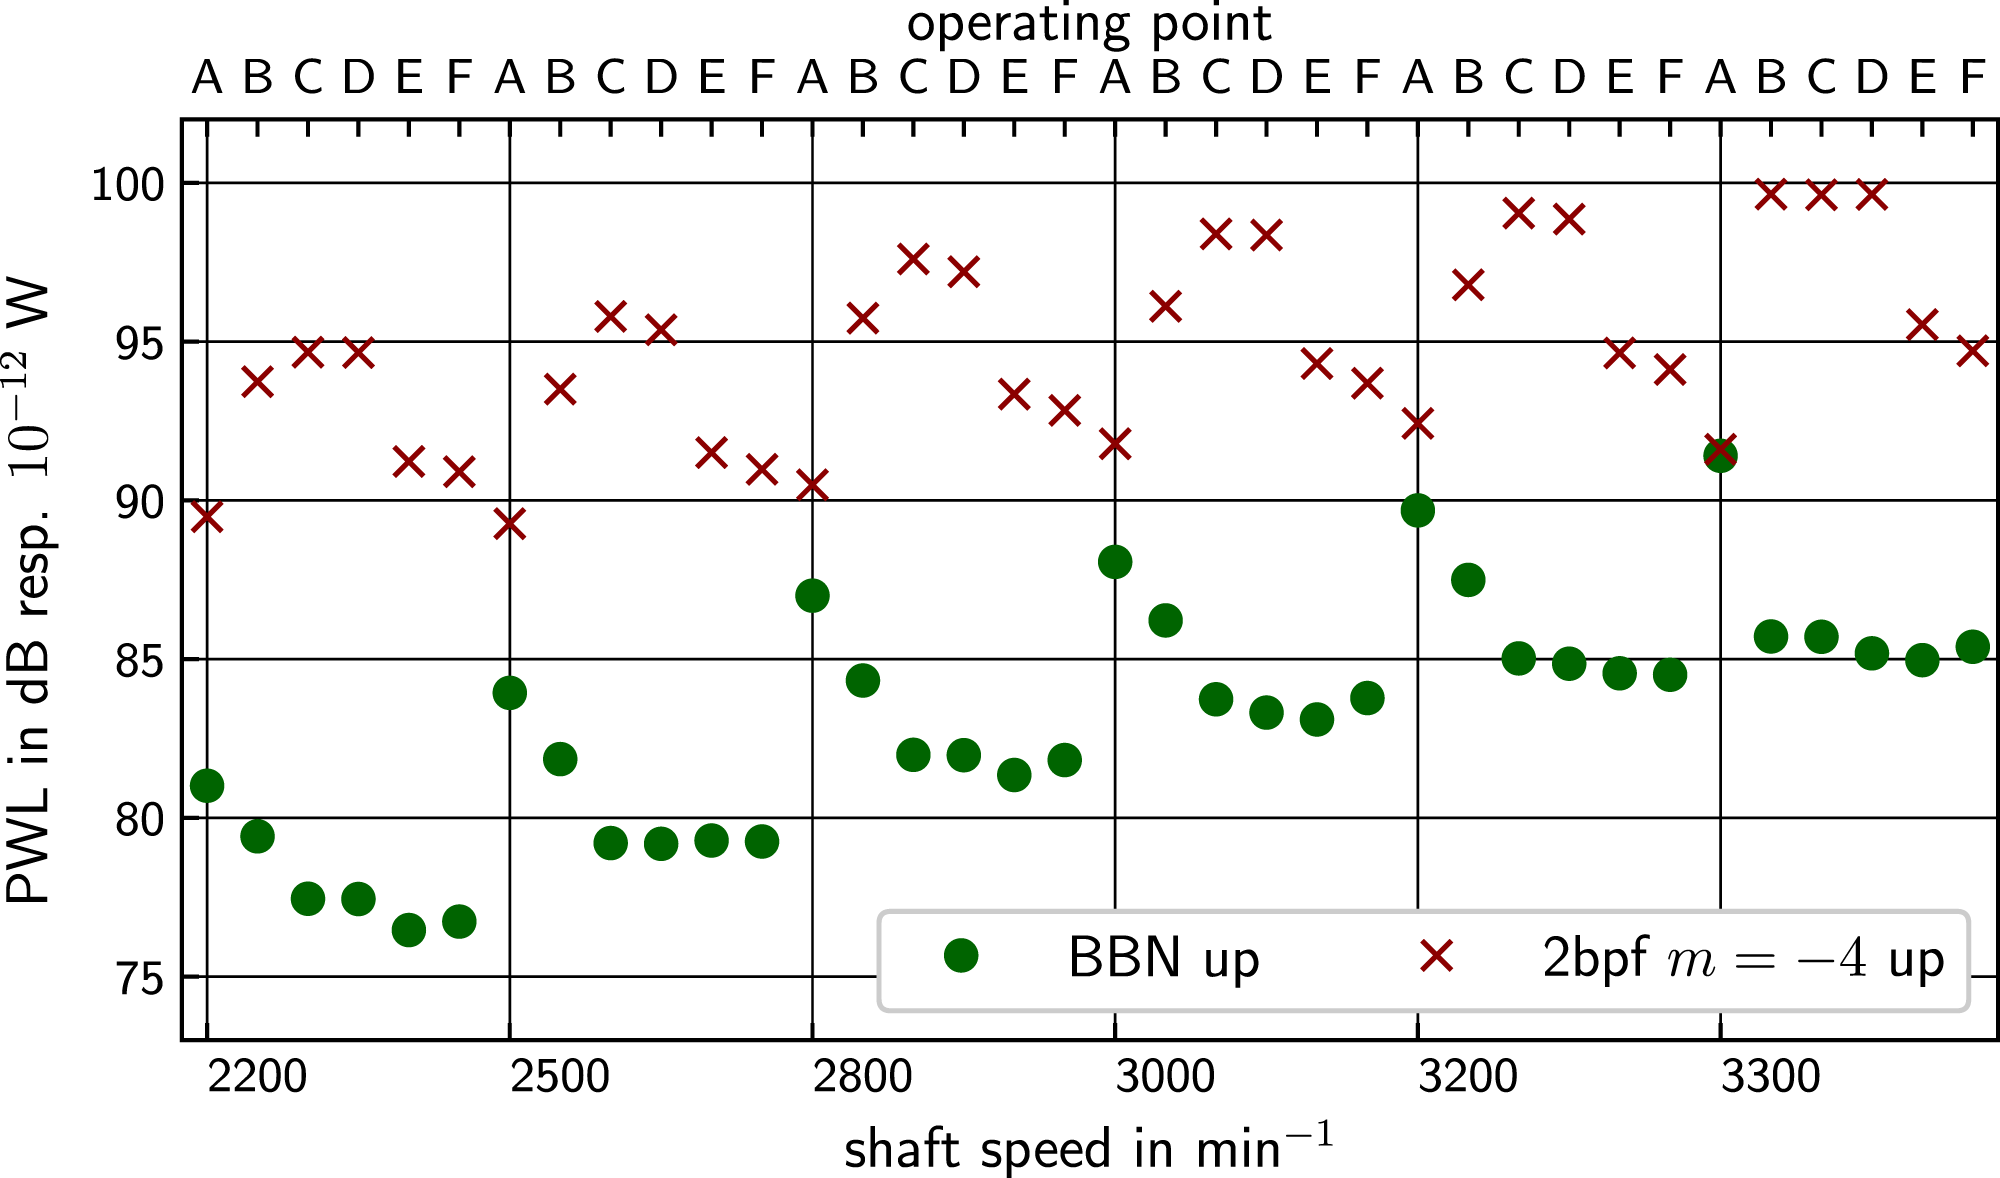
At all rotor speeds, the same pattern is repeated for the RSI mode. The maximum power level is found for the flow coefficient ϕ = 0.21, letter C. The tonal RSI noise is strongly affected by radial dephasing of the tilted rotor wakes which leads to destructive interferences. 6 This effect is driven by the three dimensional geometries of the rotor and stator blades and is presumed to cause the less effective excitation at the lower flow rates (A and B). The power level of the RSI tone additionally depends on the velocity deficit and the width of the rotor wakes, which scale with the relative flow speed. This explains the overall increase with higher rotor speed. At constant rotor speed, with increasing flow rate, the flow incidence angle decreases. With decreasing incidence also the rotor wake width and velocity deficit decrease 32 ; therefore, the noise is reduced with higher flow rate. This effect can be shown for higher flow coefficients (C to F). The incidence varies from 5° at the smallest flow coefficient to −1° at the highest flow coefficient.
To reduce the tonal noise emission, it seems desirable to operate the fan at the lowest possible loading. As this is not possible in every application, the shape of the blades can be designed to reach a reduction of tonal noise emissions. 33 The relation between the tonal noise emission and incidence is not monotonic, which implies that the operating condition with minimum tonal noise is potentially shifted by changing the blade design.
Broadband Mode Analysis Results
The cross-modal matrix is calculated by solving equation (3). In Figure 8, the results of the broadband RMA are visualized for two fan operating points. Depicted is the modal sound power level of upstream propagating modes summed over all propagating radial modes. At first glance, the modal broadband noise spectrum seems much smoother at the fan design point, where the modal distribution is rather symmetric (Figure 8(a)). On the contrary, the spectrum referring to the operating point with low mass flow (low flow coefficient) and high pressure ratio exhibits more spectral components and the modal distribution is more asymmetric (Figure 8(b)). Modal sound power of upstream propagating modes, sum over all propagating radial modes.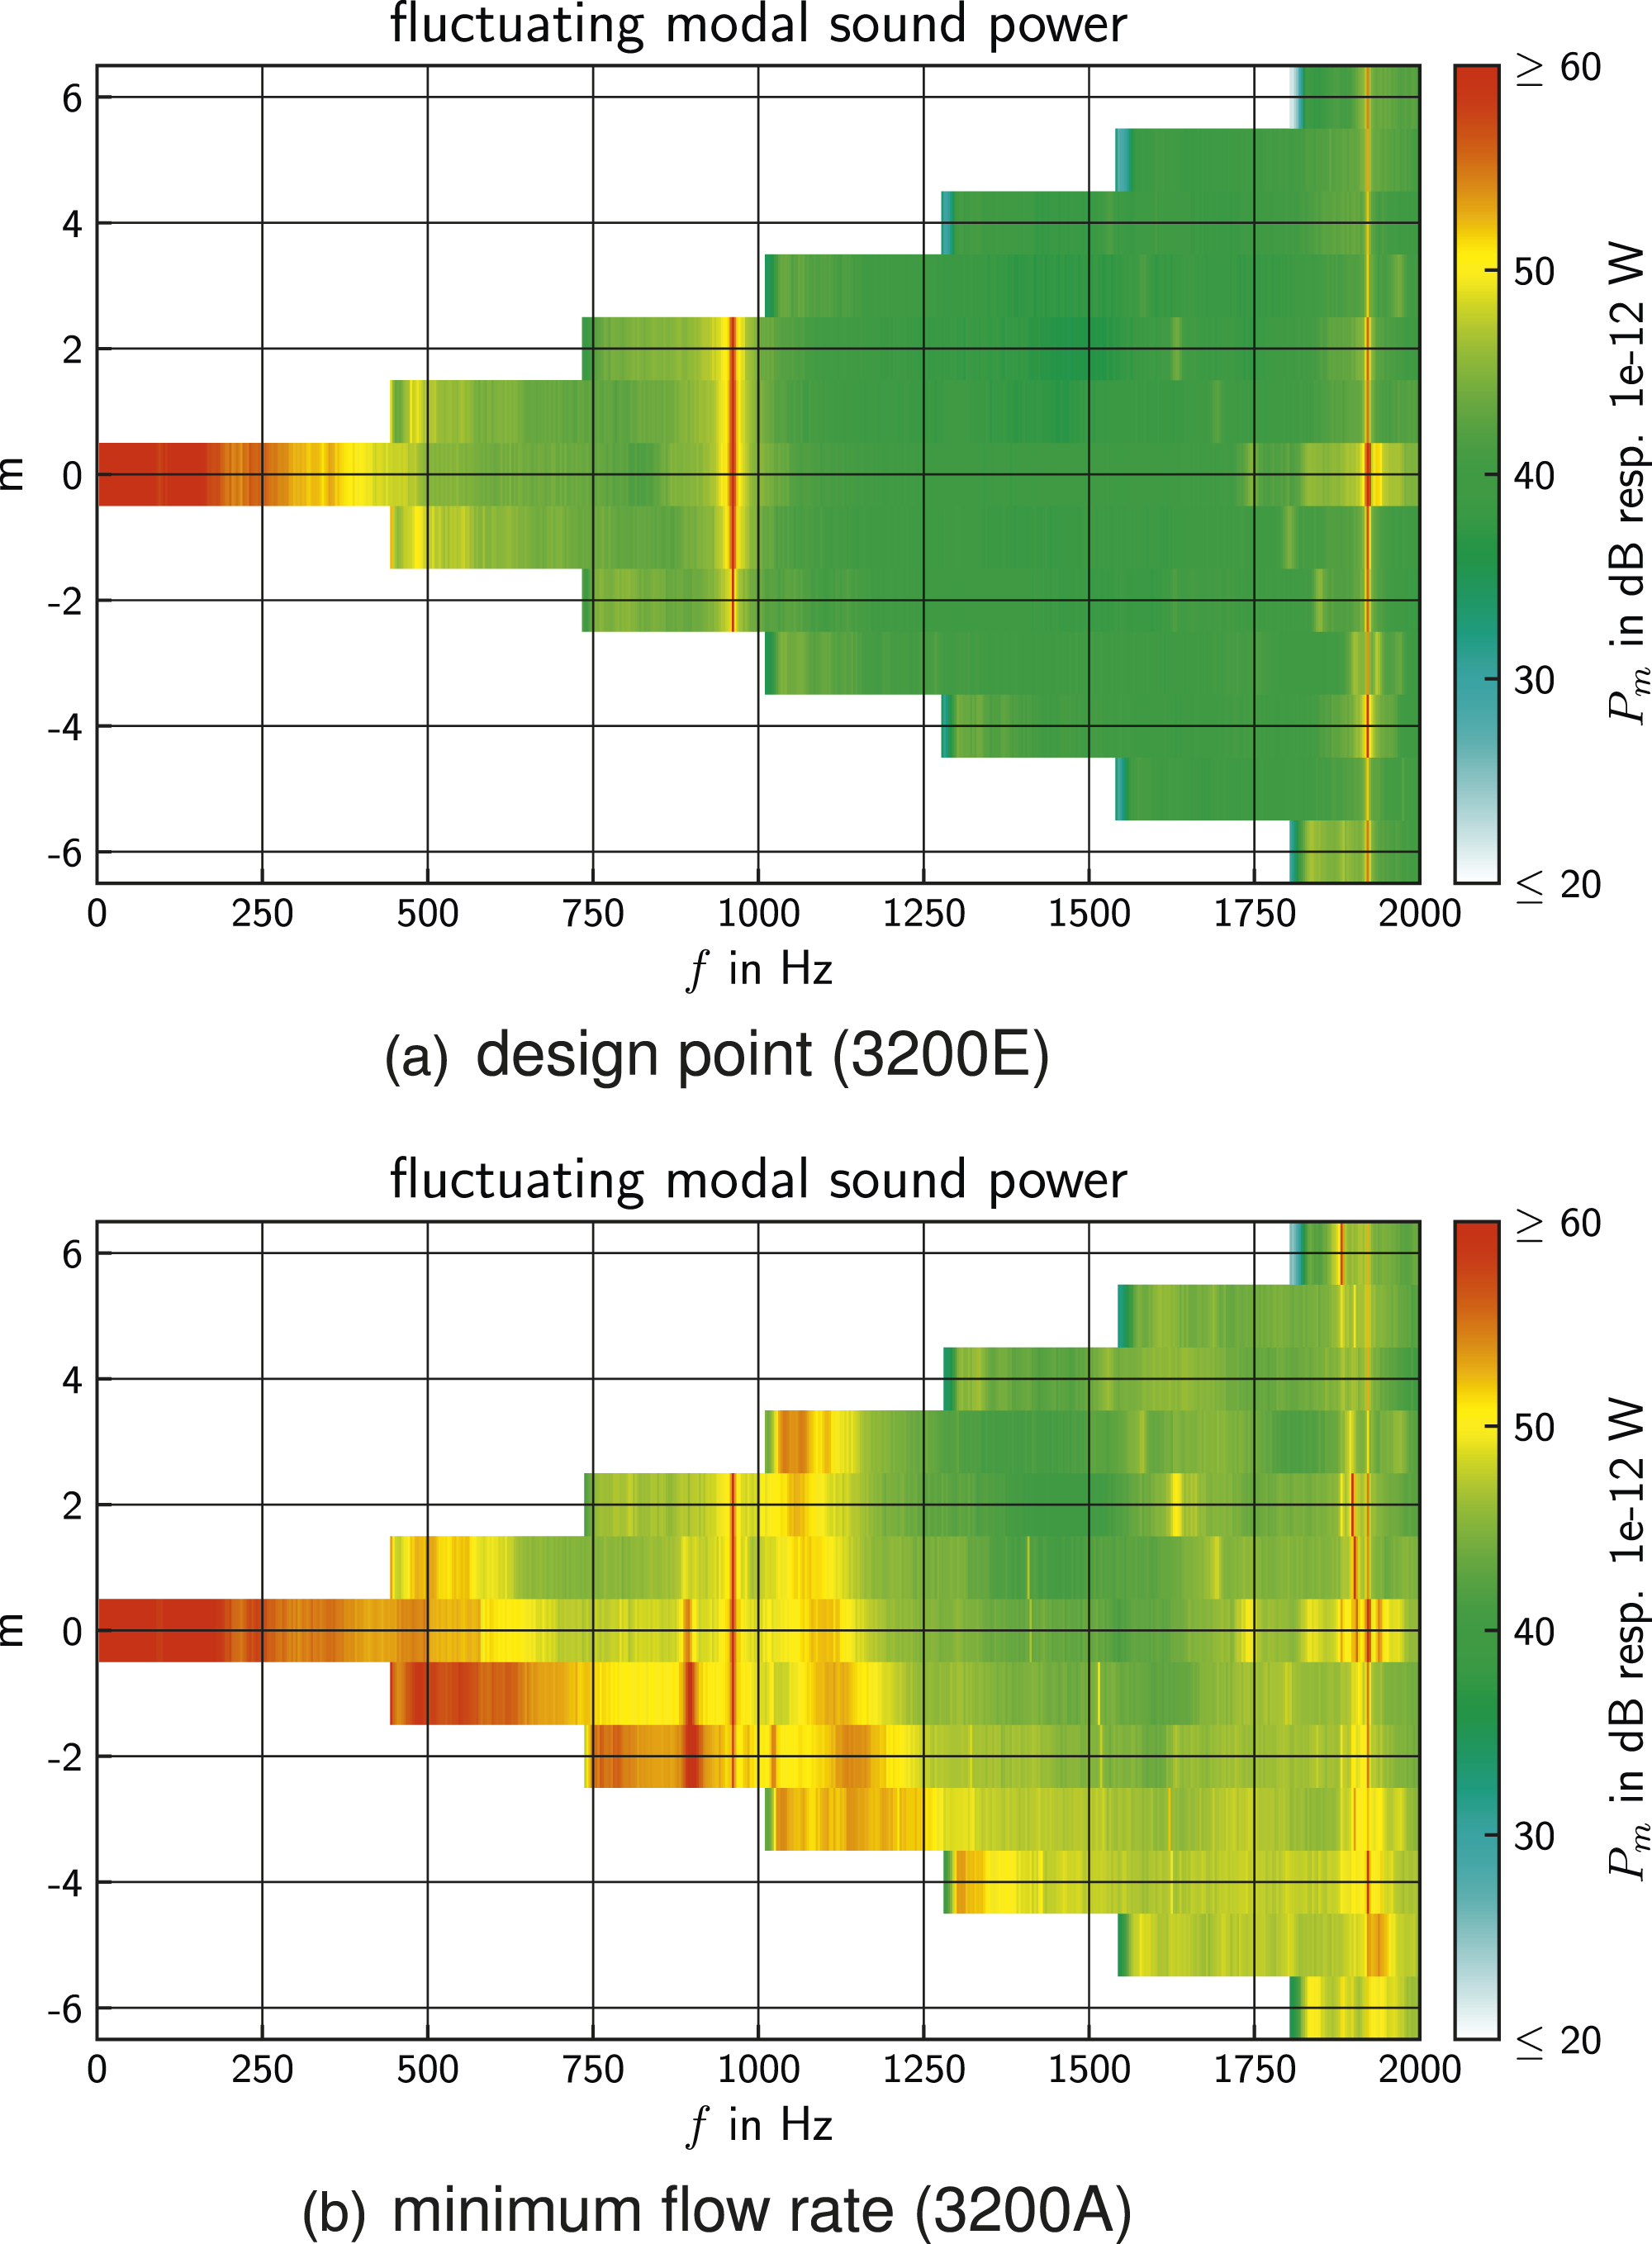
In order to calculate the overall broadband noise sound power level, the frequency spectra were integrated between the engine orders 7 and 37. The lower limit was used to exclude the low-frequency band, which presumably does not originate from the fan. The higher limit is necessary because of the frequency limit of the microphone array. The overall sound power levels of all operating points are shown in Figure 7.
Scaling law exponent.
Analytical Modeling
The general procedure of the theoretical source models is based on a mean line approach: The steady and unsteady aerodynamic parameters are calculated at one radial position and then radially extrapolated. In a first step, the model of the fan was adjusted. In this step, the blade angles of rotor and stator leading and trailing edges are iteratively changed and converge to representative angles. With these angles, the same corrected mass flow and pressure ratio are calculated by the model at the design point, as were obtained from a numerical Reynolds-averaged Navier–Stokes (RANS) simulation. The focus lies on aerodynamic similarity between measurements and simulations, rather than geometric similarity.
The trade-off of this approach is that the representative angles are not the same as the actual blade angles. As discussed above, the geometry of the rotor blades and stator vanes has a critical influence on tonal noise excitation. Hence, larger deviations in the characteristics of the simulated and measured tonal noise are expected. The broadband noise sources are presumed to better reproduce the measured trends because they depend mainly on aerodynamic parameters extracted from measurements, such as Mach number, turbulence intensity and ILS, that vary with the operating point. The relevant geometric properties are the blade thickness, angles and chord length.
The different sound sources like rotor–stator interaction noise, inflow-rotor, inflow-stator interaction noise, as well as rotor and stator trailing edge noise are predicted with theoretical models. The simulation is based on Goldstein 34 ’s solution of the acoustic analogy with moving solid boundaries. The aerodynamic properties such as mean flow speed, wake properties, and turbulence are estimated on the basis of a semi-empirical mean line method. 3
In Figure 9, the pressure ratio and mass flow for six operating conditions at 3200 r/min are shown. The operating conditions from the RANS calculation at the design point predict a higher pressure ratio than the measurement shows. Hence, the results from the analytical simulation also predict a higher pressure ratio. At low mass flows, the predicted pressure ratio is lower than the measured pressure ratio. This operating condition is close to the surge line and is difficult to model with the mean line approach. It shall be noted, that the theoretical source models were originally developed and tested for full-scale fans with high pressure ratios. Taking that into account, the predicted and measured operating conditions match reasonably well. Pressure ratio comparison of measurements and model.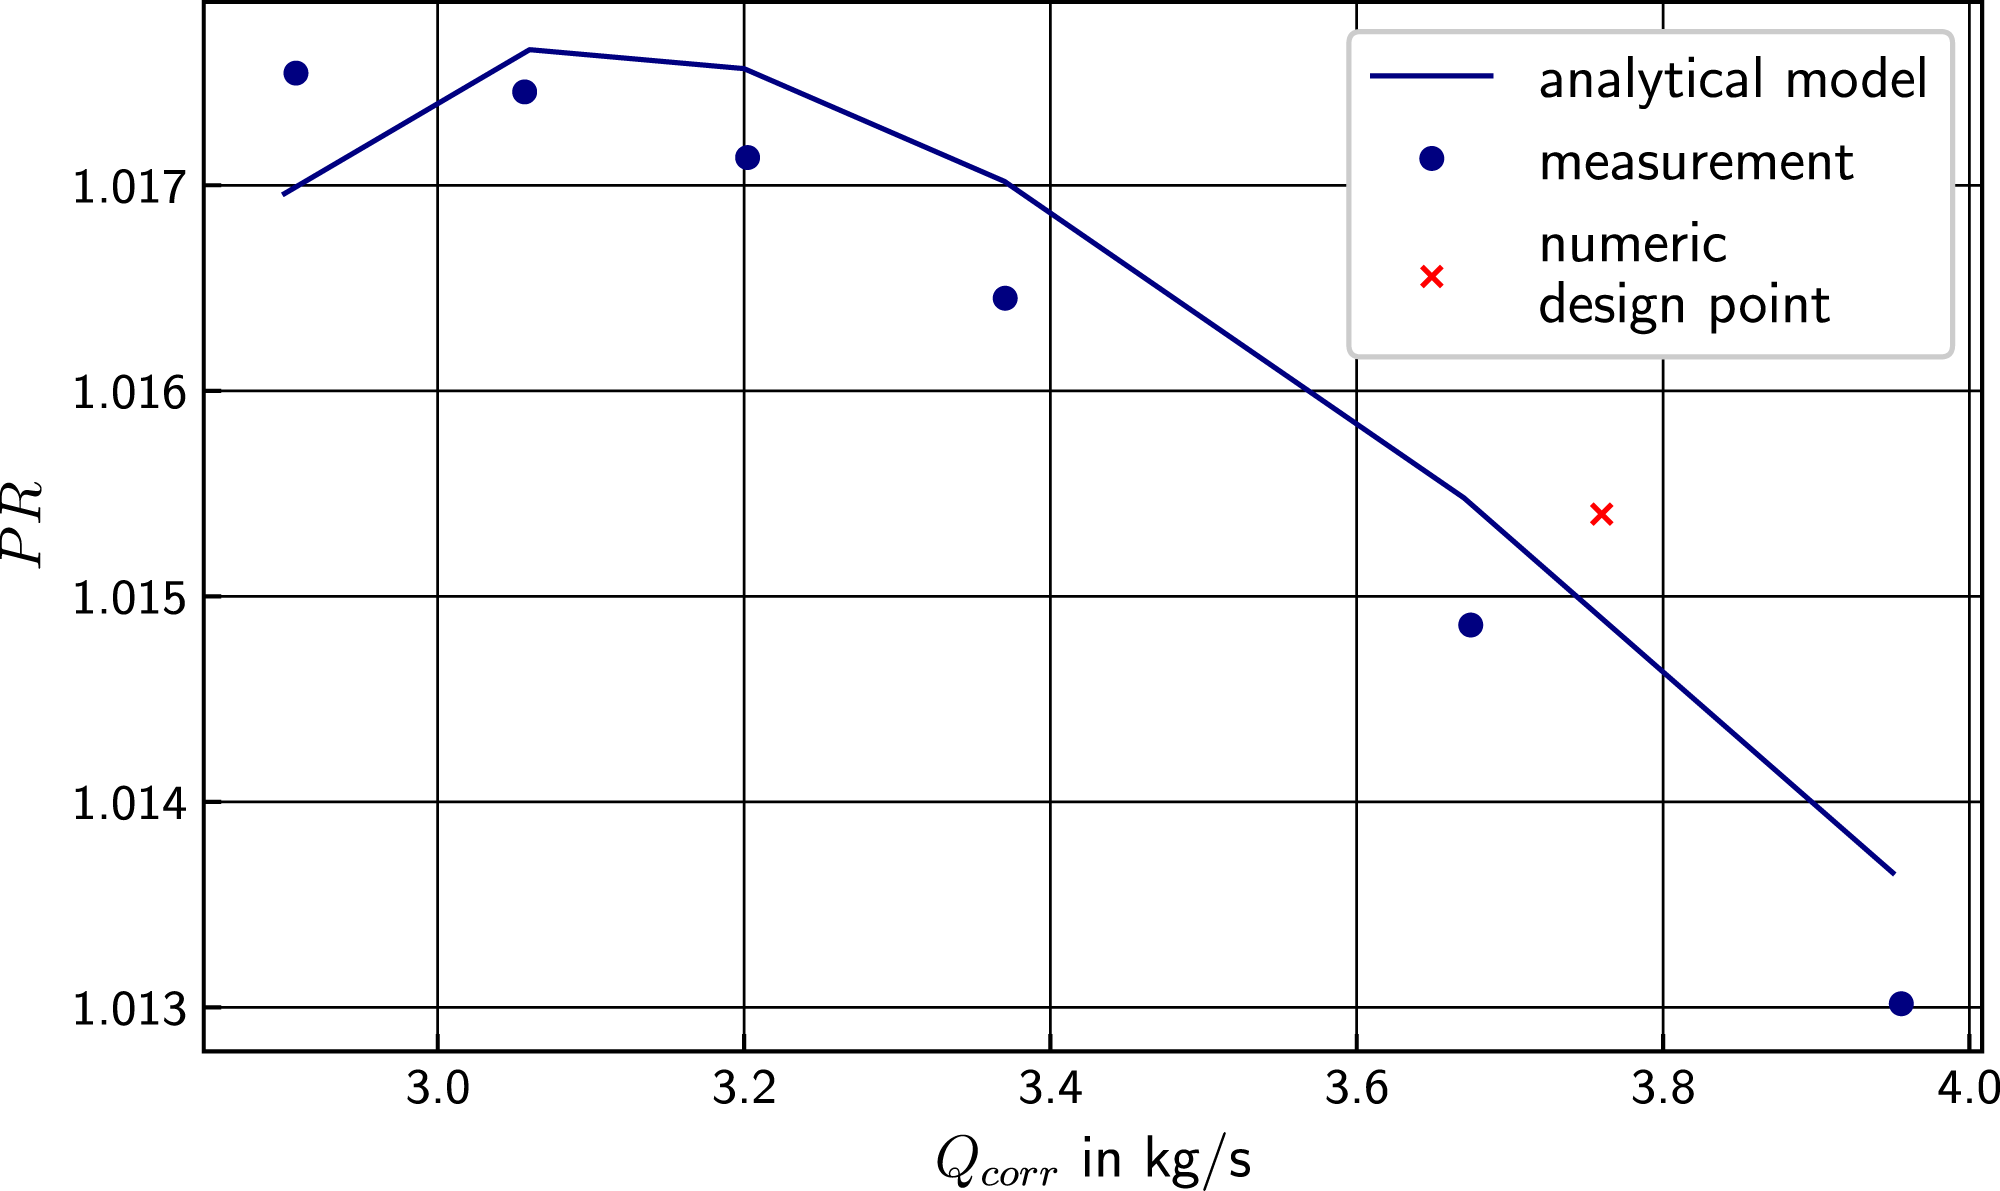
The essential input parameters of the source models are the mean flow velocity, the turbulent kinetic energy (TKE), and integral length scale (ILS). The former was measured with a dynamic pressure tube in the inlet, whereas the estimation of the TKE and ILS is described in the next section.
Estimation of the Turbulence Input Parameters
The turbulence parameters TKE and ILS were extracted from instationary aerodynamic measurements by means of hot-wire anemometry. Measurements were carried out in the same test rig, however with a different fan. A detailed report of this measurement was published by Oertwig 14 and selected results also by Caldas et al. 26 As the inlet Mach numbers measured in that work (approx. 16.5 m/s) are roughly the same as in the current work (18 m/s), average numbers for turbulence quantities shall be used from that measurement campaign.
In the work from Oertwig, 14 four hot-wire probes were installed on the fan rig duct wall, 90° apart and 440 mm (around one duct-diameter) upstream of the fan. Each probe comprises of two hot-wire elements. In this work, only the axial component is analyzed. Three measured radial positions were 45 mm, 112 mm, and 192 mm from the duct outer casing wall with 453 mm in diameter. Acquisition time was set as 10 s at 80 kHz sampling frequency. Unfortunately, no hot-wire measurement was performed inside the boundary layer. However, a refined measurement was carried out along the radial direction with a Prandlt-tube where the boundary layer thickness could be estimated as about 20 mm for a mean flow of 16.4 m/s. It is known that the turbulence in the boundary layer reaches values up to 5–6 % in intensity but decays rapidly in the external region of the boundary layer.35–37
In order to get a better estimation of the overall average turbulence levels as well as the average TKE to be used as input for the simulation, a typical boundary layer turbulence profile measured in other test rigs36–39 was used and scaled down to the current Mach number. Results for velocity profile and turbulence levels are seen in Figure 10. On the left-hand side is the radial velocity profile. Right-hand side shows the radial turbulence profile at the inlet. Fan speed at 3200 r/min.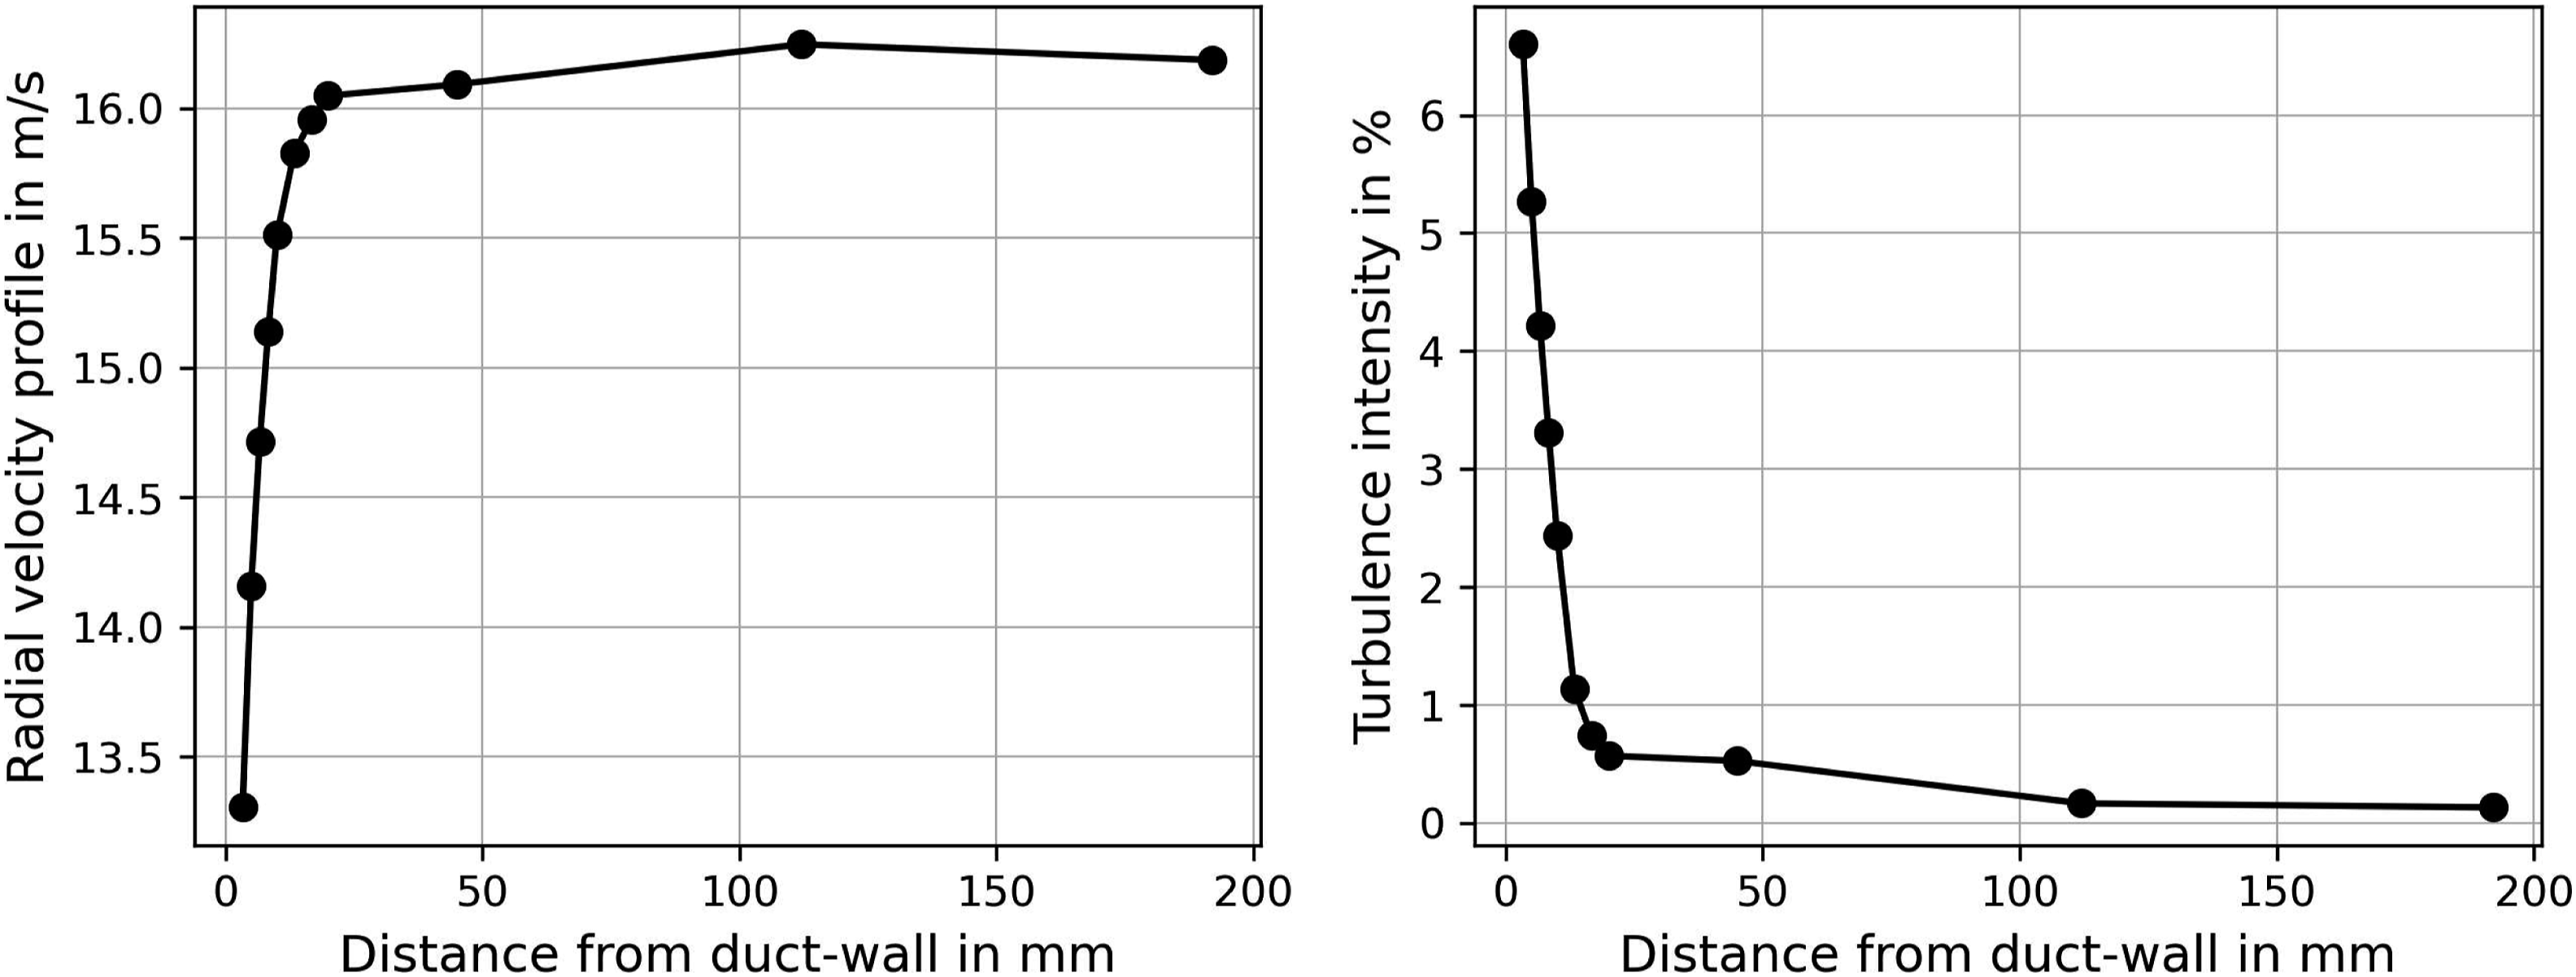
The root-mean-square (RMS) of the fluctuating velocity component Power spectral density (PSD) of the axial velocity component at the inlet measured at four different circumferential positions at a fan speed of 3200 r/min.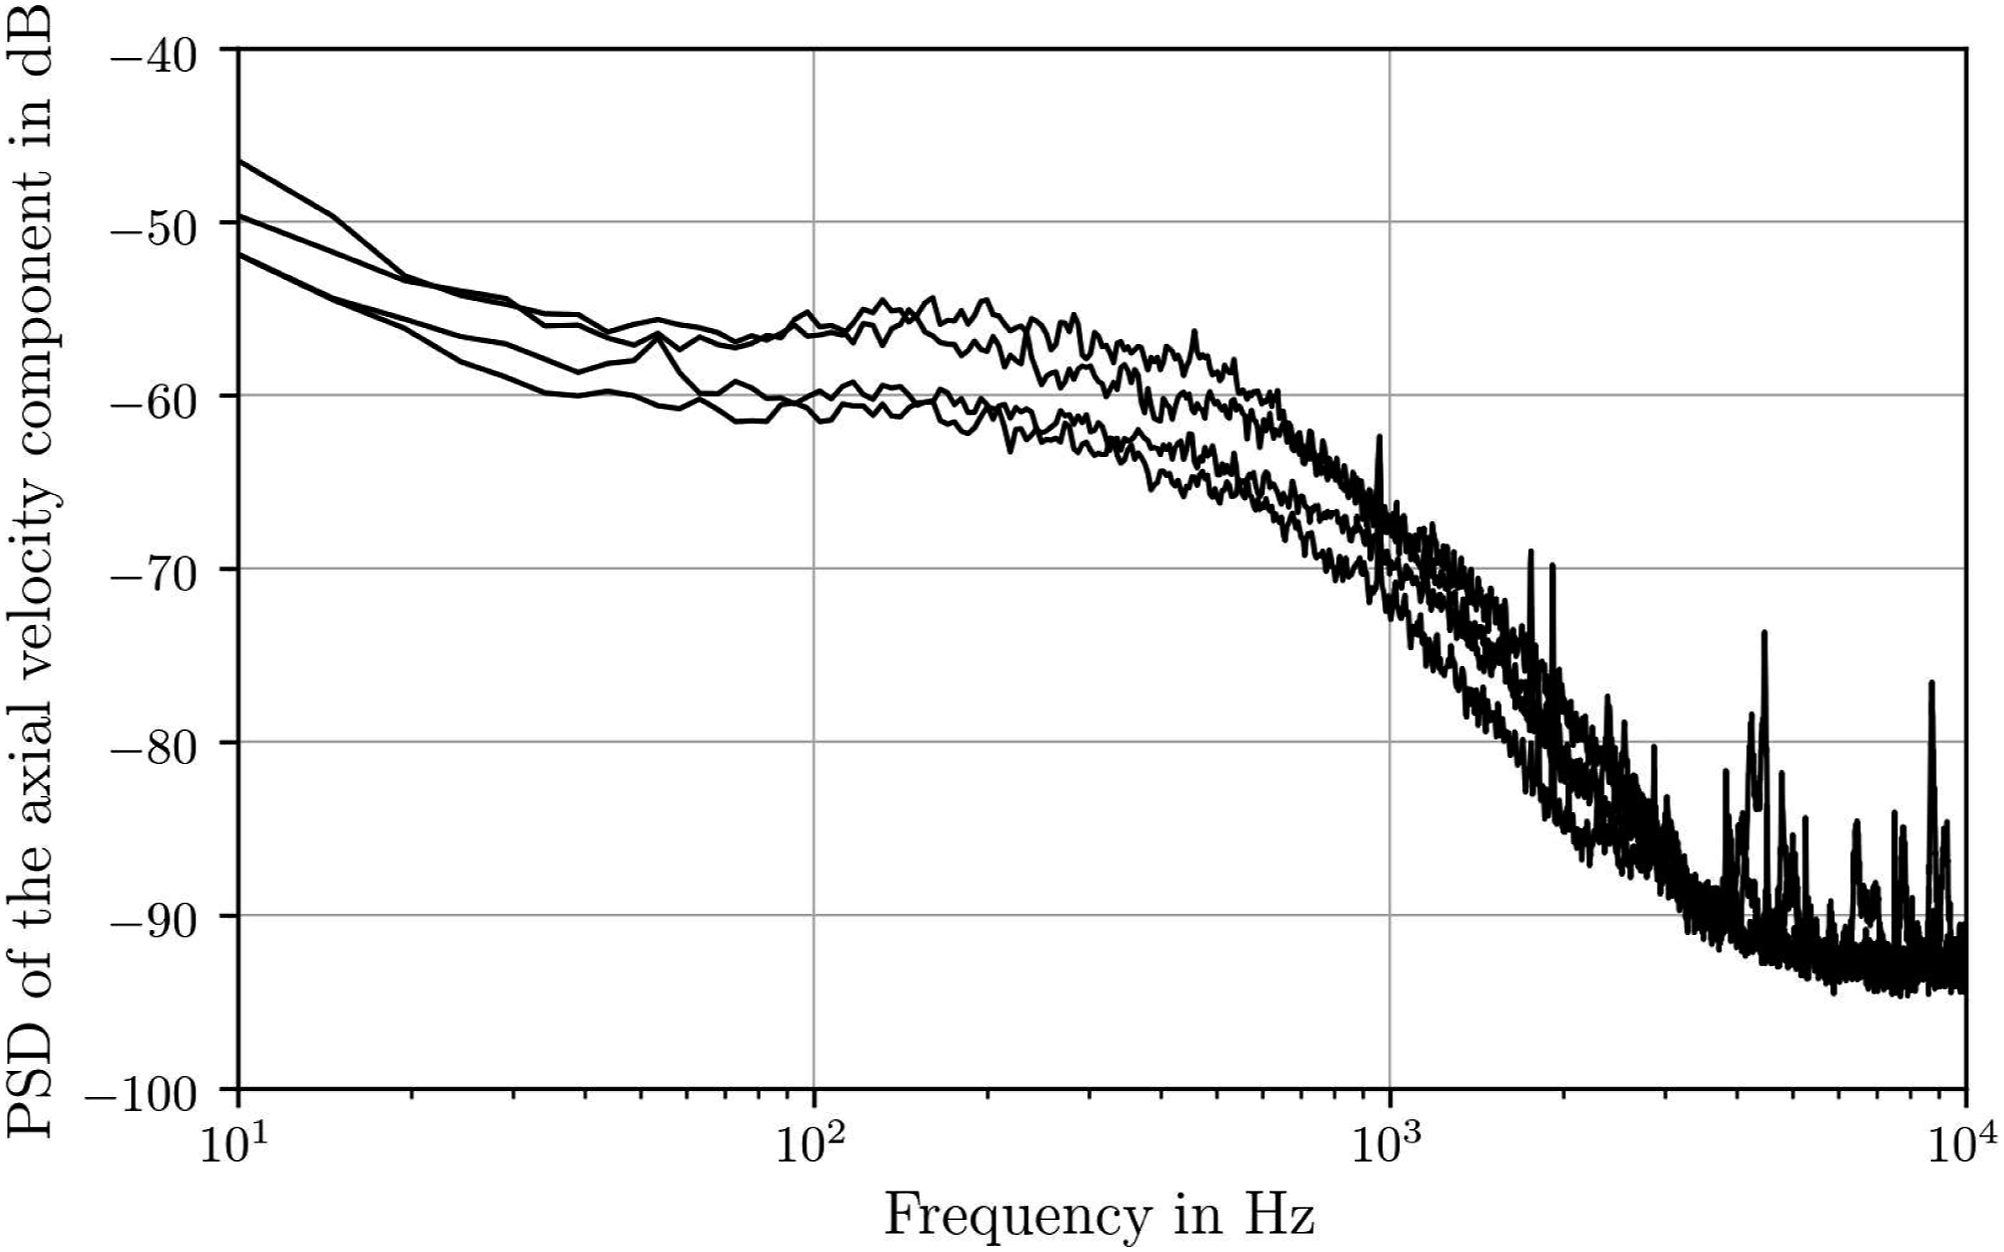
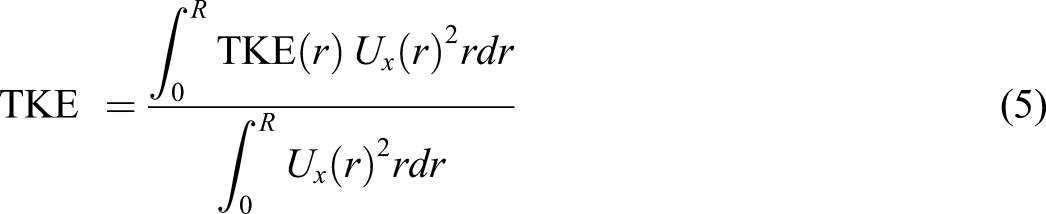
The average values for TKE and ILS were then obtained by first an average in the circumferential direction, followed by a weighted average by the radial position and by the axial velocity U
x
Substituting the values obtained from the measurements, as well as the approximated boundary layer profile extracted from other similar test rigs and scaled down, we obtain the following numbers: TKE = 0.1 m2/s2, Tu = 1.2%, and ILS = 13 mm. In the present study, the values of TKE and ILS are assumed constant for different operating points.
Results
In this study, only the tonal and broadband rotor–stator interaction (RSI) and the broadband noise emitted by the turbulent inflow-rotor interaction are shown, as these are the dominant calculated noise sources.
Figure 12 compares the measurement and analytical results for different flow rates at rotor speed 3200 r/min. In the tonal results, only the RSI mode at two BPF is considered, as no propagating mode is calculated in the idealized model at BPF in accordance with Tyler and Sofrin.
12
The tone at two BPF first increases, then decreases with higher flow rate. The maximum of emitted sound power is at different flow rates for measurement and analytic results. The tonal RSI noise arises from the periodic collisions of the turbulent rotor wakes with the stator leading edges which can be represented by a dipole distribution. As the energy of the rotor wakes decreases with higher flow coefficients owing to the reduced rotor blade incidence and aerodynamic loading, the source strength of the RSI noise also decreases with higher flow coefficients. This effect can explain the decrease in the tonal sound power at the higher flow coefficients. The swirl behind the rotor changes with the flow rate as the rotation speed remains constant while the mass flow changes. This affects the way that the wakes are twisted in the interstage area. The wakes hit the stator leading edge at different times for different radii, which leads to destructive interferences. Which might be even more relevant as only one radial mode order is propagating at two BPF. The larger deviations in the two BPF tone at smaller flow coefficients are suspected to be caused by differences in the angles and radial shapes of the rotor blades and stator vanes between simulation and experiment. In the scope of this study however, this relation is not further analyzed. Here, two broadband sources are assumed to be dominant and therefore considered: The broadband RSI noise and the interaction of turbulence in the inlet with the rotor. With increasing flow rate, meaning a decrease in incidence, the broadband RSI noise decreases, as the width of the wakes and the turbulence intensity therein are reduced.
32
The reason for this effect is the reduced boundary layer thickness on the blades. This is due to a shift of the laminar to turbulent transition point on both blade sides toward the trailing edge.
41
In contrast to the tonal RSI, no destructive interferences can occur, since the simulated sources are uncorrelated. Hence, broadband RSI noise is expected to decrease continuously as the flow coefficient grows. Measured and calculated sound power level at different flow rates.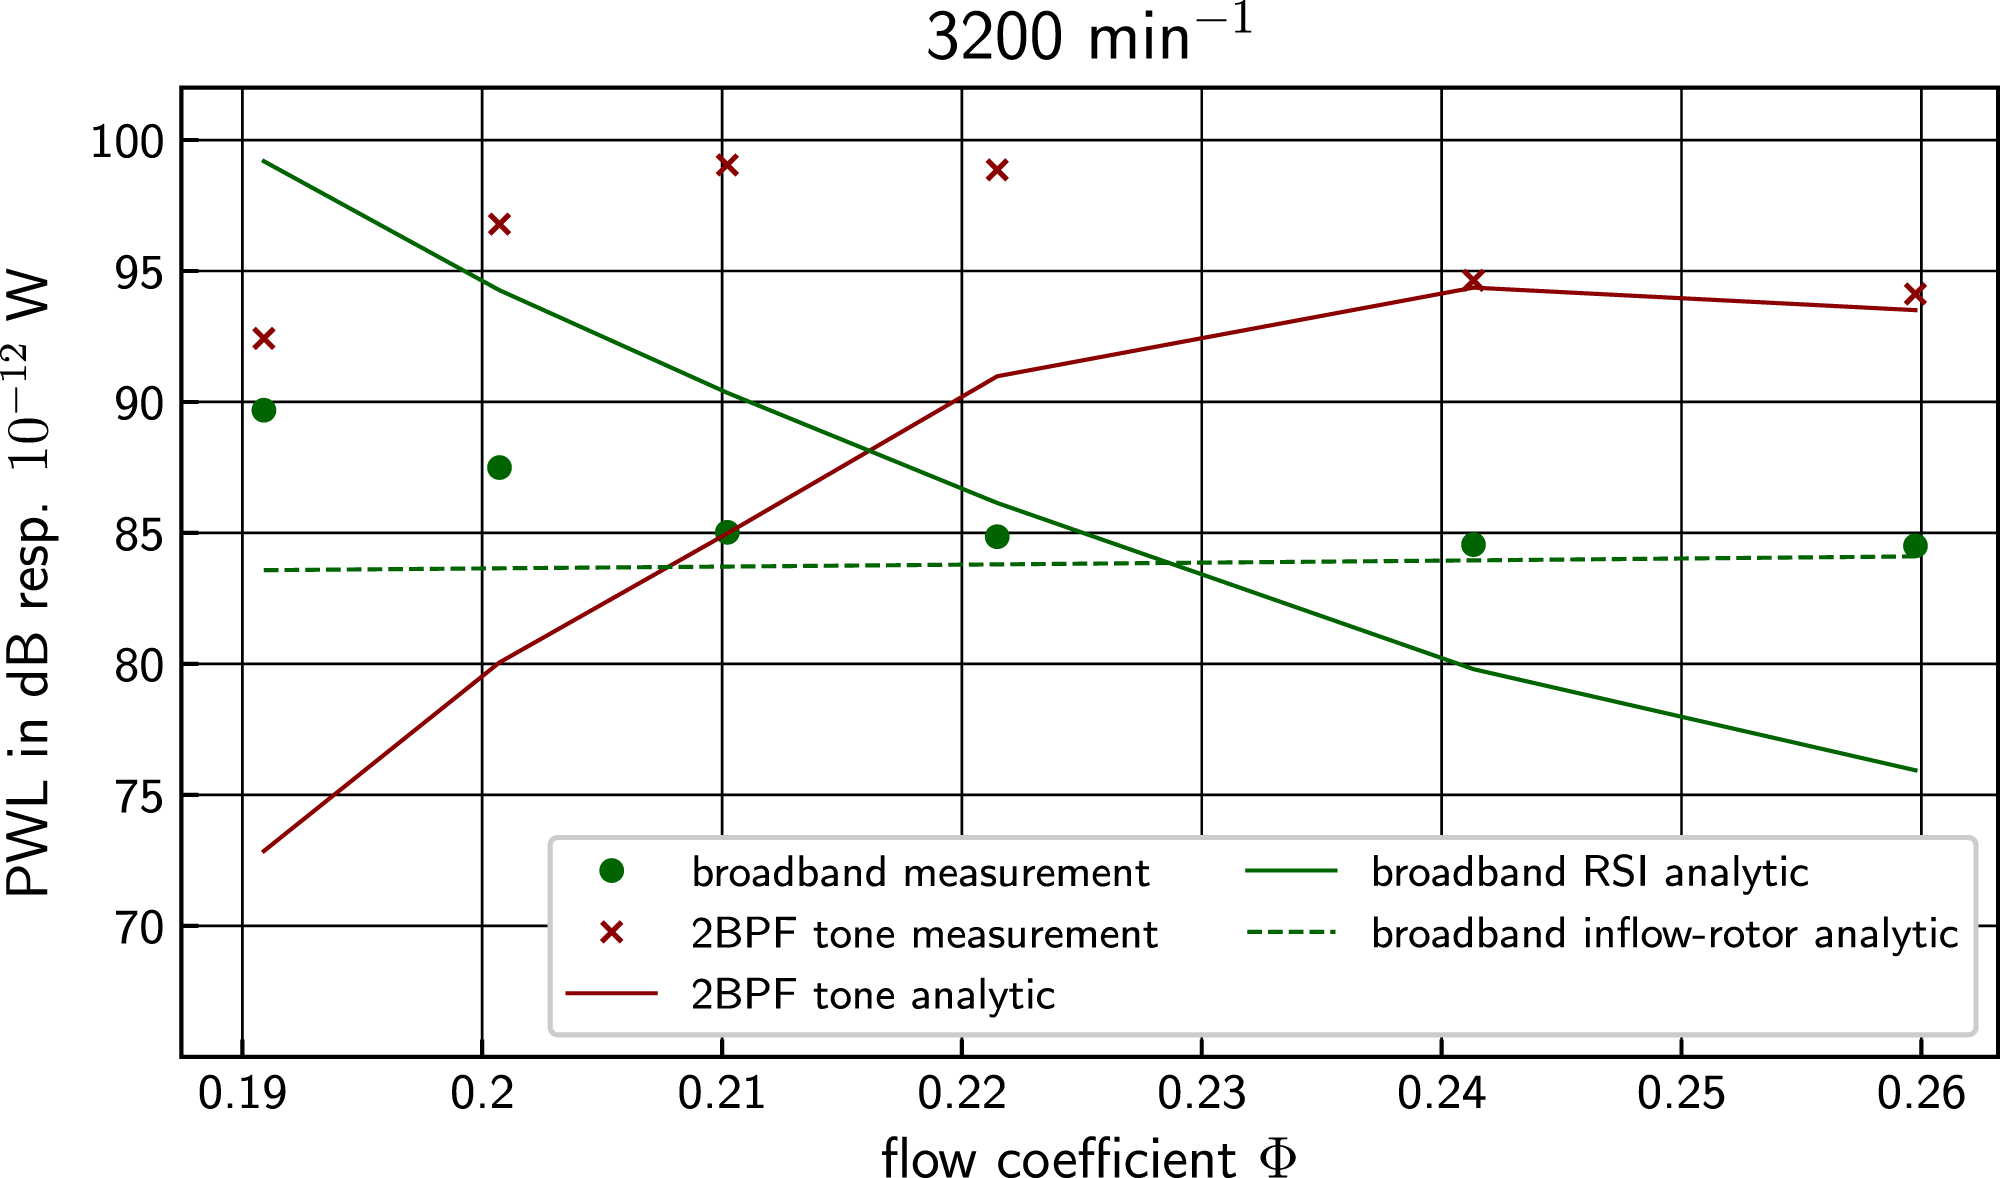
The inflow-rotor interaction noise scales with the TKE. In the current study, the TKE is assumed constant at all operating points. The measured broadband noise decreases, then a plateau is reached. As presumed, this trend can be reproduced by summation of the two simulated sources. The calculated broadband rotor–stator interaction noise continuously decreases with higher flow rates, as the rotor wakes become narrower. The calculated inflow-rotor noise remains almost constant at all flow rates and becomes a relevant source at higher flow rates, as the RSI noise further decreases.
In Figure 13(a), the upstream propagating modal distribution of the calculated RSI broadband noise and in Figure 13(b) the calculated inflow-rotor noise are depicted. It should be noted that the mode distribution is calculated at the source location. The spinner, the hub, and the flow swirl in the interstage section have an impact on the modes, especially on the cut-on frequencies. The cut-on frequencies in the measurement section with no hub and no swirl are marked with solid lines. The broadband RSI noise is excited with high amplitudes at frequencies, where the propagating mode is cut-on in the interstage area, but cut off in the measurement section. This propagation effect is not considered in the results shown in Figure 12 and could be the origin of the overestimation at small flow coefficients of the broadband RSI noise compared to the measured broadband noise. The inflow-rotor noise also excites modes with high amplitudes that are not able to propagate into the measurement section. Modal distribution of the calculated broadband noise sources at test point 3200A (Φ = 0.19).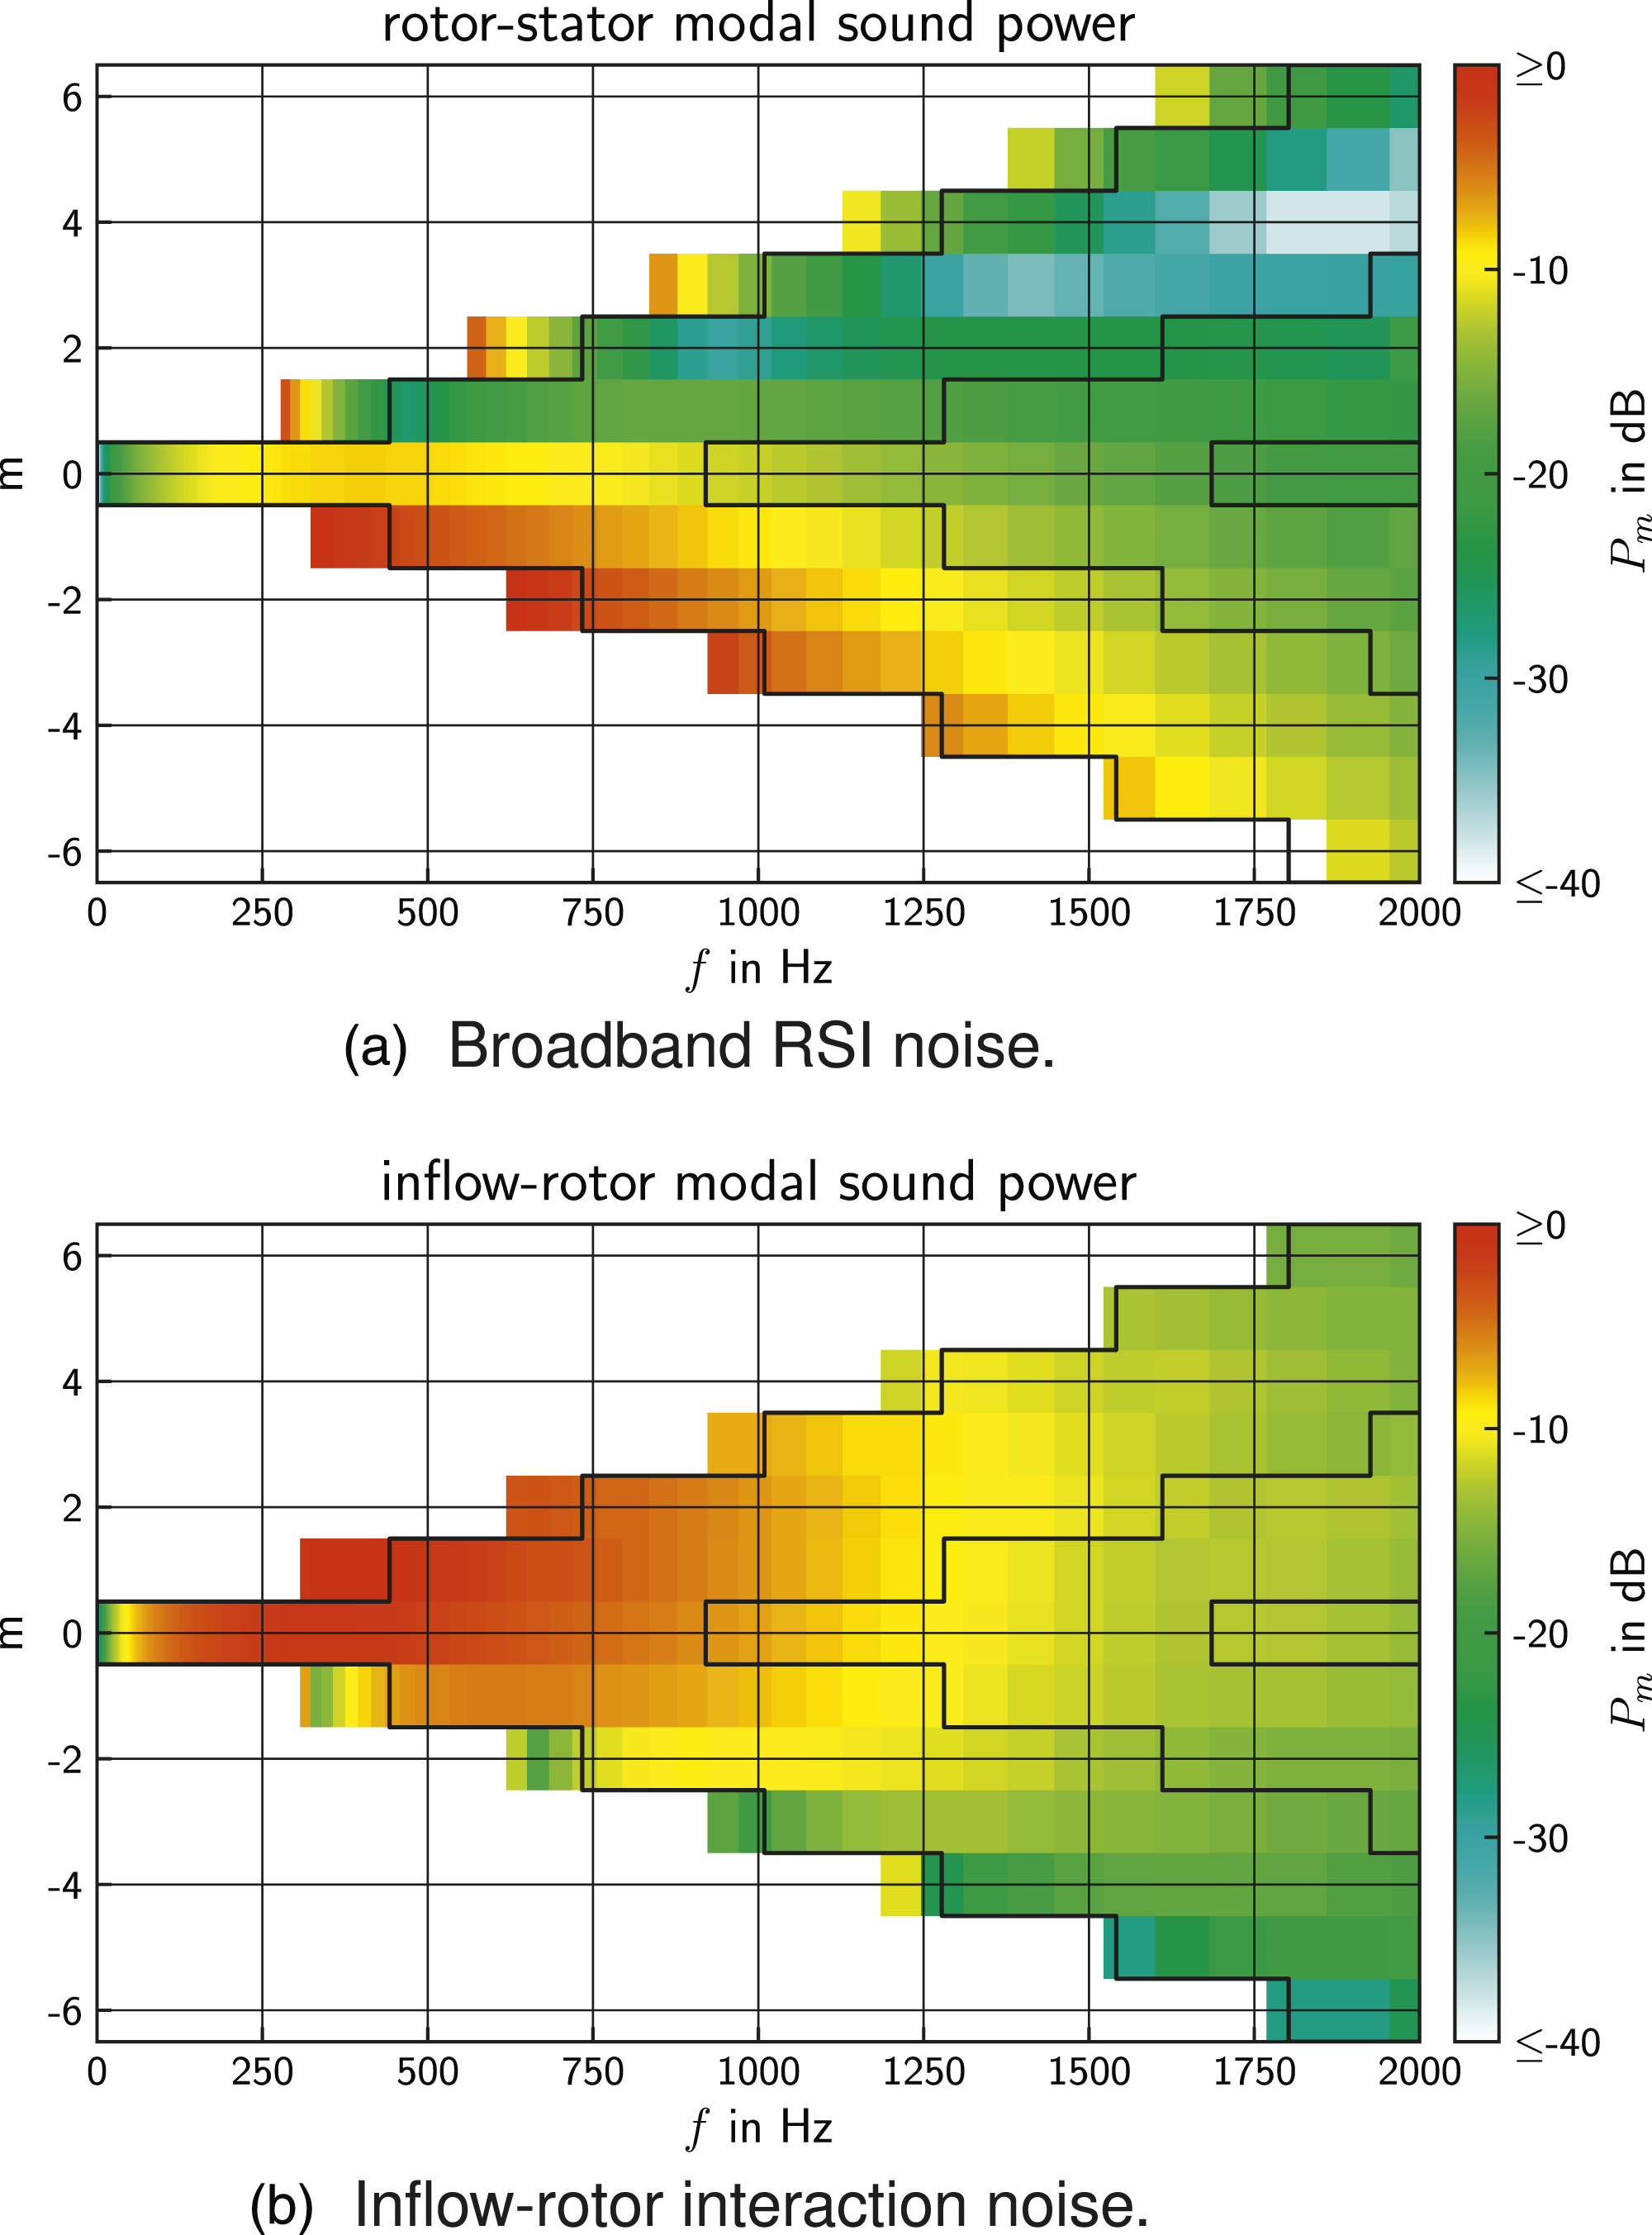
It should be noted that scattering and shielding effects at the rotor are not taken into account in the model. However, mode scattering effects at the rotor can be neglected, as the super-resonance criterion of Kaji and Okazaki 42 is not reached until about 2200 Hz. Shielding effects of the rotor also have an effect on the propagation, but are not considered in the analytical calculations. Modes with positive spinning direction are shielded by the rotor, as they rotate in opposite directions. 43 This is in agreement with the measurements at low flow coefficients that show higher amplitudes for modes with negative spinning direction. At higher flow rates however, the mode distribution is rather symmetric.
As shown in Figure 13, the two sources have a very pronounced modal distribution which is mainly driven by the dipole axis on the leading edge of the blades and vanes, respectively.
This relation is illustrated with the help of Figure 14. Let us consider a dipole at the leading edge of the rotor: Its main radiation directions are in positive θ-direction for upstream propagation, and in negative θ-direction for downstream propagation. Therefore, at the rotor-leading edge, upstream propagating modes with positive spinning direction (m > 0) are exited at higher amplitudes than modes with negative spinning direction (m > 0), and vice versa at the stator-leading edge. Note that the profiles shown in Figure 14 are only for the sake of visualization and do not resemble the real profiles of the fan. A visual comparison shows that the measured mode distribution at low flow coefficients in Figure 8(b) looks rather similar to a mode distribution of the RSI simulation as depicted in Figure 13(a), while at higher flow coefficients the measured mode distribution in Figure 8(a) shows similarities with the inflow-rotor interaction simulation results in Figure 13(b). Some remaining spectral components cannot be uniquely matched to a specific source mechanism. The simulation results show the plausibility that the broadband RSI and inflow-rotor interaction are the dominant noise sources. It seems that the rotor–stator interaction is the dominant broadband noise source at low flow coefficients, while at high flow rates the inflow-rotor noise contributes relevant sound power levels. Sketch of the dipole axes at the rotor- and stator-leading edges.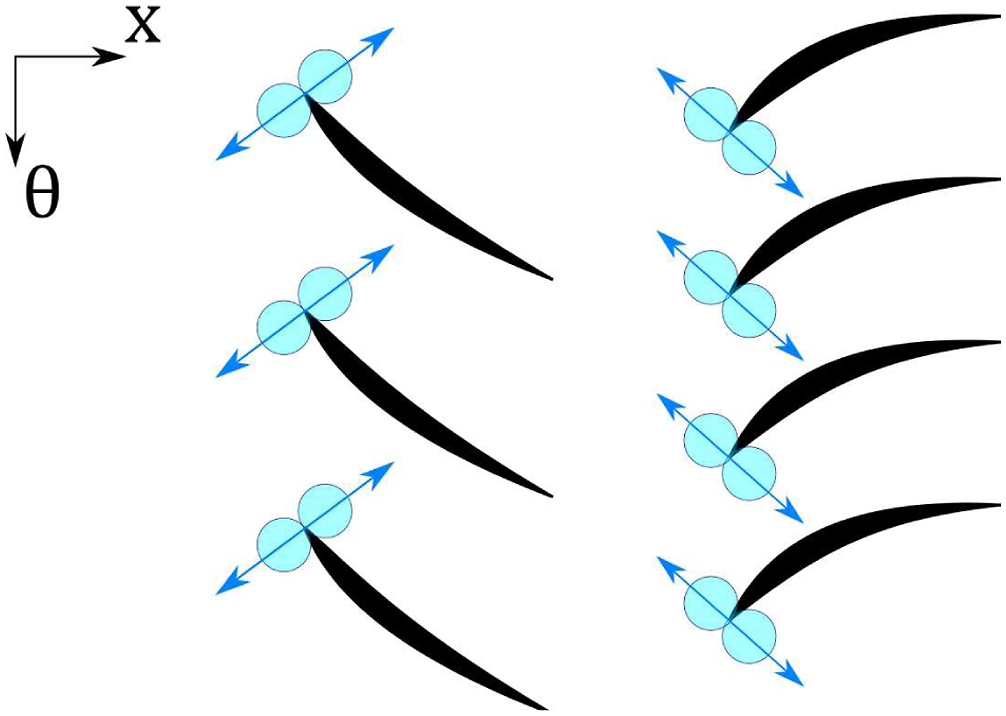
Further broadband sources could also contribute to the overall sound power. For example, numeric simulations showed a flow separation at the stator trailing edge close to the hub. In a first estimation with the analytical model, the trailing edge noise of rotor and stator is calculated to be about 10 dB below the other sources.
Conclusion
A new Blisk rotor was implemented in the test rig and the aerodynamic performance is measured to be in accordance to the prediction with an analytical approach.
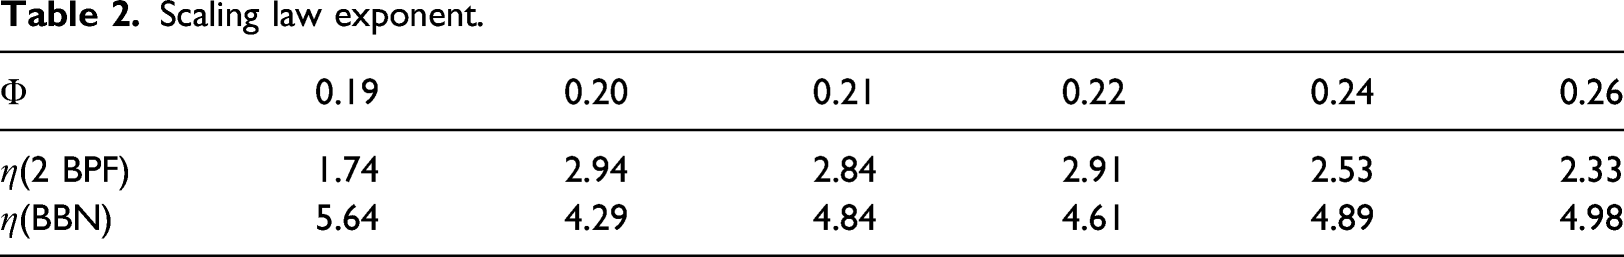
The analysis of fan noise measurements remains a challenging task. The rotor-locked tones that arise from rotor–stator interaction are sensitive to changes of the blade loading and larger deviations of the amplitude occur to theoretical prediction. The broadband spectrum is difficult to analyze because multiple sources radiate noise with fluctuating phase in the same frequency bands with similar amplitudes. Yet, some conclusions can be drawn from the presented results” 1. The dominant tone is the two BPF Tyler–Sofrin mode as would be expected. The one BPF tone is also excited, although it is cut off. This implies inflow disturbances in spite of an inflow control device. Further improvement of the flow condition is proposed for further investigations. In this regard, a new ICD was designed to reduce non-representative noise excitation in future experiments.26,44 2. A step-like pattern is found in the mode analysis of the tones around two BPF that results from deviations between individual rotor blade wakes. Further research is suggested to clarify whether these wake deviations are a result of inflow disturbances or due to manufacturing tolerances. 3. The tonal noise amplitude of two BPF is the lowest at off-design conditions, either very high or very low loading. This implies a potential design conflict between fan performance and acoustic optimization. 4. Depending on the flow coefficient, the tonal noise in the inlet scales with the Mach number to the power of 1.7–2.9, while the broadband noise scales with the Mach number to the power of 4.3–5.6. Therefore, the broadband noise must be considered at higher Mach numbers. 5. The measured broadband noise mode spectrum is symmetric and planar at the design point. At off-design however, the mode distribution is asymmetric and the spectrum contains frequency bands with elevated sound power. It is assumed that different source mechanisms dominate at these operating points. 6. The geometry of the rotor wakes is modeled based on center line. The tonal RSI noise is sensitive to changes in the geometry of the wakes. Therefore, larger deviations are found between the acoustic and experimental results. To accurately model the tonal noise sources, CFD simulations or measurements of the rotor wakes are deemed necessary. 7. For the analysis of broadband noise, the theoretical model was used on the basis of the non-stationary flow field, which was reasonably estimated from former measurements. Based on the modal distribution of the calculated sources, the two dominant broadband noise sources are plausibly identified to be broadband RSI noise at low flow rates and inflow-rotor noise at high flow rates. The expected fan-operating conditions should thus be considered in the design of low-noise fans.
Although numerous simplifications made with the mean line approach, the simulations predicted the general trends fairly well. The stationary flow field is measured at only one position and the turbulence is only estimated on the basis of comparable measurements. The findings of this study will help to set up test plans of future experiments, that are planned at a new test rig with optimized aerodynamic conditions at higher rotor speeds and mass flows. The new test rig includes an improved inflow control device to reduce the inhomogeneity of the flow field and extensive microphone arrays, allowing acoustic analysis at higher frequencies. 44 An additional array downstream of the stator will be implemented, possibly turning the spotlight on other source mechanisms such as rotor or stator trailing edge noise. Thus in upcoming studies the research questions that arise from this study will be pursued.
Footnotes
Declaration of conflicting interests
The author(s) declared no potential conflicts of interest with respect to the research, authorship, and/or publication of this article.
Funding
The author(s) received no financial support for the research, authorship, and/or publication of this article.