
Abstract
This manuscript describes an aeroacoustic computational study on the impingement of a tractor-propeller slipstream on the leading edge of a pylon. Both the flow and acoustic fields are studied for two pylon leading edges: a solid and a flow-permeable one. The computational set-up replicates experiments performed at Delft University of Technology. Computational results are validated against measurements. It is found that the installation of the flow-permeable leading-edge insert generates a thicker boundary layer on the retreating blade side of the pylon. This is caused by an aerodynamic asymmetry induced by the helicoidal motion of the propeller wake, which promotes a flow motion through the cavity from the advancing to the retreating blade side of the pylon. The flow-permeable leading-edge insert mitigates the amplitude of the surface pressure fluctuations only on the pylon-retreating blade side towards the trailing edge, thus reducing structure-borne noise. Furthermore, it causes a reduction of the near-field noise only for receiver angles oriented in the upstream direction at the pylon-retreating blade side. In this range of receiver angles, it is found that the flow-permeable leading-edge insert reduces the amplitude of the tonal peaks for the third and fourth blade passage frequency, but strongly increases the broadband noise for frequencies higher that the seventh blade passage frequency.
Introduction
Propellers are an interesting propulsion system because of the lower fuel consumption of about 10–20% with respect to turbofan engines, 1 and for the recent focus on electric propulsion. On the other side, propellers generate higher noise that reduces cabin comfort. To minimize cabin noise, propellers are positioned as far away as possible from the passengers 2 such as in the aft-mounted propeller configuration, where the propeller is connected to the airframe through a dedicated pylon. In this case, propellers can be mounted in a tractor or pusher configuration. From an acoustic point of view, the latter suffers for an additional noise source due to the unsteady impingement of the pylon wake on the propeller blades.3,4 To avoid this source of noise, propellers can be mounted in a tractor configuration.
Aft-mounted tractor-propeller configurations show two distinct effects: an upstream effect, due to the presence of the pylon that perturbs the propeller inflow; and a downstream effect, due the propeller slipstream impinging on the pylon that reduces the pylon aerodynamic performance. The upstream disturbance of the propeller inflow leads to a non-uniform blade loading, introducing an additional noise source next to the steady-loading and thickness noise generated by the isolated propeller. 5 However, at low angles of attack, the upstream effect is negligible with respect to the downstream one particularly for pylon-mounted configurations featuring symmetric profiles. 6
The periodic impingement of the rotor blade wakes and tip vortices is experienced by the pylon as an unsteady inflow condition, resulting in an unsteady loading with span-wise and chord-wise gradients.7–10 The unsteady pylon loads cause vibrations, which are transmitted into the structure of the aircraft and can be perceived by the passengers as structure-borne noise. 11 This noise source can be mitigated by modifying the transmission path of the vibrations, 12 or by decreasing the amplitude of the unsteady aerodynamic loading. A possible way to reduce the amplitude of the unsteady loading is to use a pylon with a flow-permeable leading edge, also referred to as passive porosity.13–16 Tinetti et al.13,14 applied passive porosity to mitigate the unsteady loading for rotor–stator interaction in turbo-machinery. They showed a reduction of the unsteady loading up to 21%. However, it was shown that the flow-permeable leading edge modifies the pressure distribution on the surface, thus changing the effective aerodynamic shape. Lee 15 applied a flow-permeable leading edge for blade–vortex interaction noise for helicopter applications, showing a reduction of the amplitude of the interaction noise up to 30%. Della Corte et al. 16 investigated experimentally the potential of flow-permeable leading edges to alleviate the unsteady loading caused by the impingement of the propeller slipstream on a downstream surface, for which wake-impingement and vortex-impingement phenomena occur simultaneously. The spatial distribution of the cavities was based on the optimal configuration identified by Tinetti et al.13,14 They investigated the effect of both the cavity size and of the hole diameter with particle image velocimetry (PIV). The experiments showed that the near-wall pressure fluctuations decrease up to 30% at the tip-vortex impingement region, thus reducing the unsteady loading up to 25%. On the other side, they showed large penalties in terms of aerodynamic performances (i.e. lower lift and higher drag), in particular at angles of attack higher than 6°. This is caused by the larger boundary-layer thickness on the retreating blade side of the pylon due to the cross-flow through the flow-permeable leading edge.
The turbulent boundary layer developing over the aerofoil and the cross-flow through the holes can affect the near- and far-field noise and its directivity because of two noise sources: leading-edge impingement noise and the turbulent-boundary-layer trailing-edge noise. To the authors’ knowledge, no analysis on the cavity flow and on the far-field noise for a flow-permeable leading-edge insert has been carried out in the literature. For this reason, and because many studies on flow-permeable materials at the leading edge have been presented in the recent literature,17,18 a computational investigation of both the flow and acoustic fields for a flow-permeable leading edge has been carried out. The flow is computed by solving the explicit, transient, compressible Lattice-Boltzmann (LB) equation, while the acoustic field is obtained by means of the Ffowcs Williams and Hawkings (FWH) acoustic analogy. 19 The configuration replicates the experiments performed at Delft University of Technology,9,10,16 which are used as benchmark.
In the following article, initially, the computational method and set-up are discussed. The grid-convergence study and the comparison with the experiments are presented next. The flow field and the acoustic footprint are then discussed. A summary of the findings is reported in the concluding section.
Computational method
Flow solver
The LB method is used to compute the flow field because it was shown to be accurate and efficient for noise prediction in presence of complex flow problems.20–24 The commercial software PowerFLOW 5.4a is used. The software solves the discrete LB equation for a finite number of directions. For a detailed description of the method, the reader can refer to Succi
25
and Shan et al.,
26
while to Chen and Doolen
27
for a review. The LB method determines the macroscopic flow variables starting from the mesoscopic kinetic equation, i.e. the LB equation. The discretization used for this particular application consists of 19 discrete velocities in three dimensions (D3Q19), involving a third-order truncation of the Chapman-Enskog expansion. It was shown that this scheme accurately approximates the Navier-Stokes equations for a perfect gas at low Mach number in isothermal conditions.
28
The distribution of particles is solved by means of the LB equation on a Cartesian mesh, known as a lattice. An explicit time integration and a collision model are used. The LB equation can then be written as


The dimensionless kinematic viscosity ν is related to the relaxation time following Chen et al.
28
A very large eddy simulation model is implemented to take into account the effect of the sub-grid unresolved scales of turbulence. Following Yakhot and Orszag,
30
a two-equation
In order to reduce the computational cost, a pressure-gradient-extended wall-model (PGE-WM) is used to approximate the no-slip boundary condition on solid walls.32,33 The model is based on the extension of the generalized law-of-the-wall model
34
to take into account the effect of pressure gradient. The expression of the PGE-WM is

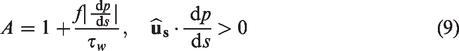

In the equations, τw is the wall shear stress,
Noise computations
The compressible and time-dependent nature of the transient computational fluid dynamics solution together with the low dissipation and dispersion properties of the LB scheme 35 allow extracting the sound pressure field directly in the near-field up to a cut-off frequency corresponding to approximately 15 voxels per acoustic wavelength.
In the far field, noise is computed by using the FWH equation. 19 The formulation 1A, developed by Farassat and Succi 36 and extended to a convective wave equation is used in this study.35,37 The formulation is implemented in the time domain using a source-time dominant algorithm. 38 Integrations are performed on the surface of the model where the unsteady pressure is recorded with the highest frequency rate available on the finest mesh resolution level (referred to as solid formulation). As a consequence, acoustic monopoles and dipoles distributed on the surface of the aerofoil are the only source terms of interest, 39 and the non-linear contribution related to the turbulent fluctuations in the wake of the aerofoil are neglected. For validation purposes (Validation of the computational set-up section), integration is also performed on an FWH flow permeable surface (black sphere in Figure 1). In the following, this method is named as permeable formulation.
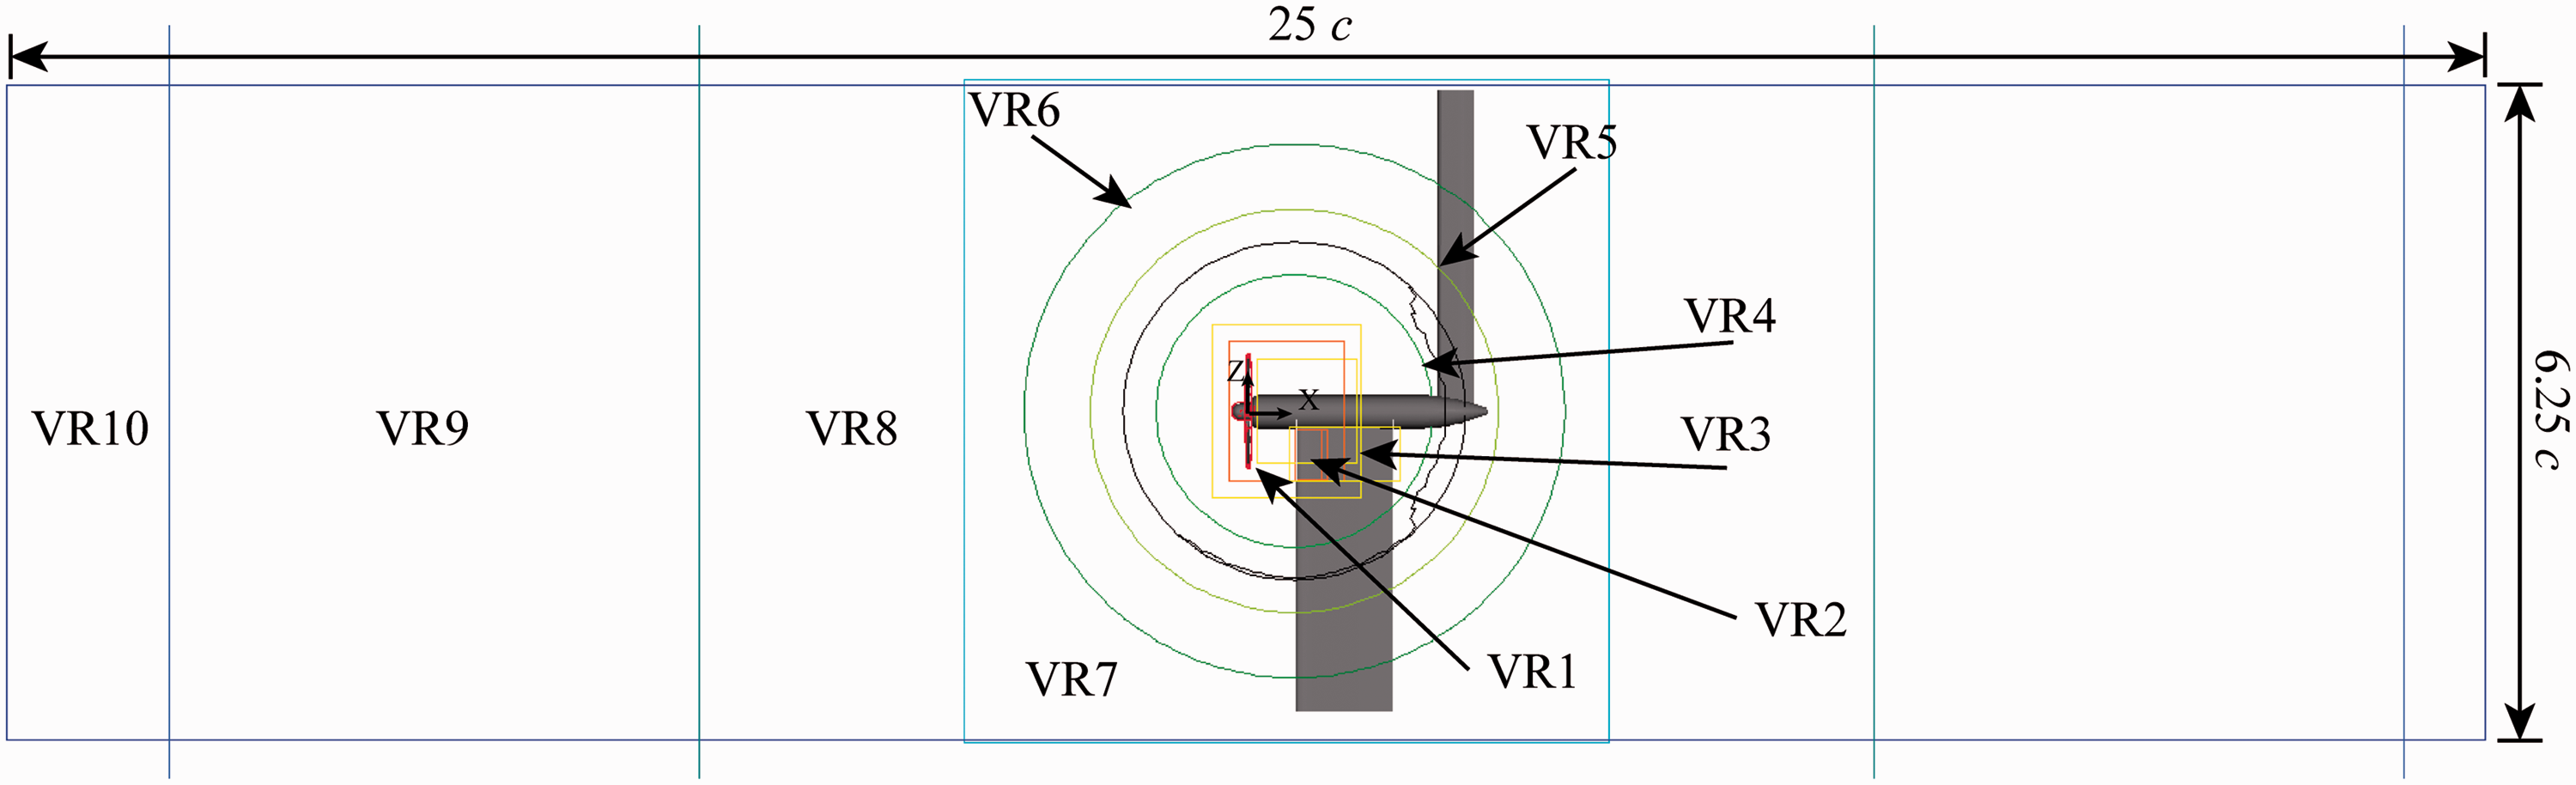
Side view of the computational domain with the resolution regions (VR). The resolution increases from blue to red.
Computational set-up
The computational test case replicates the experiments of de Vries et al., 9 Sinnige et al., 10 and Della Corte et al., 16 where a tractor-propeller configuration is realized by positioning a pylon downstream of a propeller, as shown in Figure 2.
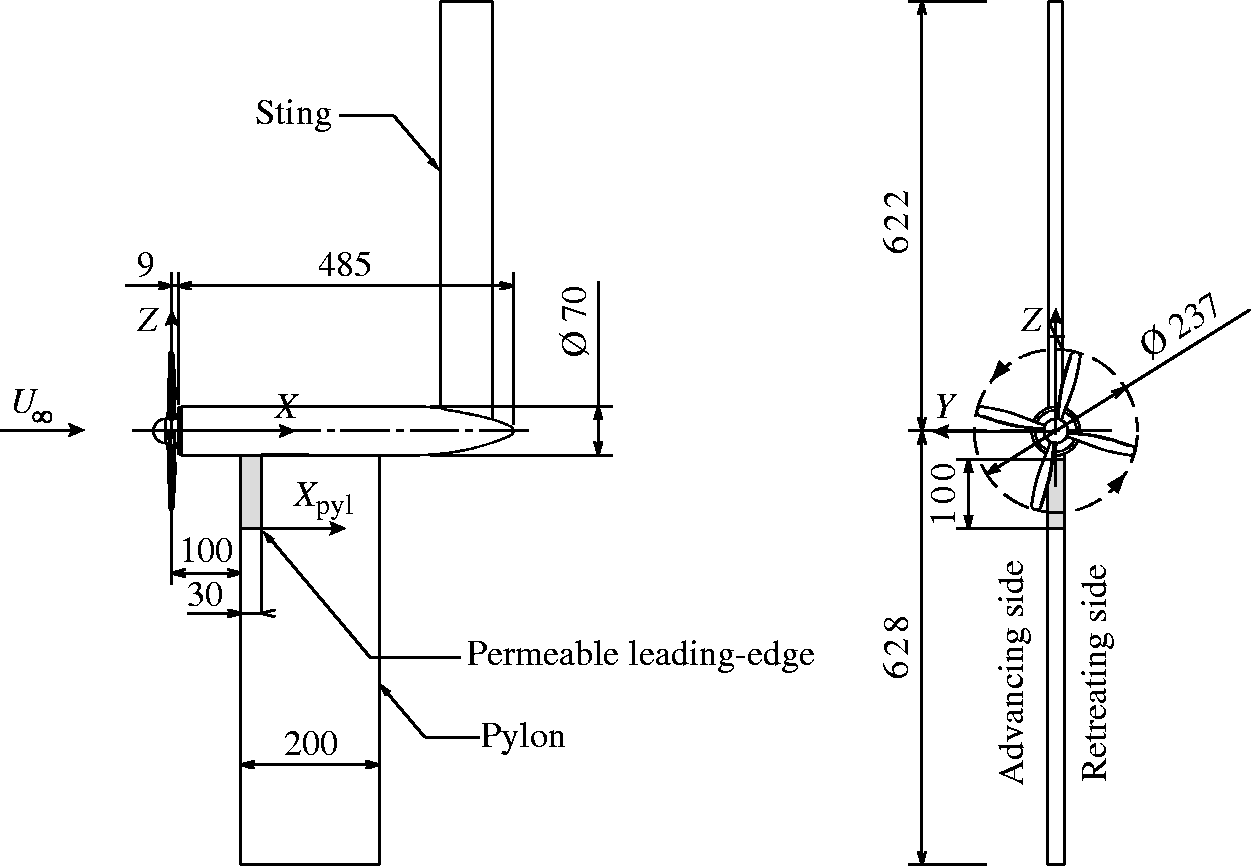
Geometry of the tractor-propeller configuration. Dimensions are in mm.
The propeller has four blades and a diameter D equal to 0.237 m. The blade angle relative to the chord at 75% of the propeller radius (
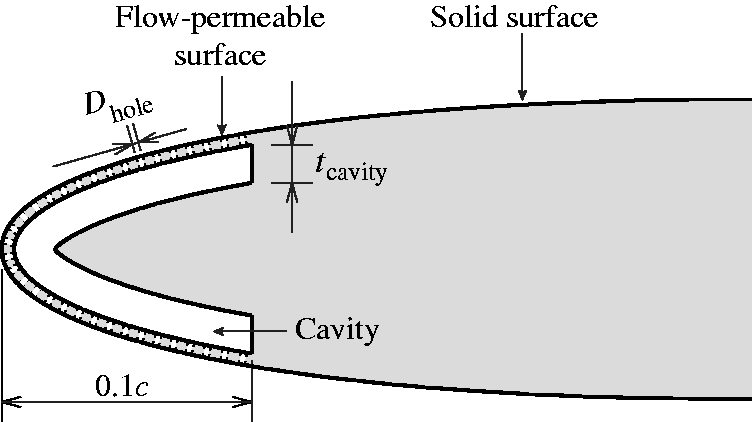
Geometry of the flow-permeable leading-edge insert.
The free-stream velocity
Two reference systems are used: a global reference system (X,Y,Z) and a pylon-based reference system (Xpyl,Ypyl,Zpyl), both shown in Figure 2. The former has origin at the centre of the propeller; the X-axis oriented in the axial direction (i.e. the free-stream direction), the Z-axis in the wall-normal direction, and the Y-axis is such to have a right-hand oriented reference system. The pylon-based reference system has origin Xpyl = 0 at the leading edge of the pylon, Zpyl = 0 at
The simulation domain is a box of length equal to 25 c (5 m) in the X direction, 6.25 c (1.25 m) in the Z direction and 9 c (1.8 m) in the Y direction, as the wind-tunnel test section. Slip boundary conditions are imposed on all the sides of the computational domain. Outside a circular refinement zone of diameter equal to 5 c, an anechoic outer layer is used to damp-out the outward radiating and the inward reflected acoustic waves. It has been verified, through visualization of the dilatation plot, that this does not trigger any acoustic reflection. A total of 10 mesh refinement regions (VR) with resolution factor equal to 2 are employed. They are shown in Figure 1, where colors from blue to red correspond to resolution increase. The minimum voxel size is about 0.07 mm (i.e. 14 voxels/Dhole) and it is used to discretize the flow field around the blades, the hub and the holes of the flow permeable surface. The rest of the leading edge and the pylon are modelled with one coarser level of resolution. The corresponding dimensionless wall distance y+ is reported in Figure 4. In total, about 7.5 × 10⁸ voxels (vx) and 1.15 × 10⁷ surfels are used to discretize the problem. The flow-simulation time is equal to eight rotor revolutions (0.037 s) requiring 2.36 × 10³ CPU hours per revolution on a Linux Xeon E5–2690 2.9 GHz platform.
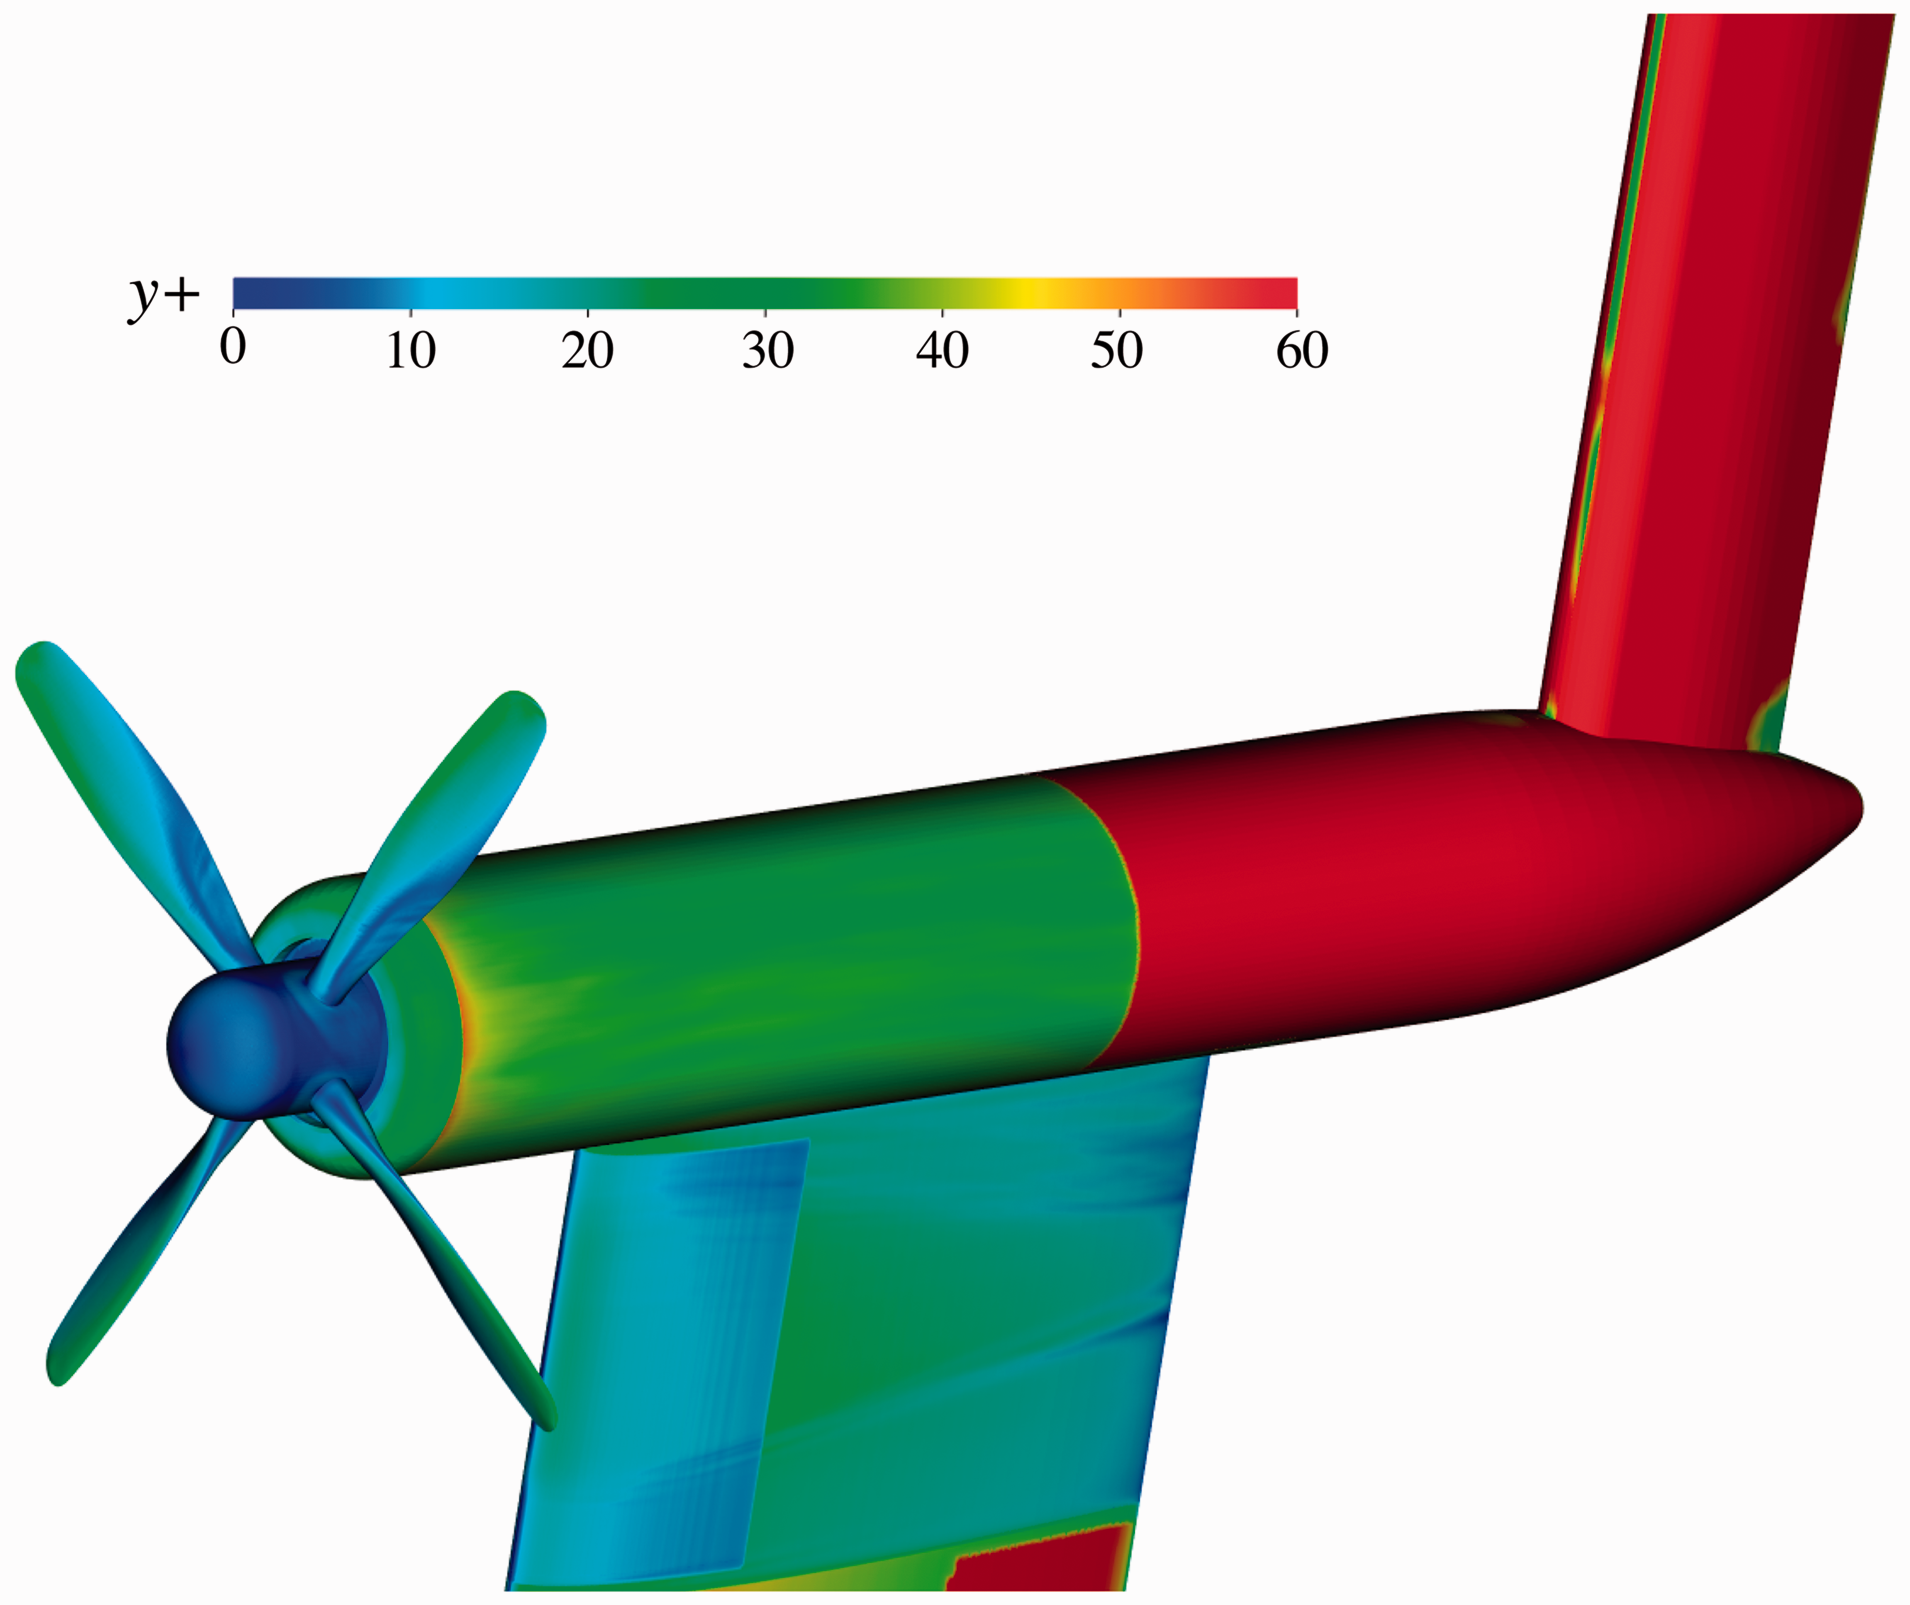
Dimensionless wall distance
The physical time step, corresponding to a Courant-Friedrichs-Lewy number of 1 in the finest mesh resolution level, is 1.13 × 10⁻⁷ s. Surface pressure fluctuations are sampled with a frequency of f = 20 kHz (
Validation of the computational set-up
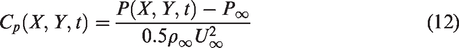
Computational results are validated through a grid-convergence study and against experimental data. The grid-resolution study is carried out to verify that both the fluid-dynamic results and the acoustic field do not depend on the chosen grid. This is achieved by uniformly increasing the resolution of each refinement region. Four grid resolutions are investigated with minimum voxel size, respectively, equal to 5, 10, 14, 20 vx/Dhole. The rotor thrust coefficient CT is the integral parameter used for the comparison. It is defined as

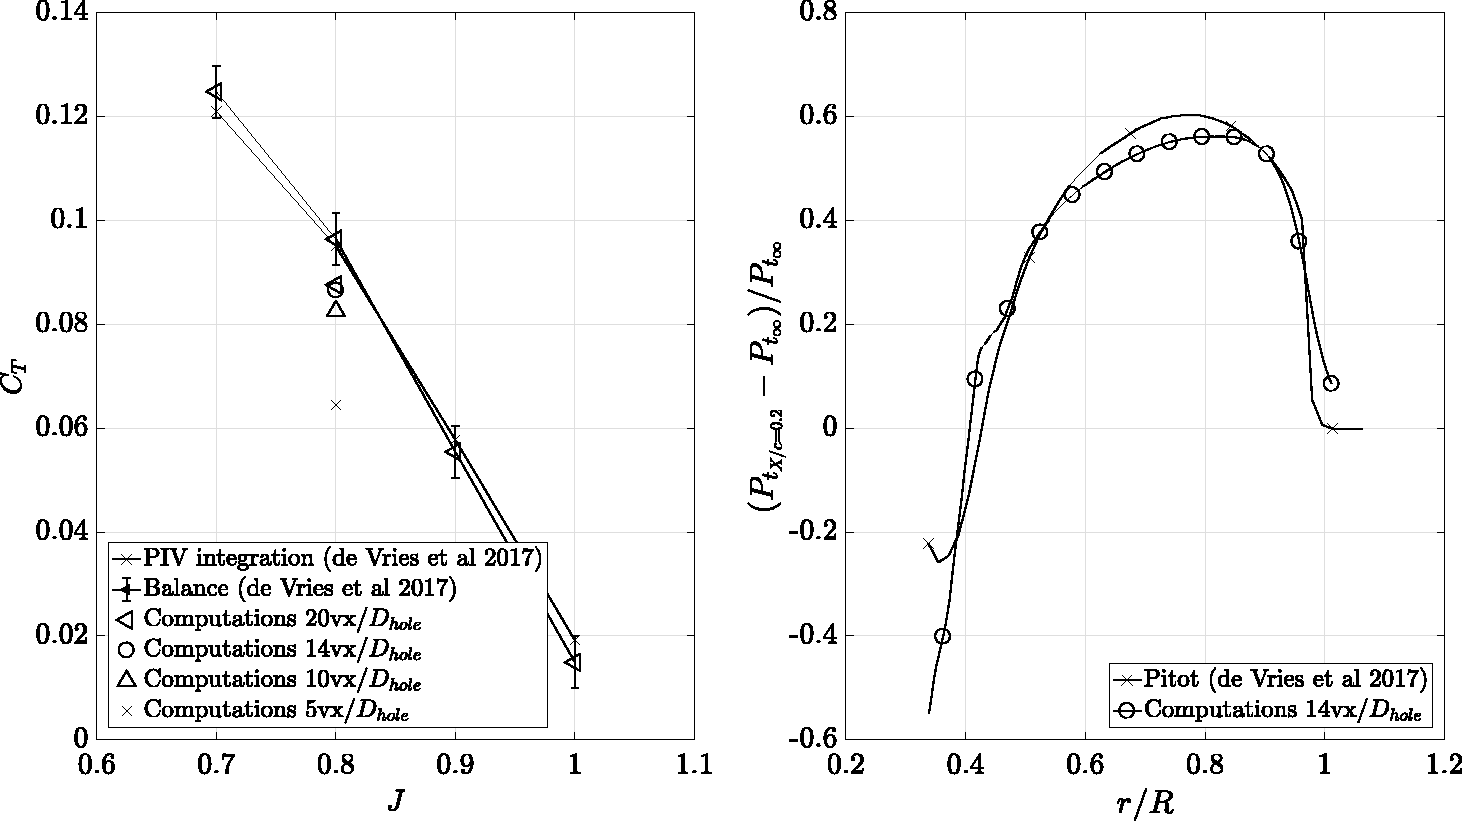
(Left) Thrust coefficient obtained from computations with different resolutions compared with experimental data. (Right) Pressure distribution in the near wake of the propeller at
Since the aim of the manuscript is to investigate the propeller-slipstream pylon impingement, the computed propeller wake is validated against the measurements. The radial distribution of the dimensionless total pressure difference
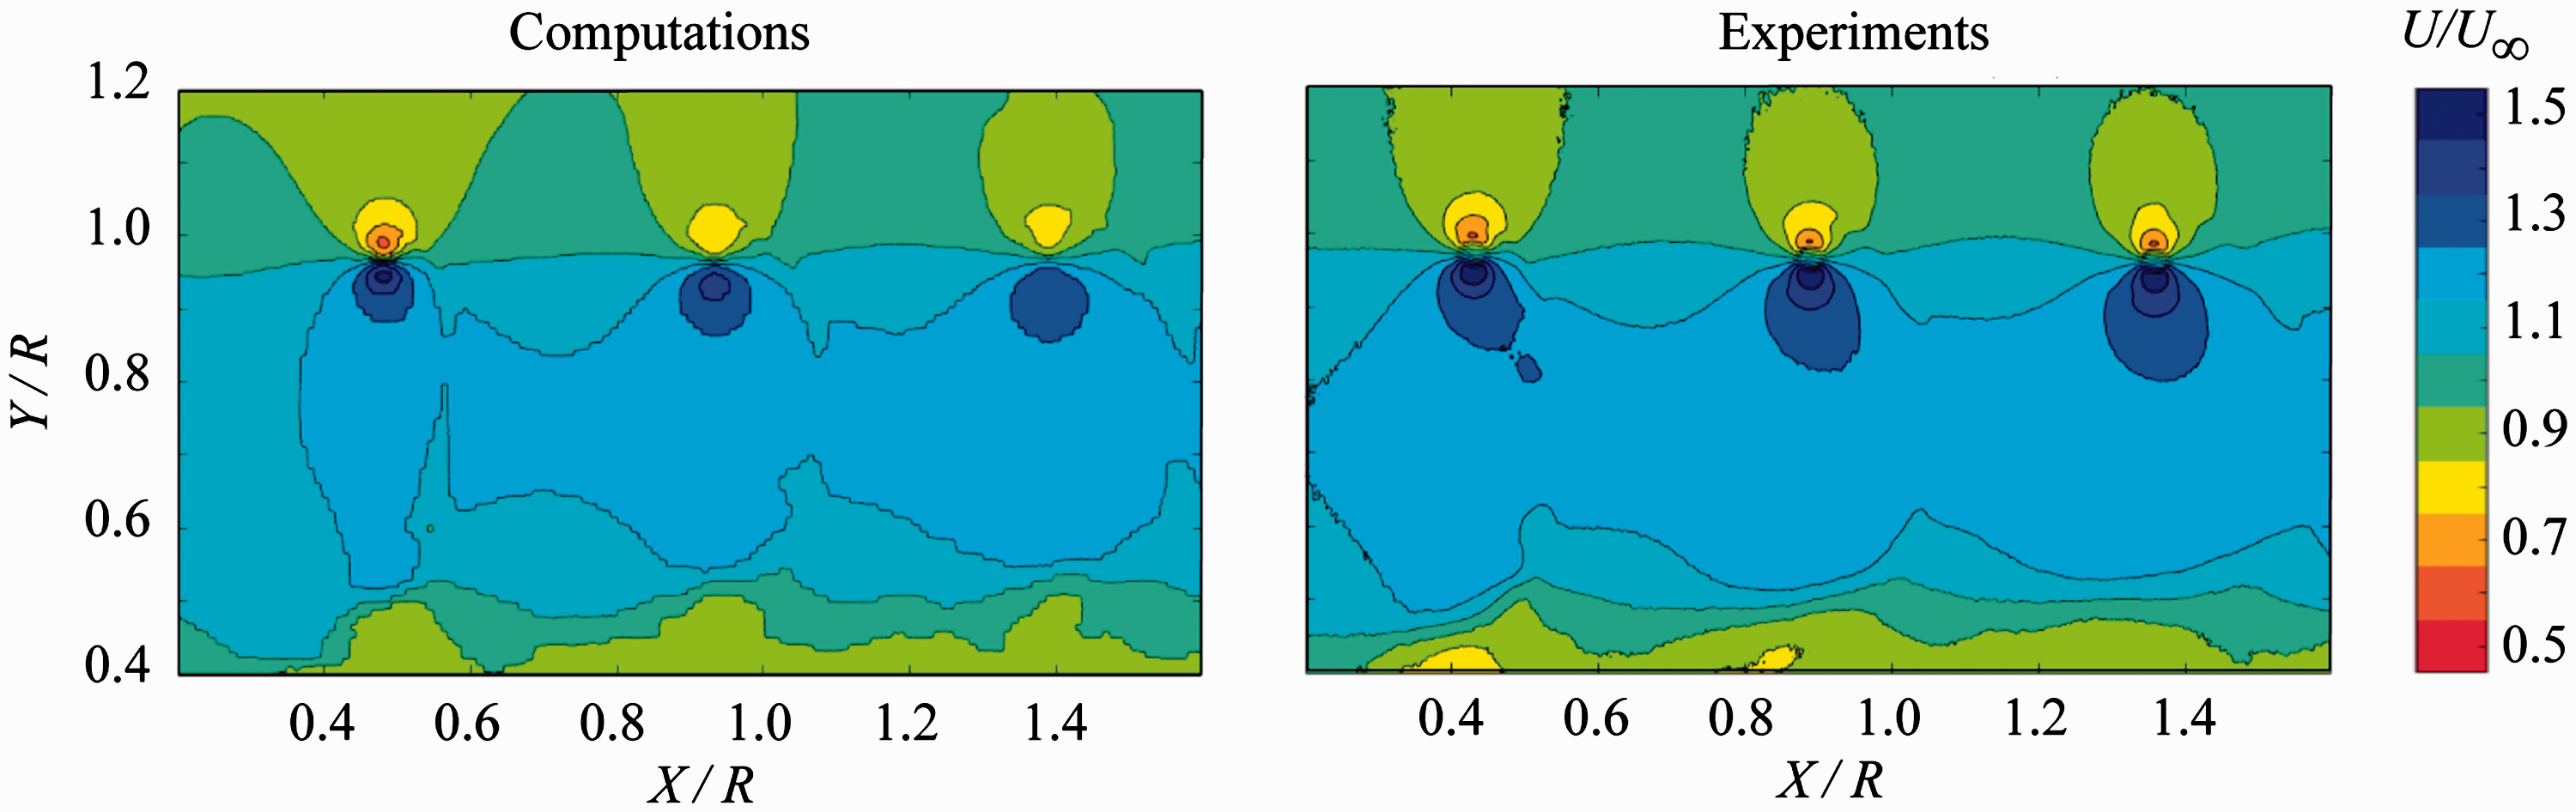
Dimensionless time-averaged stream-wise velocity
After having verified that the wake flow is well captured, the root-mean-square of the instantaneous pylon pressure coefficient (
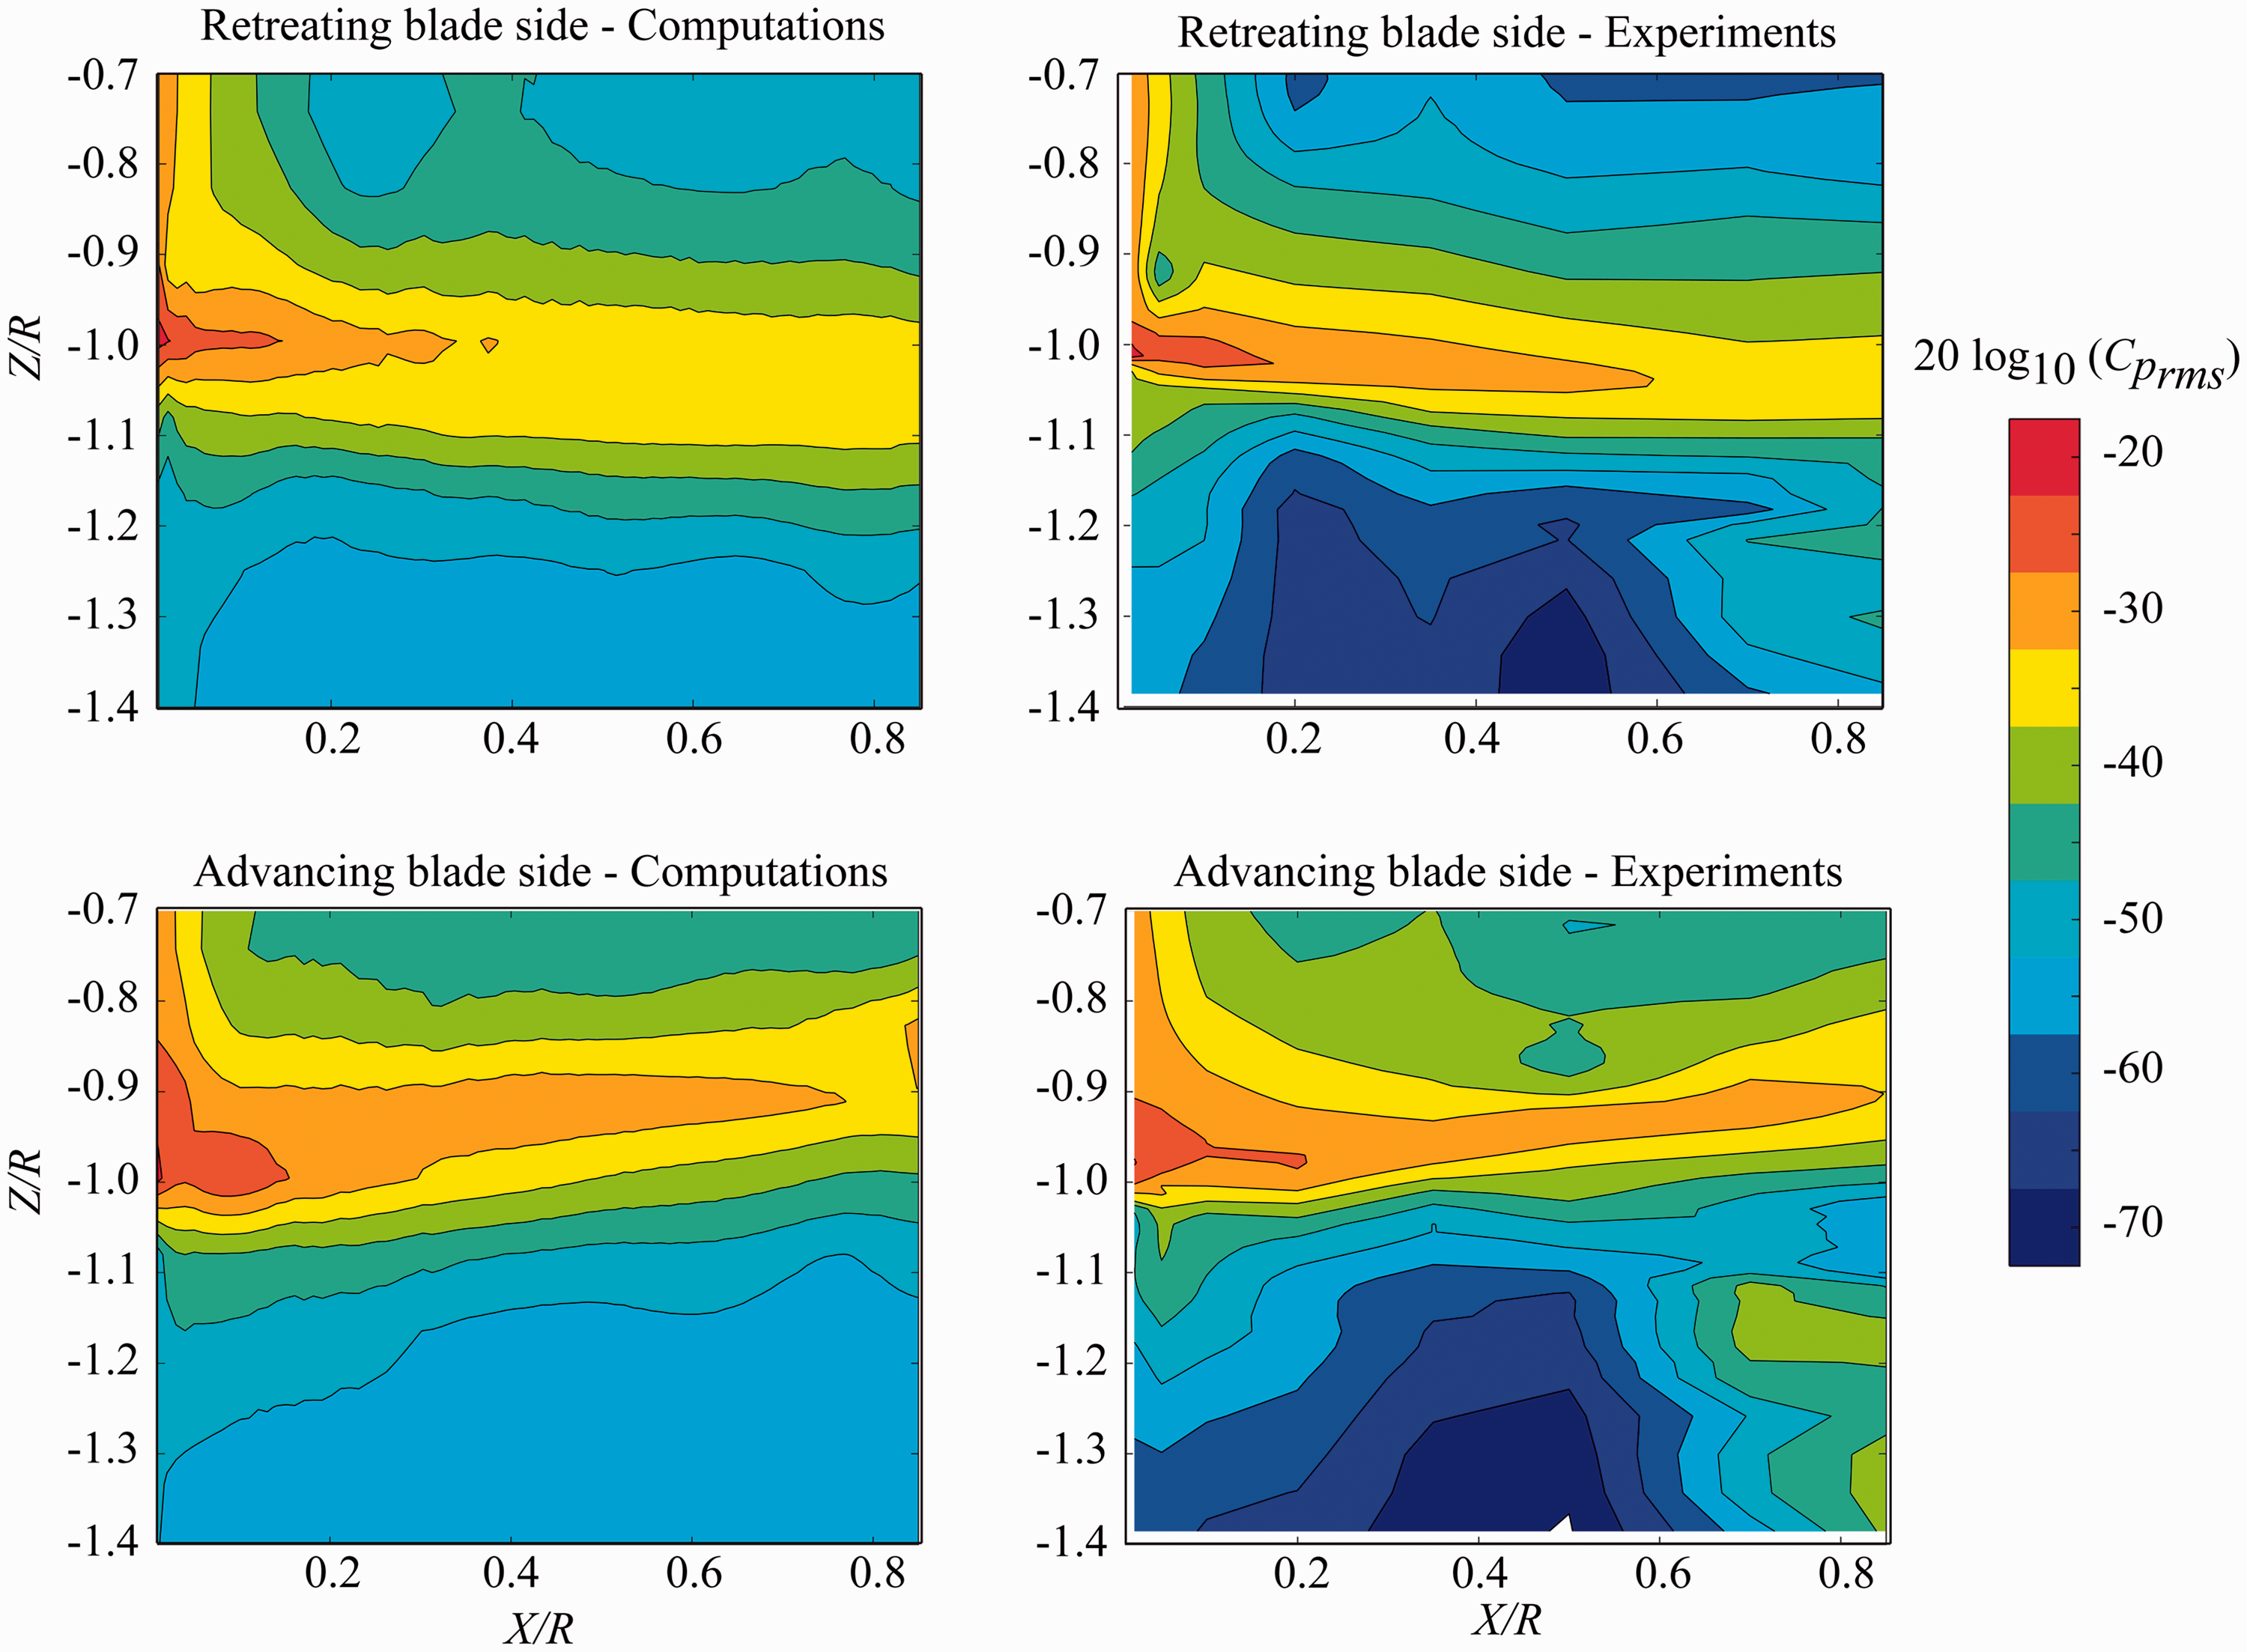
Root-mean-square of the surface pressure fluctuations on the pylon surface. Experimental data taken from de Vries et al. 9
It is worth mentioning that experimental data were obtained by using an additional sleeve, not present in these computations, sliding in the Z direction and equipped with eight microphones per side. An overall good agreement, both in terms of amplitude of the pressure fluctuations and of their spatial distribution is found. The figure shows that the propeller tip vortex, that impinges at
Because of the flow periodicity, the comparison is further extended to the phase-averaged wave-forms of the pressure coefficient
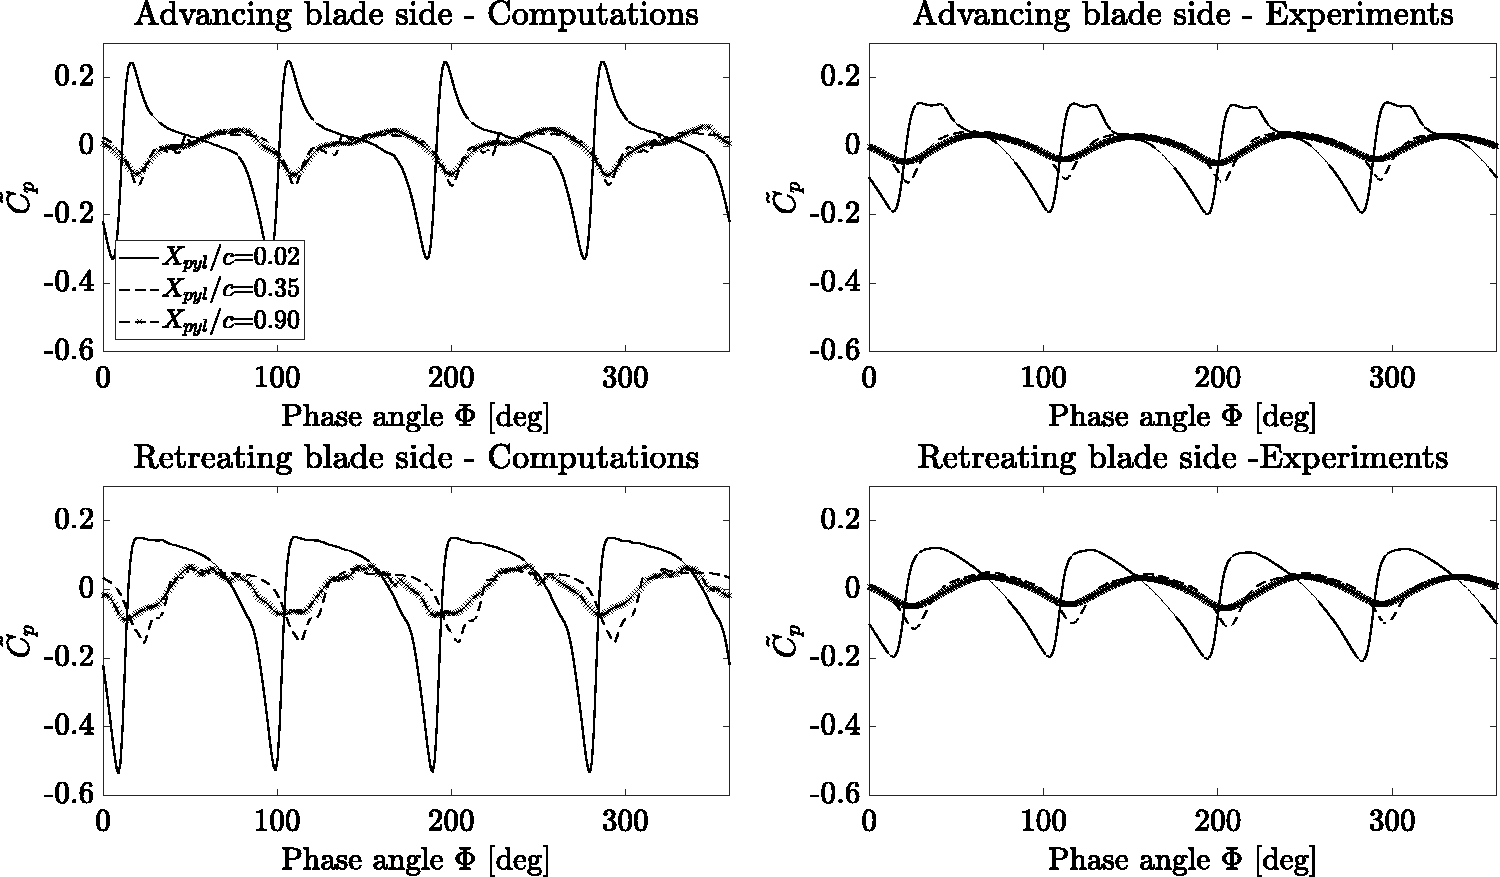
Phase-averaged pressure wave-forms at three stream-wise locations along the tip-vortex trajectory. Experimental data taken from de Vries et al. 9
The aerodynamic asymmetry is confirmed by the time-averaged pressure coefficient Cp shown in Figure 9. In the figure, the experimental Cp is retrieved from PIV at 1.5 mm from the surface for both the solid and flow-permeable leading-edge configurations in the range
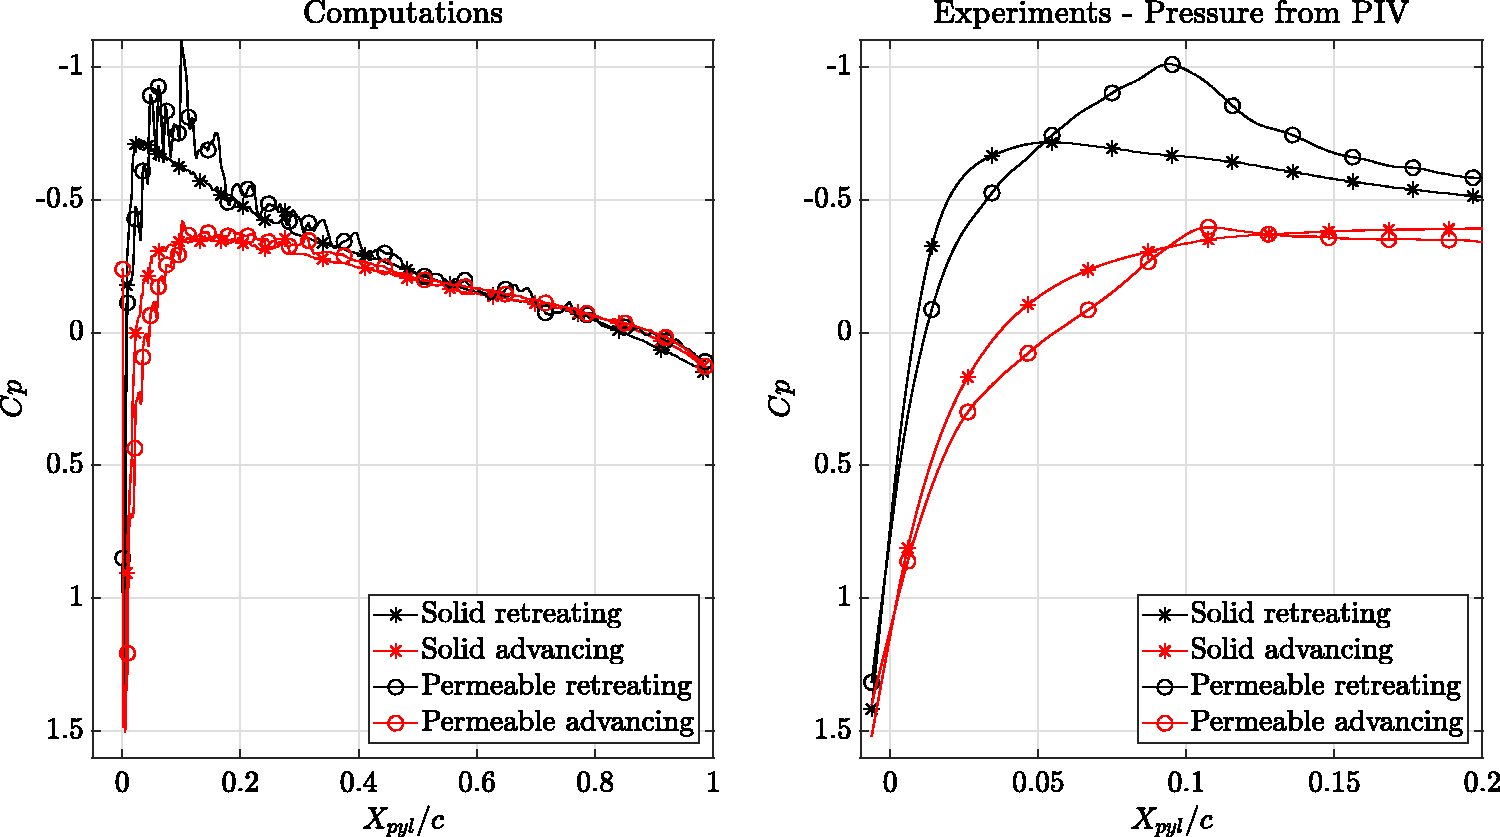
Time-averaged pressure coefficient at
The validation results of the acoustic prediction are shown in Figure 10. The convergence of the grid is assessed by comparing noise results for the two finest resolutions tested. Furthermore, the reliability of the FWH computation is further verified by comparing noise results obtained by using both the solid and permeable formulations (Noise computations section). Figure 10 shows the polar plot of the overall sound pressure level (OASPL) obtained using two radial arches of 40 microphones each located at a distance of 4R and
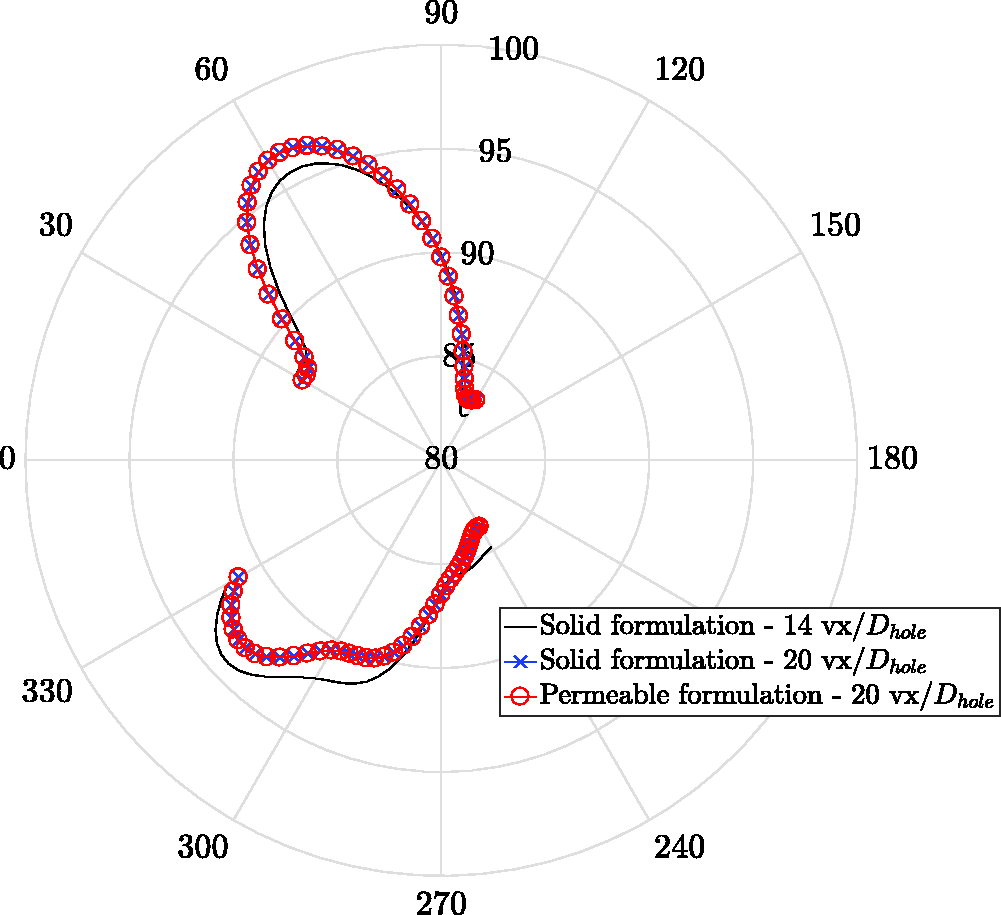
Polar plot of the overall sound pressure level (OASPL). Receiver angles ranging between
Flow-field analysis
Flow-field around the pylon
The three-dimensional flow field is shown in Figure 11 for both the solid (left) and flow-permeable (right) leading-edge configurations. In the figure, iso-surfaces of the λ2 criterion for vortex identification
43
colour-contoured with the dimensionless velocity magnitude
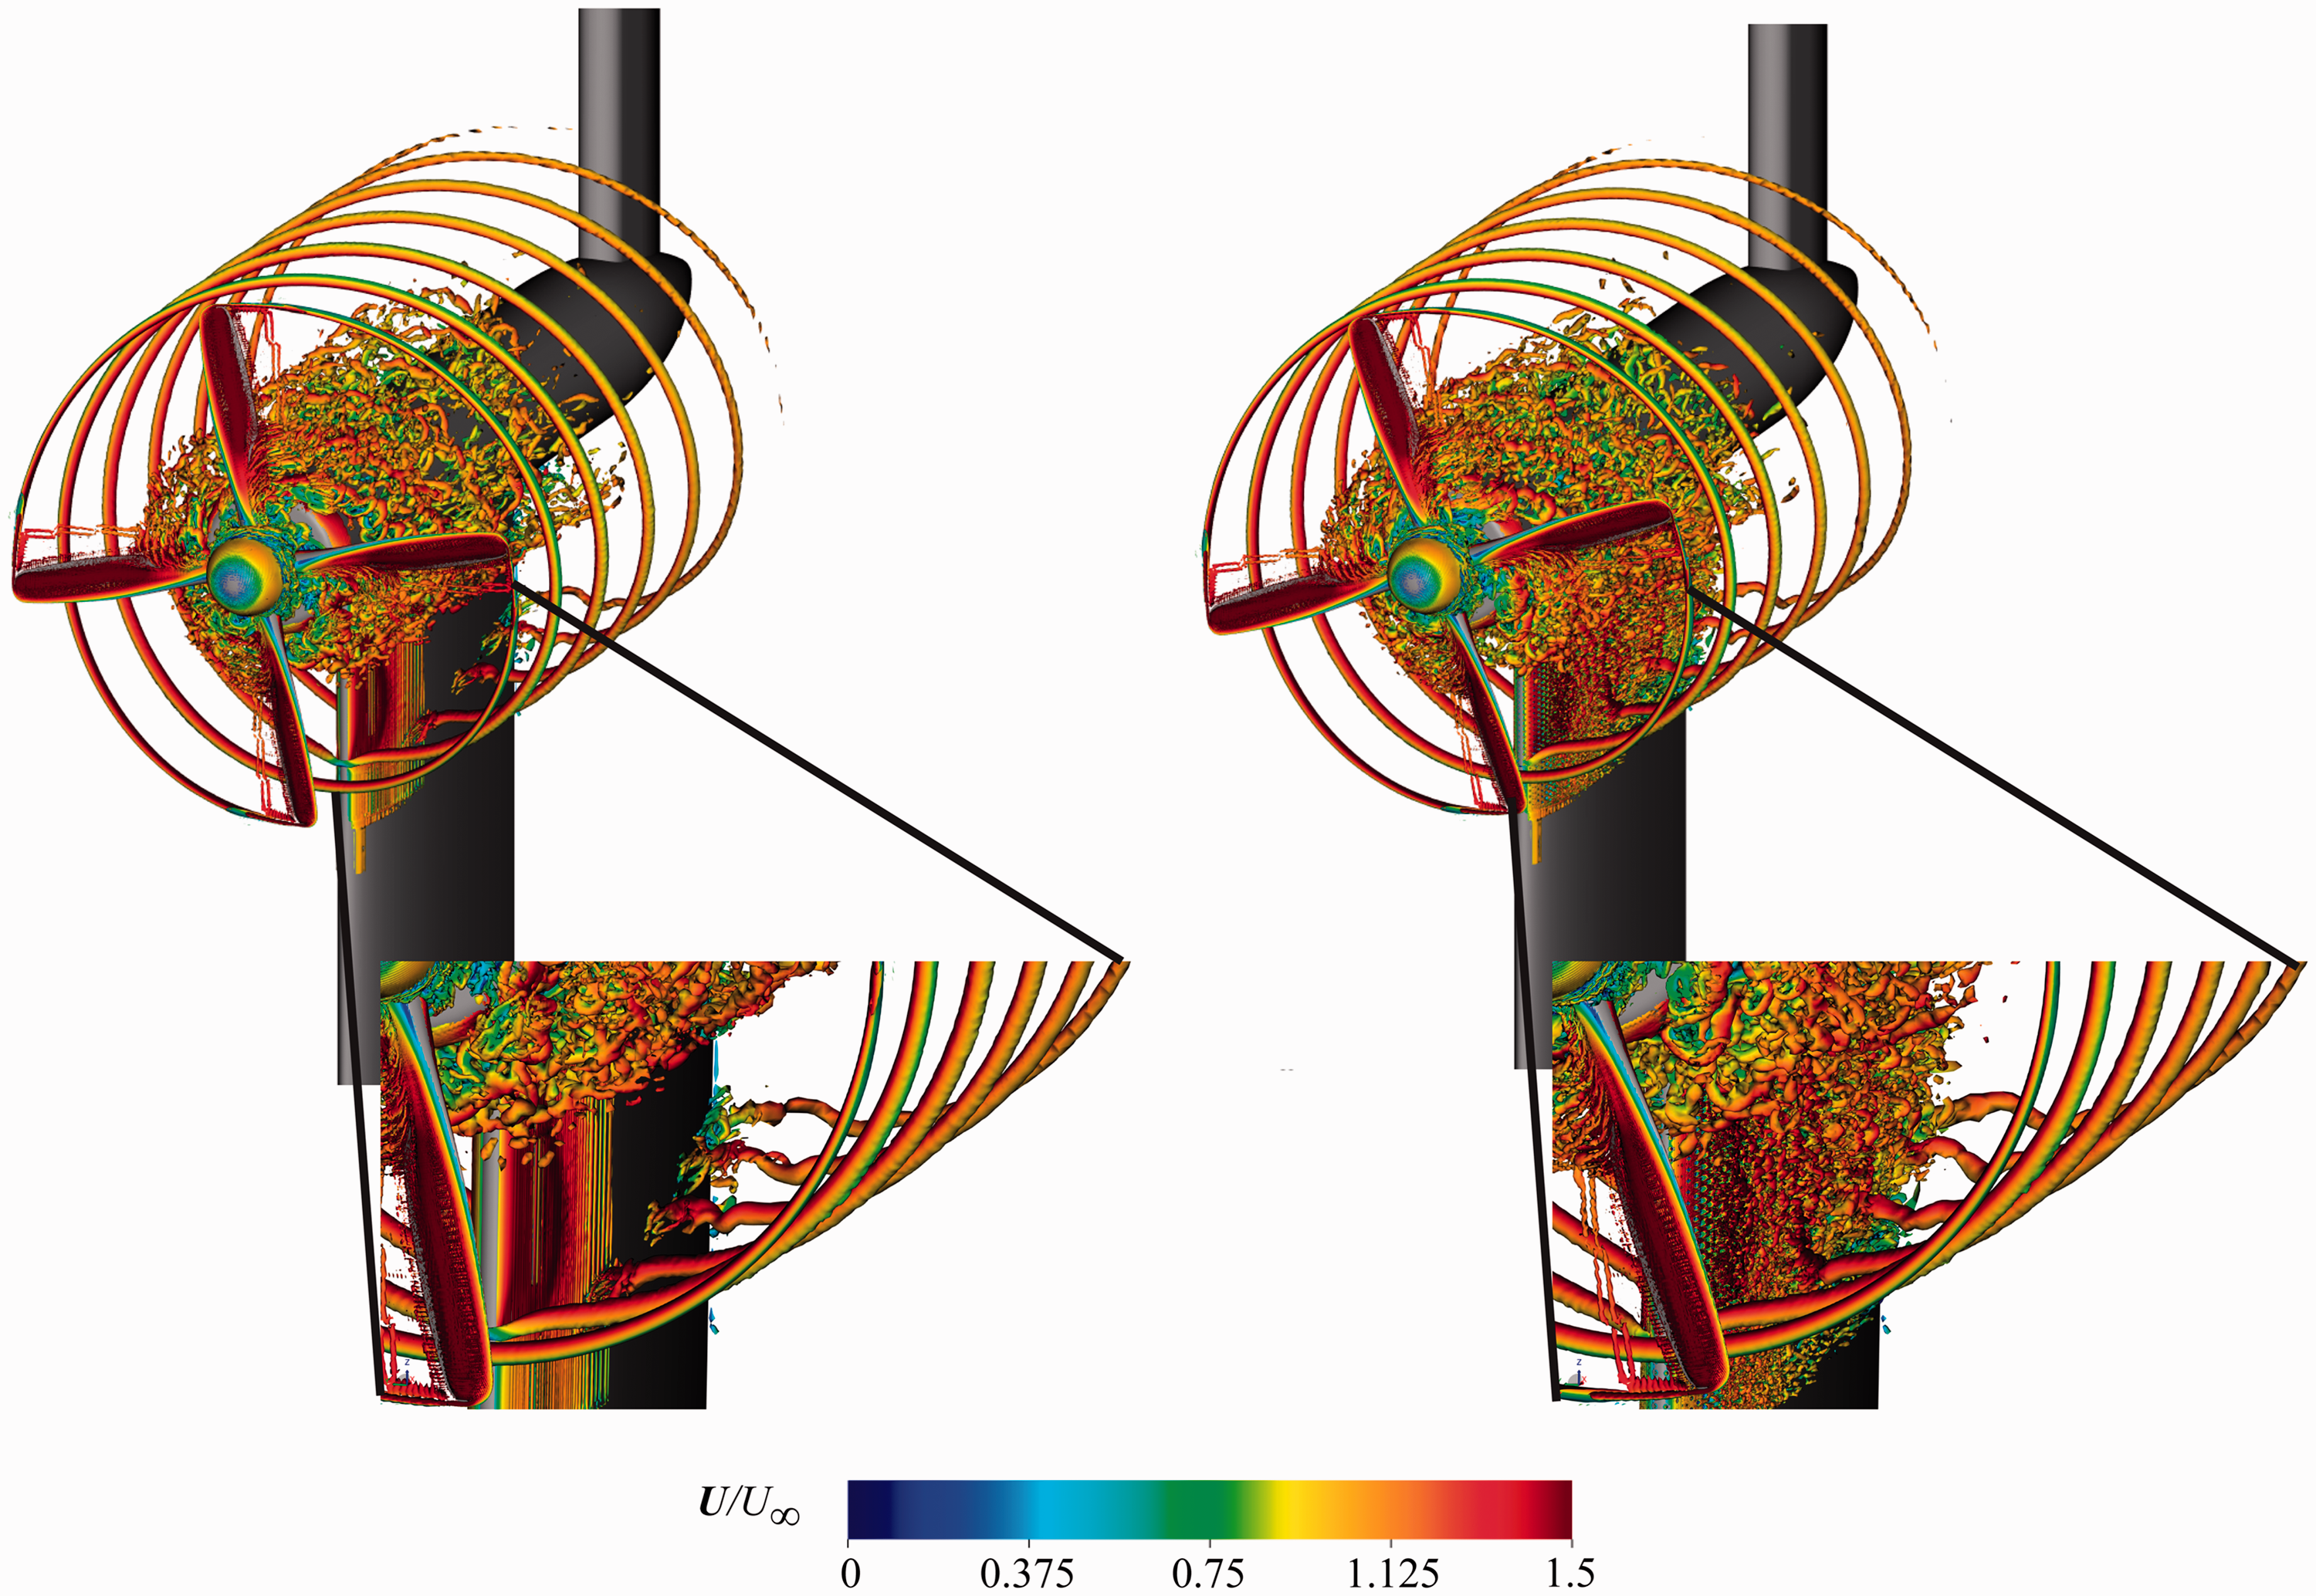
Instantaneous flow field for the solid (left) and flow-permeable (right) leading-edge configurations. Iso-surface of the λ2-criterion for vortex identification (λ2=−2.5 × 10⁶ s−1) colour-contoured with the dimensionless velocity magnitude
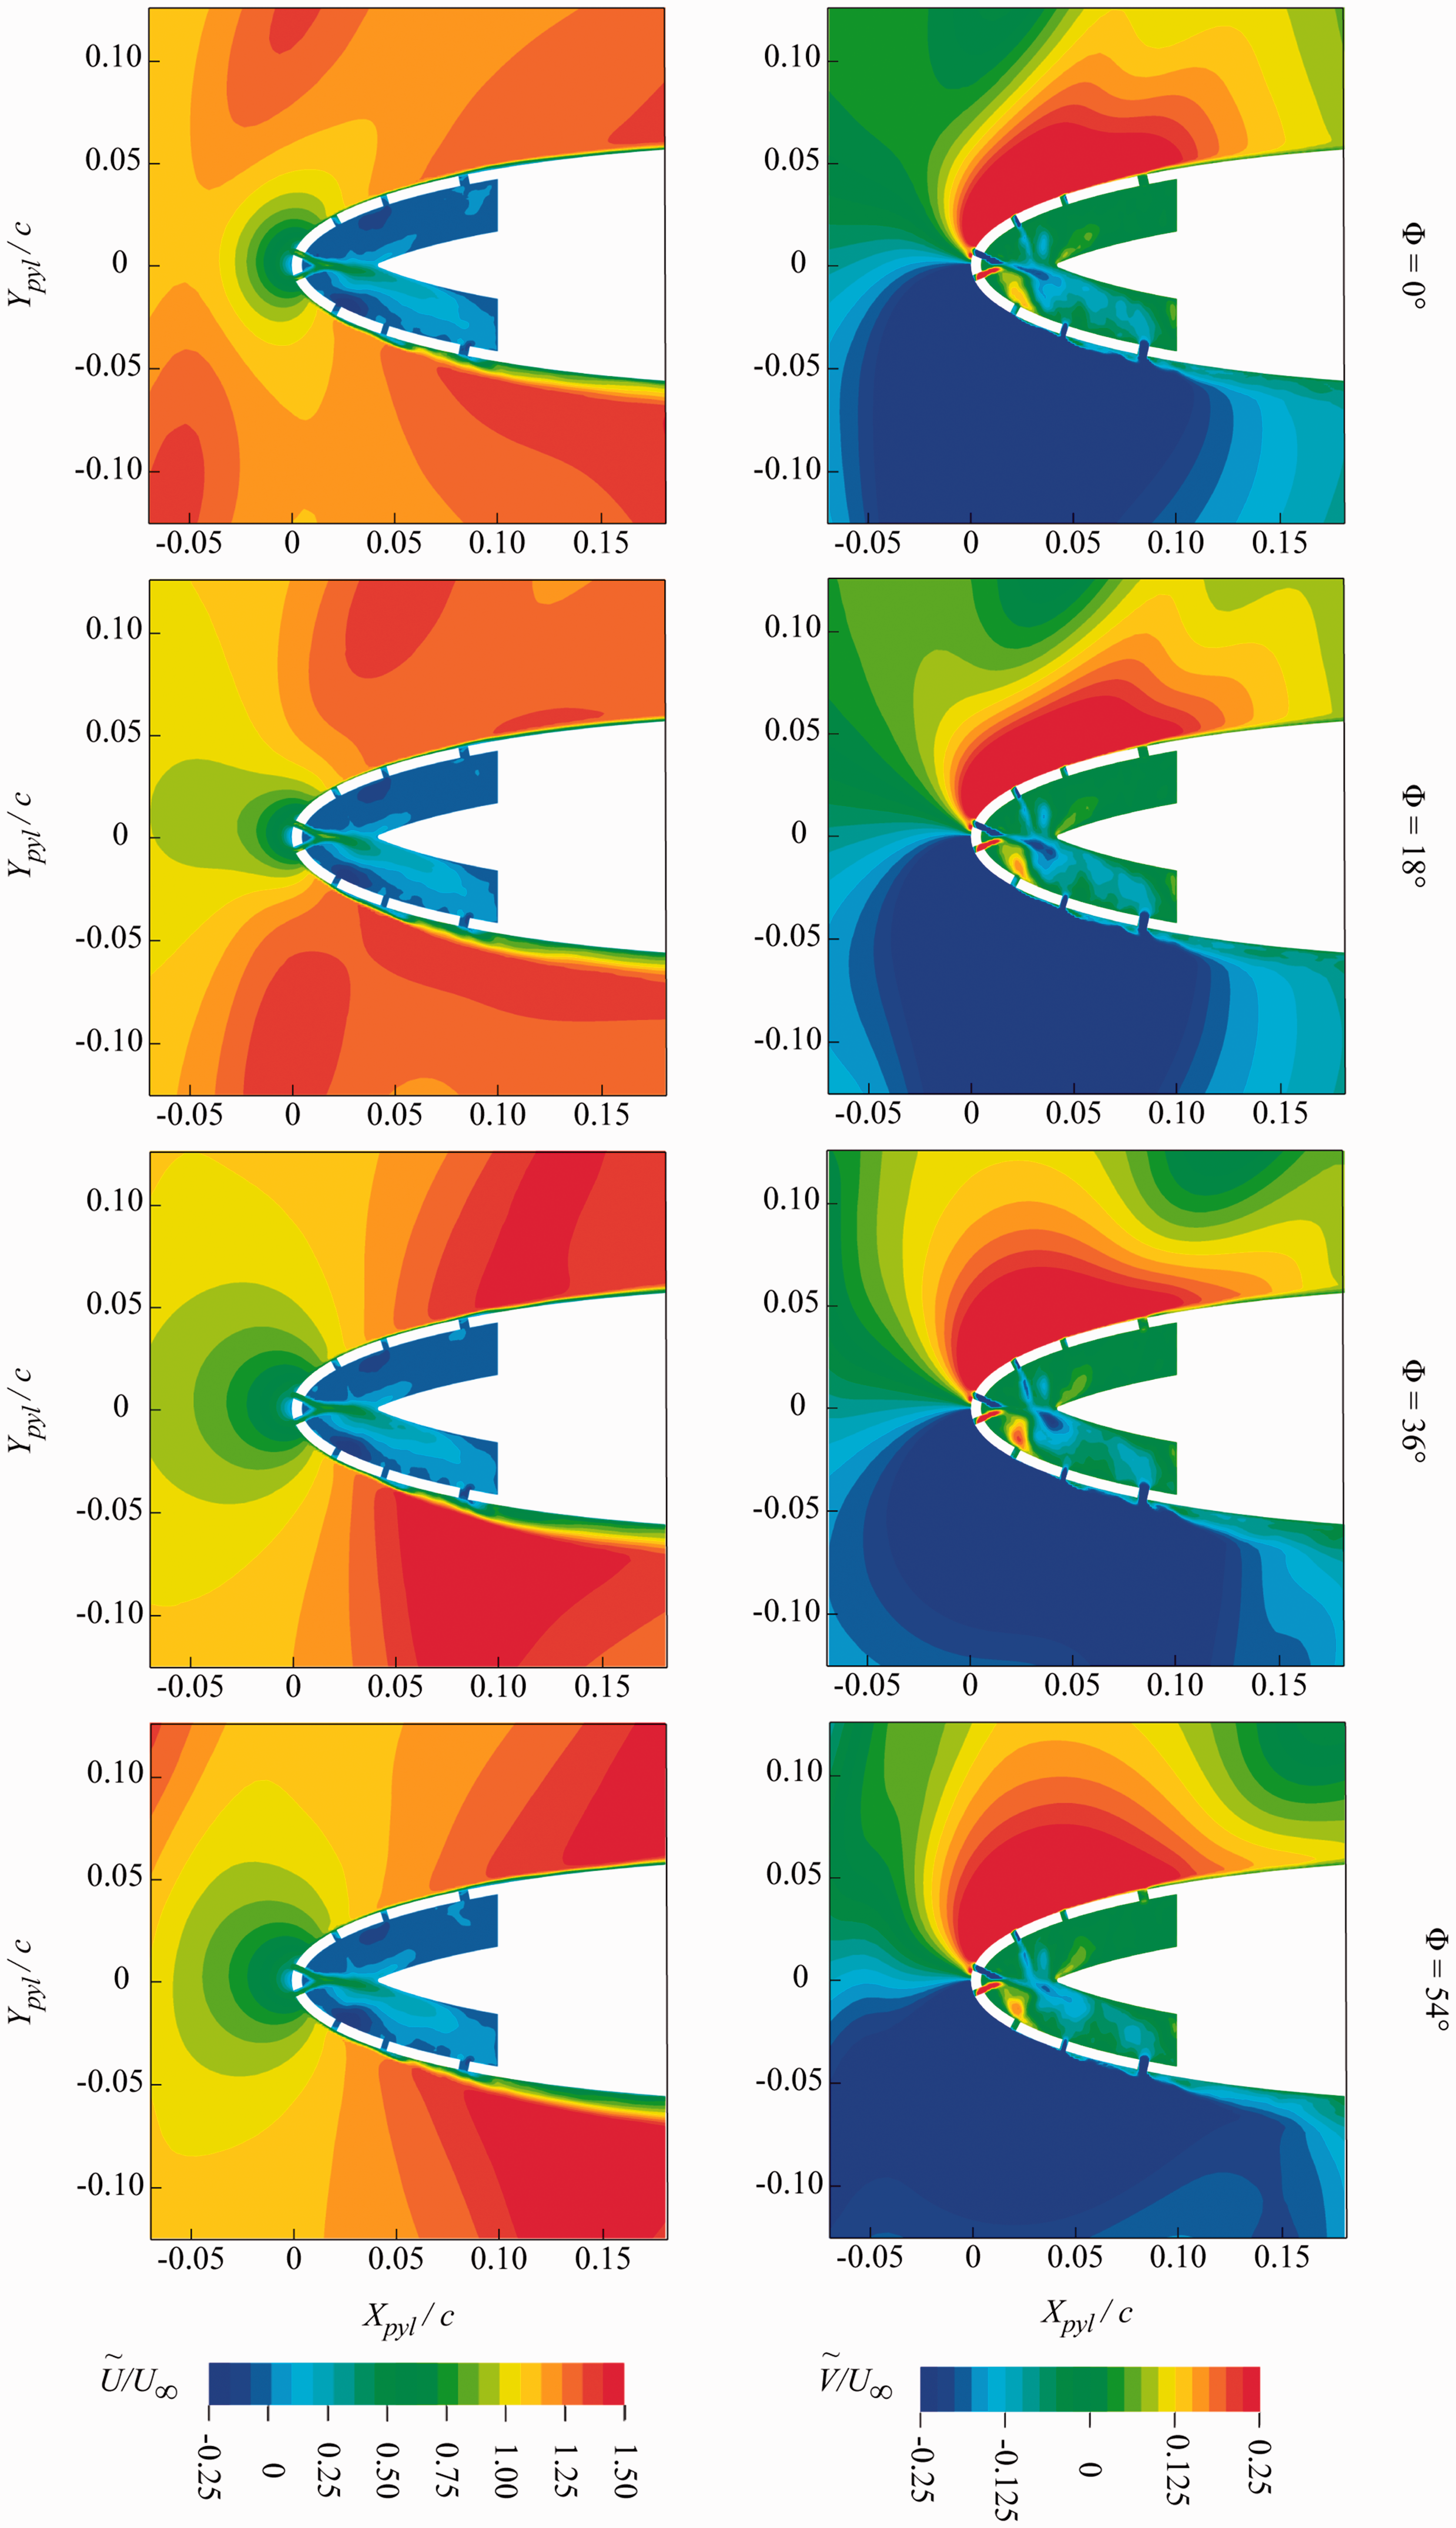
Due to the periodicity of the phenomenon, the flow around the pylon is further investigated by means of phase-averaged data in X–Y planes at
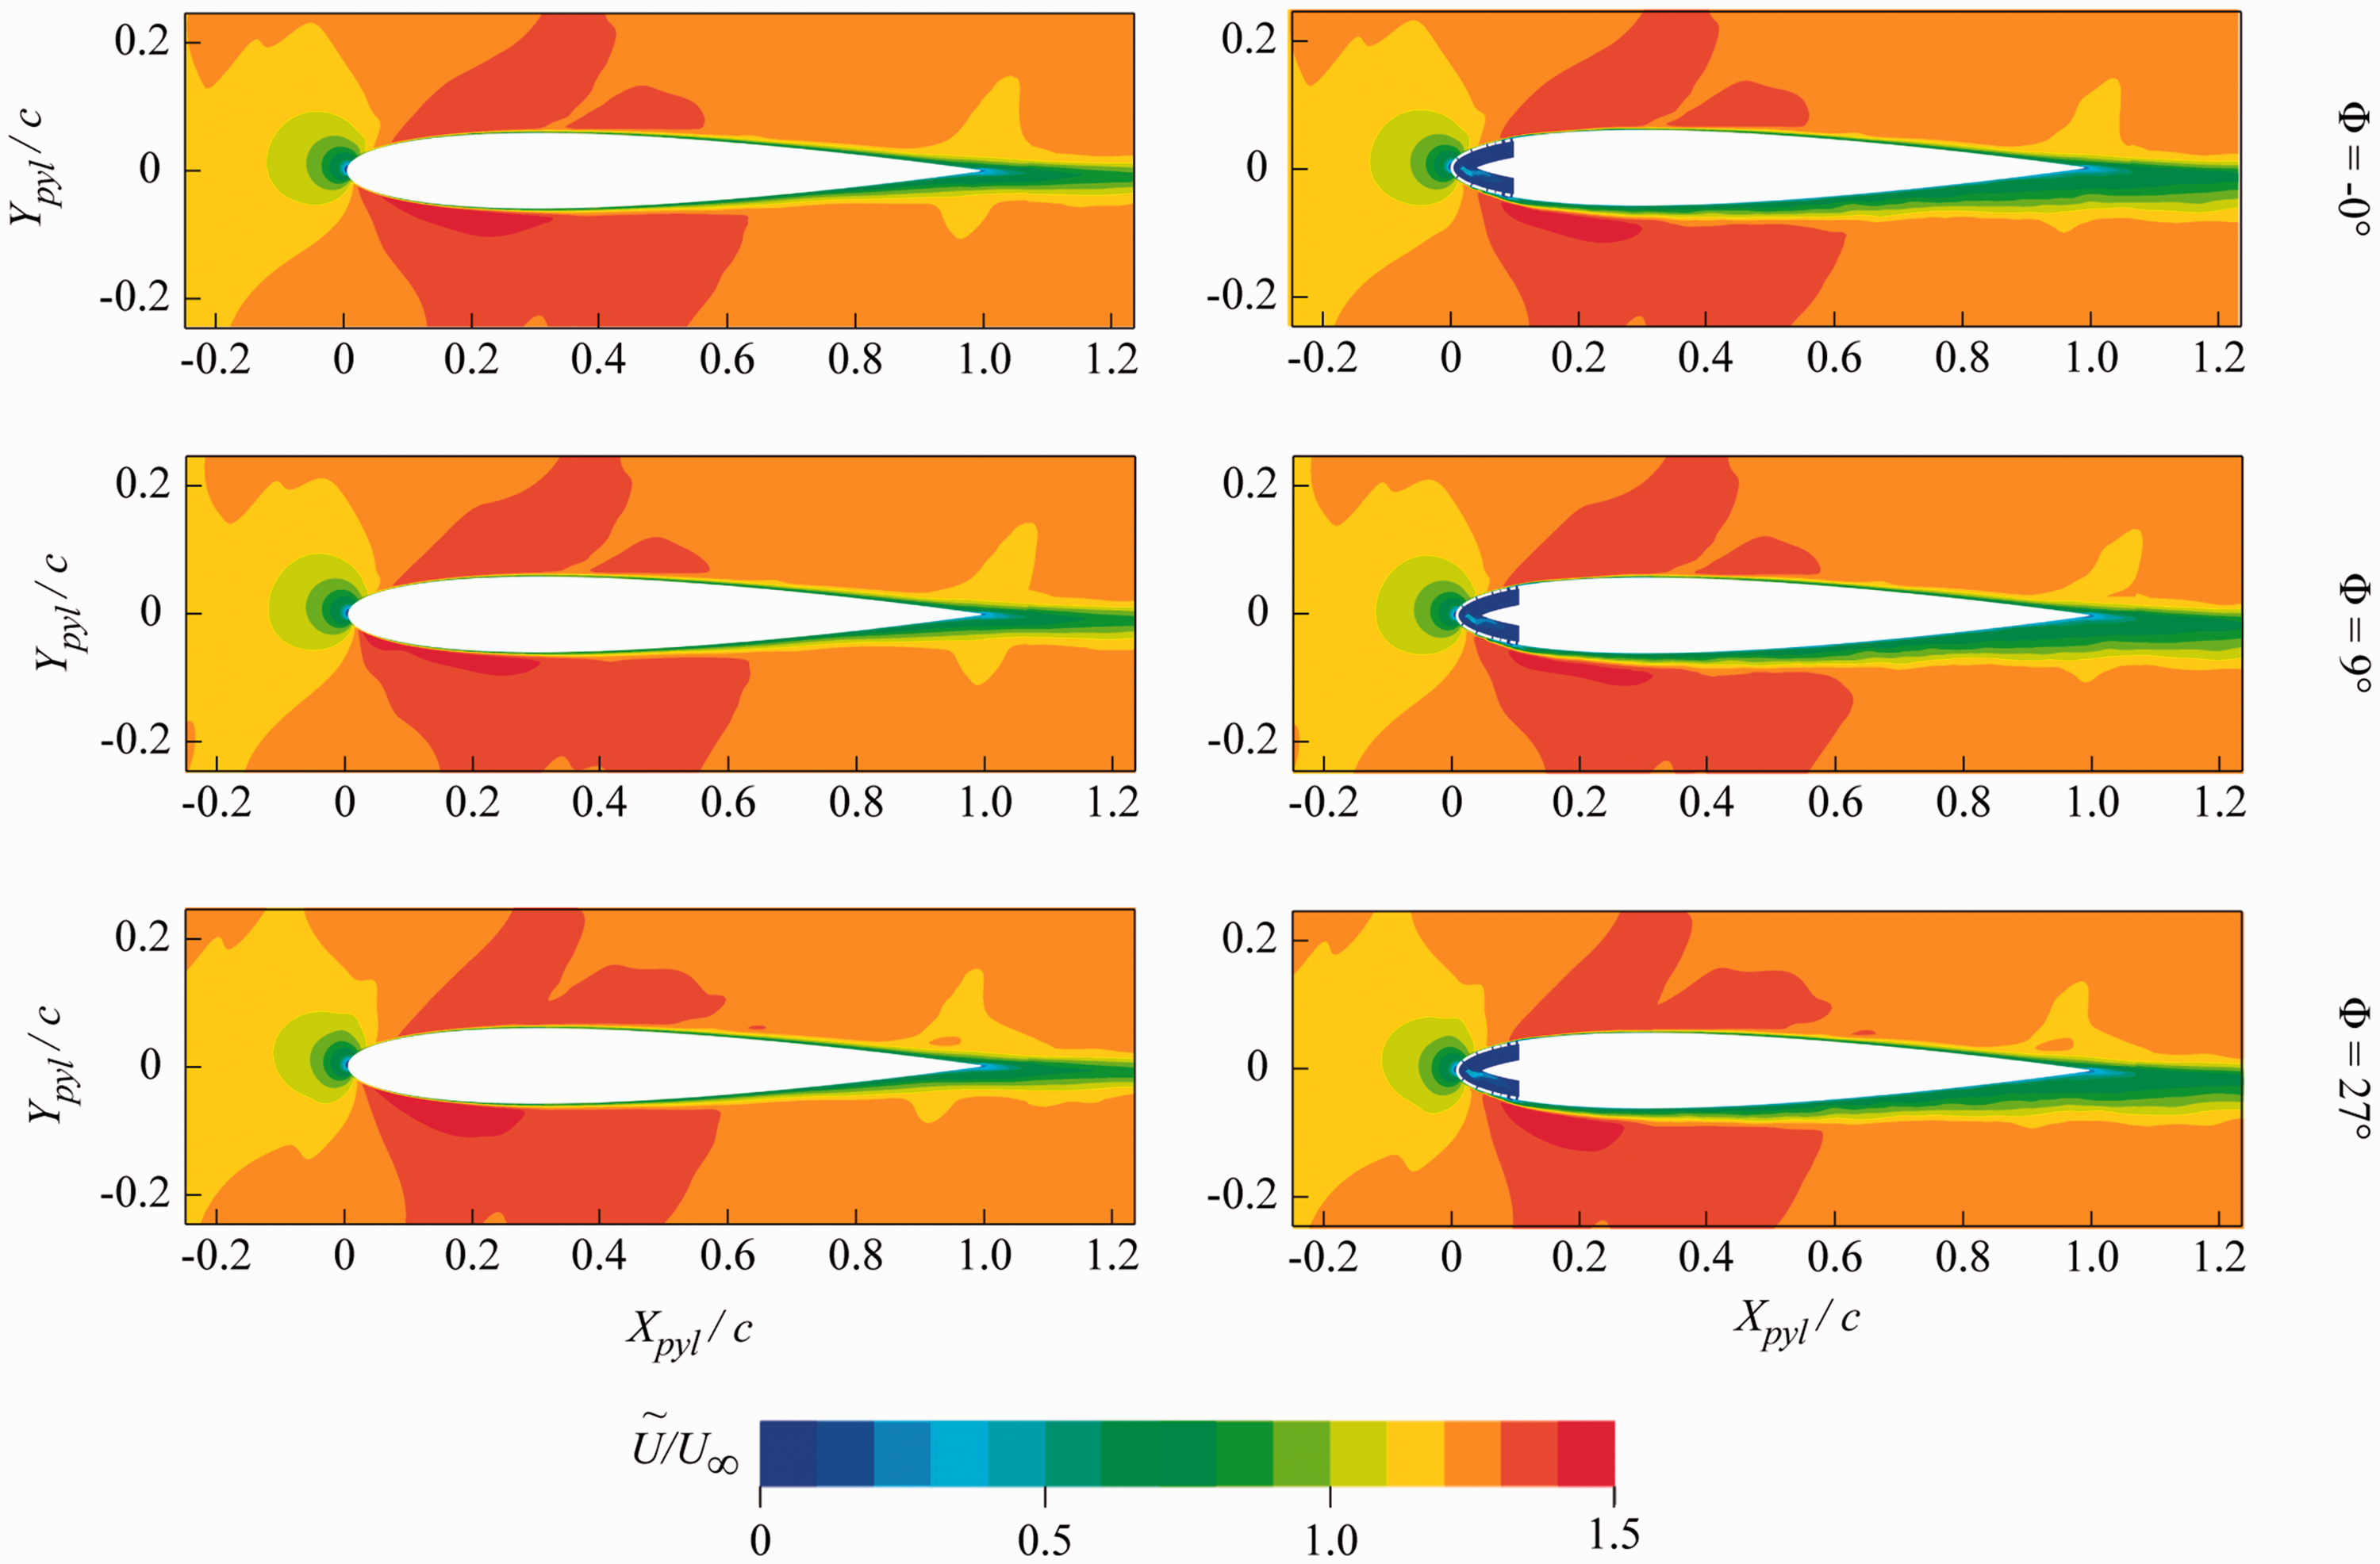
Phase-averaged flow field in the X–Y plane at
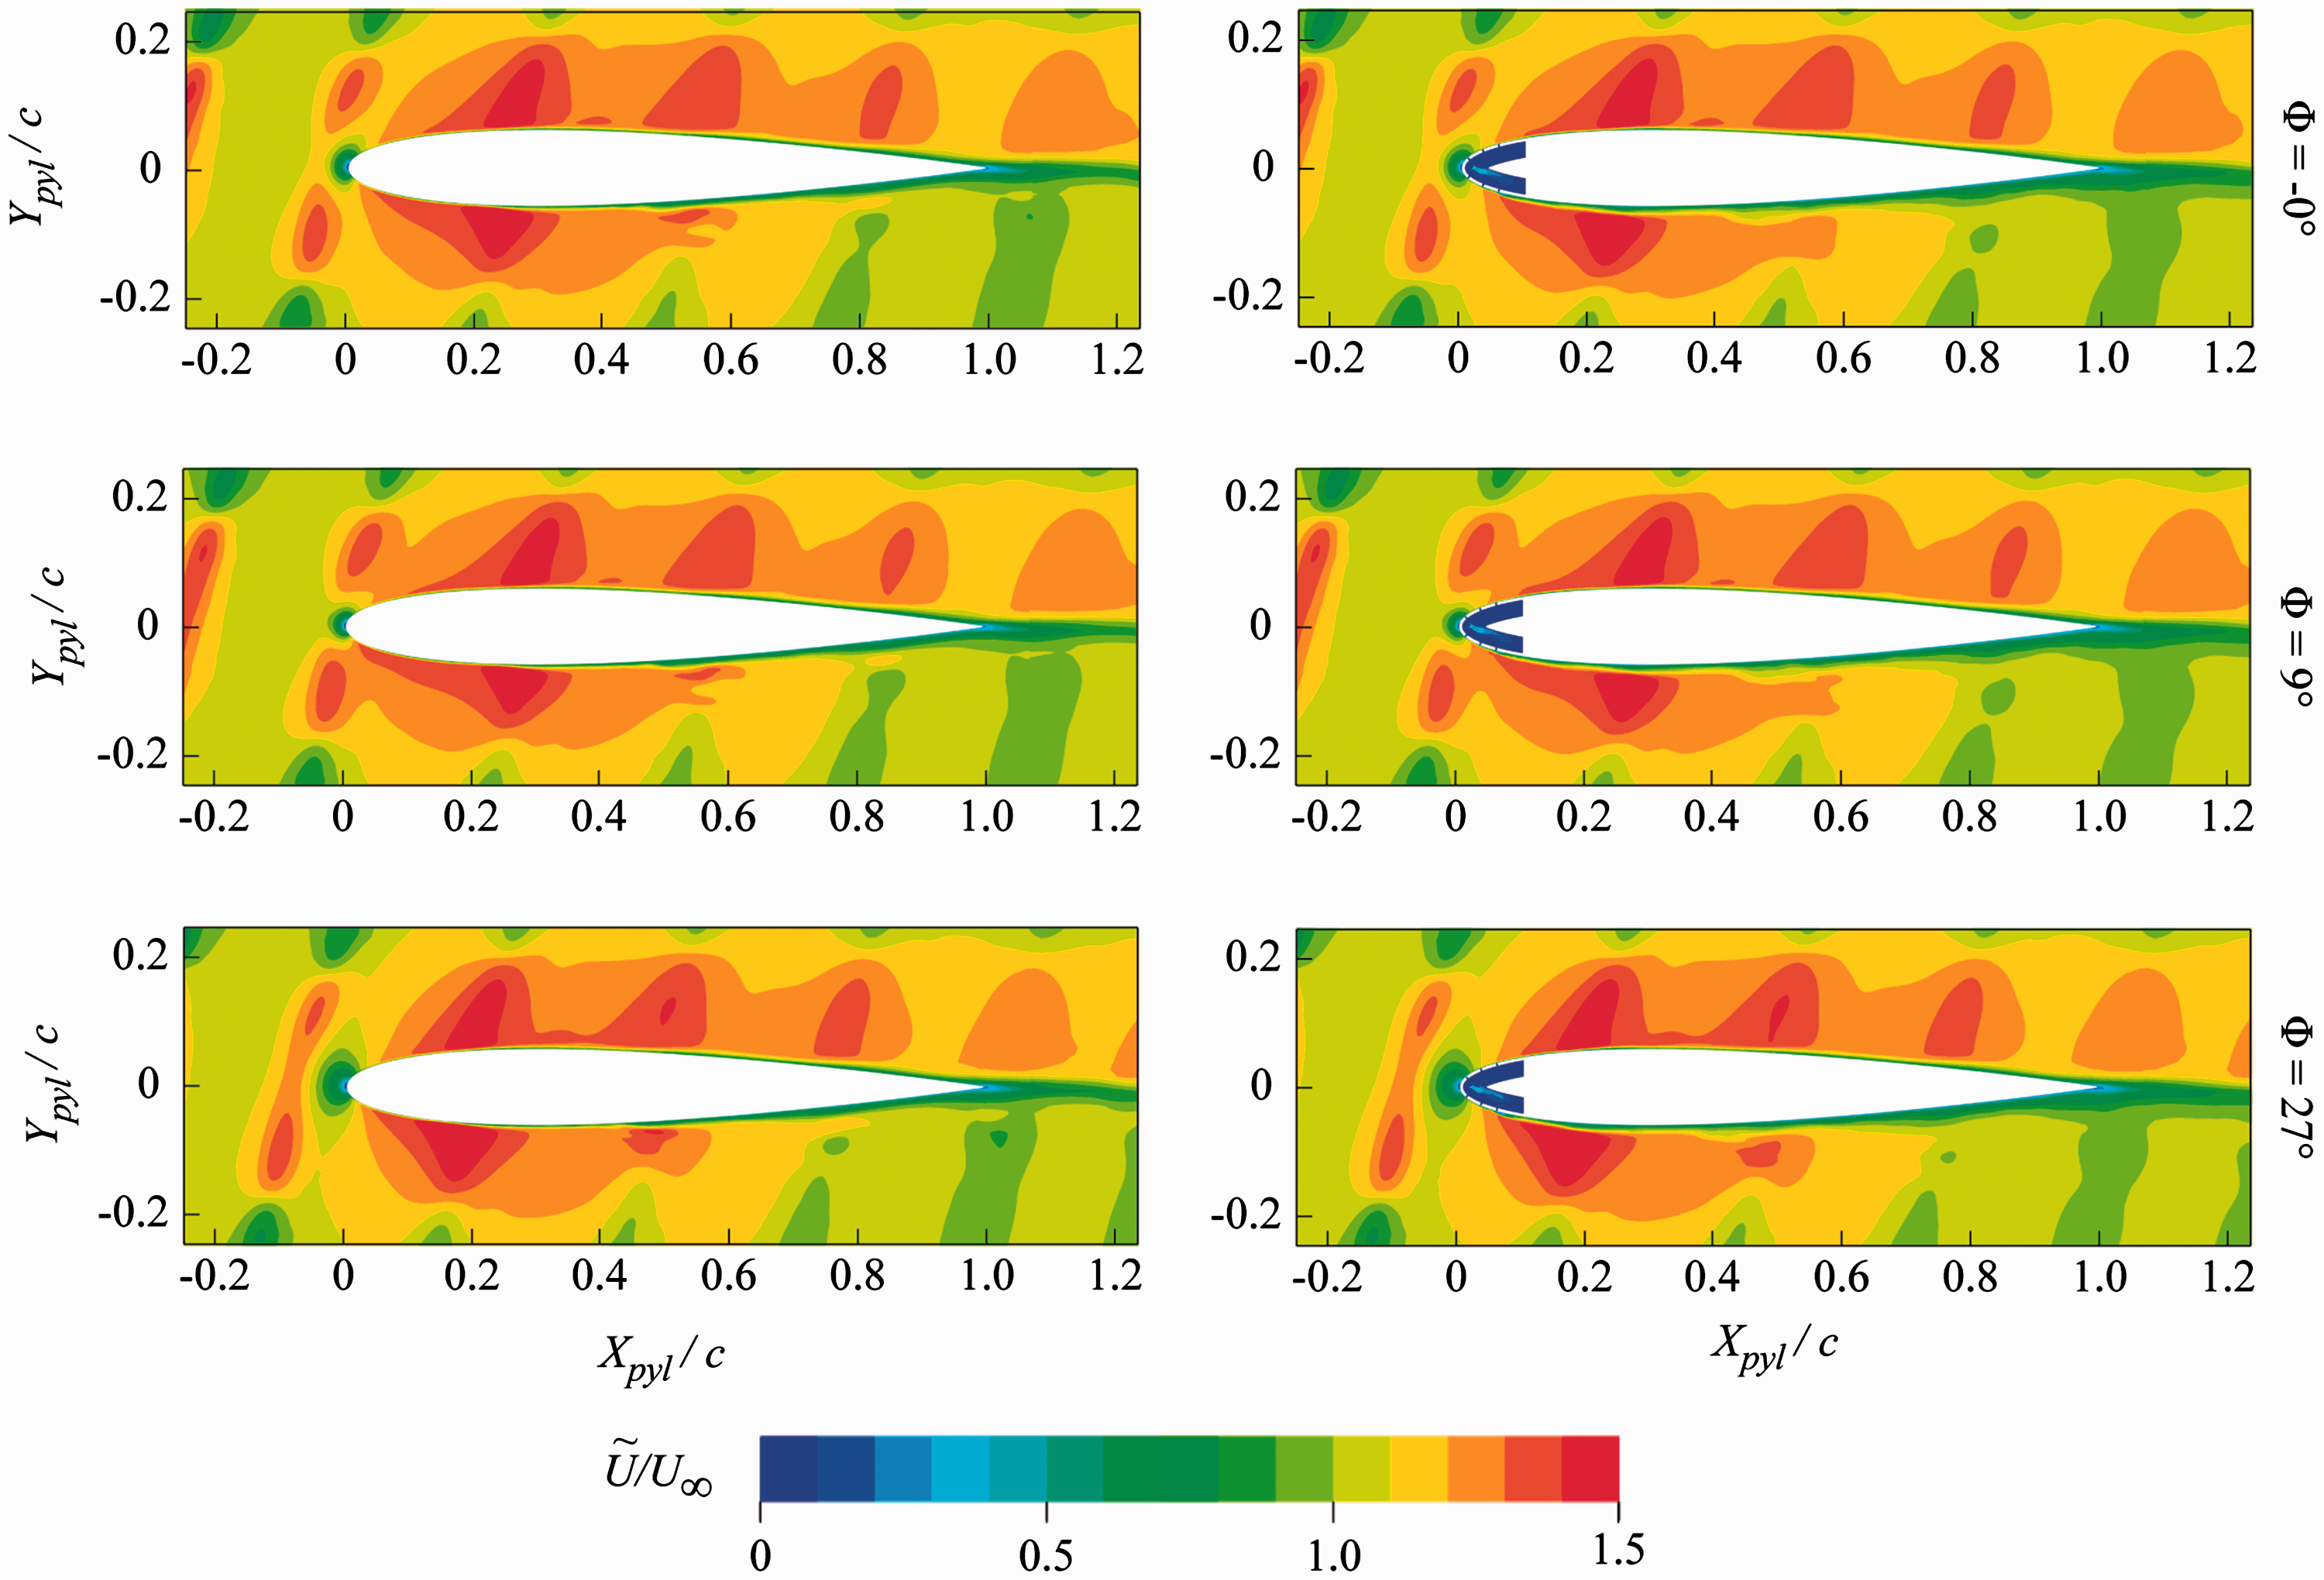
Phase-averaged flow field in the X–Y plane at
In the wake-impingement region (Figure 12), no relevant difference is visible between the three phases. Conversely, the slice extracted at
Comparing the solid with the flow-permeable leading-edge, it is evident that, for both the planes and independently on the phase angle, the flow field far from the pylon surface is weakly affected by the leading edge geometry. In particular, the spatial organization and the velocity of the tip vortices are similar. Conversely, the flow near the surface shows a thicker boundary layer over the retreating side of the pylon, while almost no difference is visible on the advancing side. This is quantified in Figure 14, where the dimensionless time-averaged axial velocity profile
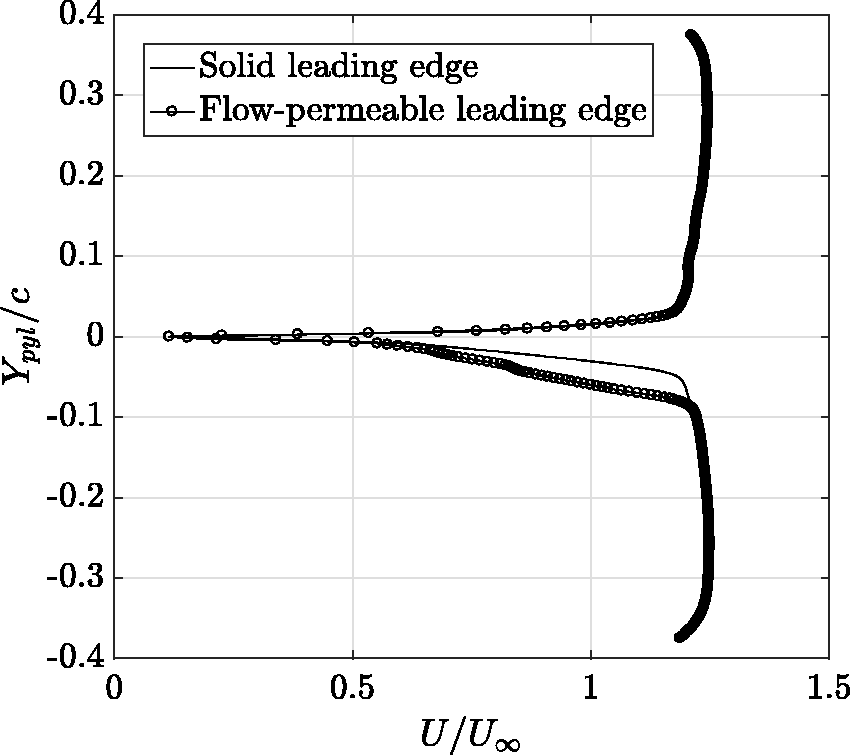
Near-wake time-averaged axial velocity at
As a main consequence of the cross-flow and of the induced turbulent boundary layer on the retreating blade side, the surface pressure fluctuations are different between the solid and the flow-permeable leading-edge configurations. This is shown in Figures 15 and 16 for the advancing and retreating blade sides, respectively. In the figure, the instantaneous fluctuating pressure coefficient (i.e. the instantaneous pressure coefficient to which the mean pressure coefficient is subtracted)
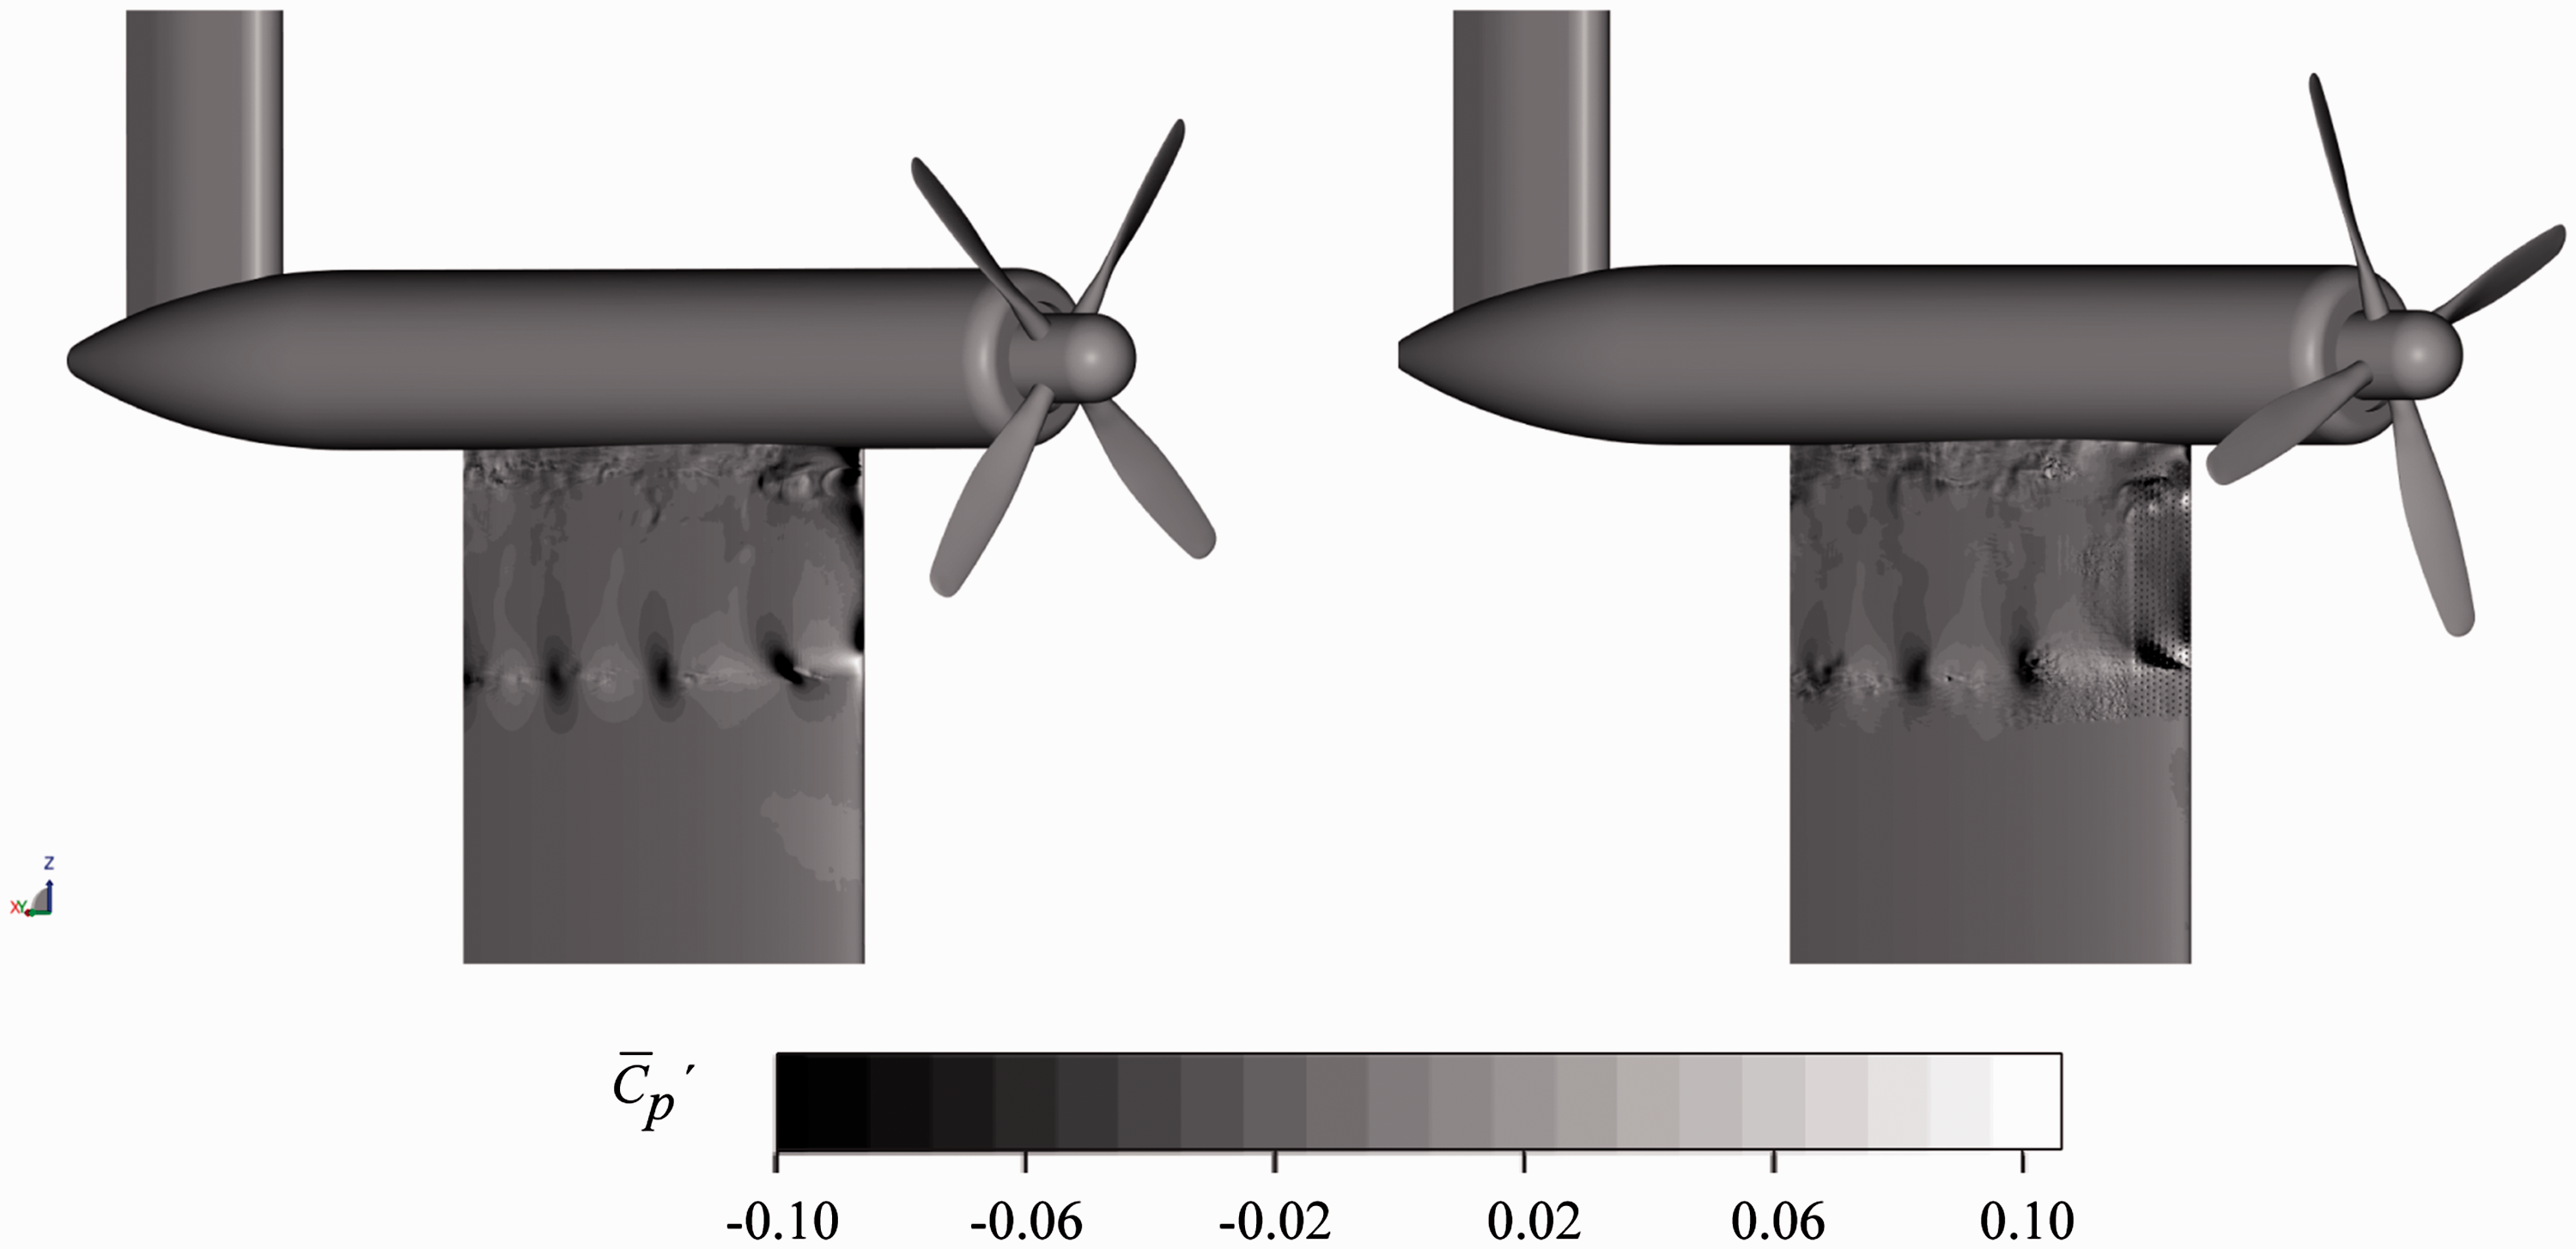
Instantaneous fluctuating pressure coefficient
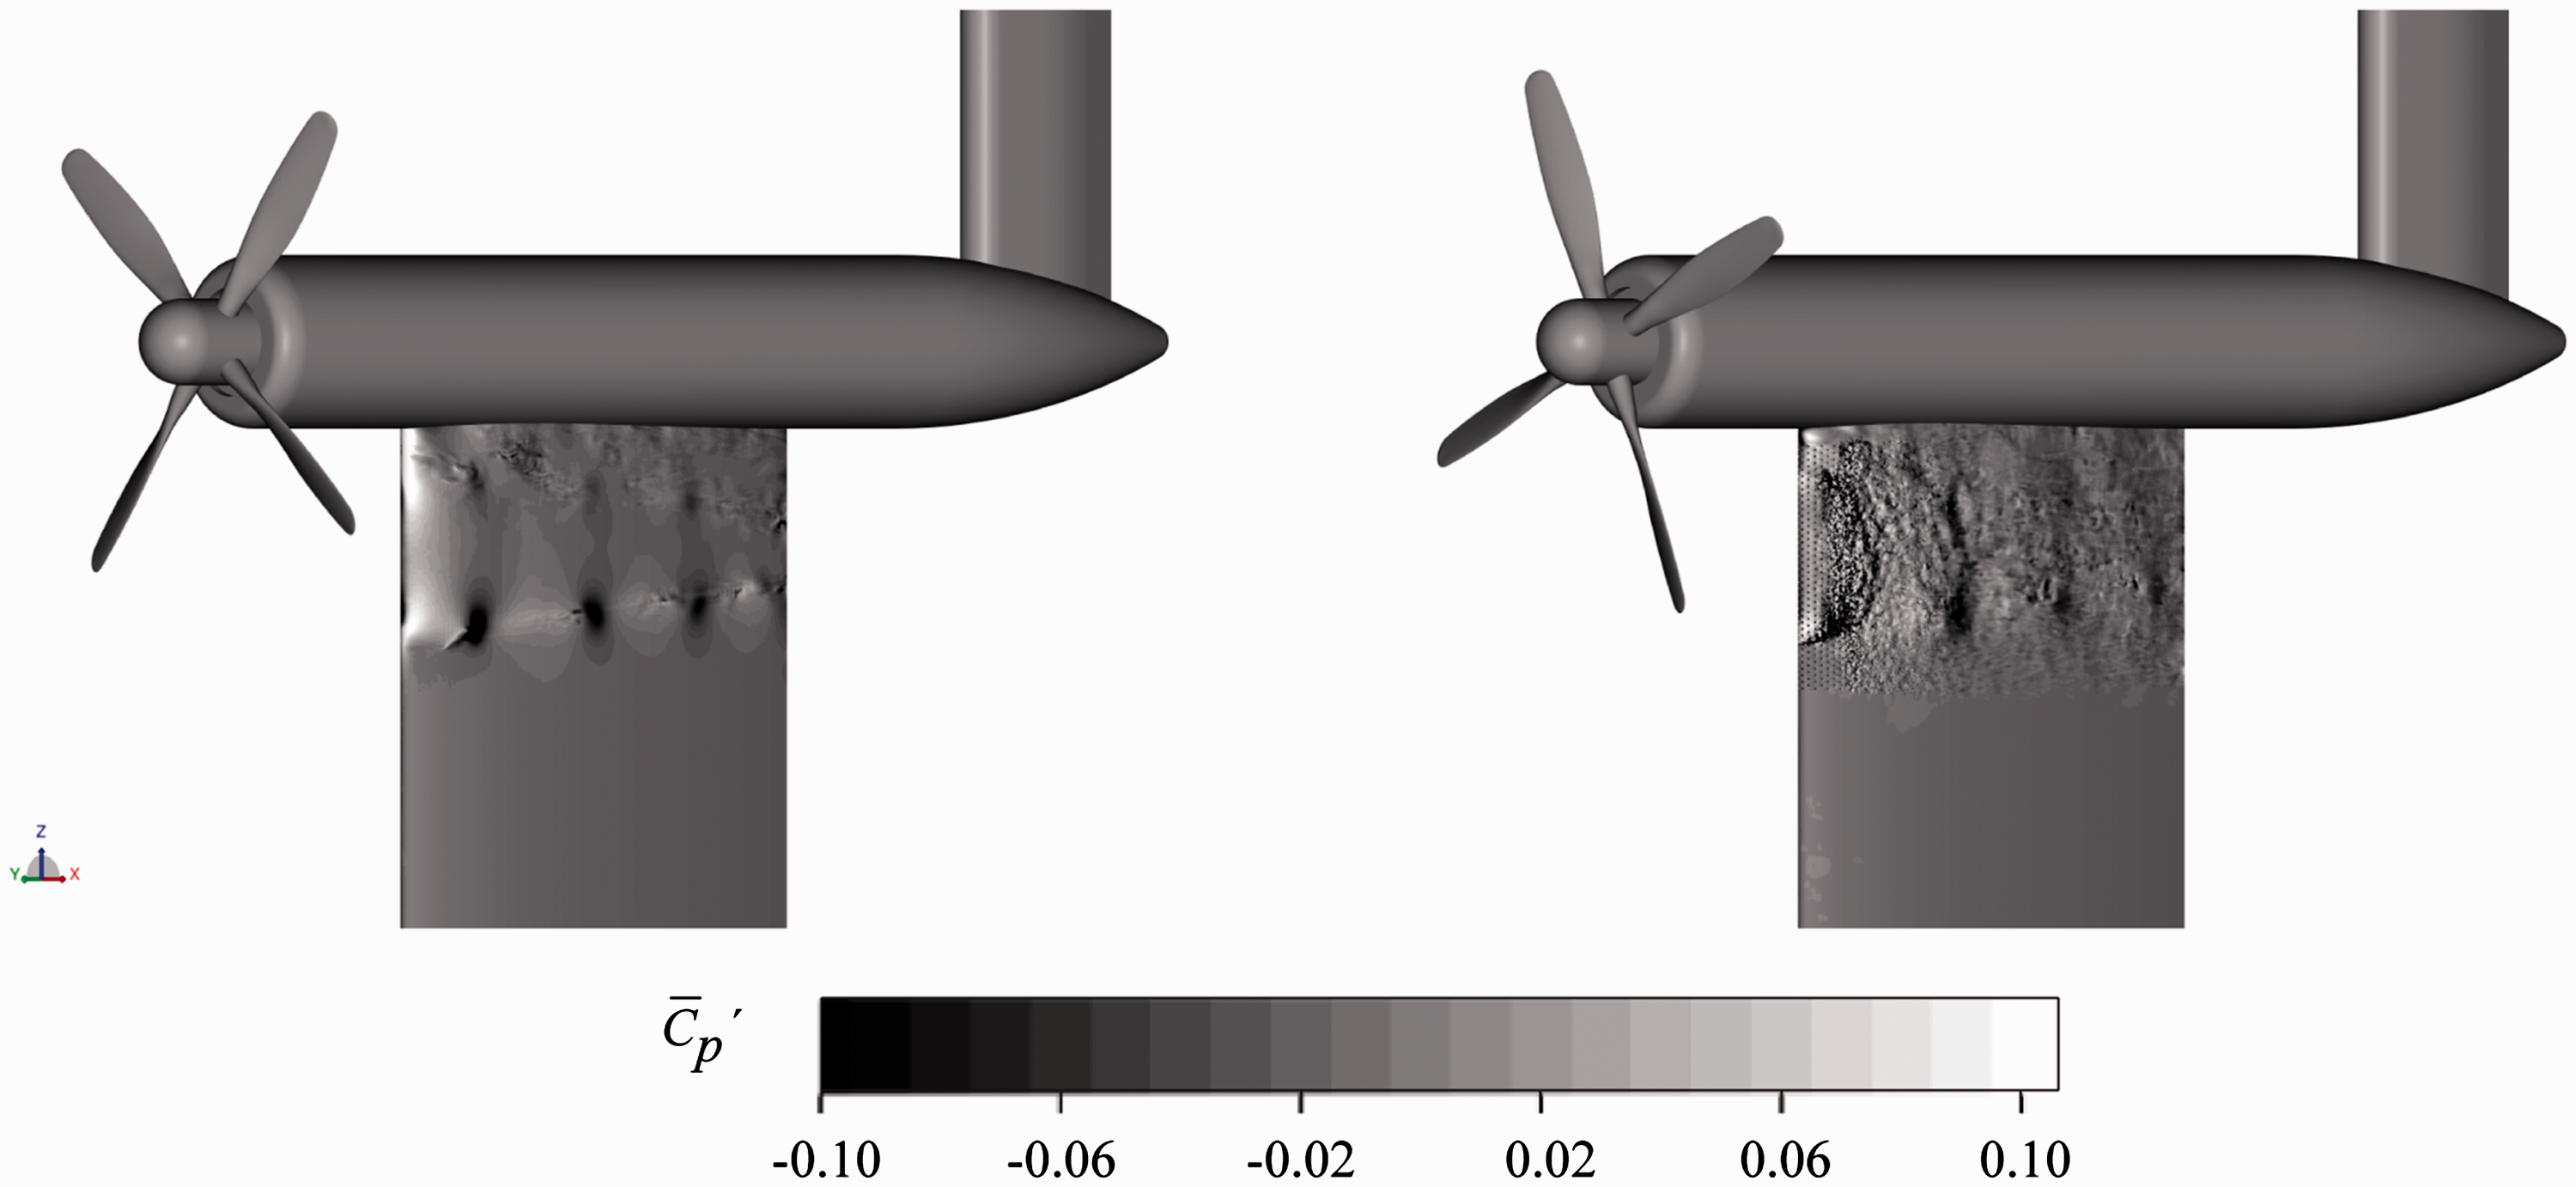
Instantaneous fluctuating pressure coefficient
Near- and in-cavity flow organization
The previous section has shown that the main effect of the flow-permeable leading-edge insert is to generate a thicker boundary layer on the retreating blade side because of the cross-flow though the cavity. In this section, the flow within the cavity is described in detail.
The comparison between the two leading-edge inserts is shown by plotting the dimensionless time-averaged velocity components
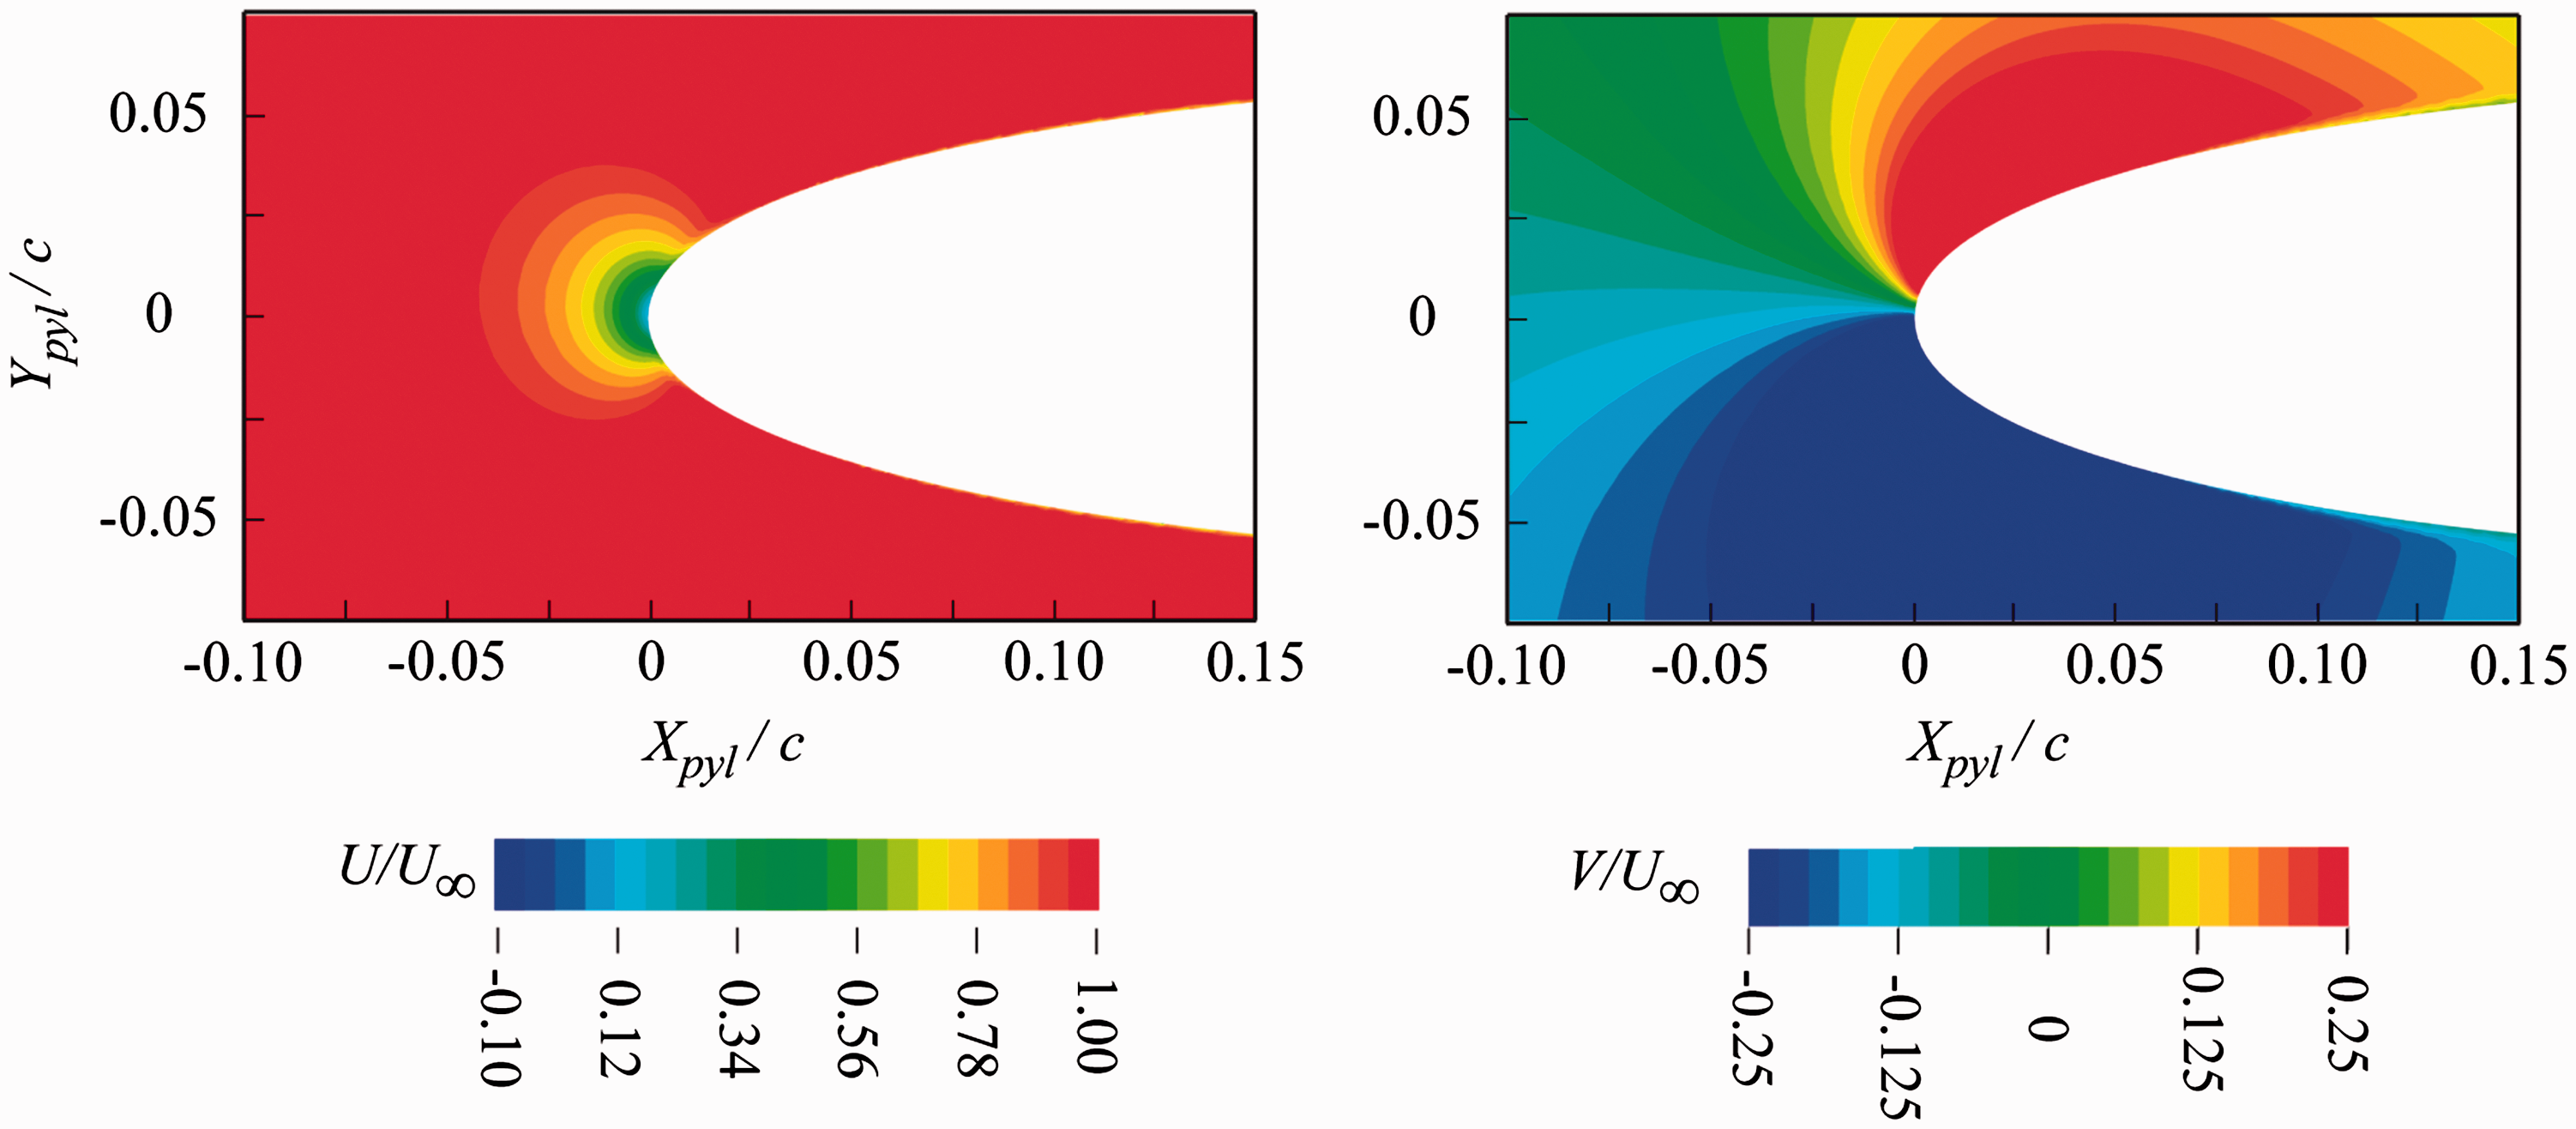
Zoomed view around the leading edge of the time-averaged flow field in the X–Y plane at
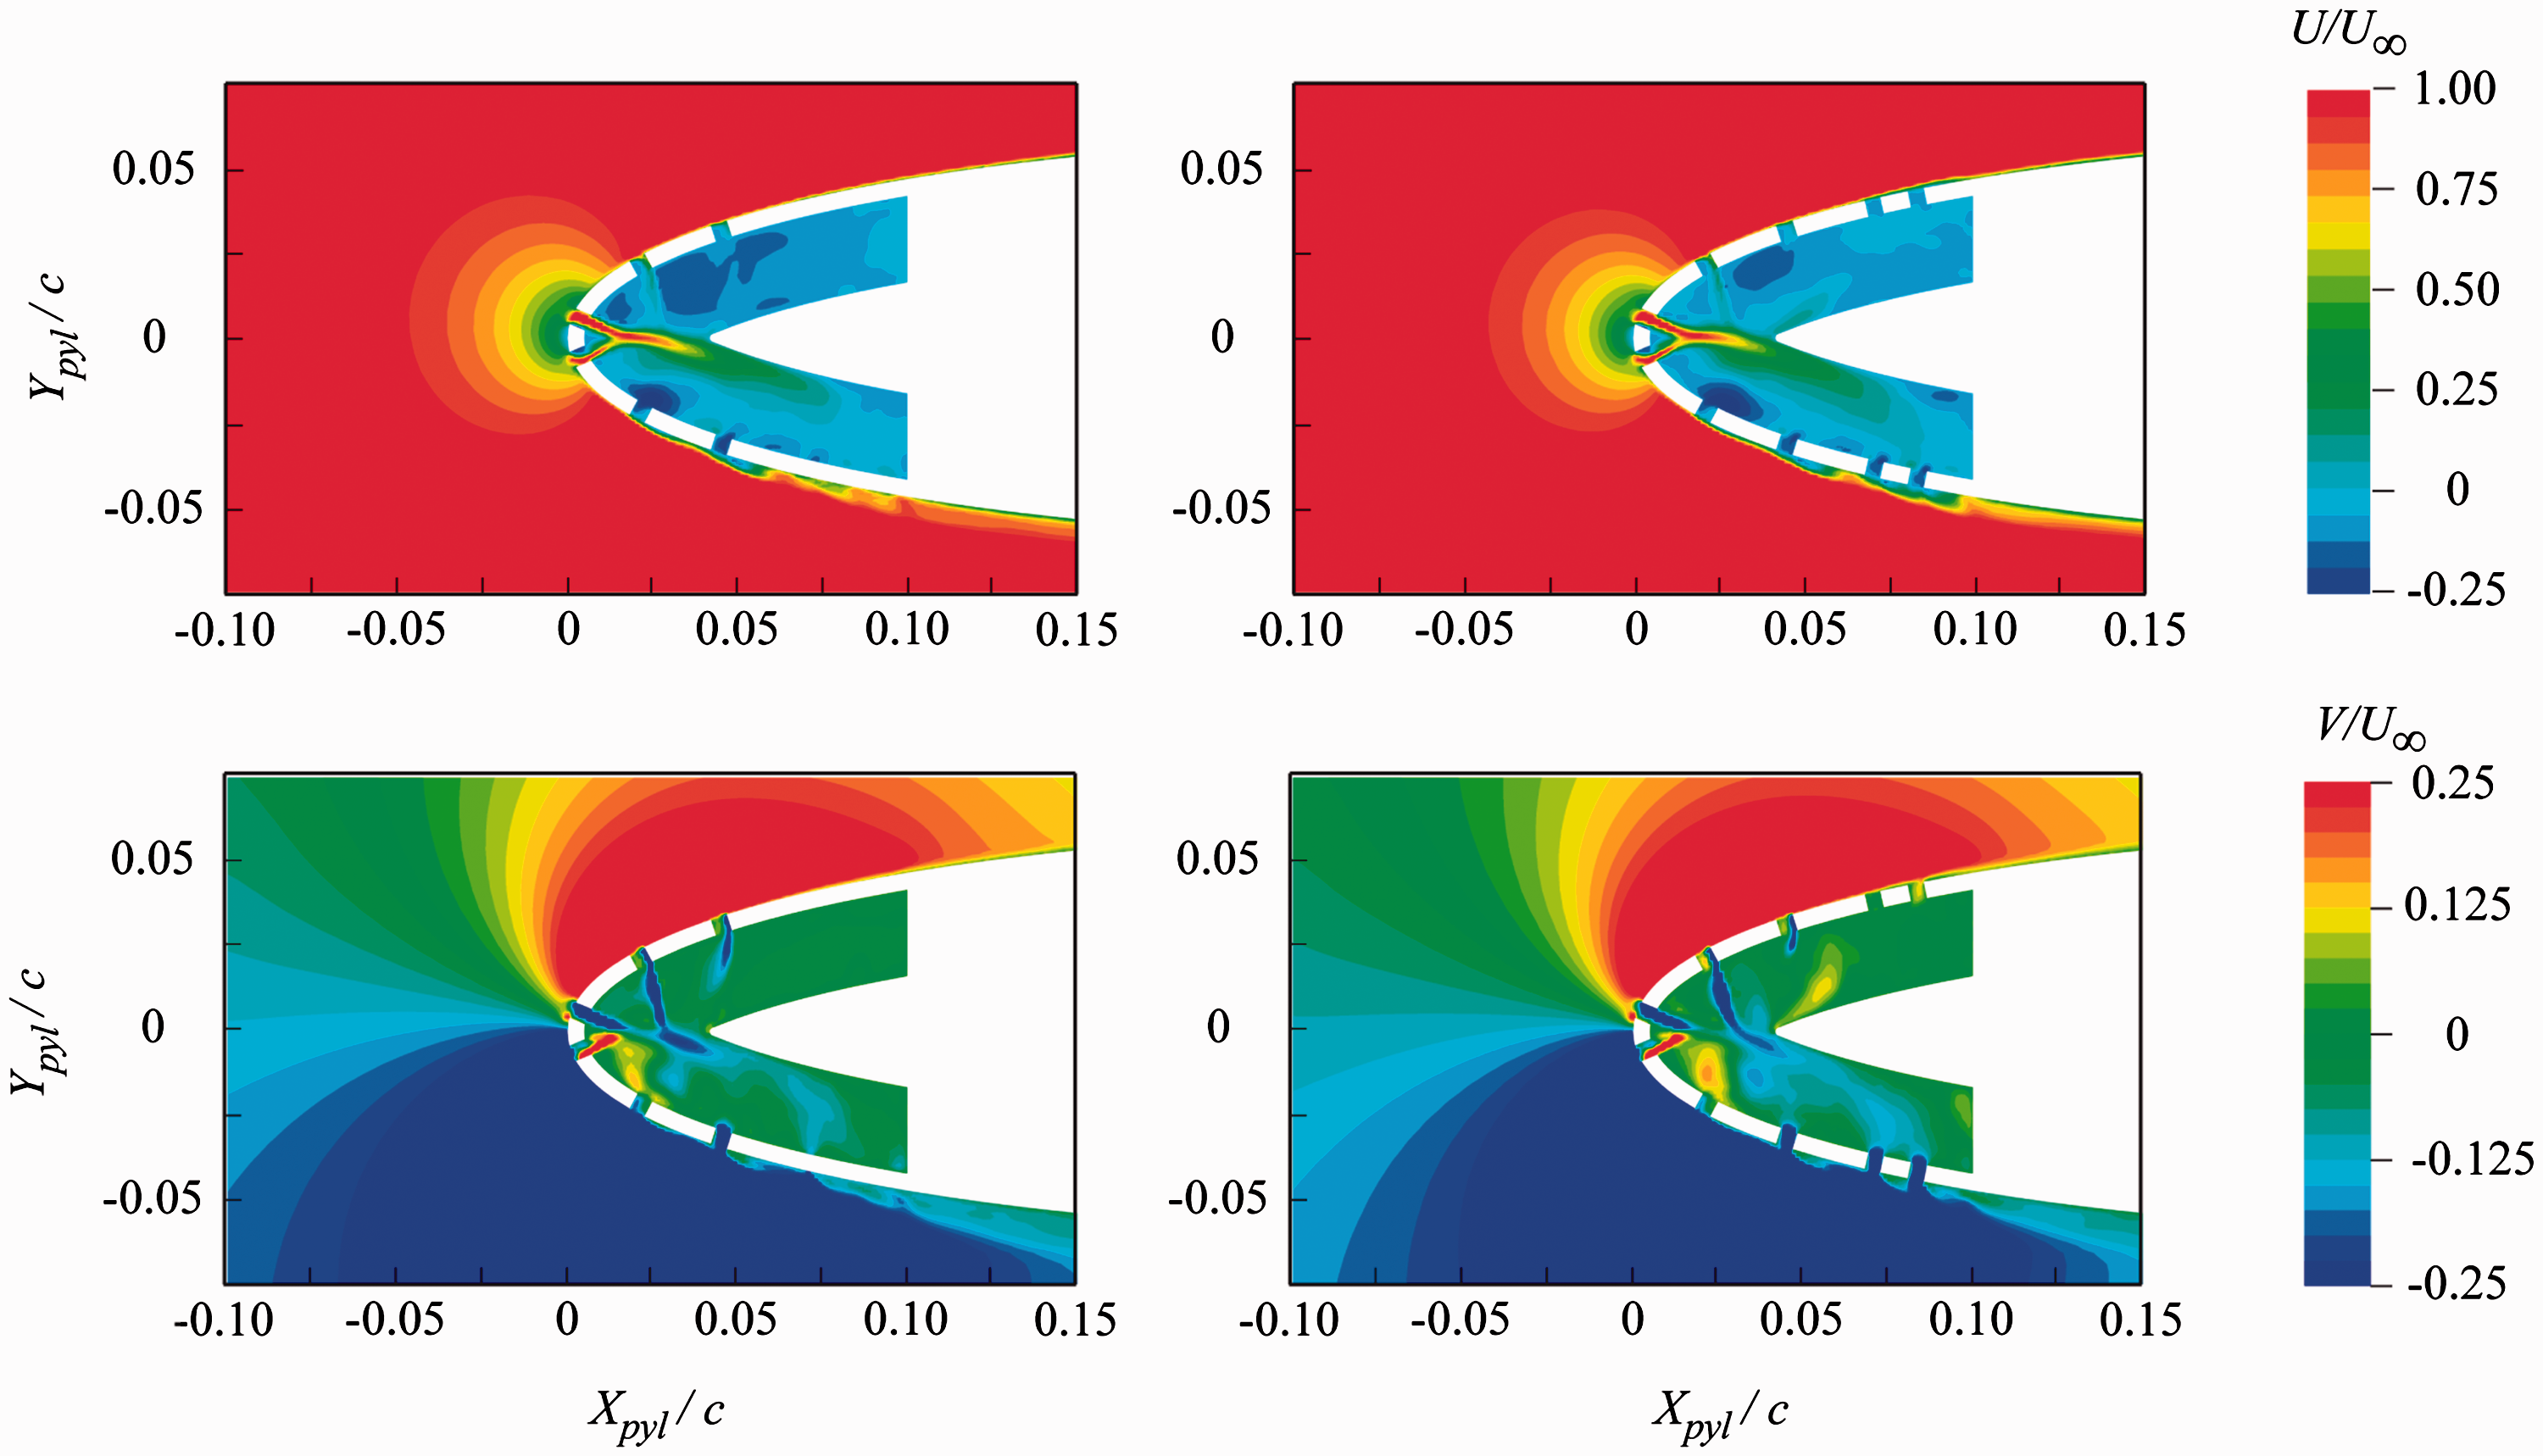
Zoomed view around the leading edge of the time-averaged flow field in the X–Y plane at
Figure 17 shows that the stagnation point slightly moves toward the advancing blade side and that the vertical velocity is not symmetric between the two sides of the pylon. The negative vertical velocity region extends upstream more than the positive one, because of the vortex deformation discussed above (Figures 7 and 11). Similar features are visible for the flow-permeable leading-edge insert as shown in Figure 18. In addition, the flow penetrates within the cavity with larger axial velocity through the pores located closer to the stagnation point. Because of the aerodynamic asymmetry of the flow around the pylon, the flow within the cavity goes from the advancing to the retreating side. The relative high-speed region extends towards more downstream locations at
In order to get further insights into the effect of the periodic impingement on the cavity flow, phase-averaged data at
Zoomed view around the leading edge of the phase-averaged flow field at
The figure shows that, as expected, the flow continuously enters the cavity. When the vortex approaches the leading edge, the flow is pushed towards the pylon and as soon the vortex passes the leading edge, a stronger recirculation starts within the cavity, that reaches its peak when the vortex has passed the entire flow-permeable region. As a consequence, at the retreating side, the boundary layer shows a periodic growth with maximum when the vortex has fully passed the flow permeable insert.
Acoustic analysis
The previous section has shown that the most relevant effect of the flow-permeable leading edge is to enhance the aerodynamic asymmetry between the two sides of the pylon and to generate a much thicker turbulent boundary layer on the retreating blade side. The reduction of the amplitude of the surface pressure fluctuations on the retreating blade side towards the pylon trailing edge can be beneficial for mitigating structure-borne noise. However, the installation of the flow-permeable leading edge can affect the near-field noise because of the turbulent flow developing over the pylon. In this section, this aspect is investigated by means of the FWH acoustics analogy (see Noise computations section).
Figure 20 shows the polar plot of the OASPL for the two leading-edge configurations obtained using two radial arches of 40 microphones each located at a distance of 4R and
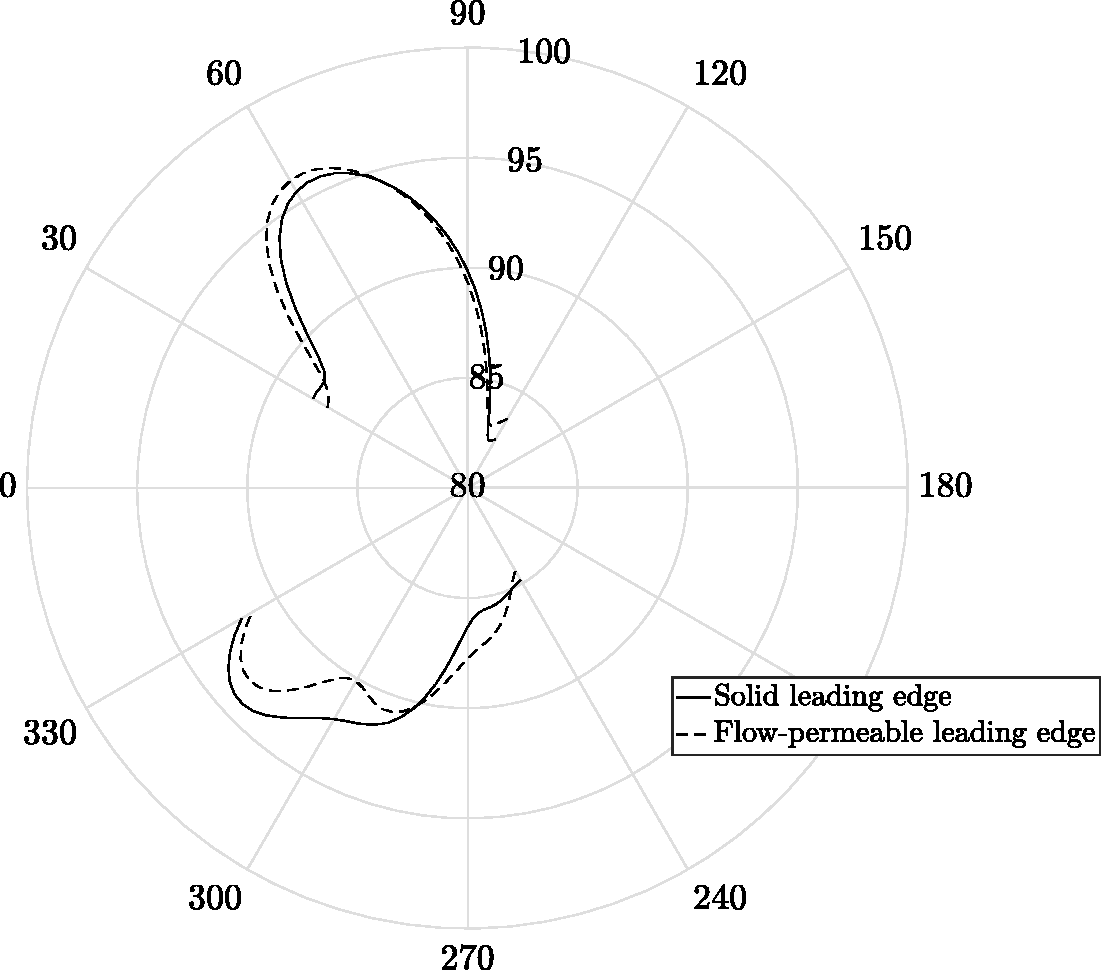
Polar plot of the overall sound pressure level (OASPL) for the two leading-edge configurations. Receiver angles ranging between
The figure shows that, as a consequence of the aerodynamic asymmetry, the directivity plots are asymmetric with respect to the axial direction. Both lobes show peaks oriented in the upstream direction. At the advancing blade side, the lobe shows a peak at a receiver angle of about
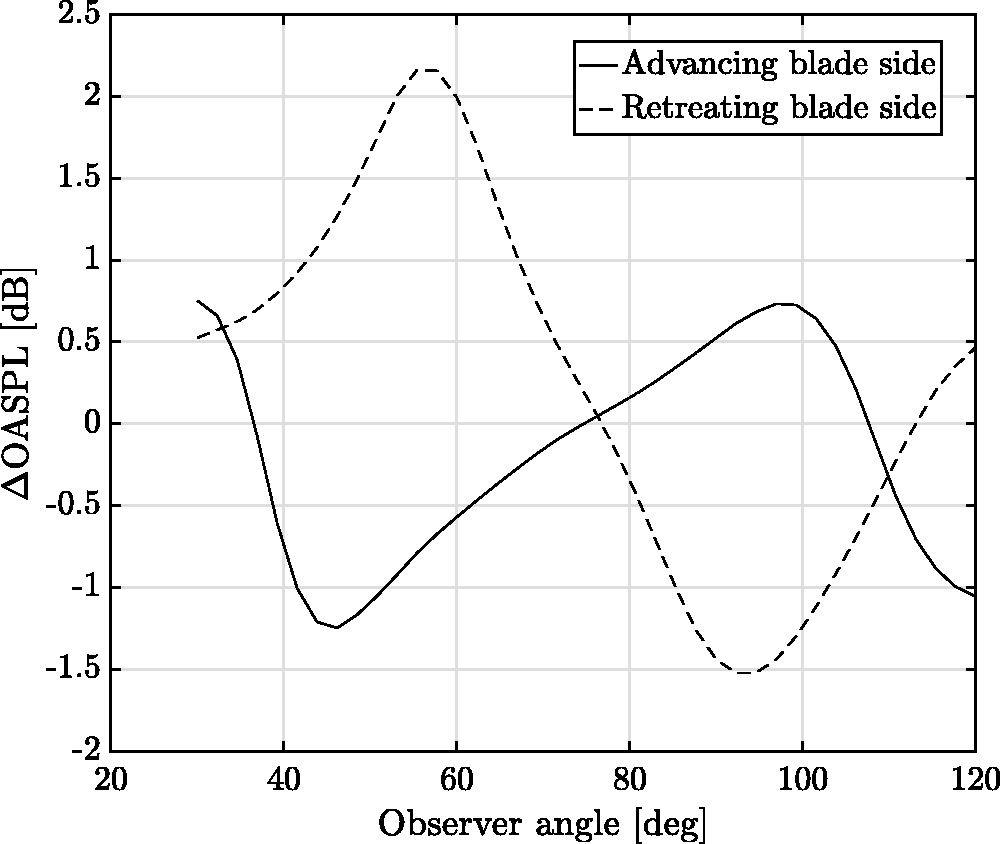
Overall Sound Pressure Level (OASPL) with respect to the solid case. Positive means noise reduction. Receiver angles are reported in absolute values.
The previous figure quantifies the near-field noise for the entire system. In order to isolate the effect of the flow-permeable leading edge, the near-field noise is computed by integrating only the surface pressure fluctuations on the pylon. The sound pressure level in 1/12 octave band is plotted in Figure 22 for three receiver angles corresponding to the maximum noise increase, maximum noise reduction and no noise variation of the entire system (Figure 20). Both the advancing and the retreating blade sides are reported with a continuous and dashed line, respectively. In the figure, the frequency is non-dimensionalized with respect to the BPF equal to 848 Hz.
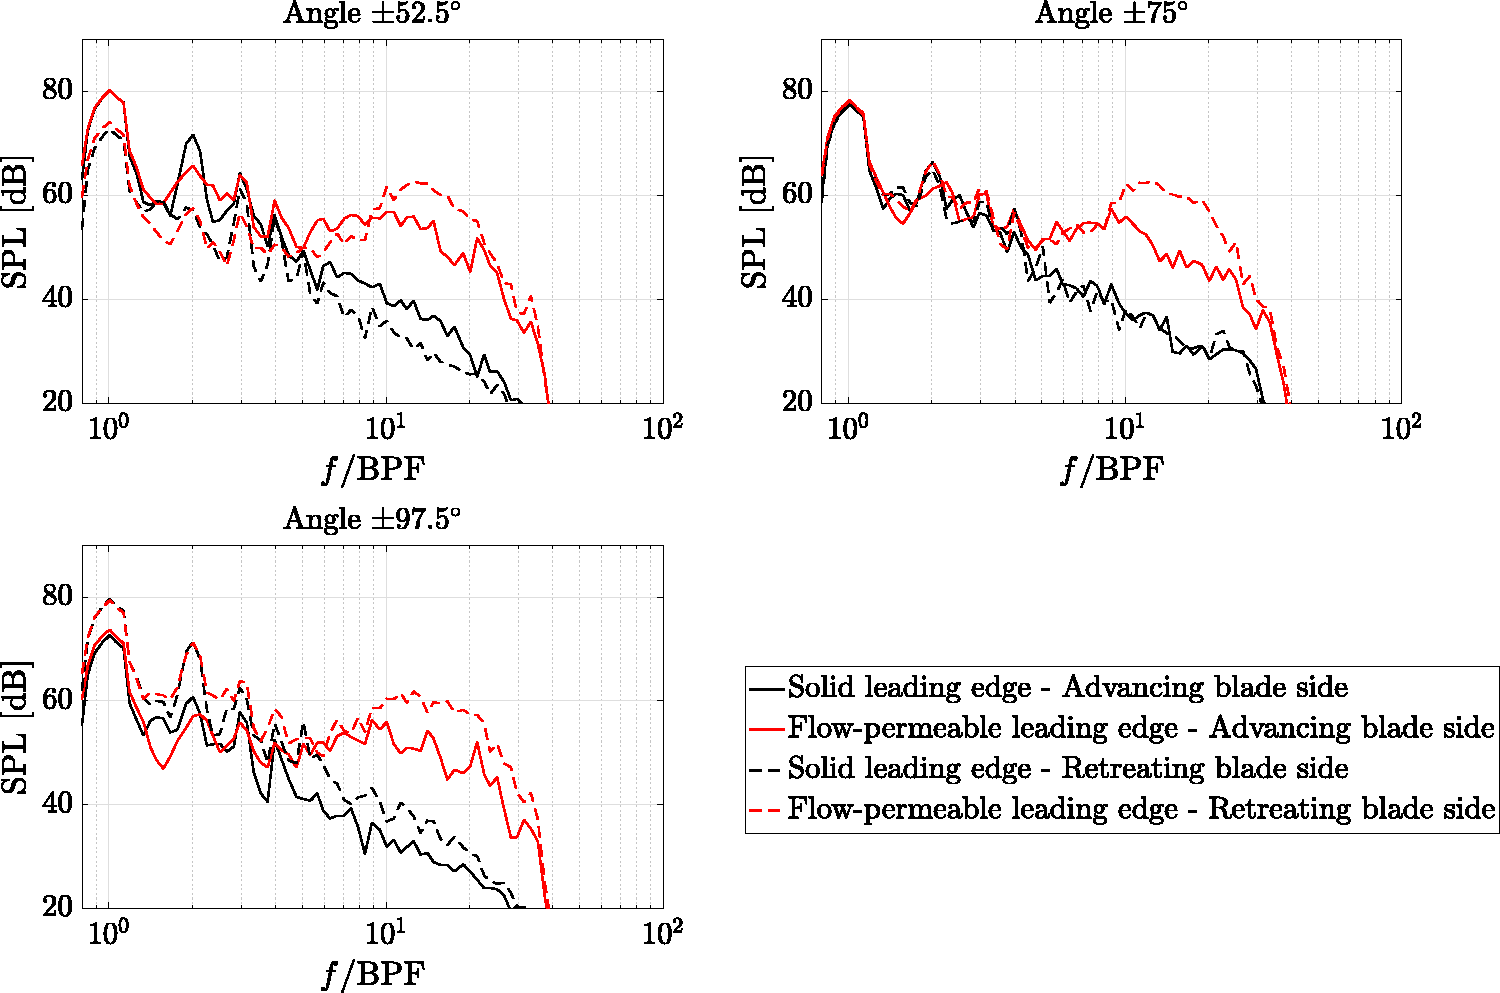
Sound pressure level (SPL) in 1/12 octave band for three receiver angles corresponding to the maximum noise increase, maximum noise reduction and no noise variation of the entire system.
The figure shows the two most relevant effects of the flow-permeable leading-edge insert: the reduction of the tone amplitude and the increase of the broadband component at high frequencies. At the retreating blade side and receiver angle of
Conclusions
The flow and the acoustic fields of a propeller in tractor configuration are investigated. The configuration is obtained by placing a pylon in the slipstream of the propeller. A solid and a flow-permeable leading-edge configuration are investigated. The computational set-up reproduces the experiments carried out at Delft University of Technology.9,10,16
Computational results are validated with a grid convergence study and against experimental data. A good agreement is found between the experiments and the numerical results by comparing the thrust coefficient, the propeller wake, the surface pressure fluctuations for the pylon with the solid leading edge and the pressure coefficient variation between the solid and the flow-permeable configurations.
It is confirmed that the effect of the flow-permeable leading edge is to alter the aerodynamic shape of the pylon showing similar features to the ones that could be obtained using a thicker aerofoil or by moving the location of the maximum thickness, i.e. downstream displacement and increase in magnitude of the suction peak. This is caused by a thicker boundary layer that develops over the retreating blade side of the pylon for the flow-permeable leading-edge insert due to the cross-flow through the cavity. This flow motion is caused by the aerodynamic asymmetry of the pylon due to the helicoidal motion of the wake and causes the drag increase found in the experiments. Conversely, the flow-permeable leading edge has negligible effects on the development of the boundary layer on the advancing blade side. The interaction between the propeller tip vortex and the turbulent boundary layer reduces the amplitude of the surface pressure fluctuations towards the trailing edge of the pylon on the retreating blade side.
The acoustic analysis shows that the installation of the flow-permeable leading-edge insert increases the OASPL up to 1 dB at the advancing blade side, while it reduces the OASPL up to 2 dB at the retreating blade side for receiver angles between
Footnotes
Acknowledgements
The authors would like to thank Dr. Wouter C.P. van der Velden for the useful suggestions about the computational set-up and Tomas Sinnige, Biagio Della Corte and Reynard de Vries for the useful discussions and for providing the experimental data.
Declaration of conflicting interests
The author(s) declared no potential conflicts of interest with respect to the research, authorship, and/or publication of this article.
Funding
The author(s) received no financial support for the research, authorship, and/or publication of this article.