
Abstract
The energy present in the ocean surface waves can be extracted using an oscillating water column (OWC) device. In the present work, the performance characteristics of a normal OWC, an opposite OWC and a novel double OWC employing Savonius rotors are investigated at different sea states in a numerical wave tank (NWT) using the computational fluid dynamics (CFD) code ANSYS-CFX. The Savonius rotor is known to be an inexpensive energy harvesting device. The waves in the NWT were generated using a piston type wave-maker. The results from the computational work were compared with experimental work. For the normal OWC, a maximum power output of 18.85 kW, which corresponds to an efficiency of 22.44% was recorded at 60 rpm for the mean wave condition. On the other hand, for the opposite OWC, the peak power and efficiency were 10.4 kW and 12.38% respectively for the mean sea state. For the novel double OWC, the flow in the front OWC has more energy compared to the flow in the rear OWC for both advancing flow and retreating flow, resulting in a combined peak power of 19.5 kW at the mean sea state. This represented an increase of 3.45% in the power production.
Keywords
Introduction
The demand for energy continues to increase and it is estimated that the global energy consumption can increase by 30% or more by 2040. 1 There is a strong emphasis on utilizing green and clean sources of energy to meet this demand instead of using conventional sources of energy such as fossil fuels. Extensive and uncontrolled use of fossil fuels has led to climate change and rising sea levels. To mitigate these effects, the focus has shifted to generating power from renewable sources that are environmentally friendly and sustainable. Generating electricity from waves is a promising option. Waves can be predicted well in advance and wave energy is one of the most consistent sources of energy. Furthermore, the global power potential of waves hitting the coasts worldwide is 1 TW 2 representing energy per wave crest of 10–50 kW. 3 The energy present in the waves can be extracted using appropriate wave energy converters (WEC). The developments in the field of WECs can be found in the works reported in Falcão, 4 Falcão and Henriques, 5 Khan et al. 6 and Drew et al. 7 Amongst the different types of WECs, the oscillating water column (OWC) is the most extensively researched technologies. This is due to its robustness, simplicity and versatility. 8 An OWC is a partially submerged hollow structure, open to the sea below the water surface, that traps the air above the inner free surface. The OWC device can either be a fixed or a floating structure. Due to the wave action, the air trapped in the OWC chamber is compressed and decompressed alternately.5,9 During either of the cycles, the air is forced to flow through a turbine connected to a generator which produces electricity.
Bosma et al. 10 modelled an array of five OWC WECs and studied their performance at different wave conditions and configurations both experimentally and numerically. The results highlighted that under regular wave conditions, the maximum increase in the average power for the optimized array configuration was 12% when compared to the non-optimized layout. The hydrodynamic performance of an inclined OWC was numerically modelled and studied by Kim et al. 11 The authors highlighted that the primary energy conversion efficiency was strongly influenced by the skirt draft and the chamber inclination angle. Prasad et al. 12 numerically studied the effect of OWC chamber inclination on rotor performance. The OWC chamber with an inclination angle of 55° performed the best. The maximum power for the 55° inclined OWC was 28% higher than that in the conventional OWC.
The forces imparted by the incoming waves on land-fixed OWC were experimentally and numerically investigated by Ning et al. 13 The results showed that the total force acting on the front wall decreased with increasing wavelength and increased with increasing incident wave height. López et al. 14 numerically studied the performance of standard OWC, and different variants of U-shaped OWC, stepped-bottom OWC and L-shaped OWC. The authors highlighted that the L-shaped OWC model with a shallow entrance, high horizontal chamber duct and a wide vertical duct performed the best. Zhou et al. 15 studied the hydrodynamic characteristics of a cylindrical type OWC WEC that was integrated with a monopile mounted offshore wind turbine. The study highlighted the strong dependence of hydrodynamic efficiency on turbine dampening and wave steepness. In a similar study, Zhou et al. 16 integrated an OWC into a floating offshore wind turbine structure and reported a maximum relative capture width value of 0.211.
The performance of an OWC WEC device in a stepped sea bottom was investigated both numerically and experimentally by Rezanejad et al. 17 The stepped bottom OWC device performed well because its energy extraction process was similar to a dual-mass oscillatory WEC system. Mohapatra and Sahoo 18 numerically studied the hydrodynamic performance of an OWC device with and without stepped bottom. Different stepped bottom configurations were tested and the peak hydrodynamic efficiency for the optimal stepped configuration was 93%. In a similar study by John Ashlin et al., 19 the authors reported that the curved bottom profile performed the best and recorded a hydrodynamic efficiency of 71%.
Trivedi et al. 20 numerically studied the performance of a U-shaped OWC device. The authors reported that the chamber length, the submergence depth of the front wall and width of the opening duct play a vital role in improving the hydrodynamic performance of the U-OWC device. Ning et al. 21 investigated the effect of varying the geometric parameters of the vertical duct of a U-OWC device on the hydrodynamic performance. They reported that the vertical duct height, the vertical duct width and the vertical duct wall thickness had a strong influence on the hydrodynamic efficiency of the device. In another numerical study on U-OWC, Gurnari et al. 22 provided an insight on the performance of a breakwater integrated U-OWC device at varying wave climates. They reported a maximum turbine efficiency of 48%. Furthermore, the performance of breakwater integrated OWC devices have been investigated by Zheng et al. 23 and Han and Wang. 24 Gang et al. 25 studied the performance of a vertical OWC device having dual chambers along the coastline that acted as the breakwater.
Fox et al. 26 developed a numerical model based on linear potential flow theory to study the performance of different OWC configurations. The authors reported that the U-shaped OWC performed the best. The maximum pneumatic power for the U-shaped OWC was 46.8 kW/m. The performance of an OWC device integrated into a jacket type infrastructure was numerically studied by Lee et al. 27 They reported that the maximum conversion efficiency of 17.2% was recorded at a gate opening ratio of 0.4531. In a similar study, Hassanabad and Shegeft 28 numerically studied the flow characteristics in an OWC WEC integrated into a floating breakwater. They reported that the model with a shorter chamber wall height on the incident wave side with longer wall on the leeward side performed the best. Gubesch et al. 29 developed a design process to improve the hydrodynamic performance of a non-symmetric offshore OWC. Mia et al. 30 investigated the effects of front wall draught, rear wall draught and bottom plate length on the hydrodynamic efficiency of an OWC numerically. They reported higher efficiencies for the models with longer rear wall draught than the front wall draught and observed peak efficiency of 44% when the rear wall draught was 3.5 times the front wall draught.
The effect of front wall underlip geometry on OWC performance was experimentally investigated by Çelik. 31 The author reported that the underlip with a circular cross-section recorded a maximum increase of 21.2% in the CWR when compared to the traditional rectangular front plate wall. Liu et al. 32 studied the performance of an OWC employing an impulse turbine in regular and irregular waves. The authors reported higher overall efficiencies for the free spinning mode at all the tested wave conditions when compared to forced spinning mode. The performance of a square OWC and a curved OWC at varying wave conditions and varying geometric parameters were experimentally investigated by Li et al. 33 The wave energy capture efficiency for the curved and the square models were 61.9% and 50.9% respectively. Manimaran 34 numerically compared the performance of a rectangular and a trapezoidal OWC. The CWR for the trapezoidal and the rectangular OWC devices in single unit setup were 26.1% and 24.1% respectively.
Another emerging area of study is OWC devices with multiple chambers, commonly known as multi-chamber OWC or M-OWC. Currently, there are at least three distinct M-OWC subcategories namely, the array OWC, the segmented M-OWC and modular M-OWC as mentioned in the work of Doyle and Aggidis. 8 Wang et al. 35 investigated the effect of curtain wall draft, and sub chamber width ratio on wave induced force, and bending moment acting on a land based dual chamber OWC device using a fully nonlinear numerical model. The authors stated that the wave induced forces and bending moment increased with increasing curtain wall draft. The hydrodynamic performance of a stationary, cylindrical, dual-chamber OWC system was experimentally investigated by Ning et al. 36 They reported that the dual chamber OWC device allowed for broader peak operational range. The effect of power take-off (PTO) damping and different wave climates on the hydrodynamic performance of a fixed multi-chamber OWC device was numerically studied by Shalby et al. 37 They reported that the CWR was maximized in all the chambers at intermediate PTO damping except for long waves where higher PTO damping gave better performance. The hydrodynamic efficiencies of different multi-chamber OWCs with different turbine configurations were numerically studied by Mia et al. 38 The authors reported superior outputs for the two chamber-2 turbine and three chamber-3 turbine configurations when compared to the conventional one chamber-1 turbine configuration. The respective improvements in the efficiencies when compared to the conventional configuration were 25% and 33%.
A detailed review of the literature shows that there are many variants of OWC devices with single or multiple chambers; however, there are two knowledge gaps identified. Firstly, there is very limited work reported on the performance of full-scale OWC devices. Secondly, majority of the OWC devices employ conventional air turbines (Wells turbine or impulse turbine) for energy conversion. The air turbines suffer from aerodynamic losses due to the noise induced in the air flow passages at extreme wave conditions. Furthermore, the flow control mechanism and the turbine design are very expensive thus increasing the installation cost.5,39 There is a clear lack of information on the use of other types of turbines as an alternative to conventional turbines for wave energy extraction to address these issues. This knowledge gap provided the motivation for the present work which is aimed at numerically investigating the performance of a full-scale OWC device employing Savonius rotor as a direct drive turbine using ANSYS-CFX. The current study is aligned with United Nations sustainable development goal: SDG 7 – Affordable and Clean Energy. The design of a wave energy converter and its implementation will provide energy security for the local communities and will also help to preserve the environment for future generations. The focus of the work is to design an OWC device tailor-made for Fiji and in Fiji. As such, the Savonius rotor design was chosen because it is cheap40,41 and can easily be manufactured locally here in Fiji. The Savonius rotor is placed in the chamber in direct contact with water. The rotor is directly driven by the water that oscillates in the chamber. The wave energy is converted to mechanical energy which in turn is converted into electrical energy with the help of a generator. The wave to pneumatic energy conversion is eliminated using this system thus reducing the energy losses. The OWC and Savonius rotor geometries used in the present study were previously optimized by the authors and information on this can be found in the work reported by Prasad et al. 42 The OWC device is tested with three different configurations namely normal OWC, opposite OWC and a novel double OWC. The design of the novel double OWC is distinct. It has two inlets with one facing the advancing wave while the other faces in the opposite direction to wave propagation, keeping in mind the unique orbital motion of particles in wave motion. 43 All the existing double OWC devices have a single inlet and have utilized air turbines for power generation. The novel double OWC is inspired by backward bent duct buoy (BBDB) concept of Baanu et al. 44 and Sheng. 45 The novel double OWC device is obtained by place the normal OWC and the opposite OWC devices back-to-back; such a device has not been studied previously. The waves in the numerical wave tank (NWT) are generated using a piston type wavemaker and the air-water free surface is captured using the volume of fluids (VOF) method. The wave climate generated is the same as that reported by Ram et al. 46 The NWT code used in the present study was also validated by the authors as reported in Prasad et al. 47 The initial validation of the computational fluid dynamics (CFD) code against the experimental data, and the rotor performance and flow characteristics of the full-scale OWC devices are presented in this paper.
Materials and methods
To validate the CFD code, a conventional OWC model at 1/14th scale was constructed, and tested at varying wave heights (60, 70, and 80 mm) and varying wave periods (1.6–1.8 s in increments of 0.05 s) by the authors as reported in Prasad et al. 48 The wave conditions chosen for the experiment were based on the real sea climate reported in Ram et al. 46 Thus, using a scale of 1:14, the experimental wave depth was 1.29 m and the dimensions of the OWC model were determined accordingly. In the study reported by Prasad et al., 48 the 90 mm rotor performed the best at a wave height of 80 mm and at a wave period of 1.7 s. A NWT was then constructed to reproduce the experimental wave conditions. The wave generation technique used in the current study was previously validated by the authors as reported in Prasad et al. 47 Once the code was validated, geometric modifications were made to the OWC chamber and the rotor to improve the performance as reported by the authors in Prasad et al. 42 The best model in this study recorded rotor power and efficiency of 0.34 W and 16.1%, respectively. Comparing this with the conventional OWC, the improvement in rotor efficiency was approximately 94%. The optimized rotor and OWC chamber dimensions from the work reported in Prasad et al. 42 are now scaled up as shown in Figure 1 to investigate the performance of the full scaled device in the present paper. The dimensions of the current OWC are comparable to designs of OWC devices proposed by Zullah and Lee 49 and Zullah et al. 50 The dimensions in Figure 1 are in metres and the fillet radius at the upper corner is 0.28 m while the width of the chamber facing the incoming waves is 2.8 m. The bottom slope is inclined at an angle of 45°. The width of the Savonius rotor and the thicknesses of the blades are 2.8 m and 20 mm respectively.
Schematic of the Savonius rotor and the OWC chamber.
The model description of the different OWC configurations tested are given in Figure 2. The opposite OWC has the same dimensions as the normal OWC device as given in Figure 1. The novel double OWC is obtained by placing the normal OWC and the opposite OWC devices together back-to-back. Hence the dimensions of the front OWC and the rear OWC in the novel double OWC configuration are same as that given in Figure 1. The different sea states simulated to study the performance of the full-scale OWC devices in the present work are given in Table 1. The sea states are the actual wave climate measured at a site in Kadavu, Fiji as reported in Ram et al. 46 Additionally, the water depth at the site was 18 m and this is used in full scale simulation.
Schematic of the different OWC configurations.
Sea states simulated to study the performance of the full-scale OWC devices in the present work.
The schematic of the NWT (not to scale) is shown in Figure 3. NX 8 UniGraphics software was used to model all the parts. The total length and the width of the computational domain were 700 and 8.4 m respectively. The OWC device was located at 1.5λ (where λ is the wavelength obtained at maximum sea state and is 175 m) from the wave-maker and 2.5λ from the back wall. The distance of the OWC device from the wave-maker and the back wall is based on the work of Lakshmynarayanana et al. 51 The authors stated that the inlet and the back wall should be located between 1.5 λ and 2 λ from the model to negate the influence of boundary effect on results. The water depth (h) was 18 m and the distance of the top edge of the OWC inlet from the mean water level was 2.1 m.
Schematic of the NWT.
Both the wave-maker region and the damping zone were 100 m long. To dampen the reflected waves from the back wall, coarse mesh technique and beach slope of 1:3 were incorporated in the damping zone. Similar superior wave damping characteristics of the 1:3 beach slope was reported by Elangovan. 52 The computational domain which consisted of the OWC, NWT and the rotor as shown in Figure 4 was discretized using hexahedral mesh technique in ICEM CFD software. On either side of the mean water level, a mesh refinement region of 1.5 m height was incorporated to track the movement of the free surface accurately. The influence of grid size was investigated using 400,000, 800,000 and 1,200,000 nodes. The corresponding rotor powers were 9.35, 9.63, and 9.73 kW respectively. A grid size of 800,000 nodes was chosen since there was only a 1% deviation in the rotor power recorded by increasing the grid size to 1,200,000 nodes.
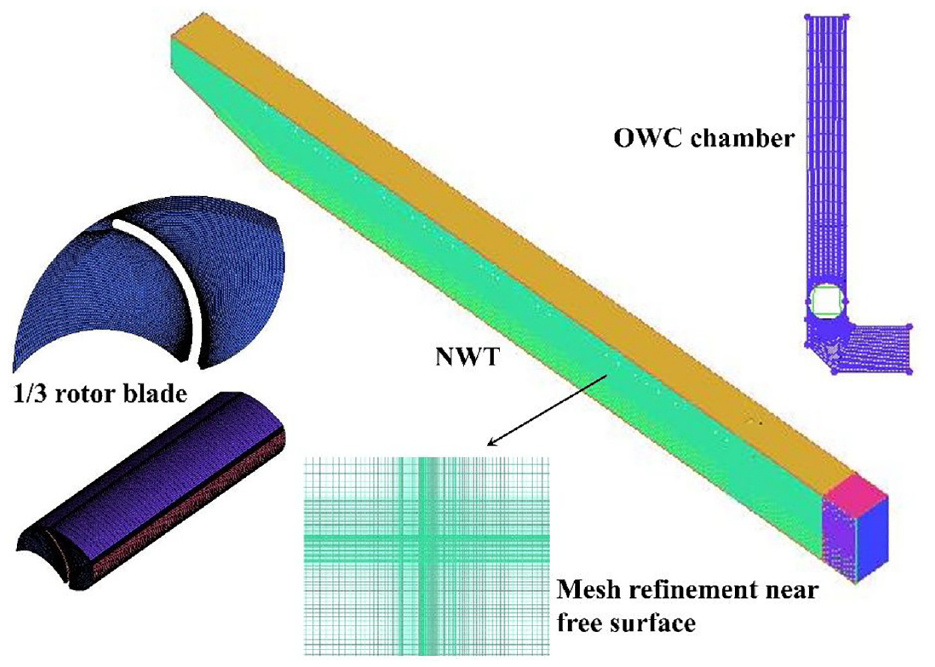
Mesh scheme for the OWC, NWT and the rotor.
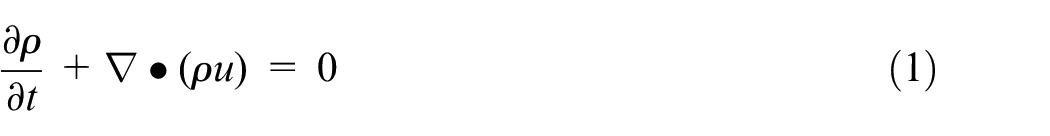
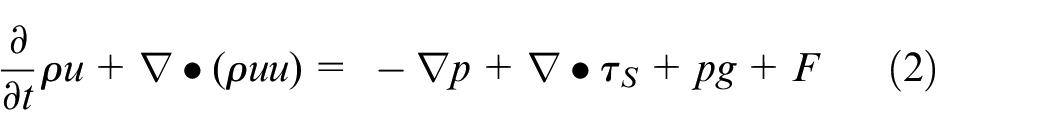
ANSYS-CFX software was used for numerical studies. The mass continuity and momentum conservation equations the software solves are given in equations (1) and (2) respectively.
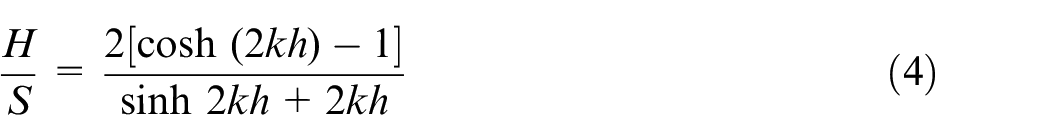
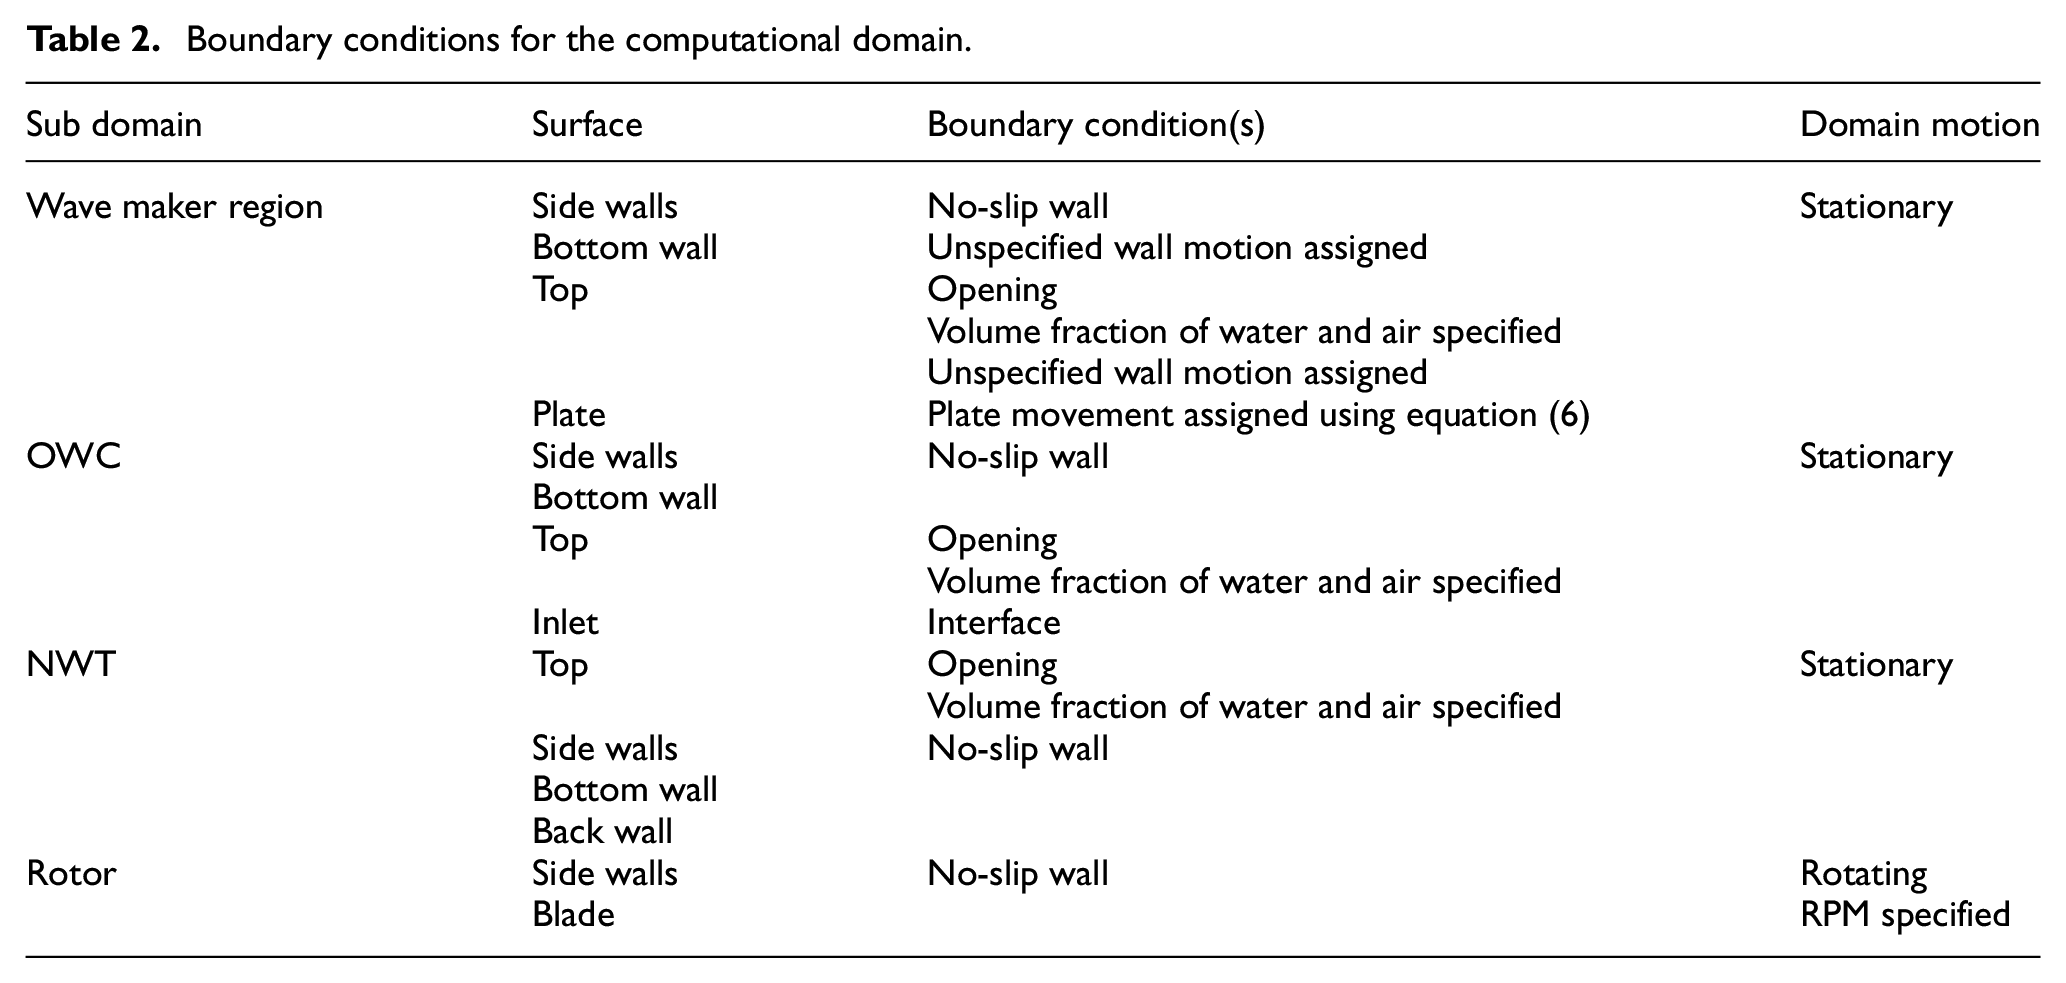
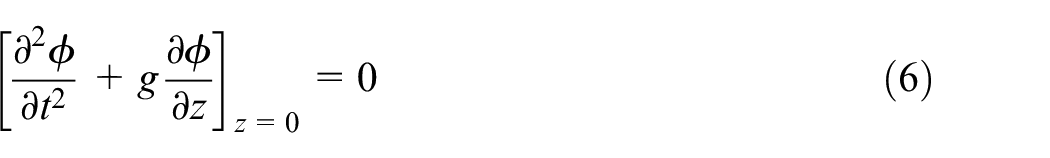
The computational domain consisted of the wave maker region, NWT, OWC and rotor subdomains as depicted in Figure 5. The waves in the NWT were produced using a piston type wave-maker (labelled as plate in Figure 5). The movement of the plate was governed by equation (3). In equation (3), S is the stroke length, ωo is the angular frequency and to is the time step. Furthermore, equation (4) shows the relationship between the stroke length of the piston and the wave height, 53 where H, k, and h are the wave height, the wave number and the water depth respectively. The detailed boundary conditions for the computational domain are given in Table 2.

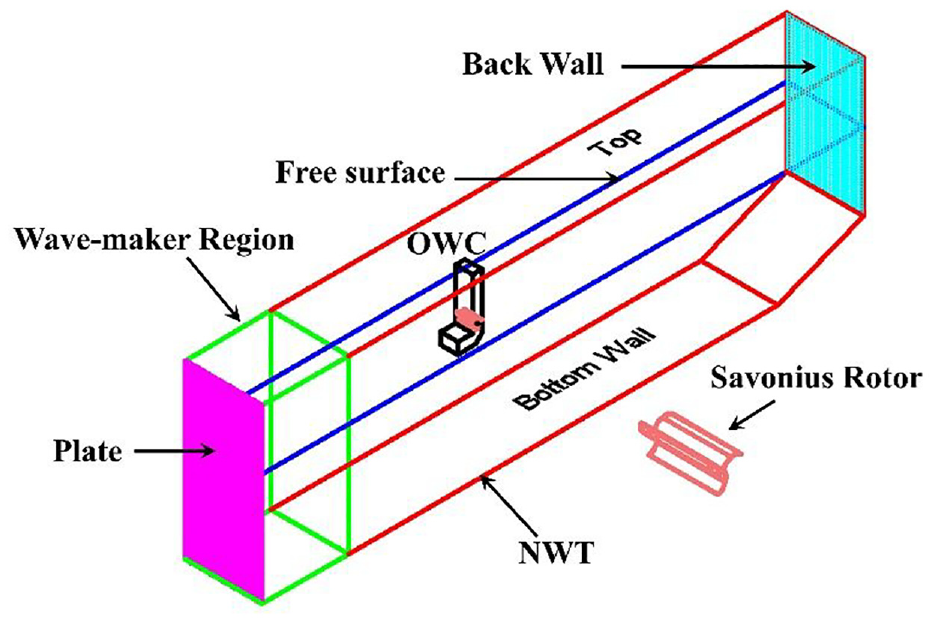
Schematic diagram of the computational domain.
Boundary conditions for the computational domain.
The wave to rotor interaction is captured using a transient simulation. For the closure of the Reynolds averaged Navier Stokes (RANS) equations, k-ε turbulence model was adopted. The use of this model to study wave interaction can be found in the works of Finnegan and Goggins,
54
Zaoui et al.,
55
Mohapatra and Sahoo
18
and Hafsa and Mounir.
56
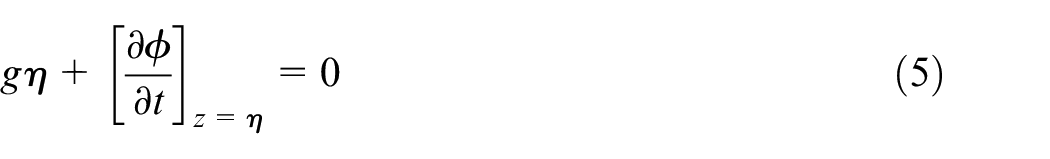
Though the literature highlighted the suitability of the k-ε turbulence model, the effect of turbulence model on rotor performance was additionally investigated using shear stress transport (SST) and k-omega turbulence models. The variation in the power recorded for k-ε turbulence model was within 3% of that recorded for the SST and k-omega turbulence models. This, therefore, justified the selection of the k-ε turbulence model in the present study. The temporal discretization was accomplished using the built-in implicit second-order backward Euler scheme. A total simulation time of 200 s with a time step of 0.05 s between each interval was chosen. Additionally, the dynamic boundary condition and the kinematic free surface boundary condition are given in equations (5) and (6) respectively from the wave theory.57,58 In equation (5), η is the displacement of the free surface and in equation (6), ϕ is the velocity potential. The VOF method reported by Finnegan and Goggins
54
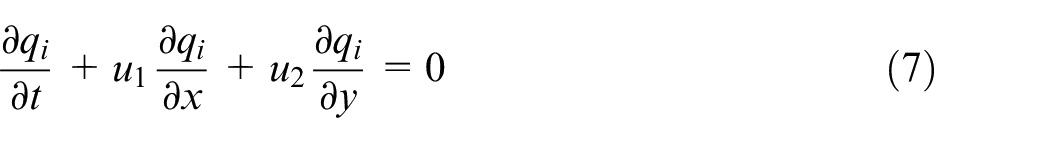
was used to capture the free surface as given in equation (7). In the equation (7)i is the two fluids present (i = 1 and 2), qi is the volume fraction of fluid i with
Results and discussion
Validation
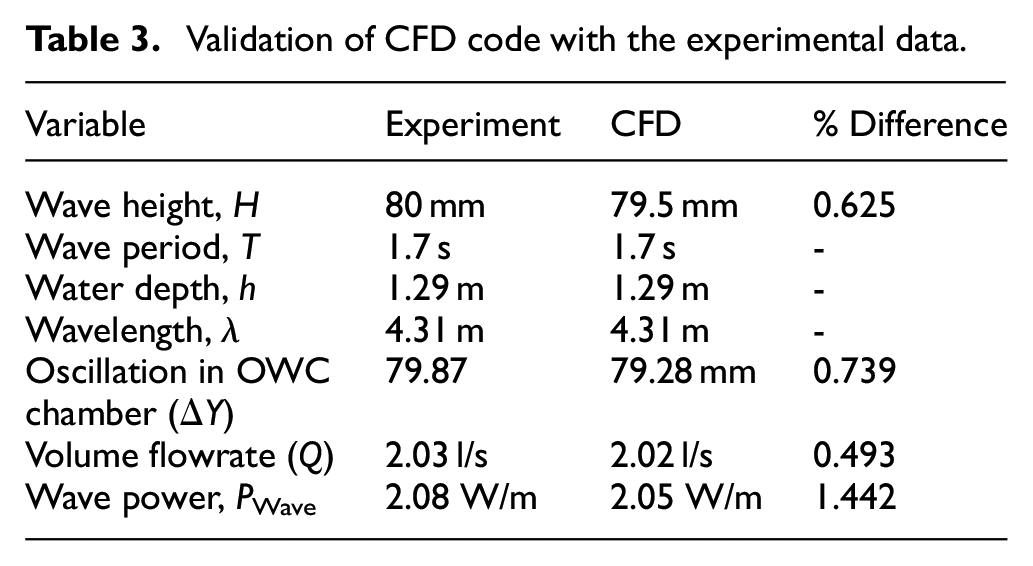
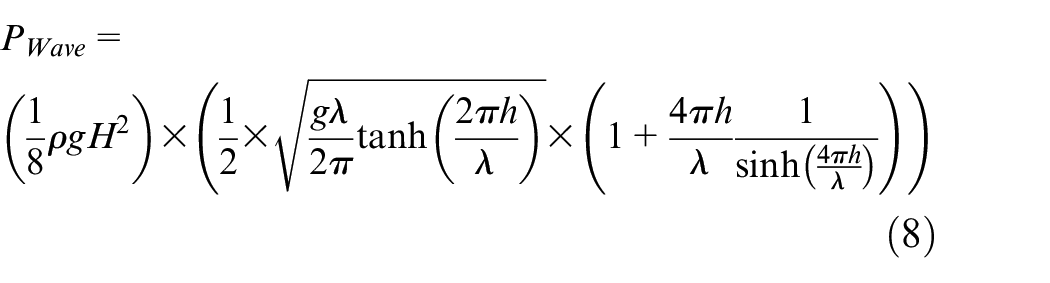
The experimental conditions used for the validation work 48 together with the CFD results are given in Table 3. The wave power was calculated using equation (8) as given in Dean and Dalrymple, 59 where λ is the wavelength. The formation of waves in the NWT was compared with the experimental wave height at a point 2 m away from the wave-maker as shown in Figure 6. The experimental wave height was measured using an ultrasonic wave sensor while the CFD wave height was measured at a point that was 0.29 m below the free surface. The CFD code was additionally verified using the linear wave theory and Stokes second order wave theory as shown in Figure 6. The CFD code was able to re-create the waves in the NWT with great accuracy with the difference between CFD and experiment within 2%.
Validation of CFD code with the experimental data.
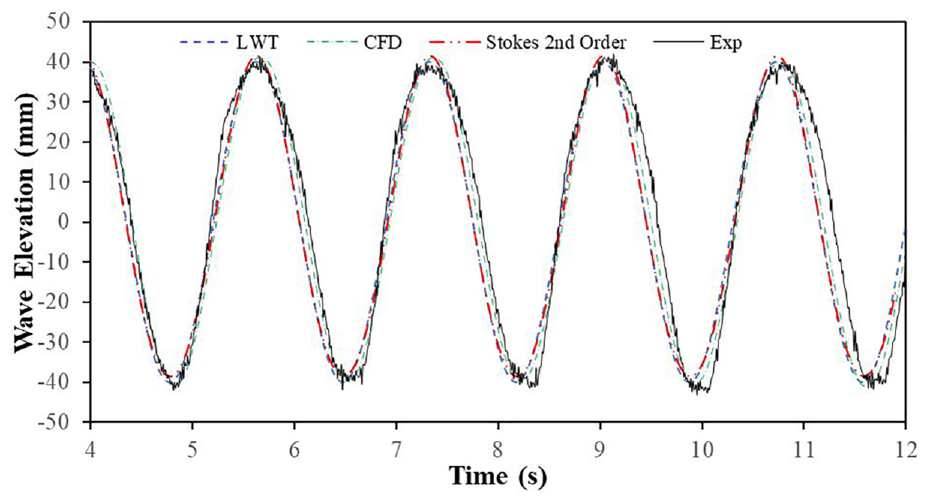
Comparison of wave elevation obtained using LWT, CFD, stokes second order wave theory with experiments.
In addition, the flow characteristics obtained by CFD were compared with the flow pattern obtained in the experiments using particle image velocimetry (PIV) for the case mentioned in Table 3. The flow as it enters the OWC is shown in Figure 7. It can be clearly observed from Figure 7 that the CFD code was able to capture the flow structure and the flow velocities accurately. The flow separation at the corner of region I and the vortex flow at the bottom corner in region III are correctly predicted. Apart from this, the CFD code was able to predict the energetic flow between the rotor and the side chamber walls correctly. The ability of the current numerical method to reproduce the experimental wave conditions as given in Figure 6 coupled with percentage difference highlighted in Table 3 and accurate prediction of the flow characteristics indicates that the CFD code is robust and can be used to study the performance of the WEC accurately.
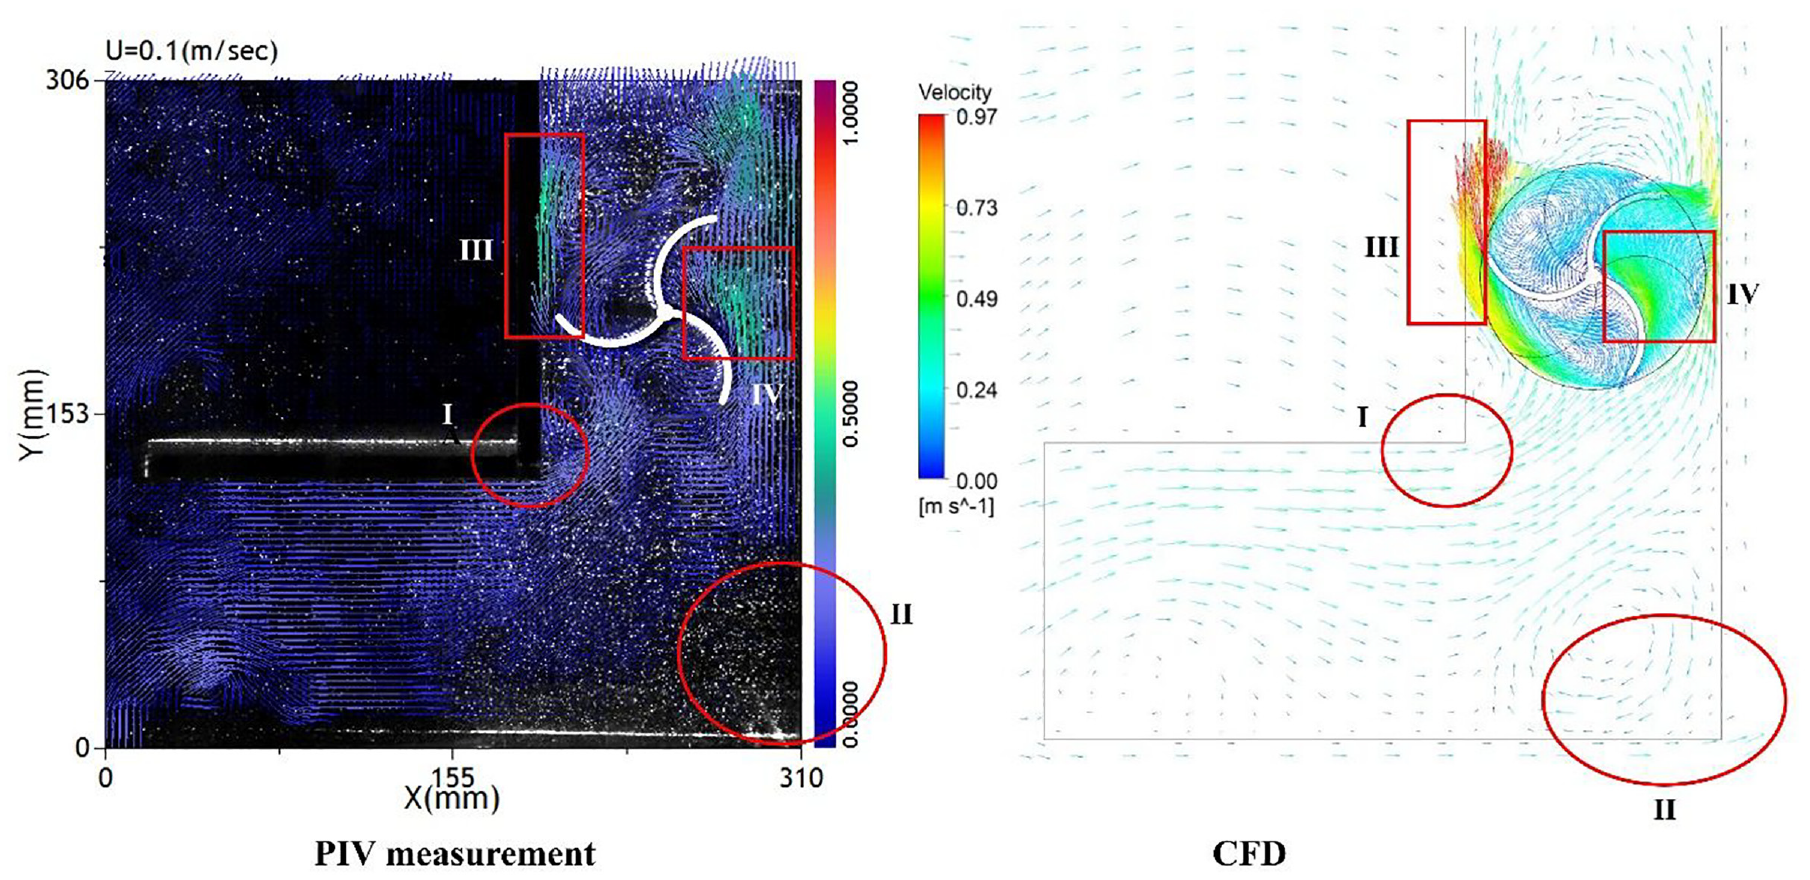
Comparison of flow characteristics in the OWC between experiment and CFD.
Studies on full-scale OWC devices
Performance of the normal OWC
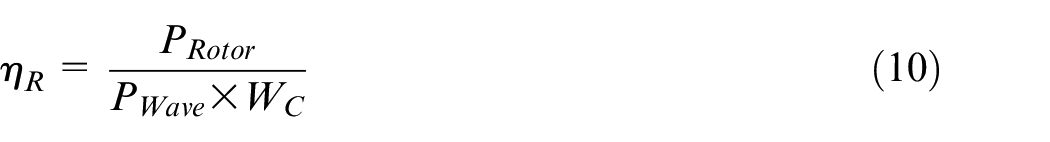
The rotor power was calculated using equation (9) while the efficiency was calculated using equation (10). In equation (9), τave is the average rotor torque and ω is the angular velocity. As given in equation (10), WC is the OWC inlet width which was 2.8 m.

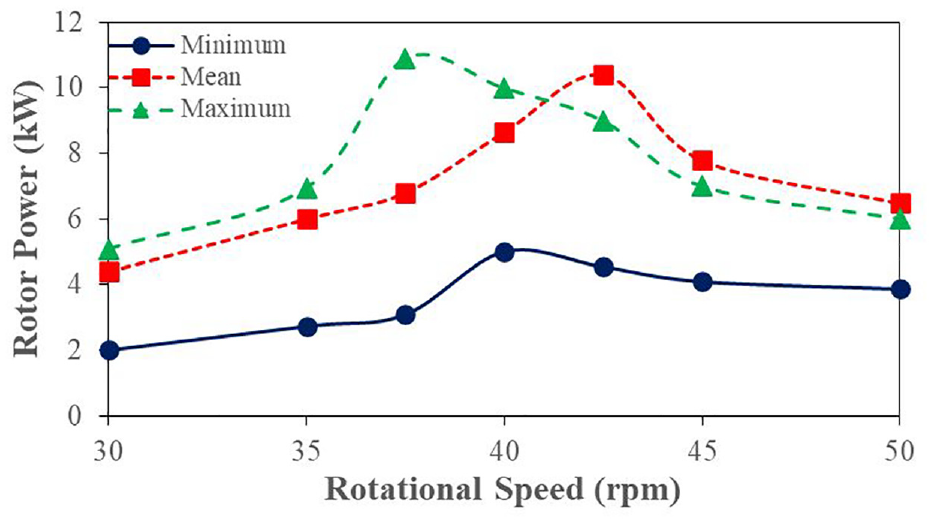
Under actual sea conditions, the speed of the rotor is naturally dictated by flow; however, in the present work, the rotor performance is studied by varying the RPM. The performance of the Savonius rotor at varying speeds for the three different sea states is presented in Figure 8. The power initially increases with increasing rotational speed. It reaches a peak and then drops significantly. The peak represents the optimal interaction between the rotor and the flow. The incoming flow does not impart all the energy it possesses if the rotor rotates too quickly. In a similar manner, if the rotor rotates too slowly then the flow moves quickly past the rotor and again imparts very little energy. As shown in Figure 8 at lower speed, the rotor produces lesser power. The peaks obtained at different wave conditions indicates that the interaction between the rotor and the incoming flow is optimum. In other words, the speed at which the power output is the highest represents the natural speed of the rotor due to the energy imparted by the flow. Any speed apart from this speed results in lower power production. There is a noticeable difference in the power production when comparing the mean sea state and the minimum sea state. The power produced at the mean wave condition is always higher than the minimum wave condition at all the rotational speeds. When comparing the performance of the rotor at the mean and maximum wave conditions, it is observed that the power production from 30 to 57.5 rpm is higher at the maximum wave condition and from 57.5 rpm onwards it is higher at the mean wave condition. The average increase in the rotor power at maximum wave climate from 30 to 57.5 rpm is 12% whereas the average decrease in power from 57.5 rpm onwards is 8.5%.
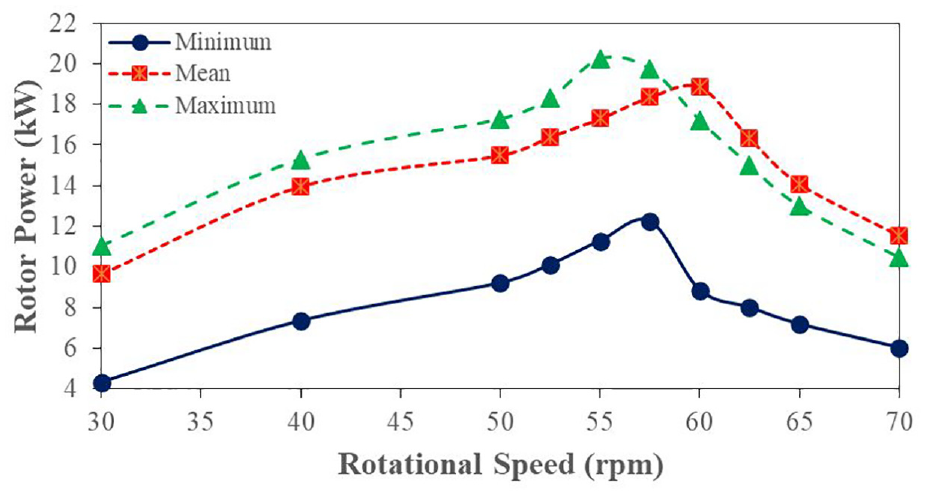
Performance of the normal OWC at varying rotor speeds for different sea states.
The dynamic torque acting on the rotor at the peak power for the three different sea states is given in Figure 9. The energy imparted by the flow on the rotor blades causes the rotor to rotate and hence gives rise to a torque. At maximum sea state the flow moving past the rotor has more energy than the flow at mean and minimum sea states thus imparting more momentum to the rotor. Therefore, the torque produced has a strong influence on the power generated by the rotor. As shown in Figure 9, higher torque is obtained at the maximum sea state while the lowest is observed at the minimum sea state. Consequently, the average torque is highest at maximum sea state and the lowest at the minimum sea state.
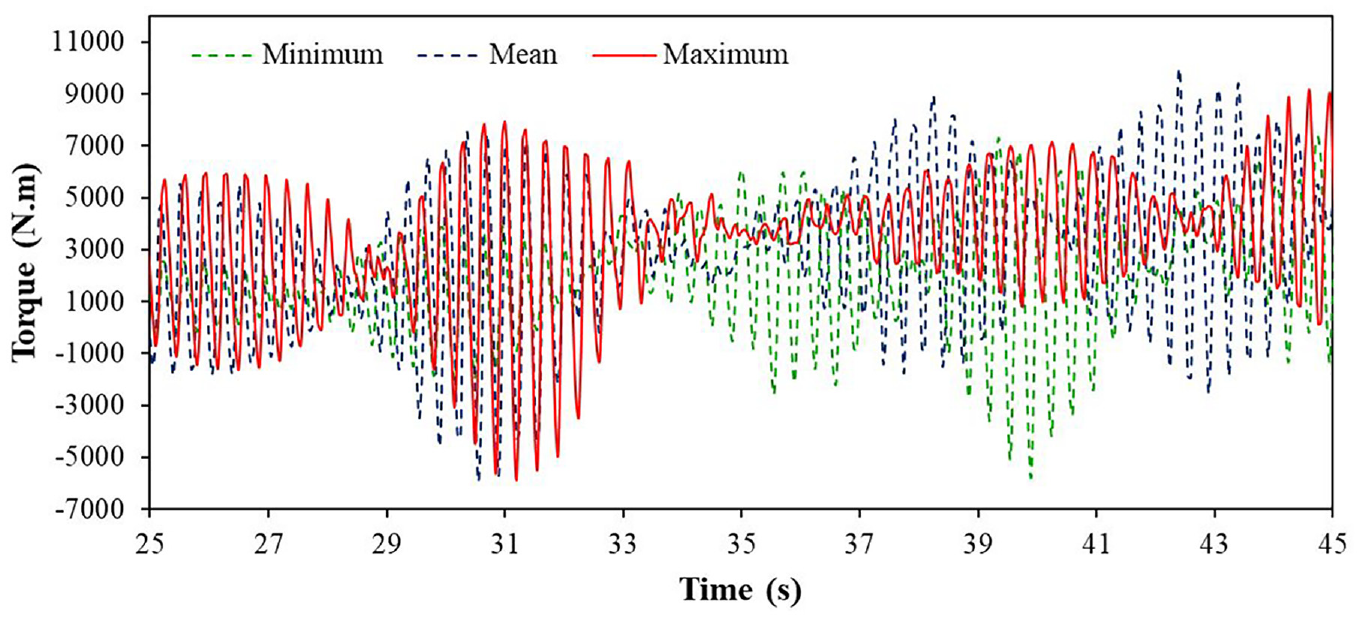
Dynamic torque acting on the rotor at peak power condition for the three different sea states.
The streamlines around the rotors at peak power condition for advancing flow at mean and maximum sea states are shown in Figure 10. For mean sea state, the flow on the convex side of blade 1 at point P1 separates into two streams. One stream turns left and flows along the blade surface towards the rotor shaft and forms the primary flow responsible for imparting energy on the concave side of blade 3. The second stream at point P1 is diverted towards the tip of blade 1 and is diverted upwards while accelerating. Similarly, the flow on the convex side of blade 2 at point P2 separates into two streams. The first stream turns downwards and flows along the blade surface towards the rotor shaft and forms the primary flow responsible for imparting energy on the concave side of blade 1. The second stream at point P2 is diverted up towards the tip of blade 2 and merges with the single large re-circulating flow formed between blades 2 and 3. The flow structure for maximum sea state is similar to that observed at mean sea state. The main difference is that the energy available in the flow is higher at maximum sea state when compared to the mean sea state.
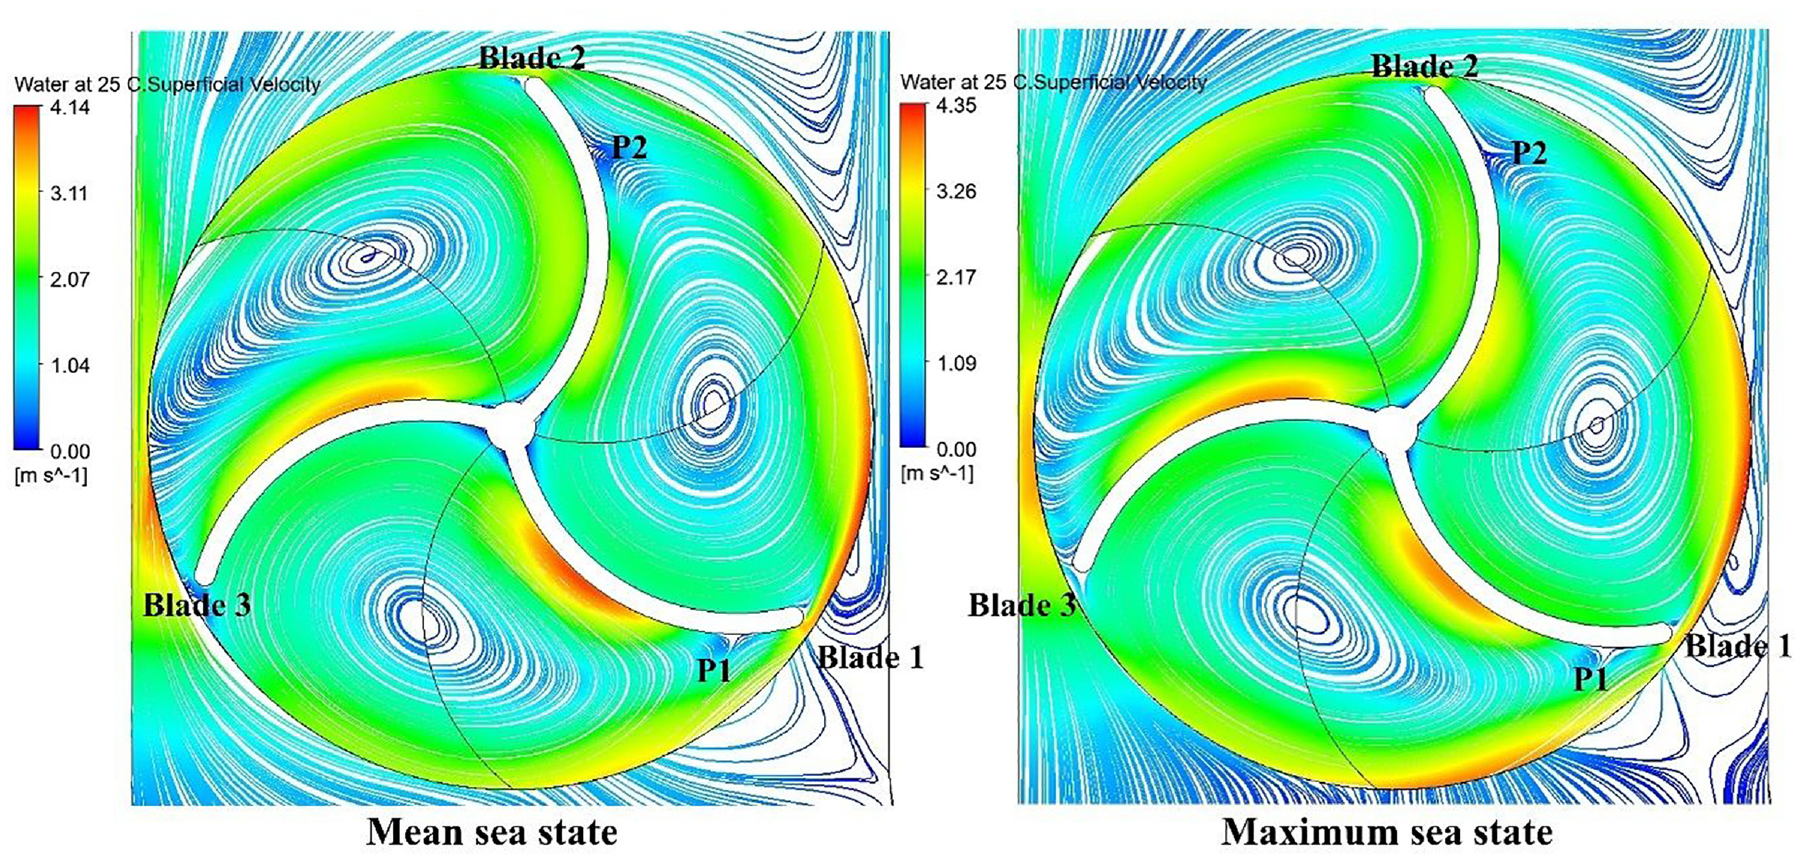
Streamlines around the rotors at peak power condition for advancing flow at mean and maximum sea states.
The flow characteristics around the rotor for a rotational speed of 60 rpm for the advancing flow at the mean wave state are shown in Figure 11. Firstly, vortices are observed to be formed between the rotor blades when water enters the chamber. The flow accelerates on the convex side of blade 1 and hits the concave side of blade 3, thus transferring its momentum and causing the rotor to rotate in the clockwise direction. The flow then moves along the concave side of blade 3 and turns counter-clockwise which creates a counter-clockwise vortex flow between blade 1 and blade 3. The portion of the flow that is diverted upwards near the tip of blade 3 moves along the convex side of blade 3 and imparts it energy on the concave side of blade 2 which causes the rotor to again rotate in the clockwise direction. The re-circulating flow observed between blade 1 and blade 2 diverts the energetic flows onto the concave side of blade 1 and once more causes a clockwise rotation of the rotor. The flow acceleration observed on the convex sides of blade 1 and blade 3 creates a low-pressure region that further assists in the net clockwise rotation of the rotor.
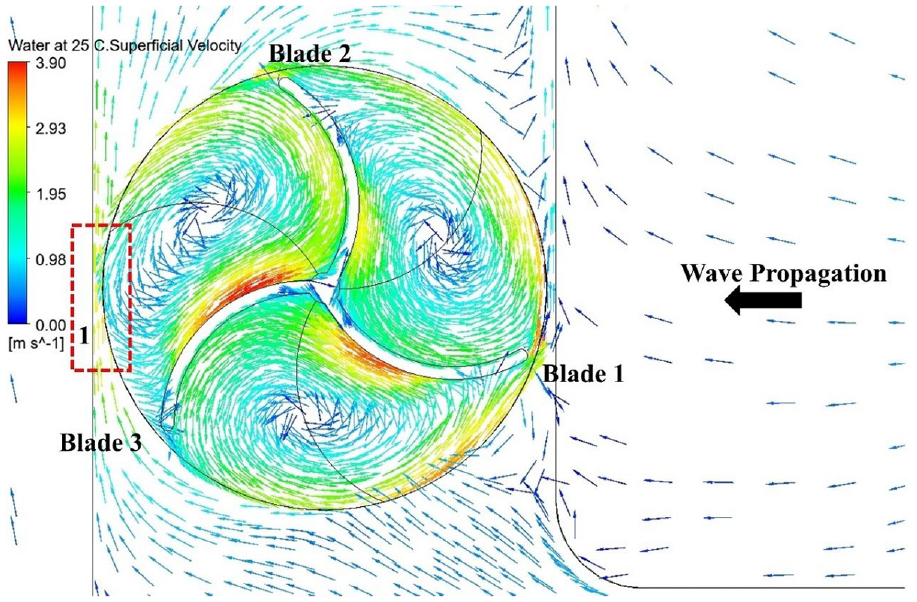
Advancing flow past the rotor at 60 rpm at the mean sea state.
The flow characteristics around the rotor for 60 rpm for the retreating flow at the mean wave condition are shown in Figure 12. The flow accelerating on the convex side of blade 2 is directed downwards onto the concave side of blade 1 and imparts its momentum. Interestingly, the flow further accelerates towards the rotor tip at blade 1. The re-circulating flows trapped between blades 2 and 3, and blades 1 and 3 redirects the flow onto the concave sides of blade 2 and blade 3 respectively. This is the primary cause of power generation during the retreating flow from the chamber. It is observed that the retreating flow has more energy and imparts more momentum on the rotor compared to the advancing flow. Similar trend was observed for the other two wave climates.
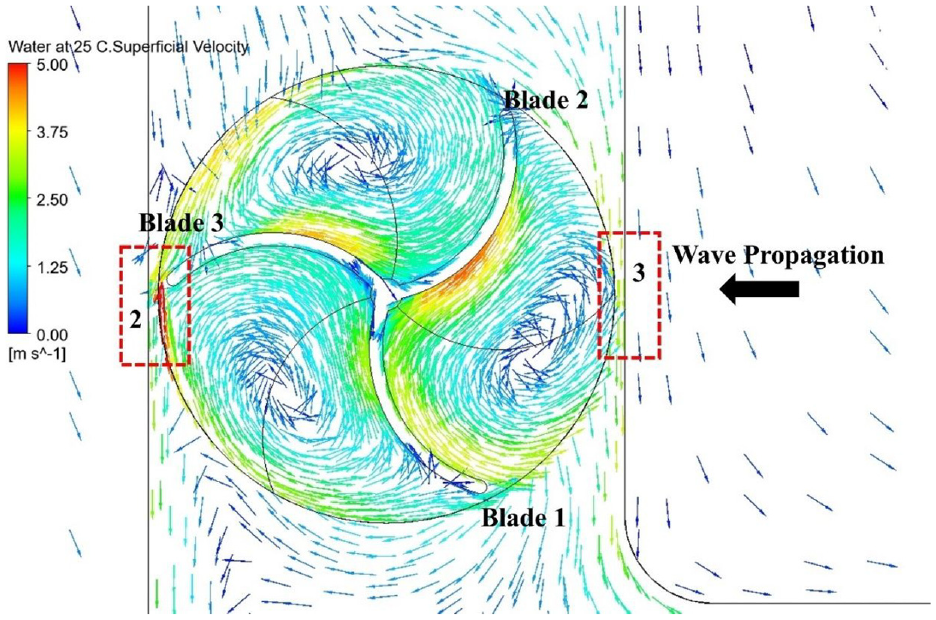
Retreating flow past the rotor at 60 rpm at the mean sea state.
Performance of opposite OWC
The performance of the Savonius rotor at varying speeds for the opposite OWC configuration at the three different wave climates is shown in Figure 13. For the opposite OWC, the peak power and efficiency were 10.4 kW and 12.38% respectively for the mean sea state. For the maximum sea state, the maximum power was 10.9 kW with an efficiency of 8.69%. The result indicates that the device did not perform that well at maximum sea state. The increase in the maximum power at the maximum sea state when compared to the mean sea state was just 5%. The maximum rotor power recorded for the opposite OWC configuration is 50% less when compared to the maximum rotor power recorded for the normal OWC.
Performance of the opposite OWC at varying rotor speed for different sea states.
The flow as it enters the opposite OWC is shown in Figure 14. The flow characteristics are interesting; while the water particles move in the forward direction as shown in region A, the water particles at the OWC inlet move in the opposite direction as shown in region B. As a result of this, the flow advances into the OWC. Due to the nature of the chamber configuration, the rotor this time rotates in the counter-clockwise direction. A clockwise re-circulating flow is observed between each blade. It is clearly visible in Figure 14 that flow over the convex sides of blades 1, 2 and 3 accelerates and is directed towards the concave sides of blades 2, 3 and 1 respectively. This imparts a counter-clockwise moment to the blades and is the sole driving mechanism behind power production.
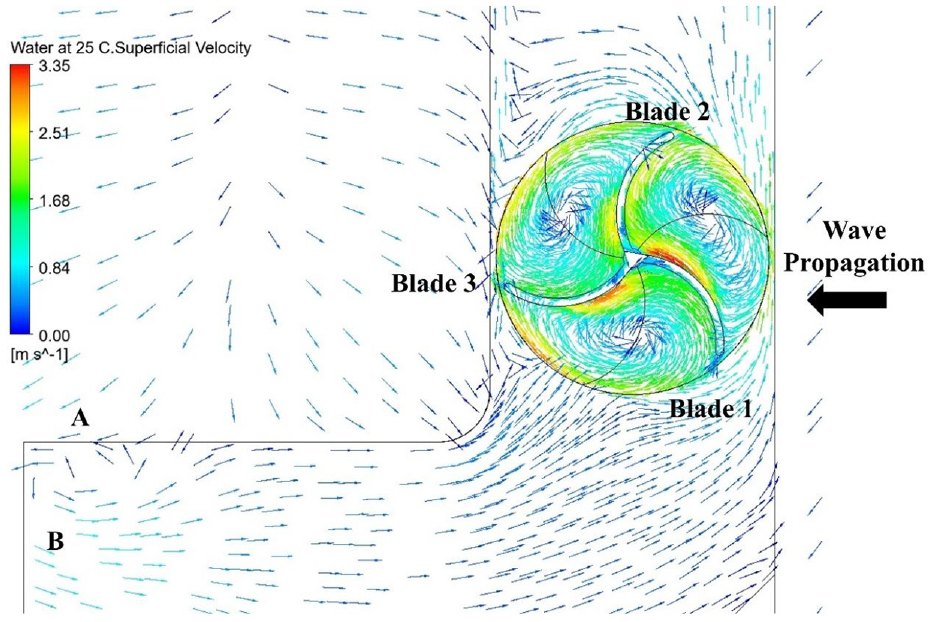
Advancing flow past the rotor at 42.5 rpm at the mean sea state.
The retreating flow in the opposite OWC is shown in Figure 15. The flow retreats as shown in region D while the water particles move in the opposite direction of the incoming waves as shown in region C. The primary mechanism behind power production is again the high energetic flow over the convex sides of the blades being directed towards the concave sides of the blades. However, this is only observed in the region between blades 1 and 2. Between blades 2 and 3, there are two vortex regions. The re-circulating region at 4 directs the flow on the concave side of blade 3 while the low energy flow in region 5 moves towards the tip of blade 2. The flow structures observed in regions 6 and 7 prevents any useful energy being imparted on the concave side of blade 1. The inferior flow characteristics obtained in the opposite OWC device compared to the normal OWC device ultimately leads to its lower power output. For waves propagating in intermediate water depths, the orbital motion is elliptical and the water particles are transported more in the wave propagation direction than in the vertical direction. The flow characteristics observed near the bottom wall of the rear OWC are similar to the flow characteristics observed for a submerged plate. Carter et al. 60 observed similar flow pattern. The eddies formed at the inlet of the opposite OWC cause high turbulence that leads to severe energy dissipation; this combined with wave transmission causes further drop in rotor performance compared to the normal OWC.
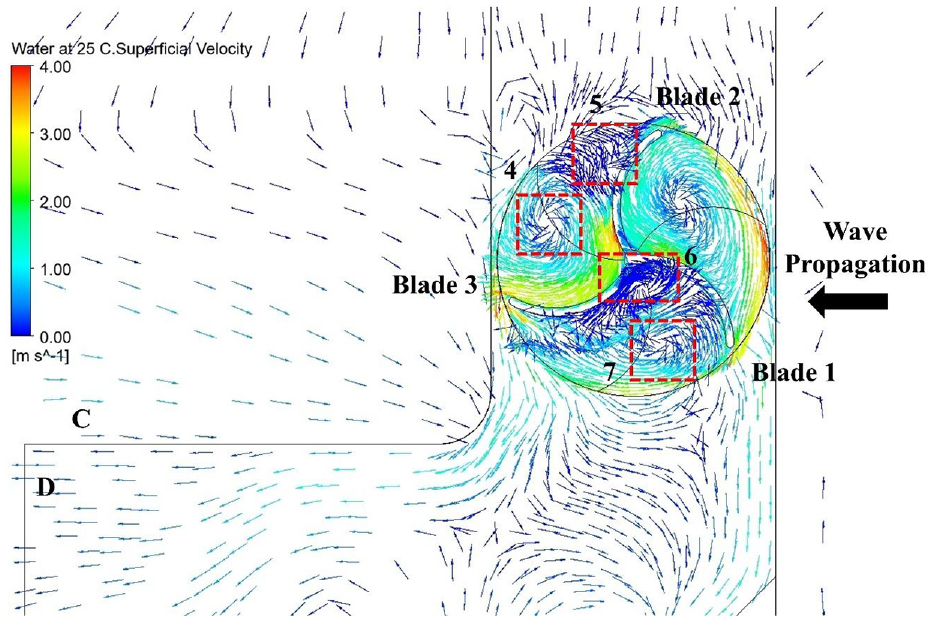
Retreating flow past the rotor at 42.5 rpm at the mean sea state.
Looking at the flow characteristics in Figures 14 and 15, it is possible to improve the performance of the opposite OWC device. Currently, the same rotor configuration as in normal OWC is used in the opposite OWC. It is possible that by changing the geometry of the rotor in the opposite OWC device may improve the performance. Additionally, more energetic flow that is observed in regions A and D can be directed into the chamber more effectively by using a bell-mouth nozzle attachment at the inlet.
Performance of novel double OWC
Though there are many variants of dual-chamber or multi-chamber OWC devices but all of them have a single inlet that faces the incoming waves. However, the novel double OWC proposed in this study has one inlet facing the incoming waves while the other faces the opposite direction. Information on the performance of such a device is in not available. Even though maximum power was recorded at the maximum sea state, it is important to note that the occurrence of mean sea state is going to be more frequent than the maximum sea state and hence the true performance of the device should be investigated at the mean sea condition. Hence, the novel double OWC configuration was only tested at the mean wave condition. The advancing flow into the novel double OWC is shown in Figure 16. As the waves approaches the front OWC, the water particles in region E and F move in the same direction. On the other hand, as the water enters the rear OWC the direction of flow in region H is opposite to the direction of flow in region G. This trend is similar to that observed for opposite OWC. The bottom walls of the front OWC and the rear OWC act like a submerged plate. Vortices formed at near region H force the water into the rear OWC as the flow advances. Similar flow pattern was observed in Carter et al. 60
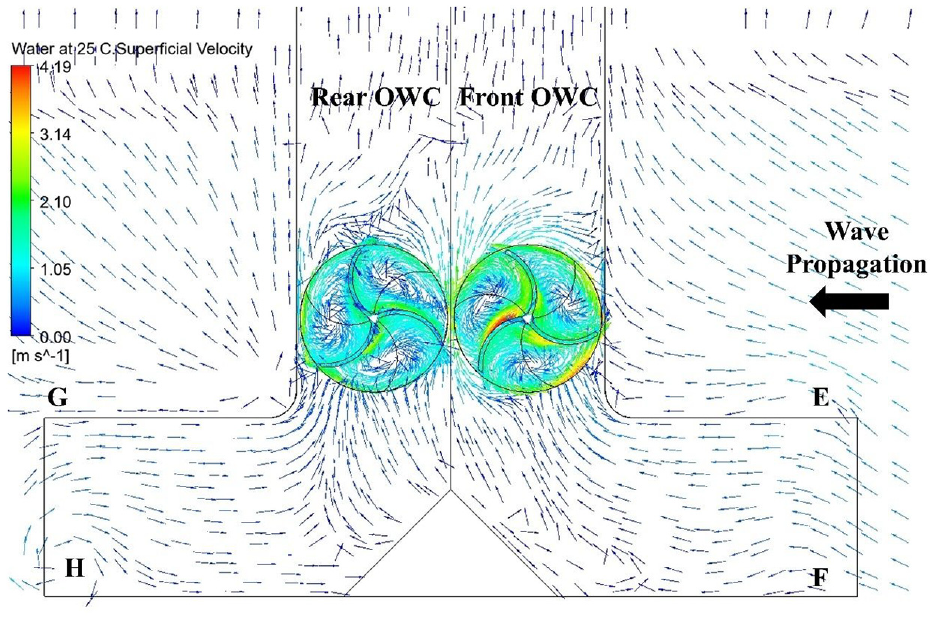
Advancing flow into the novel double OWC at the mean sea state.
The retreating flow from the novel double OWC is shown in Figure 17. While the flow retreats from the front OWC, the directions of flow in the regions J and K are same. On the other hand, for the rear OWC, the flow characteristics are similar to the retreating flow in the opposite OWC. Once again high energy flow is observed in the front OWC. The flow around the Savonius rotor as the flow enters the front and rear OWC is shown in Figure 18. It is clear from Figure 18 that high energy flow is available to the rotor in the front OWC than the rotor in the rear OWC. In addition, the size of the re-circulating regions between the rear rotor blades is much larger compared to the front rotor blades. The flow characteristics in the front OWC and the rear OWC are similar to the flow characteristics observed in the normal OWC and opposite OWC respectively. As expected, the front rotor performs better than the rear rotor because the power produced by the rotor is dependent on the energy of the flow it receives. The flow characteristics are better in the front OWC than the rear OWC. This ultimately determines the performance of the Savonius rotor. This can be quantified by looking at the dynamic torque acting on the front and rear rotors as shown in Figure 19. The more energetic flow in the front OWC imparts higher momentum to the rotor hence increasing it torque while the less energetic flow in the rear OWC imparts far too little energy onto the rotor thus producing lower torque.
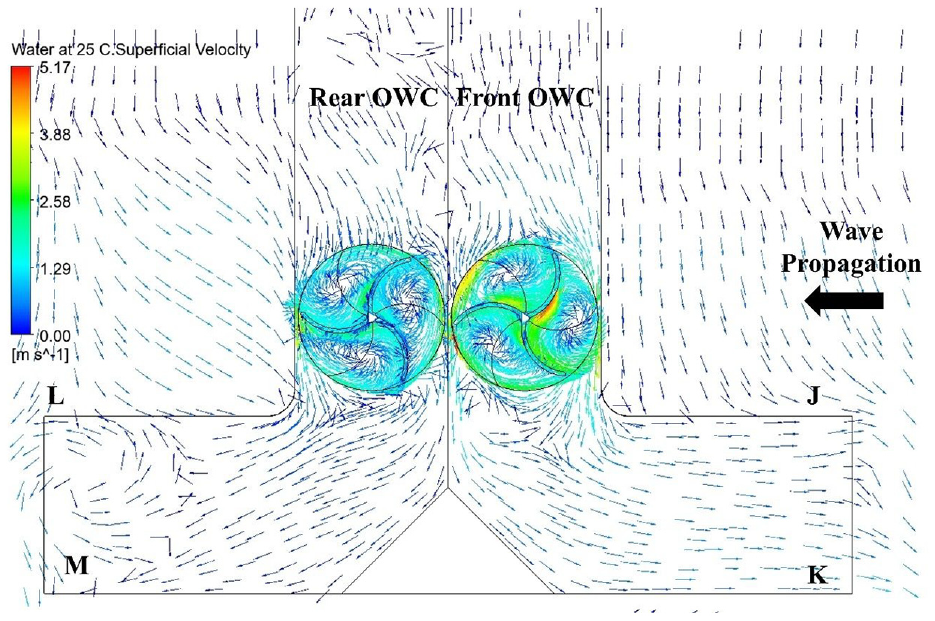
Retreating flow from the novel double OWC at the mean sea state.
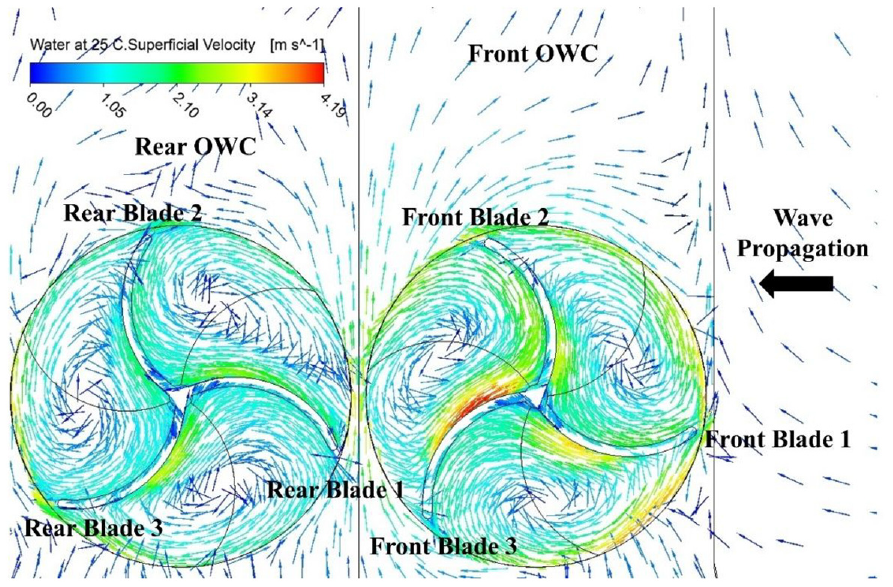
Advancing flow past the rotors in the novel double OWC at mean sea state.
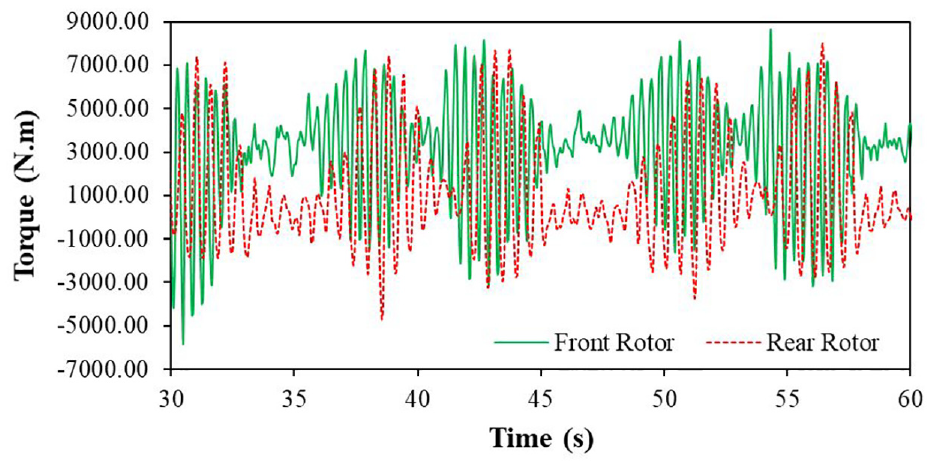
Dynamic torque acting on the front and rear rotors at peak power condition for mean sea state.
The performance of the Savonius rotors in the front OWC and the rear OWC is shown in Figure 20. From the experiments it was determined that the rotational speed of the Savonius rotor in the front OWC and the rear OWC was 17% lower when compared to the rotational speed of the rotor in the normal OWC and opposite OWC. As a result of this, for the double OWC the optimum rotational speeds of the front rotor and the rear rotor were set to 50 and 35 rpm respectively. Further speeds on either side of the optimum speed were chosen to confirm if these were indeed the optimum rotor speeds. It is clear from Figure 18 that the peak occurs at 35 rpm for the rear rotor and the power and efficiency corresponding to this are 5.4 kW and 6.4% respectively. For the front rotor, the peak power and efficiency are 14.1 kW and 16.5% respectively at 50 rpm. There is a decrease of 24% in the peak power produced by the rotor in the front OWC when compared to the normal OWC. On the other hand, the peak power reduces by 48% in the rear OWC when compared to the opposite OWC.
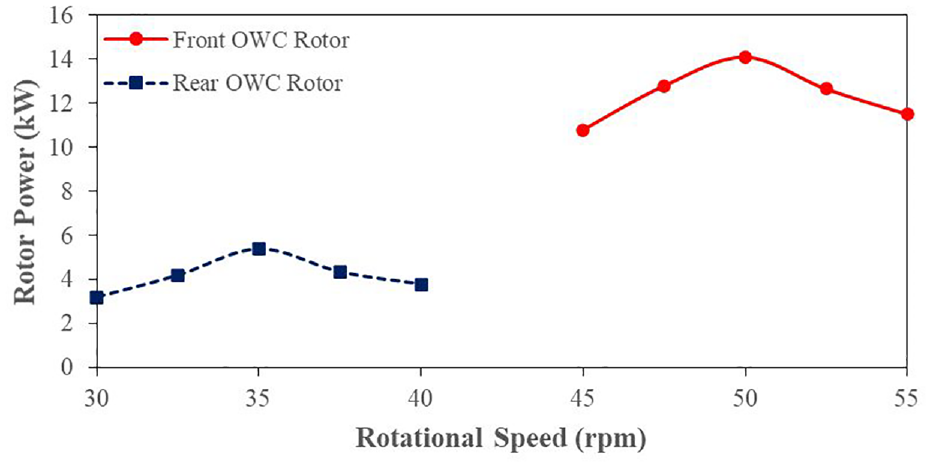
Performance of the front and the rear rotors in the double OWC at mean sea state.
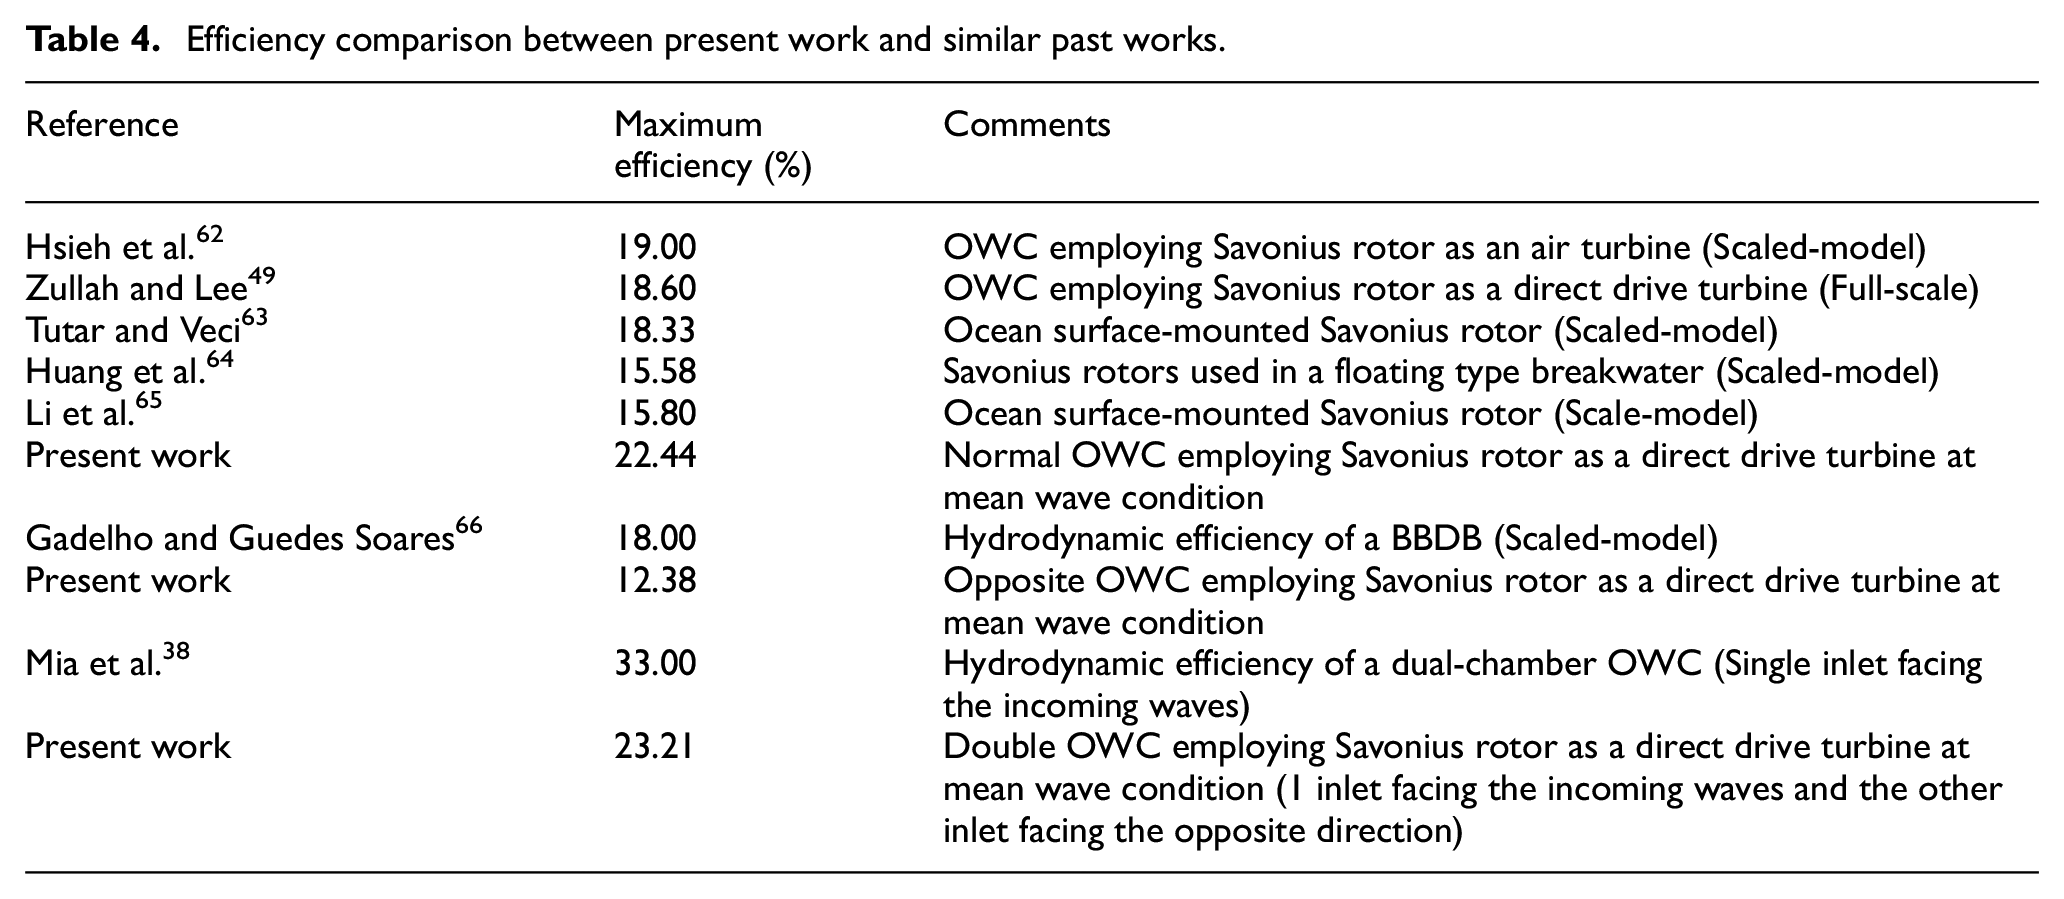
Mia et al. 38 reported a decrease of 23% and 44% in the hydrodynamic efficiencies of the seaside and leeside chambers respectively when compared to the single chamber unit (seaside chamber width was same as the leeside chamber width). Lower power outputs from the interior chambers were also reported in Shalby et al. 37 Therefore, the performance of the novel double OWC is comparable. The combined peak power produced by the double OWC device at the mean sea state is 19.5 kW compared to 18.85 kW of power produced by the normal OWC at the mean sea state. This represents an increase of 3.45% in the power production. Ning et al. 61 had also reported improved performance of the dual chamber OWC when compared to the single chamber OWC. The efficiencies achieved in the present study are compared with similar works, and the comparison is presented in Table 4. The efficiency obtained in the present work agrees well with published works.
Efficiency comparison between present work and similar past works.
Currently the front and rear OWCs are identical. The energy available to the rear OWC is influenced by the front OWC and the distance between the opening of the rear OWC from that of the front OWC. The waves propagate quickly from the front OWC to the rear OWC. The current result provides an insight on how to enhance the performance of the novel double OWC device. The rotor geometry can be modified to ensure higher energy extraction from the low energy flow experienced in the rear chamber. Additionally, the chaotic flow structure observed at the inlet of the rear OWC can be aligned to flow effectively into the rear chamber by using a bell-mouth nozzle. This will mitigate the energy dissipation and lead to higher rotor performance. Furthermore, the rear OWC geometry is similar in nature to the backward bent duct buoy (BBDB). Hence it is possible to improve the double OWC performance by modifying the rear OWC chamber geometry. The length of the rear chamber can be increased in the wave propagating direction. Baanu et al. 44 and Sheng 45 reported that increasing the duct length can lead to improved performance. The rear OWC chamber draught can also be increased to increase the volume flux which could improve the rotor performance as mentioned by Ning et al. 61 Finally, the future works would include: (i) studying the performance of the novel double OWC with bell-mouth nozzles at minimum, mean and maximum sea states, (ii) studying the performance of the novel double OWC under different sea states, and (iii) investigating the effect of rotor solidity on the performance of the novel double OWC.
Conclusions
Initially, the CFD code was validated by comparing the computational results with the experimental results. The results showed good agreement with both the experimental results and mathematical models. The current numerical code was able to capture and predict the flow characteristics in the OWC accurately. Then the performance characteristics of the full-scale OWC devices were investigated. The orientation of the OWC had a significant effect on the performance of the Savonius rotor. For the normal OWC a maximum power of 18.85 kW which corresponds to an efficiency of 22.44% at 60 rpm was recorded at the mean wave condition. At the maximum sea state, the maximum power and efficiency were 20.24 kW and 16.43% respectively. On the other hand, for the opposite OWC peak power and efficiency were 10.4 kW and 12.38% respectively for the mean sea state. For the maximum sea state, the maximum power was 10.9 kW with an efficiency of 8.69%. The maximum rotor power recorded for the opposite OWC configuration was 50% less when compared to the maximum rotor power recorded for the normal OWC. The reduction is purely due to the flow characteristics and the energy of the flow received by the rotor in the opposite OWC configuration. Looking at the flow characteristics in the novel double OWC, the flow in the front OWC had more energy compared to the flow in the rear OWC for both advancing flow and retreating flow. The optimum operating speeds for the front OWC rotor and the rear OWC rotor were 50 and 35 rpm and maximum power outputs were 14.1 and 5.4 kW respectively. The combined peak power produced by the double OWC device at the mean sea state was 19.5 kW when compared to 18.85 kW of power produced by the normal OWC at the mean sea state. This represented an increase of 3.45% in the power production.
Supplemental Material
sj-xlsx-1-pim-10.1177_14750902241299585 – Supplemental material for Performance improvement of a full-scale oscillating water column device by employing a novel double oscillating water column
Supplemental material, sj-xlsx-1-pim-10.1177_14750902241299585 for Performance improvement of a full-scale oscillating water column device by employing a novel double oscillating water column by Deepak Divashkar Prasad, Mohammed Rafiuddin Ahmed and Young-Ho LEE in Proceedings of the Institution of Mechanical Engineers, Part M: Journal of Engineering for the Maritime Environment
Footnotes
Declaration of conflicting interests
The author(s) declared no potential conflicts of interest with respect to the research, authorship, and/or publication of this article.
Funding
The author(s) received no financial support for the research, authorship, and/or publication of this article.
Sample data
A sample data file with the values of torque at different rotational speeds is uploaded with the paper.
References
Supplementary Material
Please find the following supplemental material available below.
For Open Access articles published under a Creative Commons License, all supplemental material carries the same license as the article it is associated with.
For non-Open Access articles published, all supplemental material carries a non-exclusive license, and permission requests for re-use of supplemental material or any part of supplemental material shall be sent directly to the copyright owner as specified in the copyright notice associated with the article.