
Abstract
Marine fuels are the main sources of pollution from shipping industry. Hydrogen and ammonia have been suggested to be alternative fuels for shipping as these two fuels do not emit carbon dioxides in the combustion process. This study employed life cycle assessment method to compare the environmental performance of propulsion systems using hydrogen and ammonia as marine fuels to fossil fuels. 2-stroke and 4-stroke engines of tankers using fossil fuels were chosen as base case scenarios. Alternative scenarios using ‘green’ and ‘blue’ hydrogen and ammonia with the support of pilot fuel were then compared to the base case scenarios. While the performance of the coming combustion concepts for hydrogen and ammonia engines are still unknown, preliminary estimations were used in this study. The results showed that hydrogen and ammonia could substantially reduce the global warming potential, compared with the fossil fuel scenarios. Hydrogen and ammonia are also expected to be highly effective in cutting down the particulate matter and the emission of black carbon.
Introduction
With the majority of cargo capacity transported by sea, marine transport plays an important role in international trade. 1 The pollution from shipping is gaining increasing attention, due to the huge amount of emissions exhausted from ship operation.2–4 IMO regulated air pollution in Annexe VI of the MARPOL convention. For example, Chapter 3 regulations 13–15 limit NOX, SOX and VOCs from shipping. 5 Chapter 4 regulations 19–28 address the greenhouse gas emissions from fuel use, with IMO Lifecycle GHG – carbon intensity guidelines currently under development, and expected to be agreed upon at MEPC 80 in 2023.
Shipping decarbonization is a critical part of meeting the Paris Agreement target: to meet global warming to 1.5°C and to build a zero-emissions planet. 6 IMO’s ambitious GHG target is to reduce the CO2 emissions per transportation work from the shipping industry by 40% by 2030 and 70% by 2050, in comparison to 2008. The vision and ambitions of IMO within this century is to achieve zero-emissions goal. 7 The initial IMO strategy is divided into three periods: short-term 2018–2023, mid-term 2023–2030 and long-term 2030–2100. Considering that the life span of cargo vessels is 25–30 years, the present is the right time to find new emission reduction mechanisms for the shipping industry to achieve the ambitious target. Marine fuels are crucial actors and have important roles in IMO’s strategy.
Nowadays, the huge amount of fossil fuels, for example, HFO, MDO, LNG, etc. used in the shipping industry is the main contributor to greenhouse gas emissions to the atmosphere. Some new solutions are suggested to lighten the impacts from shipping on the environment. These include alternative fuels (H2, NH3, methanol, etc.), hybrid propulsion systems, carbon capture and storage techniques, renewable energy (from wind, solar or wave).8–11 The benefits of these solutions need to be further discussed as each solution has both advantages as well as limitations. Among the alternative fuels in shipping, NH3 and H2 seem to be competitive candidates as the combustion of these fuels does not emit the carbon emissions. 12 However, from a life cycle perspective, the upstream process (production phase) of these fuels needs careful consideration.
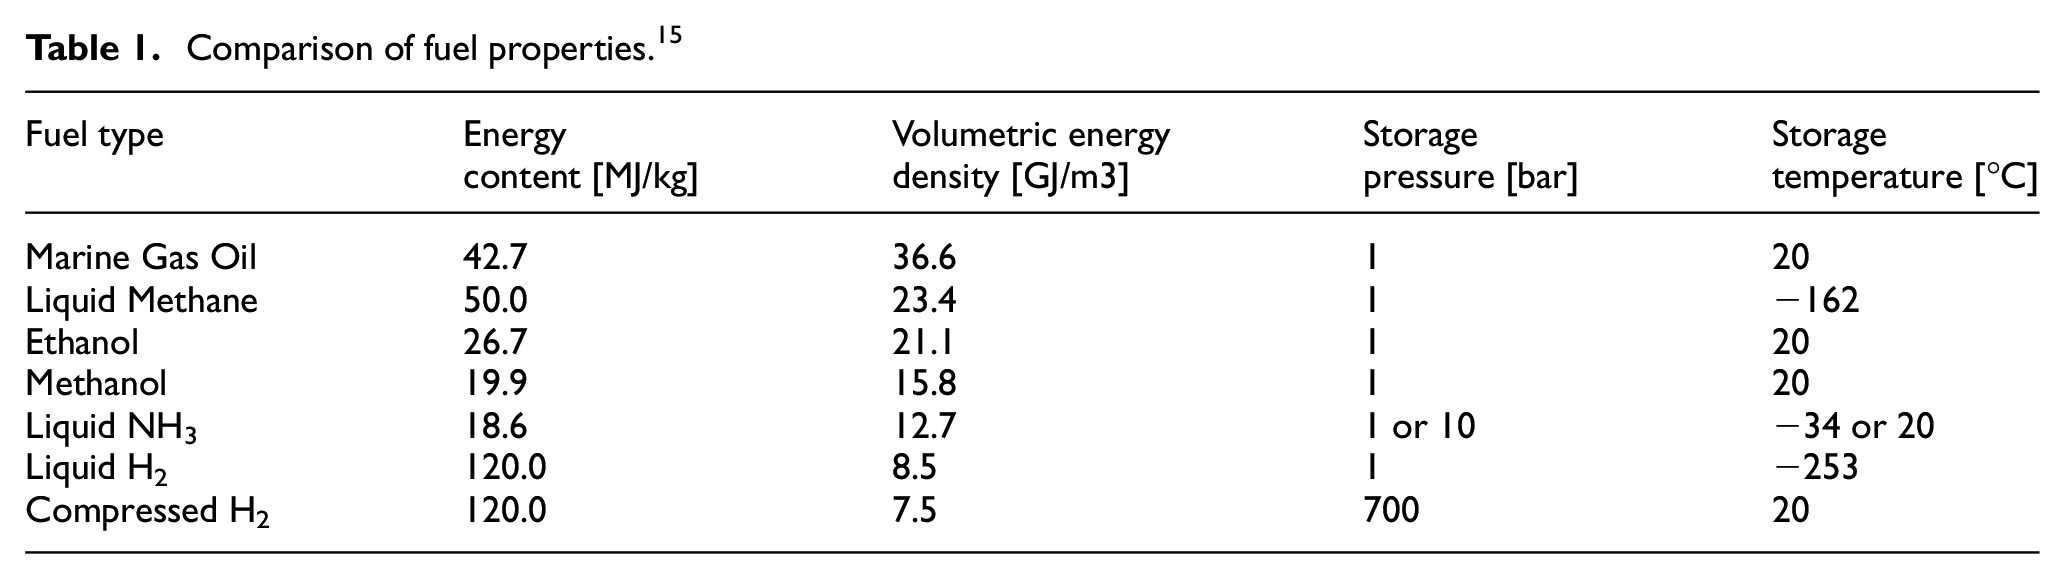
H2 is the most common chemical element and it is a promising option for green energy in the future. 13 The main product from H2 combustion is water, though depending on the process used, by-product of this process are NOX and the release of unburned H2. Currently, the majority of H2 is also produced by using the steam-methane reforming method with/without CCS technology. 14 H2 is also produced by using the water separation technique (electrolysis) using electricity and water. Even though renewable energy such as solar and wind energy can be used, H2 production still has impacts on the environment due to the need for land, material consumption in infrastructure, and the need for large investments. Another barrier of using H2 as a marine fuel is the storage of H2 on board. The space required for H2 storage is larger than the other fuels such as LNG, NH3 and MDO. 15 If H2 is stored in liquid form at very low temperature (−253°C) it either has a limited lifetime before the evaporation, or it requires additional energy for keeping in liquid form. 16 H2 can be stored in pressurized form, but has then a limited energy density (5.15 GJ/m3 at 800 bar), compared to 8.55 GJ/m3 in liquid form. 17 Given the higher energy density, liquid hydrogen was assumed to be the most appropriate form of bunkering for long-distance shipping in this work.
H2 and NH3 are often categorized using a taxonomy of different colour codes. ‘Grey’ H2 is produced from natural gas or coal by using steam-methane reforming or gasification processes. If carbon emissions from these processes are captured, the product will be ‘blue’ H2. The carbon capture rate by when producing ‘blue’ H2 is normally from 85 to 95%. 18 ‘Green’ H2 is produced by using electrolysis to separate H2 and oxygen from water using electricity from renewable sources (e.g. wind, solar, wave energy, etc.). Nowadays, the usage of ‘green’ H2 is still limited. 19
NH3 is produced by using a chemical synthesis technique, the Haber-Bosch process (Figure 1). The taxonomy of colour codes for NH3 depends on the type of H2 used in the synthesis process. Compared with H2, NH3 requires less space for on-board energy storage. Moreover, NH3 is also considered as a balanced solution with high volumetric energy and more practical storage characteristics (Table 1).
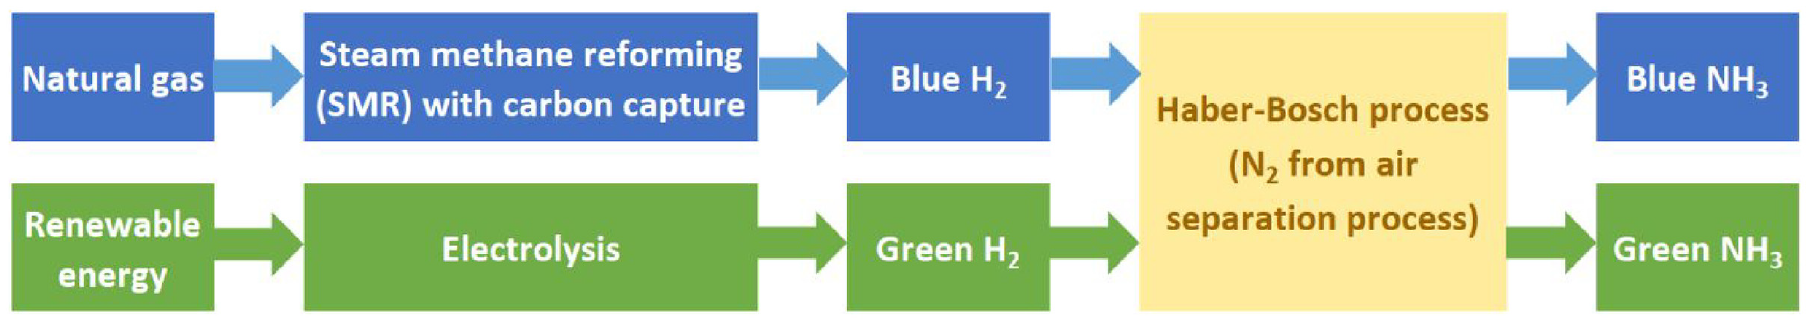
NH3 and H2 production processes.
Comparison of fuel properties. 15
The LCA is considered a comprehensive method to evaluate the environmental performance of a product or service. 20 This method has been applied in maritime industry recently. Bengtsson et al. 21 compared the LCA of LNG and the fossil fuels and indicated the need of LCA when estimating the environmental impacts of marine fuels. The LCA of alternative fuels were studied in.5,22,23 Recently, under the HyMethShip concept, the LCA method was also used to evaluate the environmental the performance of propulsion systems using onboard carbon capture technique.24,25 The framework of LCA of marine engines was established26,27 then were used to investigate the life cycle performance of a tugboat. 28 The reader should refer to a comprehensive review 29 for the application of LCA in maritime sector.
Some research papers also studied the environmental impacts of H2 and NH3. For instance, the comparison of blue H2 and fossil fuel was presented by Howarth et al., 14 showing that the use of blue H2 may lead to higher environmental impacts than fossil fuel. Perčić et al. 30 also indicated that the fuel cell system could reduce up to 84% of greenhouse gases when green NH3 is used. Bicer et al. 31 discussed the possibility of using H2 in shipping transportation from a life cycle perspective. Hwang et al. 32 compared the LCA of natural gas and marine gas oil for the ship operating in Korea.
By using LCA and life-cycle cost assessment, Perčić et al.33,34 and Fan et al. 35 showed that a battery-powered vessel has lower environmental footprint and low cost than a diesel engine-powered vessel. For fishing trawlers, Koričan et al. 36 indicated that soybean–biodiesel–diesel blend and LNG could reduce greenhouse gases and have positive impact on the life cycle cost.
To clarify the benefit of H2 and NH3 in shipping industry, this study employed the LCA method to investigate the environmental impacts of marine engines using H2 and NH3 as marine fuels (comprising both ‘blue’ and ‘green’ H2 and NH3). The results were compared to the environmental impacts of marine engines using fossil fuels.
The study is structured as follows. After the introductory part, the LCA method applied in this study is presented in Sections 2 and 3. Results and discussion are presented in Section 4 with the conclusions of this work drawn in Section 5.
Life cycle assessment
This study is a comparative attributional LCA study and impact assessment, based on the IPCC and CML2001 impact assessment methods. Five environmental indicators such as GWP100, GWP20, AP, EP, POCP were calculated as these indicators are mostly concerned by maritime industry regulations. 37 Calculations and results were obtained from LCA for Experts (GaBi) software application and database. Procedure to obtain the results from are following.
(1) Finding the necessary processes/flows for the life cycle of the marine from the database (ecoinvent, Sphera).
(2) Connecting processes to establish life cycle model.
(3) Running model. GaBi has tools and many useful functions (including sensitivity analysis) which helps LCA practitioners to get results easily.
Goal definition
As presented above, the reason for carrying out this study is to compare the environmental impacts of H2 and NH3 with the usage of fossil fuels. The applications are to provide information to the research community and assist decision-making process in selecting the alternative fuels for decarbonization purpose. Maritime stakeholders, naval architects, ship-owners, policy makers, and the public are the intended audience of the study.
Figure 2 illustrates the diagram of system boundary and life cycle phases of marine engines. The life cycle of marine engine consists of the phases of material and fuel production, the operation and maintenance phase, production phase and end-of-life phase. In this study, the maintenance activities and human factor are ignored in order to simplify. The inputs and outputs of the life cycle are energy, materials, and emissions flows.
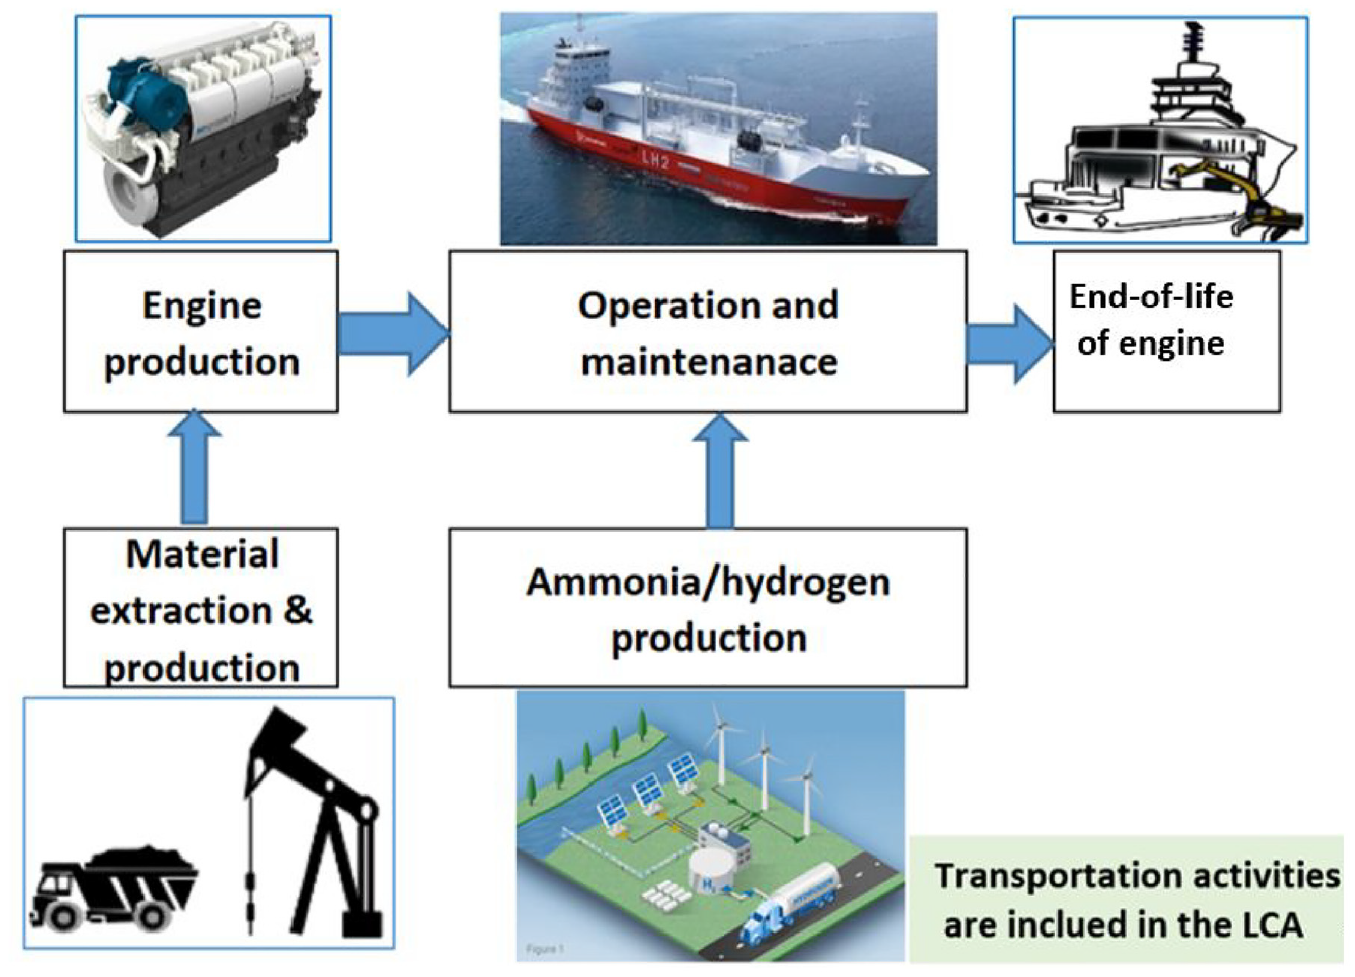
Life cycle phases of a marine engine.
Functional unit definition
The investigated product in this study is a main engine of ship, of which, the main function is to create energy in combustion process to propulsive the ship. The functional unit chosen is 1 kW hour (1 kWh) delivered to the propeller shaft. The results will be presented per one kWh, for example, kilogram of CO2 eq./kWh.
Eight scenarios
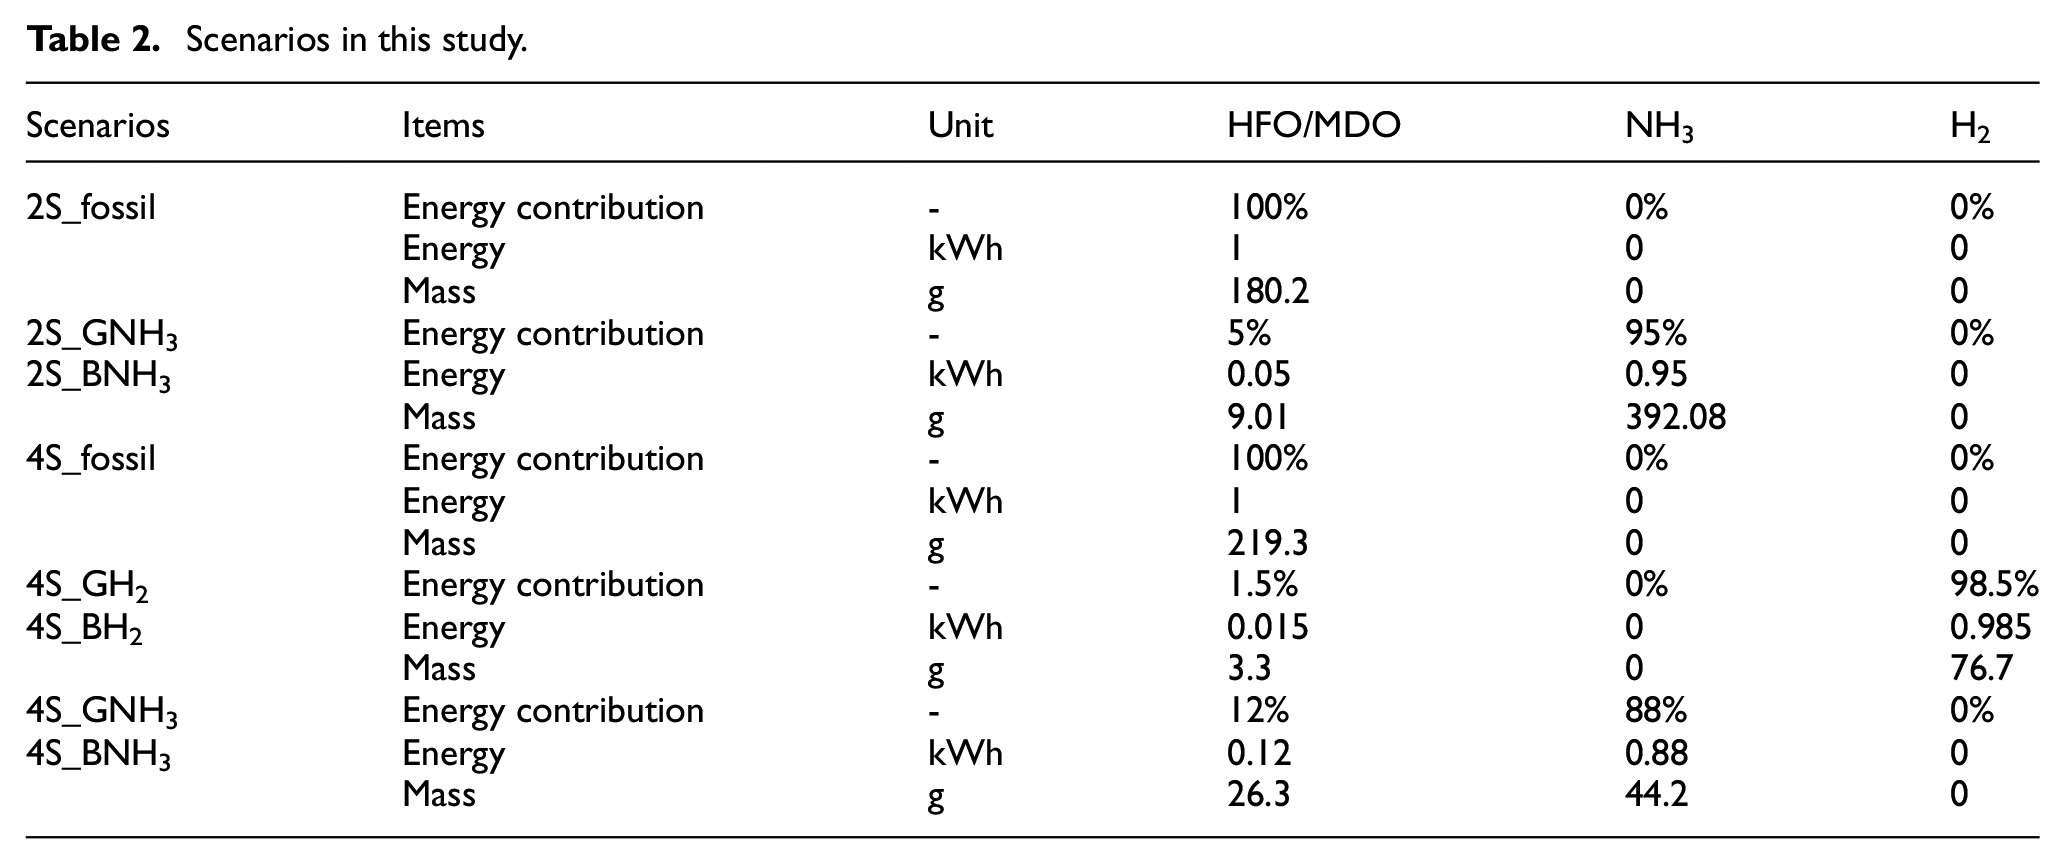
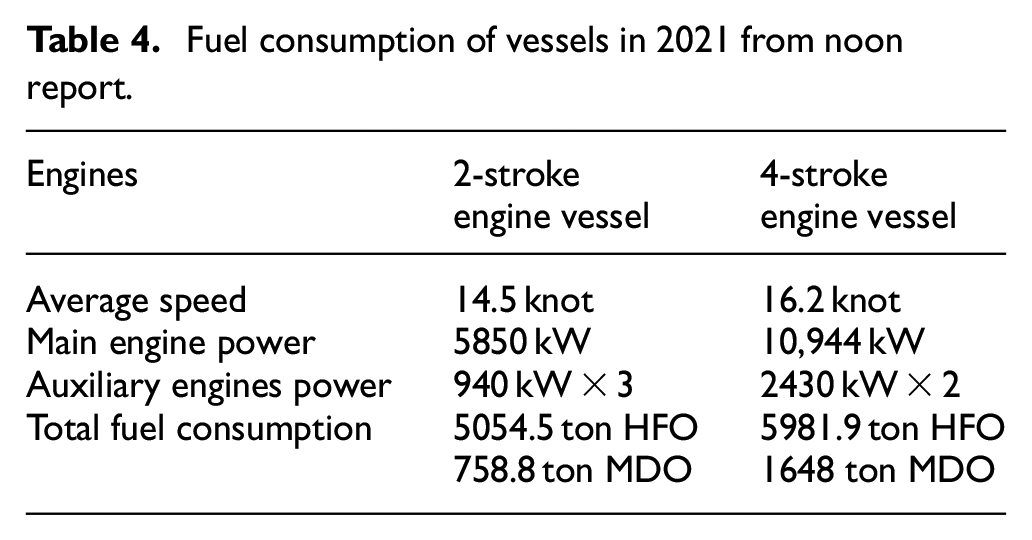
In this study, eight scenarios with different marine fuels and engines were investigated (Table 2). 2S_fossil and 4S_fossil scenarios were chosen as the base case scenarios with 100% of fossil fuels used on ship. The scenarios and the fuel consumption of the ships were based on the real ship operation using chemical tankers (Stolt Tankers B.V.). Some difference exists in the size and age of the vessels and engines, given practical limitations of data and variations in vessel and engine size in the fleet. The 4-stroke powered ship consisted of a 37,059 DWT Chemical & Oil Carrier built in 2001 using a 9-cylinder 4-stroke engine with 320 mm bore and 350 mm stroke. It had a maximum continuous power rating of 10,944 kW. In the H2 scenarios, H2 (only in 4-stroke engines) were used as main fuel with 1.5% MDO necessary (percentage fraction given by energy content) as pilot injection along the balance of H2 main fuel (98.5%). NH3 scenarios used 88% NH3 as main fuel. The two-stroke engine ship consisted of a 33,723 DWT Chemical & Oil Carrier, built in 2017 using a 5-cylinder engine with 500 mm bore, 2500 mm stroke, and a maximum continuous power rating of 5850 kW. The fraction of pilot fuel injection was assumed to be 5% MDO with 95% NH3 as main fuel.
Scenarios in this study.
The fossil fuel and NH3 scenarios were updated with the inclusion of SCR technologies in order to meet the requirements in the NOX emission limits of Regulation 13 of MARPOL Annexe VI. The estimation will be 15 g of urea per 1 kWh could reduce 90% NOX. 38 The application of SCR affected the results of NOX emissions as well as the GWP in the LCA of marine engines. Since the interest towards NH3 and H2 as competitive candidates to reduce carbon emissions from shipping only gain larger attention in recent years, there are not yet consistent emission data available. Within the coming years new insight to the emission levels from NH3 and H2 with different engine technologies will very likely be published.
Assumptions and limitations
Assumptions and limitations are inevitable in LCA studies due to the numerous datasets and information in the product’s life cycle. In this study, assumptions and limitations are listed as below:
Only steel was considered as the material used to produce the vessels’ main engines, the secondary materials such as copper, aluminium, etc. were ignored.
The transportation mode used for transporting fuel from fuel production site (Porsgrunn, Norway) to the port (Port of Amsterdam, the Netherlands) was ocean-going vessels with the distance of 800 km.
The vessels and main engines will be retired and dismantled after 25 years operating at sea. In this study, end-of-life of the engine is considered.
Waste management and generation during the engine’s life cycle were not considered.
Primary emissions
Most emissions from the shipping industry are released as exhaust gases and these emissions have impacts on the environment, leading to effects on the climate, human health and the marine environment among other. Since emissions to air are the most important emissions the foreground system is limited to the emissions to air. The list of primary emissions includes CO2, PM, CH4, NOX and N2O. Most of these emissions were investigated in the GHG report of the IMO. 39
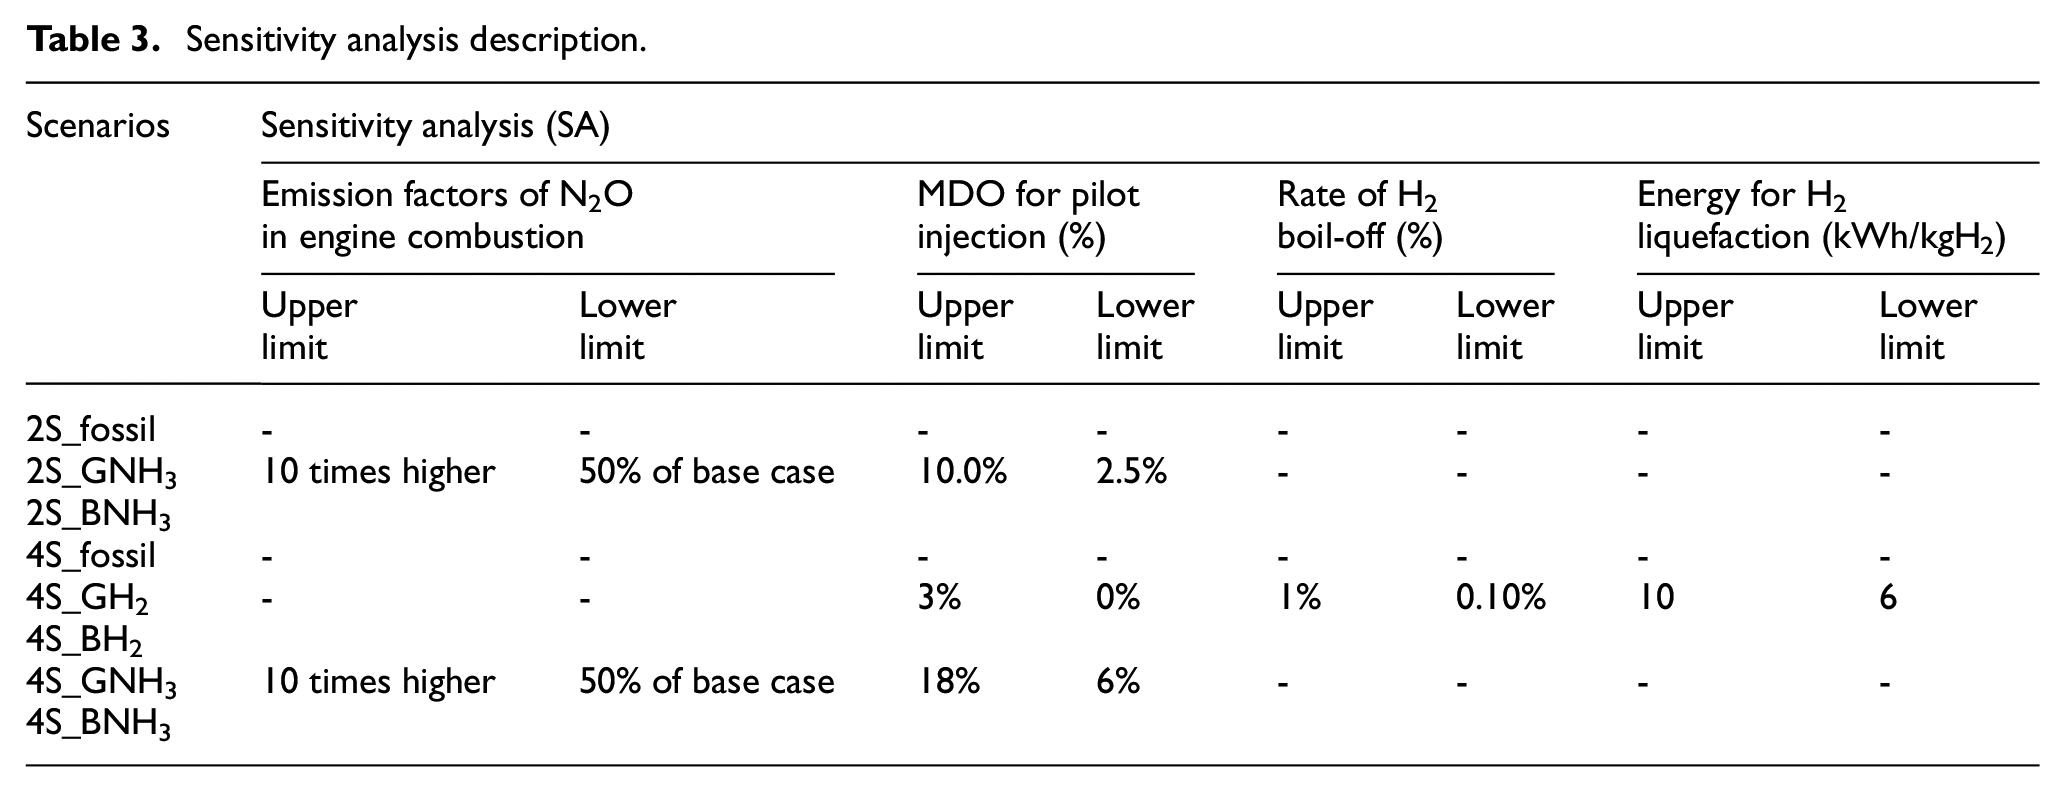
Sensitivity analysis description
In order to validate the robustness of the results, sensitivity analyses were preformed (Table 3). First, the rate of MDO used for pilot injection process was analysed for the H2 and NH3 scenarios. Second, the percentage of H2 boil-off, which depends on the length of vessel’s voyages and the boil-off H2 rate (from 0.1% to 1% per day), was considered. 40 In the initial stage, 0.5% boil-off H2 per day was used. The H2 boil-off can lead to the extra fuel consumption due to the increase of energy used for re-liquefaction. Third, CO2 capture rate in CCS technology (from 85% to 95%) and the energy demand for H2 liquefaction (from 6 to 10 kWh/kgH2) 41 were also taken into account in the sensitivity analysis. Moreover, the N2O emission factor in engine combustion were considered in this part.
Sensitivity analysis description.
Life cycle inventory
The life cycle inventory consists of the mass, energy and emission information for all inputs and outputs of life cycle system for the fossil fuels, H2 and NH3 engines. The data for this part were provided by GaBi software and data providers. Data were also collected and gathered from literature such as publications, technical reports, etc.
Fuel production and transportation
Fuel production database is available in GaBi software and database. After production phase, fossil fuels was transported by ocean-going vessels with the distance of 800 km to the refuelling station. H2 and NH3 were assumed to be produced in Porsgrunn, Norway. These two types of fuels were assumed to be transported by sea going vessel with the same distance with fossil fuels to the refuelling station.
In this work, the production of ‘green’ H2 used the electricity from wind energy in Norway. In order to produce 1 kg of gaseous H2 by electrolysis method, 192 MJ of electricity are consumed. After that, 36 MJ of electricity were assumed to be used for H2 liquefaction process (1 kg H2). 42
Steam reforming methane (or natural gas) is used to produce blue H2. The carbon capture and storage in this process consumes 42.1 MJ/1 kg of H2. 43 In this study, we assumed that 90% of carbon dioxide are captured in the H2 production.
‘Blue’ H2 was assumed to be used to produce ‘blue’ NH3 by applying Haber-Bosch process. 0.824 kg of nitrogen from air separation, 0.176 kg of H2 and 1.17 MJ of electricity 44 are consumed in order to produce 1 kg of NH3. 45 The liquefaction process of NH3 consumes less electricity than H2, only 3.01 MJ/kg NH3 (estimated by the authors).
The final production step in the production of ‘green’ NH3 is similar to that of ‘blue’ NH3. The ‘green’ H2 and energy are used with the same assumption as ‘blue’ NH3 production for the Haber-Bosch synthesis step.
Fuel combustion and ship operation
The fuel consumption was obtained from operational data for the year 2021 (Table 4). The average fuel consumption over 1 year was 180.2 g/kWh for the two-stroke engine case, and 219 g/kWh for the 4-stroke engine case, based on the vessel data.
Fuel consumption of vessels in 2021 from noon report.
Emission factors in ship operation are gathered from IMO’s GHG report 39 and estimated from some publications (Table 5). As H2 and NH3 are carbon-free fuels, using H2 and NH3 in this phase does not emit CO2, CH4, black carbon, and CO. In addition, using H2 and NH3 can eliminate PM10, PM2.5, SOX and NMVOC emissions. However, a small amount of N2O and NOX is still generated due to the combustion of NH3 and nitrogen. There are also some un-burned H2 and NH3 emitted to the air in this phase. However, the data for tank-to-wake for H2 and NH3 are very limited and it can be different. This will be considered in the sensitivity analysis of this study.
Emission factors in fuel combustion process (kg emission/kg fuel).
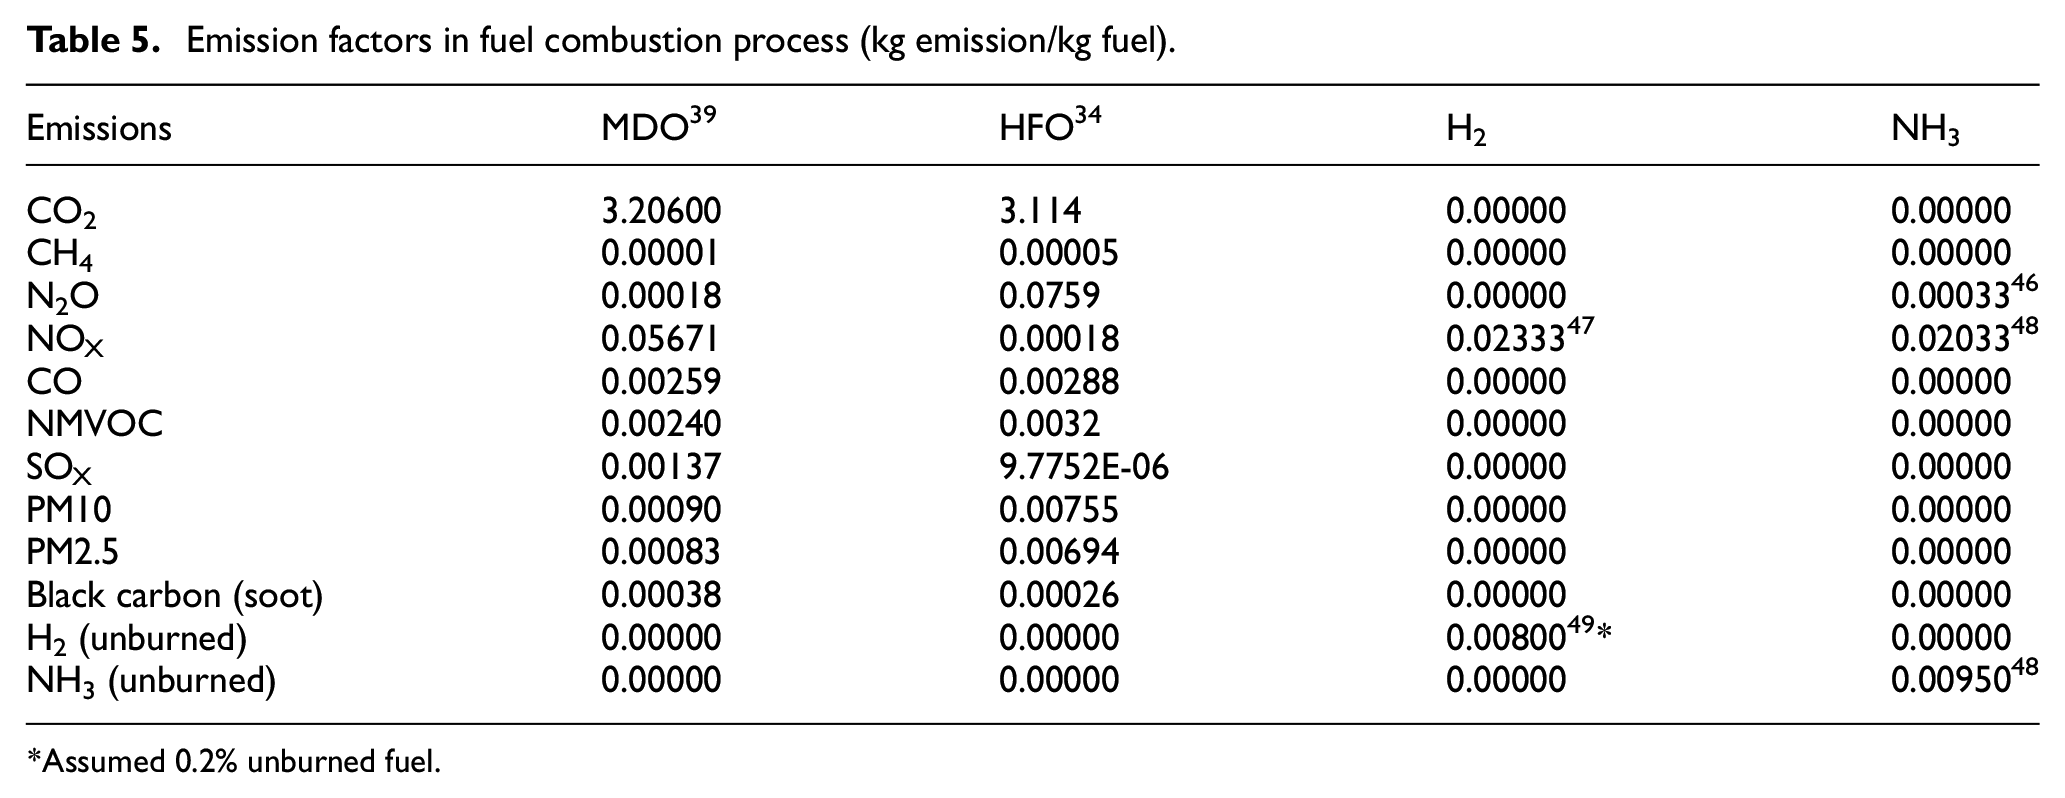
Assumed 0.2% unburned fuel.
Material used in engine production
The cradle-to-grave life cycle of material was considered in this study. It included mainly the raw material extraction and production. After 25 years of operation, the engine will be scrapped and used for recycling.
As the chosen functional unit is one kWh delivered to the propeller shaft, the amount of material considered per each functional unit is defined by dividing the mass of engine by the total energy produced in the engine’s life cycle (kg of steel per kWh). The secondary material such as aluminium, copper, etc. were excluded due to the small amount, compared to the mass of steel.
Results and discussion
Life cycle emissions
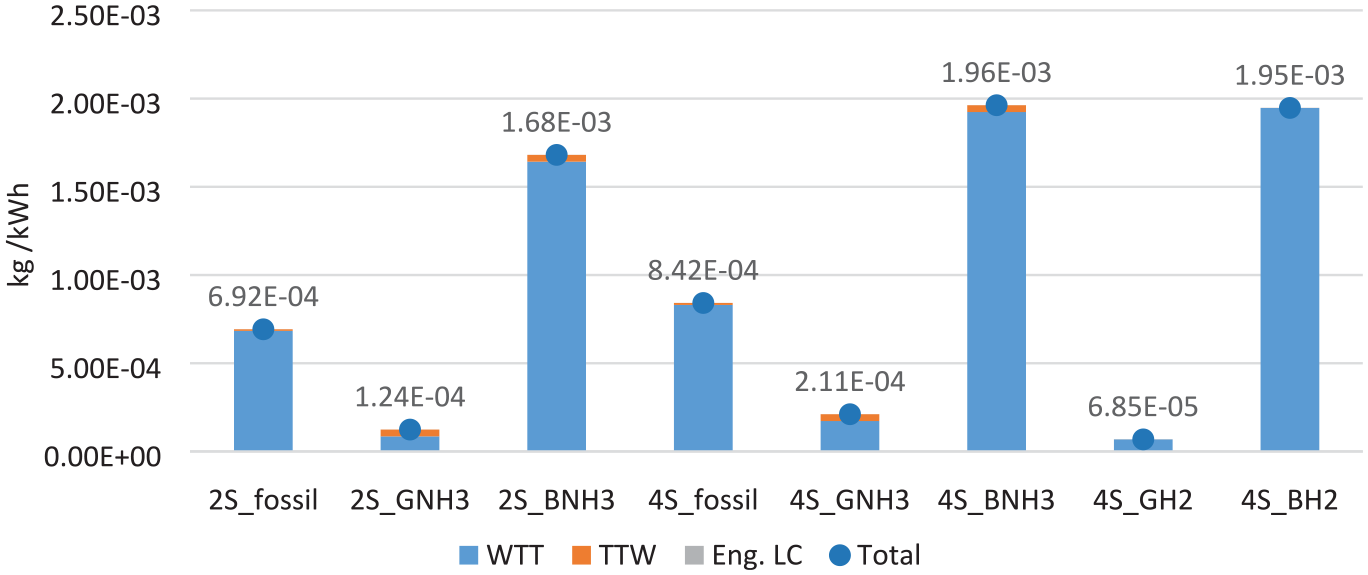
Figure 3 presents the contribution of life cycle phases to the total mass of CO2 in the life cycle of marine engine per unit of energy of shaft power delivered. Generally, CO2 emissions could be effectively reduced by using H2 and NH3 solutions, compared to fossil fuels scenario. However, for ‘blue’ H2 and ‘blue’ NH3, CO2 emissions from production phase (WTT) are much higher than for the WTT phase of fossil fuels.
Life-cycle CO2 emissions.
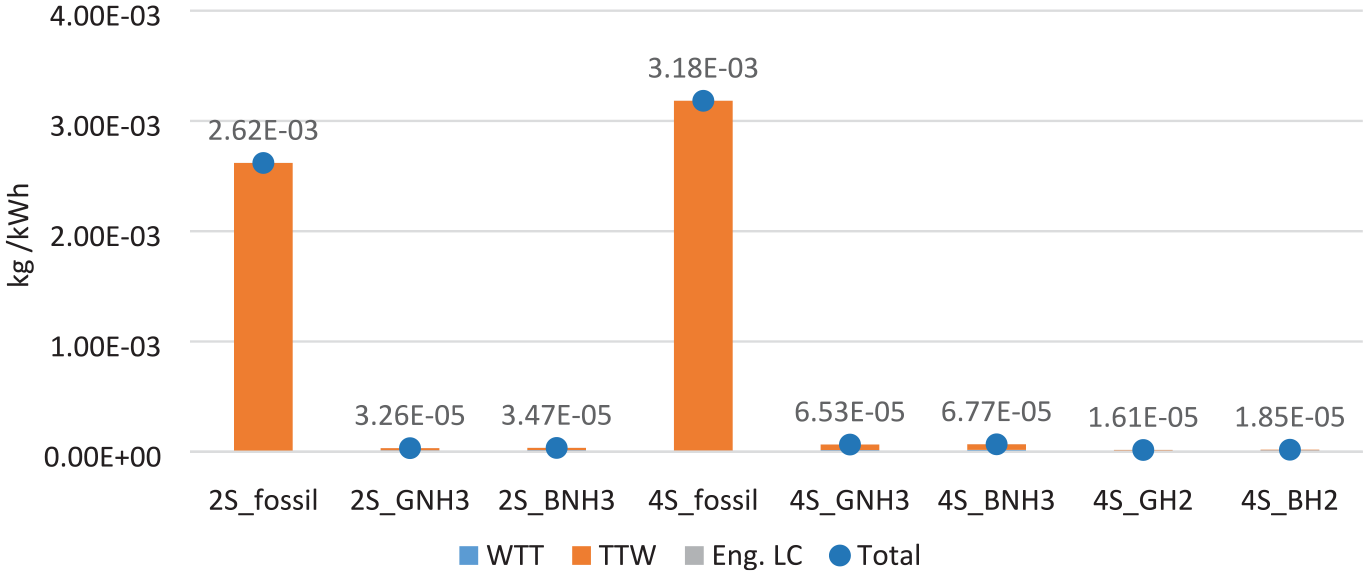
The CH4 emissions are emitted mostly from the production phase (Figure 4). It should be noted that, due to the use of grid-electricity in the production phase, the amount of these emissions for ‘blue’ solutions are much higher than the ‘green’ ones, even higher than the amount of CH4 in fossil fuel production phase.
Life-cycle CH4 emissions.
Figure 5 illustrates PM emissions from marine engine’s life cycle. The use phase of fossil fuels emit the higher amount of PM than H2 and NH3 scenarios. Meanwhile, the H2 and NH3 scenarios could reduce effectively these emissions. Regarding black carbon, fossil fuel scenario also generated much more amount of these emissions.
Life cycle PM emissions.
The application of NH3 in ship operation could increase the amount of N2O emissions (Figure 6). NH3 can only reduce a small amount of NOX (Figure 7) and SCR needs to be used in the scenarios of fossil fuels and NH3.
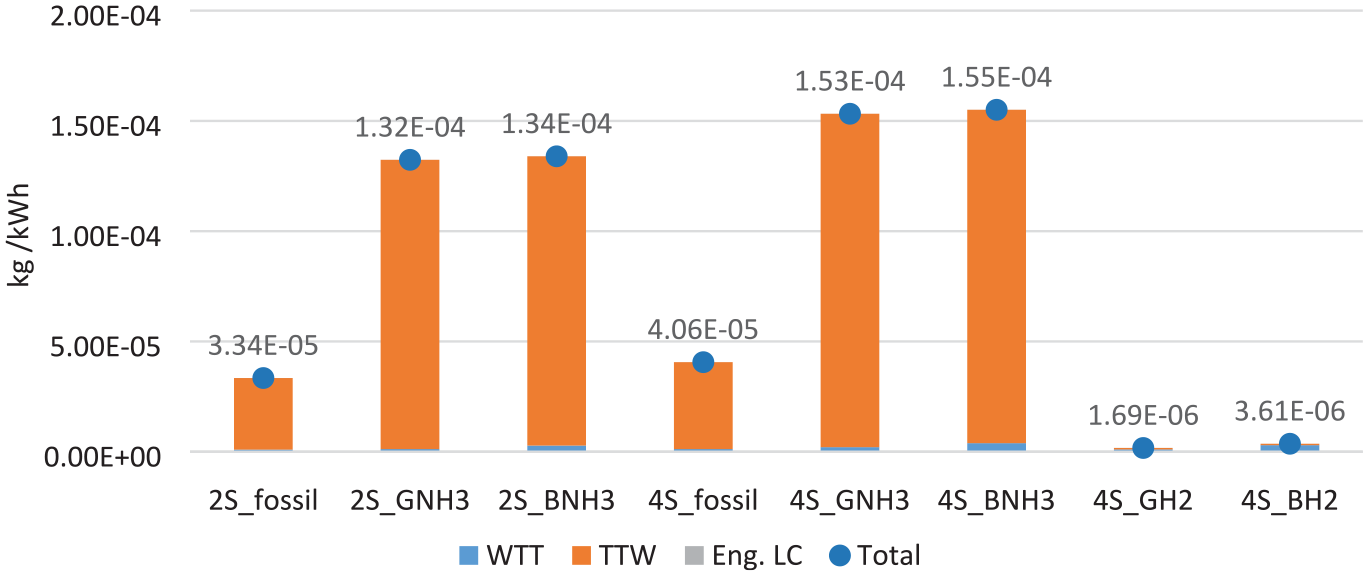
Life-cycle N2O emissions.
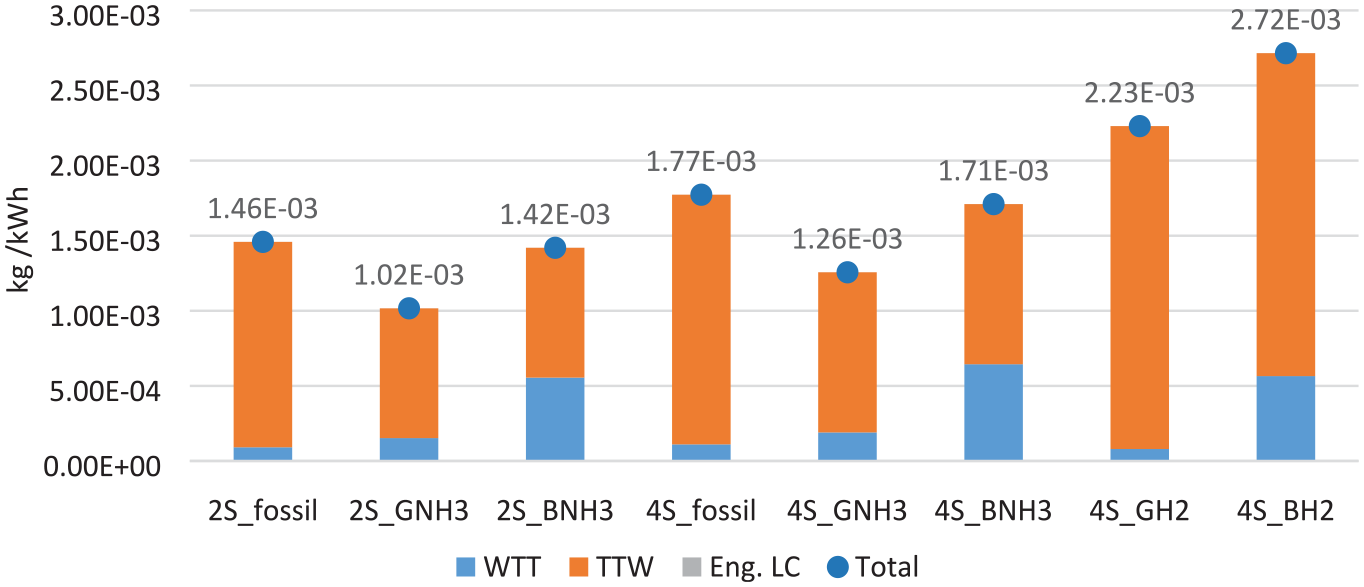
Life cycle NOX emissions.
Environmental indicators
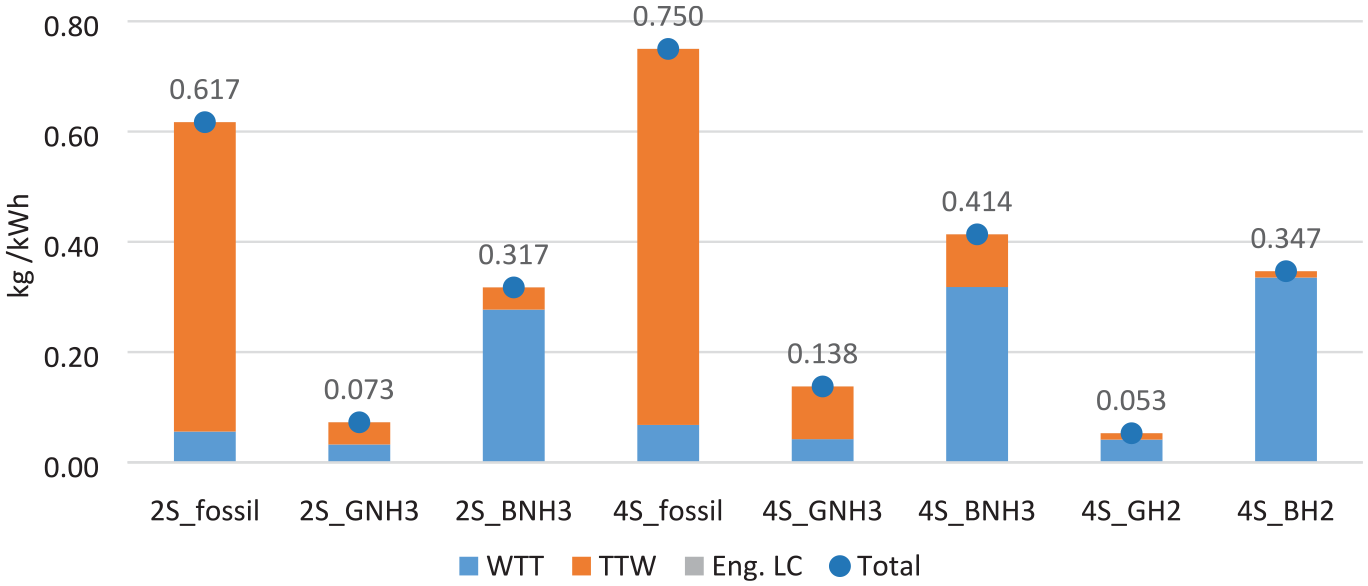
Figure 8 illustrates the GWP of eight investigated scenarios in this study. It is clear that fossil fuel scenarios have higher GWP value than H2 and NH3 solutions. More than 50% of GWP could be reduced by using green H2 or NH3 as marine fuels (Table 6). When using fossil fuels, most of GHG emissions are emitted from the tank-to-wake phase, meanwhile, the GHG emissions of H2 and NH3 depend on the production phases. For 4S_GNH3 and 4S_BNH3, the use of fossil fuels considerably increase the amount GWP.
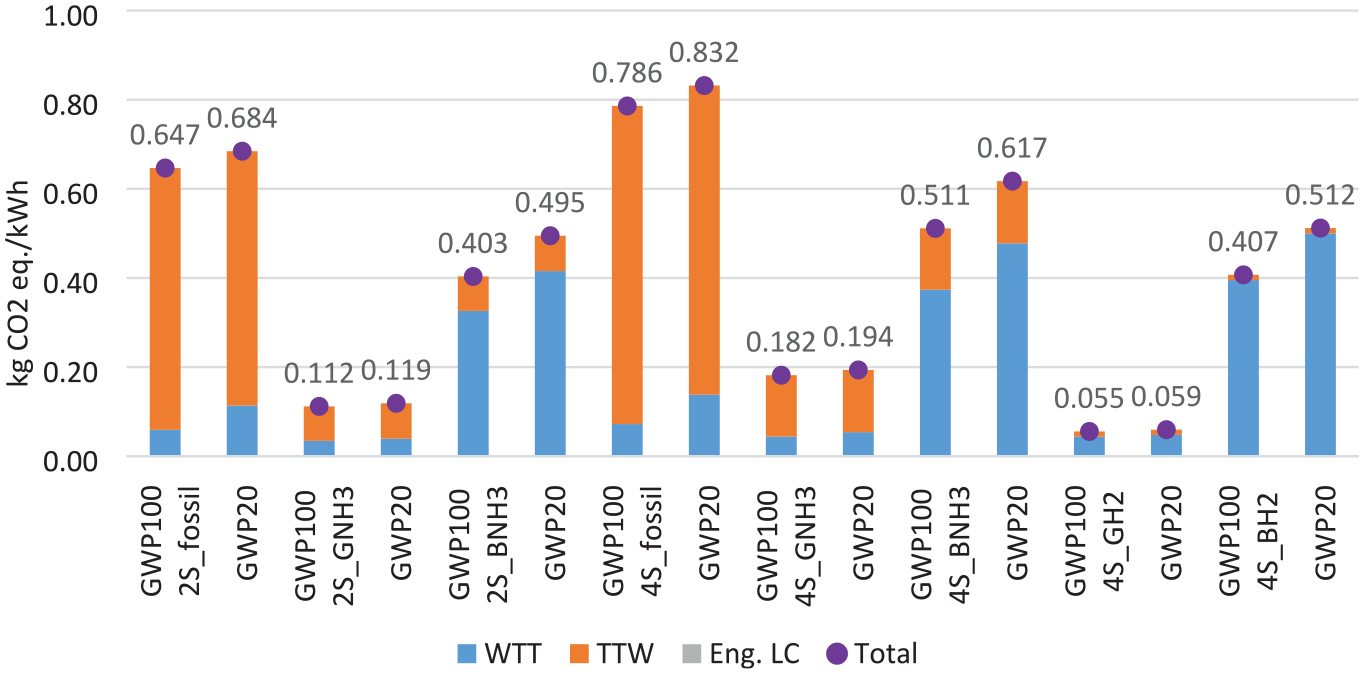
GWP results.
GWP comparison between eight scenarios (unit: kg CO2 eq./kWh).
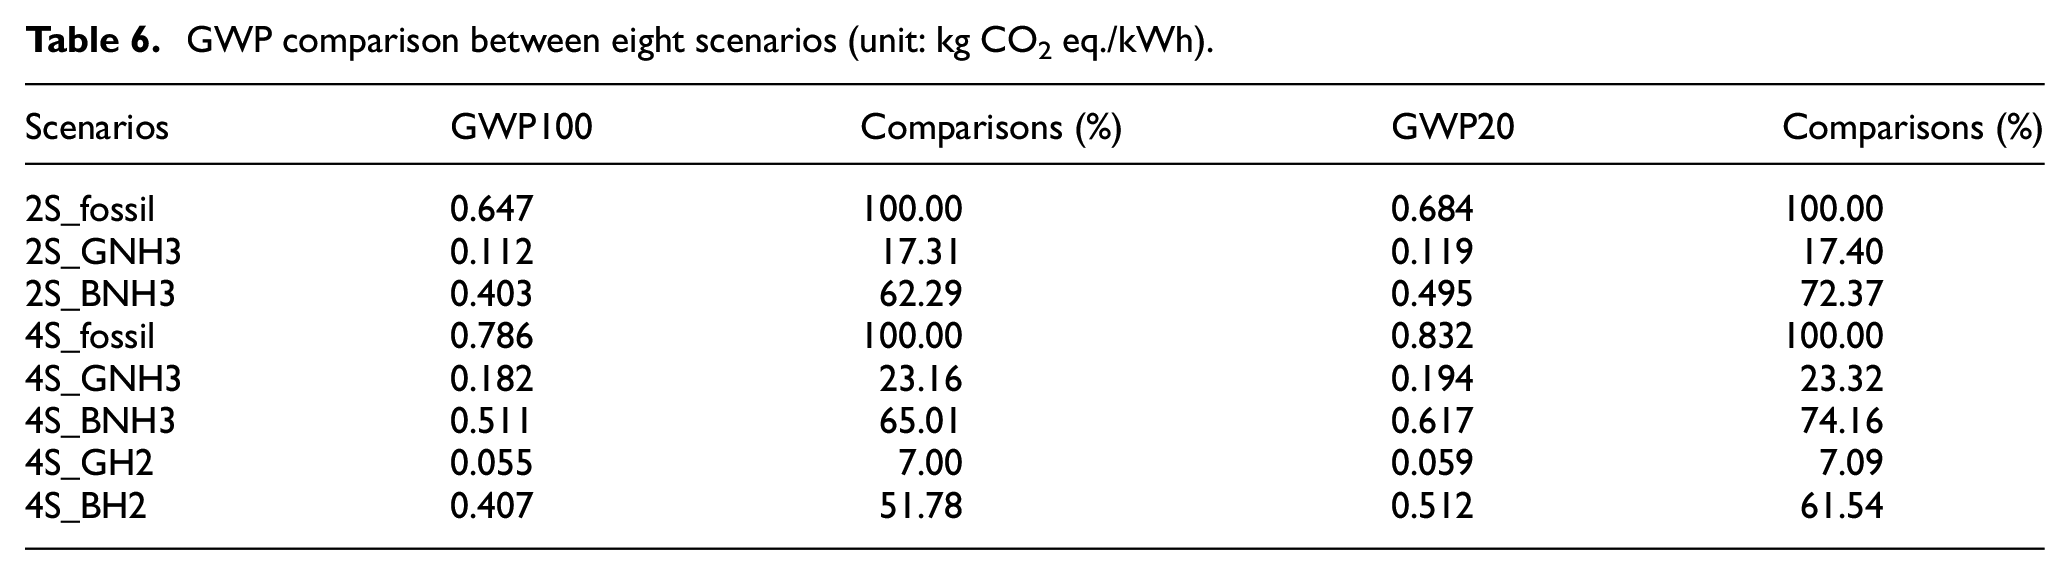
Table 7 summarizes the environmental indicators results. Although the use of NH3 as marine fuel could reduce the impact on climate change, it still has higher AP and EP values than fossil fuel scenarios.
Environmental indicators.
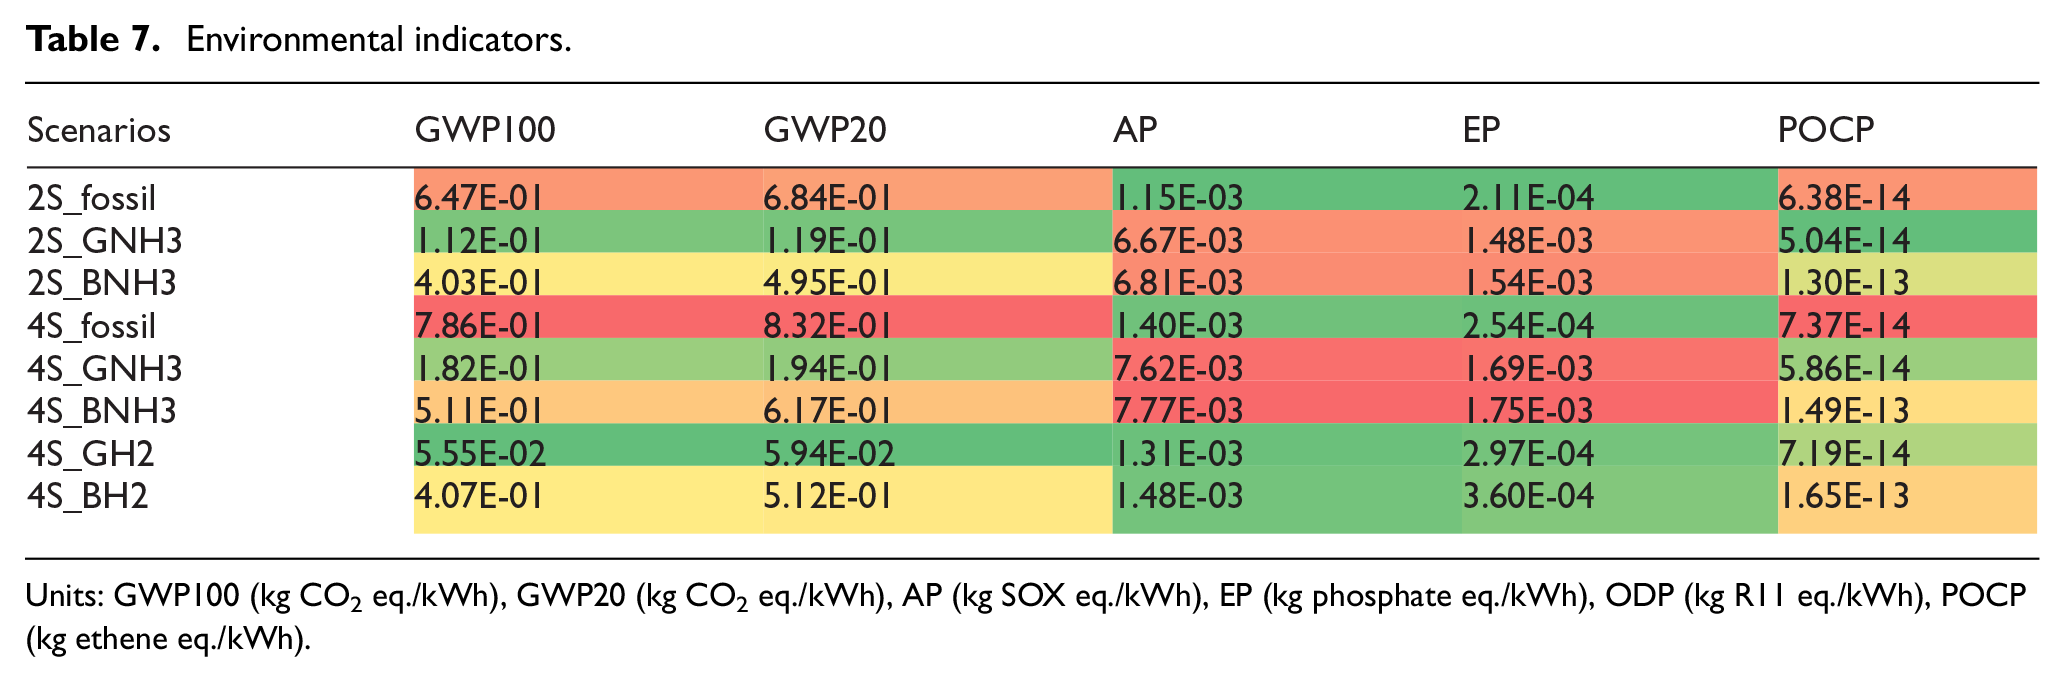
Units: GWP100 (kg CO2 eq./kWh), GWP20 (kg CO2 eq./kWh), AP (kg SOX eq./kWh), EP (kg phosphate eq./kWh), ODP (kg R11 eq./kWh), POCP (kg ethene eq./kWh).
Sensitivity analysis and black carbon
Figure 9 shows the sensitivity analysis of the GWP results. It can be seen that the most influential factor on the GWP results is N2O emission factor for NH3 scenarios. The upper N2O emission factor can lead to 70.1% increase in GWP100 in 4S_BNH3 scenario, which is higher than GWP100 of 4S_fossil scenario. Therefore, blue NH3 should be carefully considered when using as maritime fuel and the N2O emission factor is needed to be investigated to support the decision-making process. The results for NH3 scenarios are also greatly affected by the rate of pilot fuel, for example, 10% increase in rate of MDO leads to 23.1% increase in GWP20 value for 4S_GNH3 scenario. The green H2 and NH3 still show the lower value of GWP than fossil fuel scenarios.
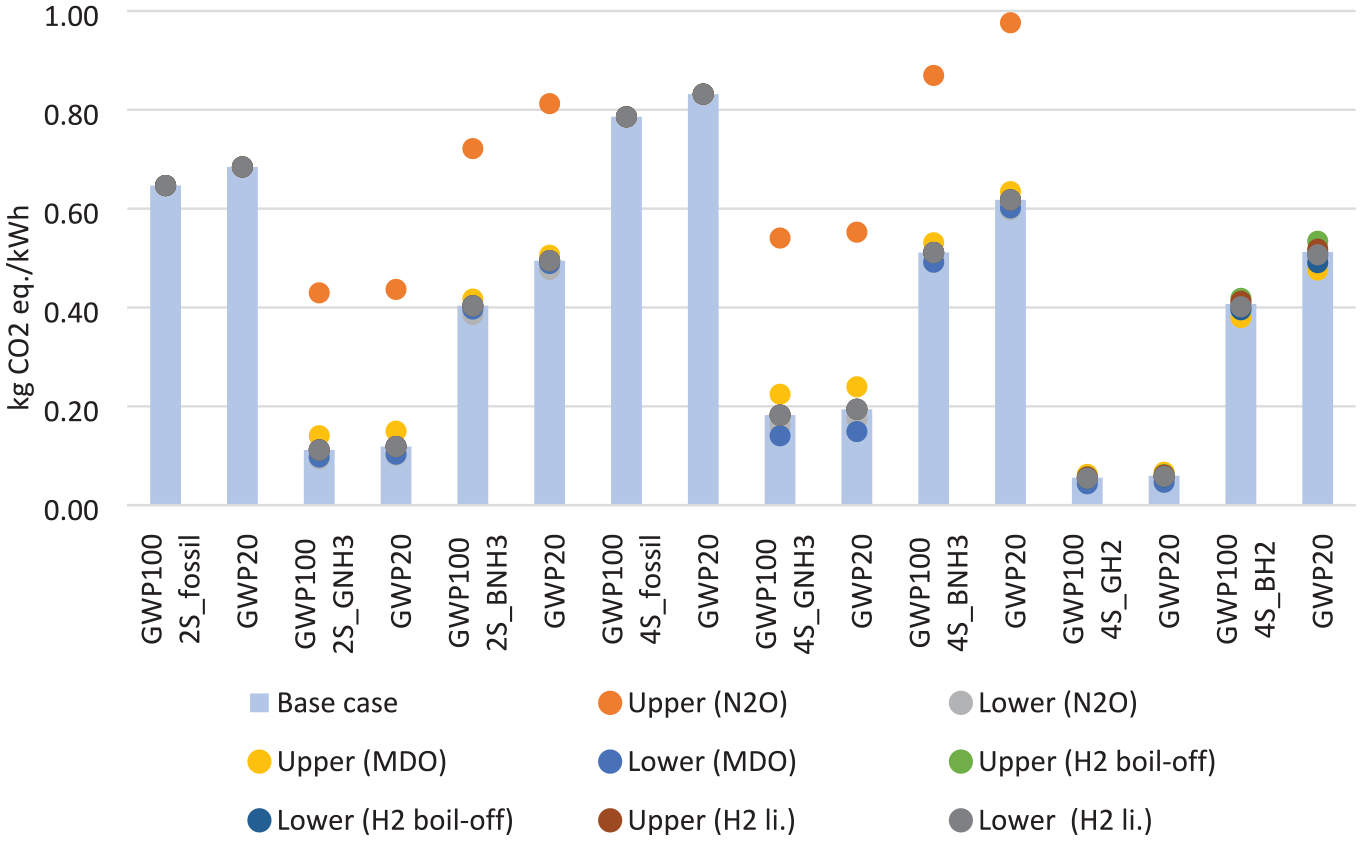
Sensitivity analysis of GWP results.
In case the characterization factors of black carbon for GWP100 and GWP20 are 1647.5 and 4470 50 respectively, the contribution of black carbon to the GWP results can be seen in Figure 10. The use of fossil fuels clearly bring the considerable impact of black carbon to GWP, especially to GWP20. Therefore, fossil fuel should be cut down in order to achieve the IMO’s decarbonization goals in 2030 and 2050. The rate and type of pilot fuel should be also considered and it depends on engine technologies in the future.
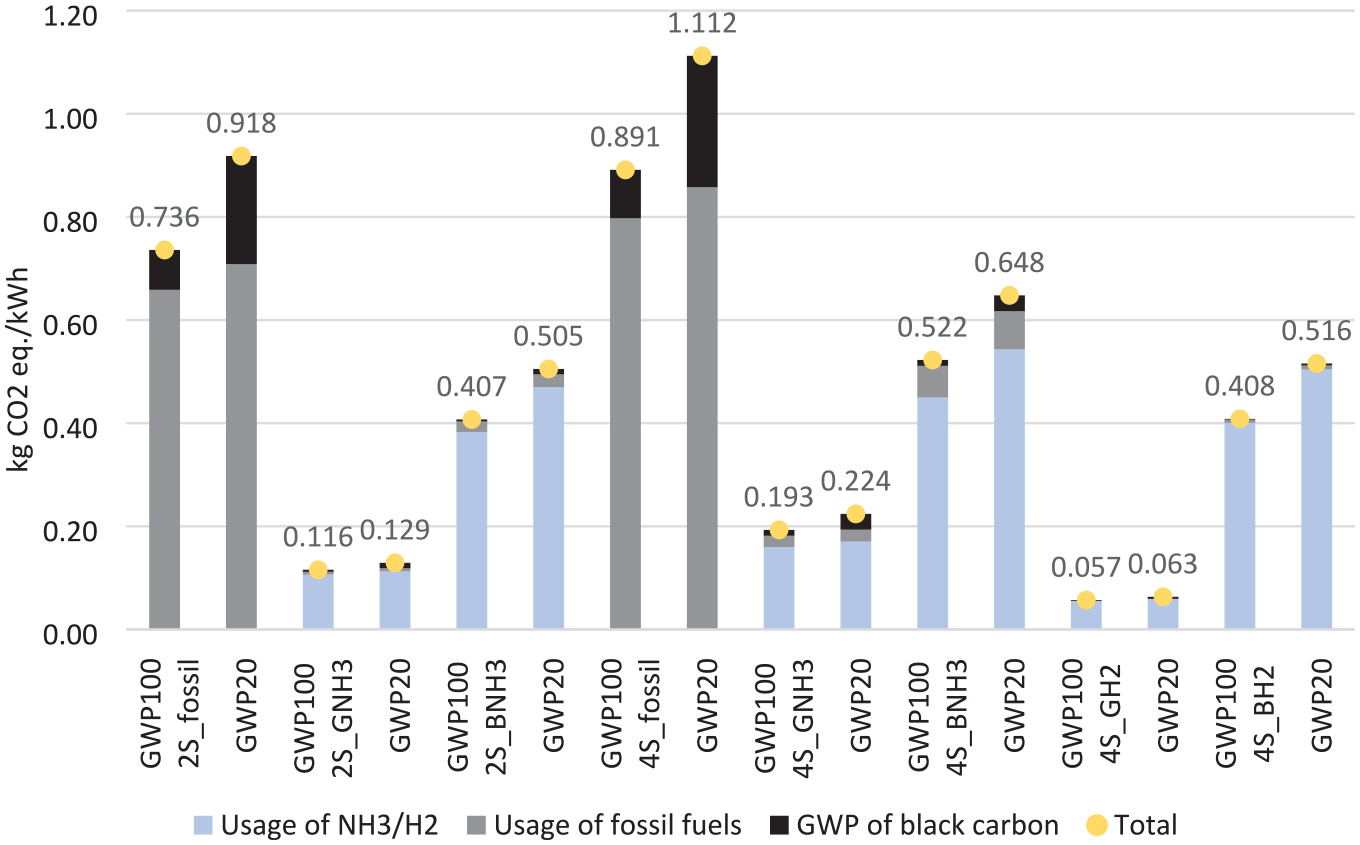
Black carbon effect.
The advantage of using H2 fuel is the lower GWP value, compared with NH3. H2 fuel also cuts down the amount of black carbon due to the small percentage of fossil fuels used in engines as pilot fuel. However, H2 fuel is now limited used in 4-stroke engine. The use of H2 on the ships that have long voyage should be carefully considered because of the boil-off rate of H2. These ships require considerable amount of energy to keep H2 on board and it could lead to the increase of GWP value of marine engines in the life cycle perspective.
Conclusions
The LCA methodology has been applied in this work in order to investigate the environmental performance of marine engines associated with eight scenarios using fossil fuels, ‘blue’ and ‘green’ H2 and NH3. In the LCA, the production of engine, fuel (well-to-tank), the usage phase (tank-to-wake) and the engine’s end-of-life were examined.
The initial results show that NH3 and H2 solutions could reduce the environmental impacts, in comparison with fossil fuels. The ‘green’ fuels are more environmentally friendly than the ‘blue’ ones. However, it should be noted that, the production of NH3 and H2 phases dominate the life cycle results. Different fuel production regions will bring different results in environmental performance of marine engines.
Due to the boil-off of H2 in the storage H2 on-board, penalty energy is required for the re-liquefaction process. Therefore, it seems that H2 fuel does not show its advantages for the longer voyage. The space used for H2 storage is also higher than NH3 case. Generally, H2 solution has less impact on the environment than the NH3 solution in the system boundary of our work.
The limitation of this study is that it does not consider economic and social aspects of hydrogen/ammonia engines. The results of this study represent the current state-of-the-art technology, and future technologies might bring further improvements in not only environmental aspects but also societal and economic performance.
To meet IMO’s ambitious GHG targets, it is clear that green NH3 and H2 are potential candidates for cutting down the emissions from the shipping industry. However, some significant issues that are required attention such as fuel infrastructure, marine fuel logistics, cost benefits, safety aspects, etc. This ensures the advantages of alternative marine fuel application towards the sustainable shipping industry in the future.
Footnotes
Appendix
Declaration of conflicting interests
The author(s) declared no potential conflicts of interest with respect to the research, authorship, and/or publication of this article.
Funding
The author(s) disclosed receipt of the following financial support for the research, authorship, and/or publication of this article: This work has received funding from the CAHEMA (Concepts of Ammonia and Hydrogen Engines for Marine Applications) project (application ID: 106982) funded by the Swedish Transport Administration (Trafikverket), Business Finland and The Research Council of Norway, as part of the Nordic Maritime Transport and Energy Research Programme.