
Abstract
This work aimed to test the feasibility, both experimentally and numerically, of a novel concept for a robust Wave Energy Converter (WEC) operating in the near-shore region. The converter uses a series of non-return valves, constrained by a tapered pipe, where the incoming wave builds up pressure in each compartment and finally drives a turbine onshore with the pressurised water. The device is aimed at remote communities, to gain energy security and reduce dependence on imports. The device facilitates local engagement, and it is intended that local people are trained to perform most maintenance tasks using low cost, readily available, parts. This work assessed the feasibility of the WEC through physical testing, the results of which were compared to initial numerical models. The device was shown to capture energy and, through a case study of Ushant Island off the coast of France, was shown to have the potential to become part of the future energy mix for remote communities.
Keywords
Introduction
Wave energy converters are a relatively immature technology when compared to others in the offshore renewables sector, with few concepts lasting to the stage of full-scale prototypes. It has the potential, however, to play a key part of the future energy mix with potential generation of up to 80,000 TWh/y, 1 of which up to 50 TWh/y could be achieved by the UK alone. 2 It is therefore essential that the costs associated with wave energy generation fall to a level where the Levelised Cost of Energy (LCOE) is comparable to other sources/technologies for it to become part of the global energy mix.3,4 The key areas currently keeping the LCOE of wave energy higher are the power take off system, grid connection, installation, and Operation and Maintenance (O&M).5–7
Current wave energy devices have previously been classified into three key categories – oscillating water column, oscillating bodies and overtopping. 8 Previous devices that are located in the near-shore region have been of the fixed structure oscillating water column or overtopping type. Devices such as LIMPET 9 are built into a bespoke breakwater with the wave impacts directly powering a Wells turbine. Other devices are built into existing breakwaters or harbour walls10–12 using either pressurised air resulting from the waves, or the water to directly power turbines. The Seawave Slot-Cone Generator 13 is an overtopping devices composed of three chambers, located at different heights. Each chamber has an opening, with the overall devices having an external ramp shape, to increase the water height and fill the internal chambers. A multistage low-head hydro turbine is then used to transform the potential energy of water inside each chamber into electricity. These devices have larger capital costs associated with the installation, and large decommissioning costs with the infrastructure challenging to remove and leave the site in the same condition prior to installation. They are also visible to the public and can be thought of as an eyesore.
Survivability of devices is key to ensure they can withstand the extremely aggressive environment inherent with highly energetic wave sites. Creation of a device that is both simple and robust is integral to reducing the requirement, and hence cost, of major maintenance. Simple devices with fewer, less complex, moving parts that also utilise proven, off-the-shelf, technology reduce the requirement for difficult maintenance tasks and lower O&M costs. 14 Installing devices in the near-shore region dramatically reduces the associated expense as no costly installation vessels are required.15,16 Equipment can be stored close by, on land, until a suitable weather window is available, as opposed to having a large vessel on hire for long periods of time. The power take-off unit can be based onshore, which provides protection and ease of maintenance, and means that an off-the-shelf unit can be employed further reducing costs. Utilising the devices in a local capacity, to provide energy security and independence for remote communities, will significantly reduce the transmission costs (both monetary and electrical losses). Small, local arrays may not be connected to the main grid. 17 The location of the WEC concept in the near shore will also significantly reduce any grid connection costs, with no requirement for dynamic cabling and subsea hubs. 16 Focussing the technology on local, smaller scale, projects for remote communities would also be a solid building block, and proving ground for the device, ultimately establishing the potential of the concept for scaling up to larger arrays more suited to developed countries.17,18
The aim of this work was to undertake a feasibility study and assess the practicability, both experimentally and numerically, of a novel concept for a robust wave energy converter (WEC) operating in the near-shore region. The device was designed to be simple, and robust, hence minimising the cost of maintenance, and planned to use as many off-the-shelf parts as possible. The device uses a novel system of tapered pipe and non-return valves to generate power. It is located in the near-shore region but, unlike breakwater mounted devices, minimises aesthetic impact with the majority of the device being submerged. This was achieved through experimental testing of a scale model device, and direct comparison of the results with a numerical model of the physical set up using ANSYS CFX 2020 R2.
The paper is structured as follows. Section 2 introduces the methodology used for both the experimental and numerical investigation, Section 3 presents the results of the experimental and numerical studies and Section 4 discusses the findings and the overall feasibility of the device as a wave energy converter for remote communities, with the findings concluded in Section 5.
Methodology
The Wave energy Converter (WEC) was conceptualised with the idea of reducing the complexity inherent with many such devices by utilising off the shelf components. The device is intended for operation in the near-shore region, to be simple and robust, with minimal visual and environmental impact, and relative ease of installation, maintenance and decommissioning. The device is based on a series of non-return valves, constrained by tapered pipe, with the incoming wave orbital velocities building up pressure in each compartment moving closer to the shore, Figure 1. This pressurised water can then be used onshore in a variety of ways for example, to drive a turbine, desalination of water, or to directly power simple hydraulic machinery.
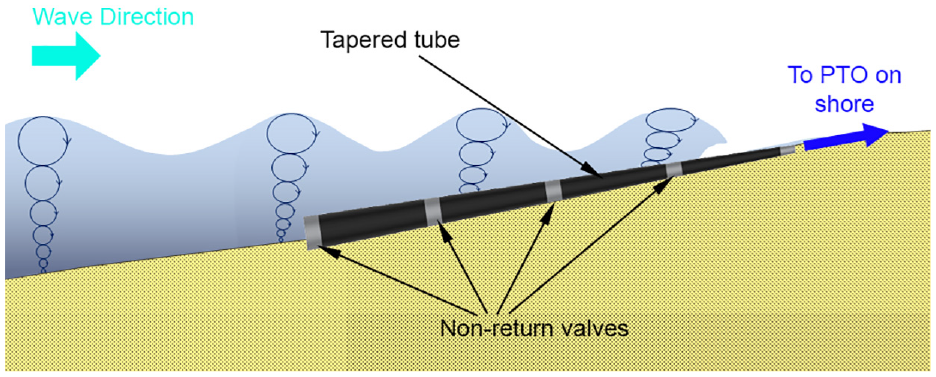
Schematic of the WEC concept.
To assess the WEC concept experimental trials and a numerical analysis were undertaken. The results from these were compared.
Experimental testing
The initial experimental trials were undertaken in the University of Exeter’s flume tank. The flume tank, Figure 2, has a working section of length 9 m, width 0.6 m and depth 0.6 m. In the case of the WEC trials the water depth was set at 0.3 m to ensure a shallow water wave, without overtopping the sides of the tank.
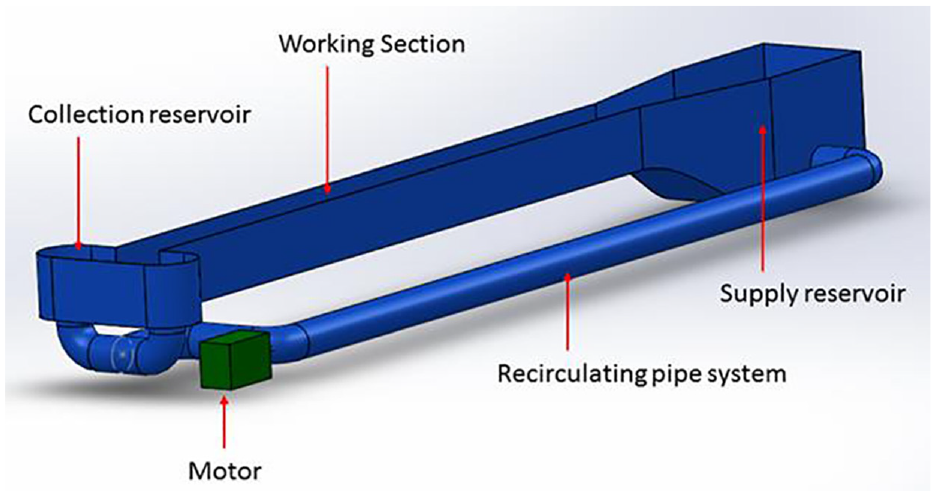
Schematic of the University of Exeter current flume tank showing the key components.
A model of the WEC, of approximate scale 1:10, was constructed for test in the flume. The scaling was approximate due to the availability of reasonably sized and reasonably priced off-the-shelf parts, that were also in budget, and did not result in excessive blockage effects in the test facility. The blockage ratio 19 of the 1/10th scale model was 0.4%. This blockage ratio was deemed small enough that effects could be ignored at this early stage of design. 20
This work was also an early-stage feasibility study; and therefore, should the device tests prove successful, optimisation and tuning of the dimensions to optimise power capture but enable use of readily available parts will be undertaken. Figure 3 shows a schematic of the experimental setup in the tank with the wavemaker wedge, WEC and beach highlighted.
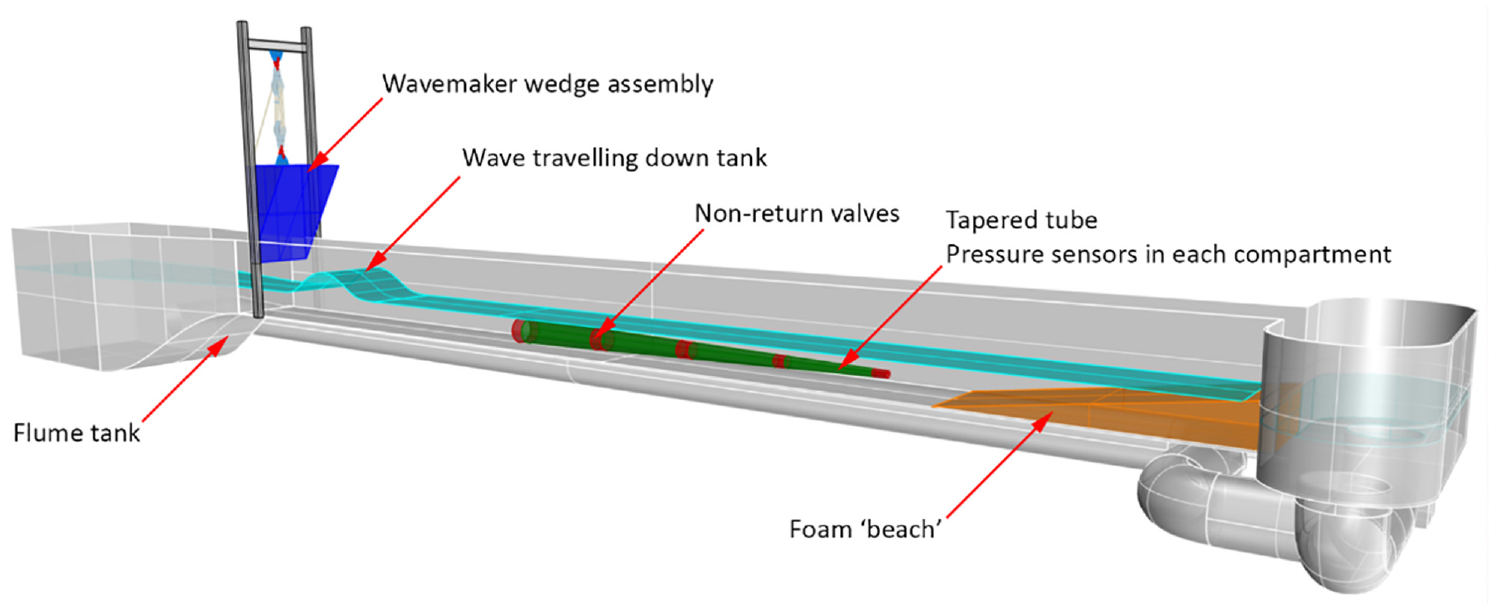
Flume setup with wavemaker wedge assembly, tapered tube WEC and beach illustrated.
A sequence of solitary waves was generated through a bespoke manufactured wedge drop wavemaker. The wedge was located at the boundary between the supply reservoir and the working section of the flume. The wedge itself was constructed from marine ply and had a height of 600 mm, width of 580 mm, depth of 600 mm, and the wave making face was at an angle of 45°. Extra lead weights were fixed into the base of the wedge to ensure a low centre of mass, and smooth operation. The total mass of the wedge and weights was 23 kg. A frame of aluminium box section was constructed over the tank, allowing a drop height of up to 1 m. Low friction, linear guide rails were affixed to the inner faces of the frame with the corresponding bearing blocks attached to the wedge.
The beach had a wooden frame, with 100 mm of 20ppi aquatic PPI filter foam sheet fixed to the top. It had a length of 1900 mm, a width of 600 mm, and a height of 270 mm. The sloped face was at an angle of 8°. Initial assessments using ANSYS CFX had shown that these were suitable dimensions for the beach to work properly and absorb the wave with minimal reflection of the water on the end of the tank. The beach was located just forward of the collection reservoir, with waves overtopping it into the reservoir and reflections kept to a minimum.
While off the shelf tapered tube does exist, it tends to be of very small diameter (circa 10 mm), or expensive aluminium extruded sections (yacht masts and booms). Tapered tube of the correct dimensions of the 1:10 scale WEC model was not available within budget and therefore straight sections of reducing diameter acrylic tube were used, with the non-return valves affixed at the joints between sections, Figure 4. There is the potential to use straight sections of tube with reducing diameters in the full-scale device, although it is thought that tapered tube may be more efficient. Each tube had a wall thickness of 3 mm and a length of 1000 mm. The first section had an outer diameter of 160 mm, the second 110 mm and the third 55 mm. The final non-return valve was fixed to a length of 25 mm clear plastic hose – this enabled a double check of the pressure build up through assessment of the water height in the hose after each run. The non-return valves were all swing check valves. This type of non-return valve requires the least pressure to open and seal, and as the pressures from the scale waves were likely to be small, they were considered the optimal choice. Four non-return valves were used with diameters 160, 110, 50 and 25 mm. Where the straight tube had a larger diameter than the valve, a tapered cork bung was used to connect the two and provide a seal. PCE Instruments TR-PS2W 5 bar pressure sensors were fitted into each tube, 0.7 m from the front face of the tube, to monitor the pressure build up between waves. The pressure data was recorded using a PCE-PDR 10 pressure data logger at a rate of 1 Hz.
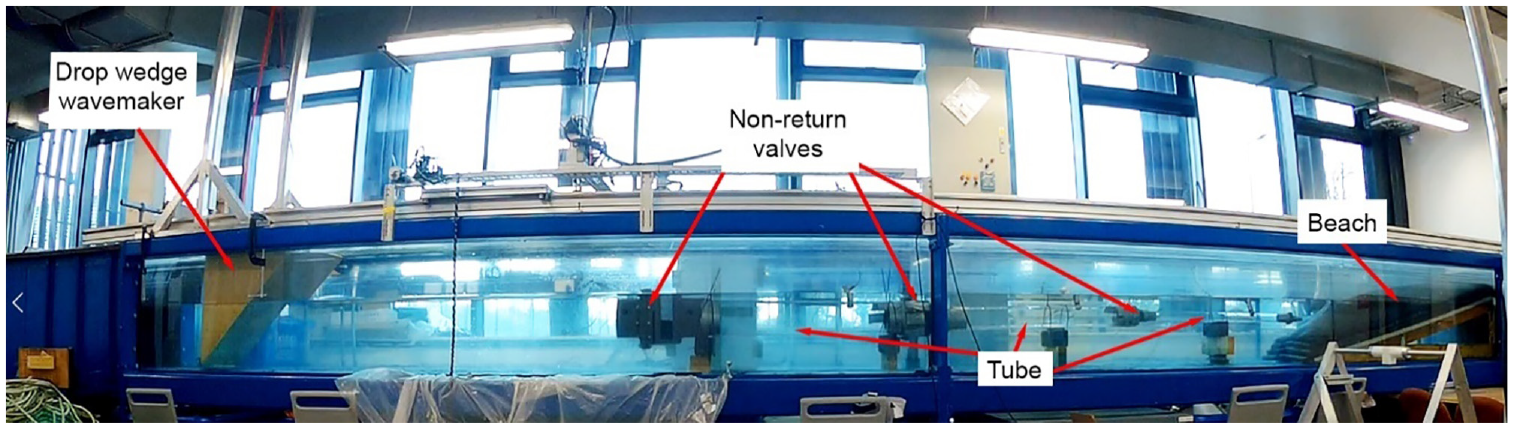
Experimental set up in the University of Exeter flume tank.
Numerical modelling
The purpose of the numerical model was to provide an initial base, from which design optimisation could occur. The initial model was relatively fundamental; however, provided a basis for comparison of the tank test results. Should the results compare relatively well, then the numerical model could be improved, and used as a design development and optimisation tool for further advancement of the WEC.
The scale WEC model and flume were analysed directly (i.e. at the same physical size as testing occurred in the tank) using ANSYS CFX through a transient, homogenous, multiphase simulation. The numerical model included the working section of the flume and the collection reservoir, with the beach modelled as a slope rising up before the collection reservoir. Solitary waves were generated using a moving wall (moving mesh) at the boundary between the supply reservoir and the working section, where the wedge was located in the experimental tests. The pressure results from the previous simulation run were used as an input for subsequent runs, to capture the pressure build-up in the numerical WEC. A wedge drop was not simulated at this stage, as slamming is a highly complex phenomenon to capture accurately in numerical models.21–24 Future iterations of the WEC may be studied using any method of numerical wave generation, and therefore with limited time and computational power, it was decided that the moving wall method was suitable at this early stage in the design process. The model of the WEC and flume is shown in Figure 5.
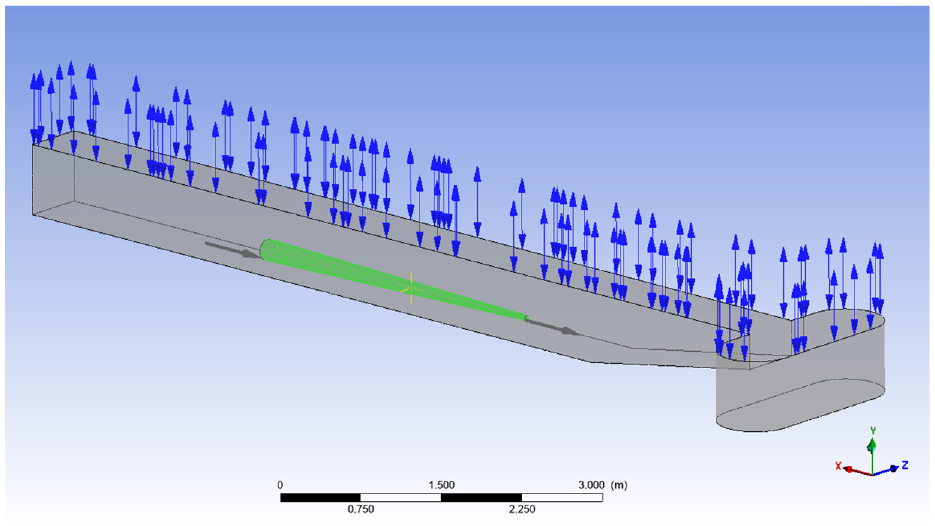
The WEC and flume modelled in ANSYS CFX.
The density of water was 997 kg/m3, density of air was 1.185 kg/m3, and the temperature both air and water were 20°C. The analysis was run for a total time of 7 s, with 0.025 s timesteps. The total simulated time was enough to determine there was little wave reflection occurring after the wave had overtopped the beach. The time step was deemed to provide enough detail in the solution without requiring an excessive amount of computational time.
The upper surface of the flume was defined as an opening, with a zero gradient pressure condition, to allow air to move in an out of the fluid region while the volume fraction of air and water are in a state of flux. The wall, at the boundary of the supply reservoir and the working section (far left in Figure 5), was given an initial velocity in the negative x-direction, creating waves. The rest of the flume tank was defined as smooth, no slip walls. The non-return valves were simulated using openings with a pressure constraint, such that flow would not enter the ensuing compartment until the specified pressure was reached. This pressure value was determined for the non-return valves used in the tank through assessment of the valve swing door mass and area.
The volume fractions of air and water, during initial condition setup, were defined as a function of height. A displacement diffusion mesh motion model was used which preserves the relative mesh distribution of the initial mesh. The mesh stiffness was defined by a function such that regions of smaller element size experienced higher stiffness to prevent mesh folding occurring. A RANS solver with the Shear Stress Transport turbulence model was used. 25 Pressure monitoring points were defined in the same location as the pressure sensors were installed in the physical model.
Mesh sensitivity study
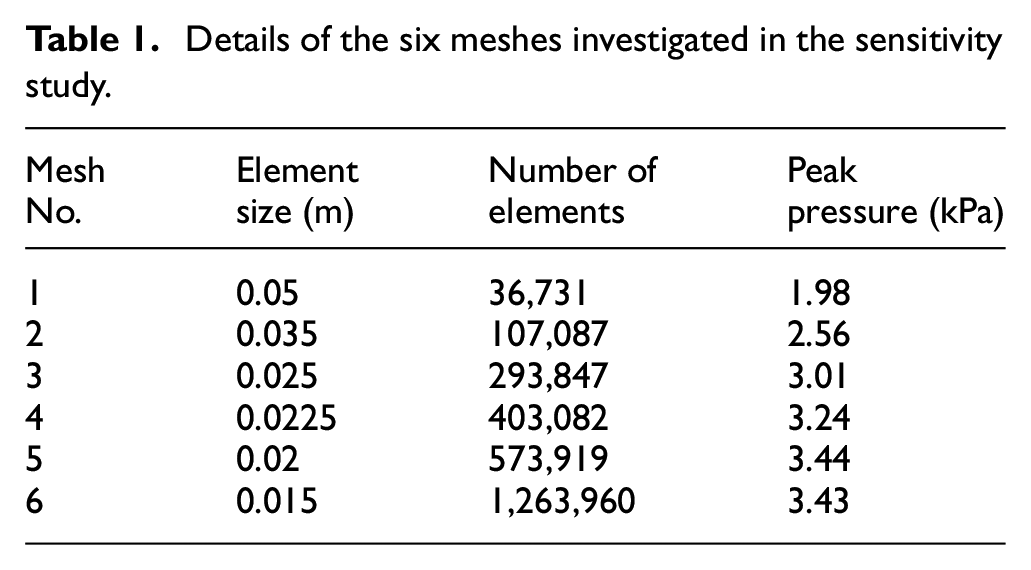
A mesh sensitivity study was carried out. A hex dominant mesh was utilised, as the simulation tended to fail unless the first half of the domain (i.e. the moving mesh region) were hexahedral elements. The element size was varied for the study. No inflation layers have been included in the simulation at this early stage of development. Six mesh sizes were generated with the peak pressure in compartment one used as the comparison. The key mesh parameters are shown in Table 1, with the results of the sensitivity study illustrated in Figure 6.
Details of the six meshes investigated in the sensitivity study.
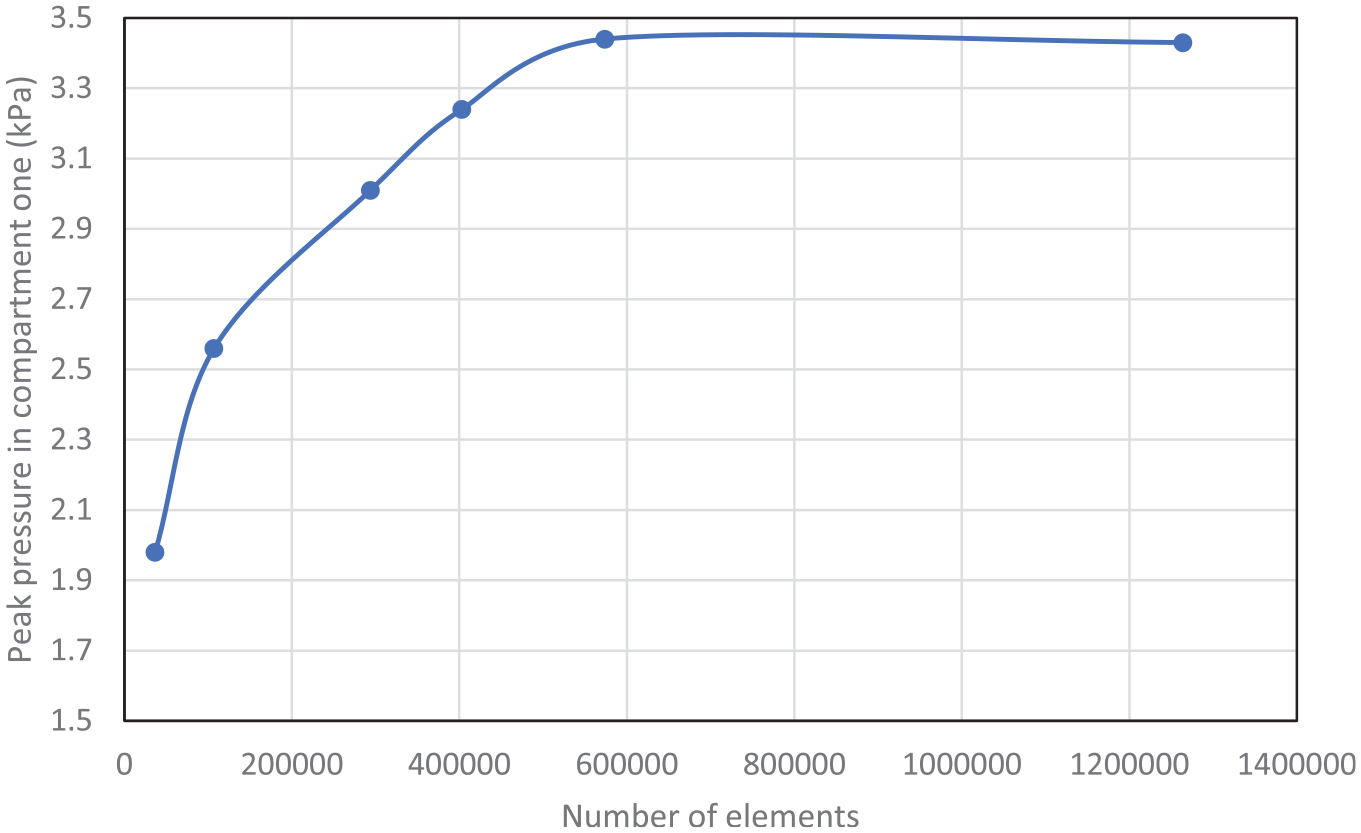
Convergence of the mesh sensitivity study.
The mesh chosen to continue the simulations was Mesh 5, with a total of589,088 nodes and573,919 elements. The model took around 60 min to run for a single wave (a full 7 s simulation), on a desktop PC with an intel i7-8700k 3.7 GHz processor and 64 GB RAM, using all six cores.
Results
The results of the experimental testing and numerical simulation are considered separately initially, followed by a short comparison. The results are then used in a brief case study in the discussion section.
Experimental testing
The wavemaker generated consistent solitary waves of 0.1 m in height, 0.84 m in length and travelling at a speed of approximately 1.02 m/s. Generation of a wave is shown in Figure 7. The beach worked well, with the tank calming completely in less than 2 min between tests.
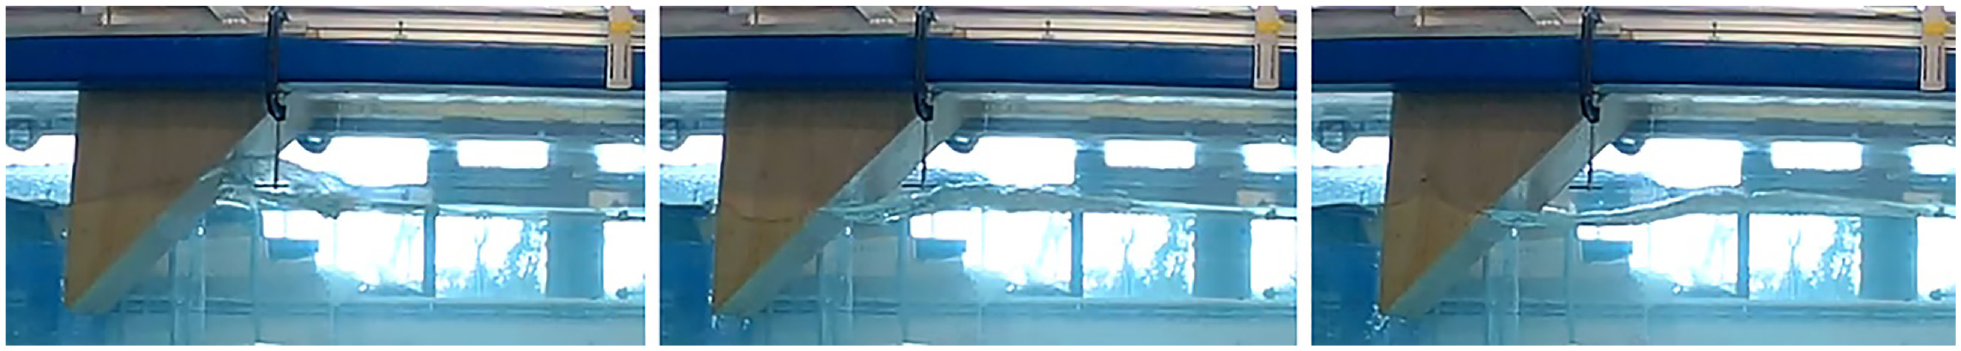
Wave generation sequence.
The device was positioned vertically in the tank such that the inlet was orthogonal to the bottom and the main force of the wave entered the first non-return valve, Figure 8. With the device resting on the base of the tank, the generated wave was not powerful enough to open the first non-return valve. While the water level in the tank could be dropped, this carried with it an increased risk of damage to the tank; and while the wedge could be dropped from a greater height this resulted in a less well-constituted wave. It was therefore decided that raising the device was a better option. Figure 8 shows the first non-return valve and section of tube. The wave approaching the device is indicated, as is the location of the first pressure sensor.
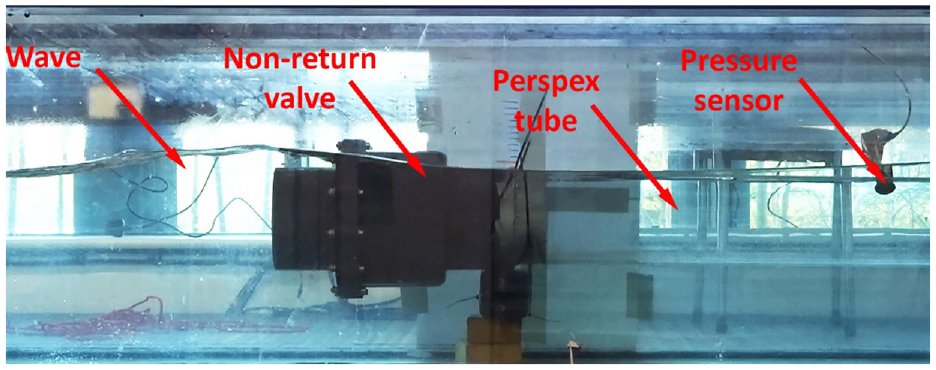
The initial non-return valve showing the wave approaching the device, the Perspex tube and the first pressure sensor.
As discussed in Section 2.1, the pressure sensors supplied had a maximum limit of 5 bar (500 kPa), with an accuracy of ±0.5 kPa. The initial results of the CFD analysis indicated that pressure changes would be in the region of 1–2 kPa, and therefore accuracy of 0.5 kPa was far from ideal. This has resulted in less-than-ideal data. The main aim of the work, however, was to assess whether the device captured energy, and this was still achievable with the 5 bar pressure sensors. One pressure sensor was faulty and collected no data, therefore information was only provided for compartments 1 and 2 of the WEC. Figure 9 shows the raw data from build-up of pressure in compartments 1 and 2 through a period of just over 30 min of testing. A total of 10 waves were generated over this test period. The stepped nature of the plot is due to the ±0.5 kPa accuracy of the pressure sensors, and hence the data recorded. It can be observed that the pressure in compartment one (the orange line) is initially higher than that of compartment two. As the waves are sent down the tank this increases, and subsequently the pressure is released into compartment two, with the pressure being equal in both compartments after 10 min. The pressure in compartment two the continues to build, as the energy captured in compartment one is transferred through the non-return valve. At the end of the test period, the pressure in compartment two is higher than that in compartment one, indicating the device is working as planned and is capturing energy.
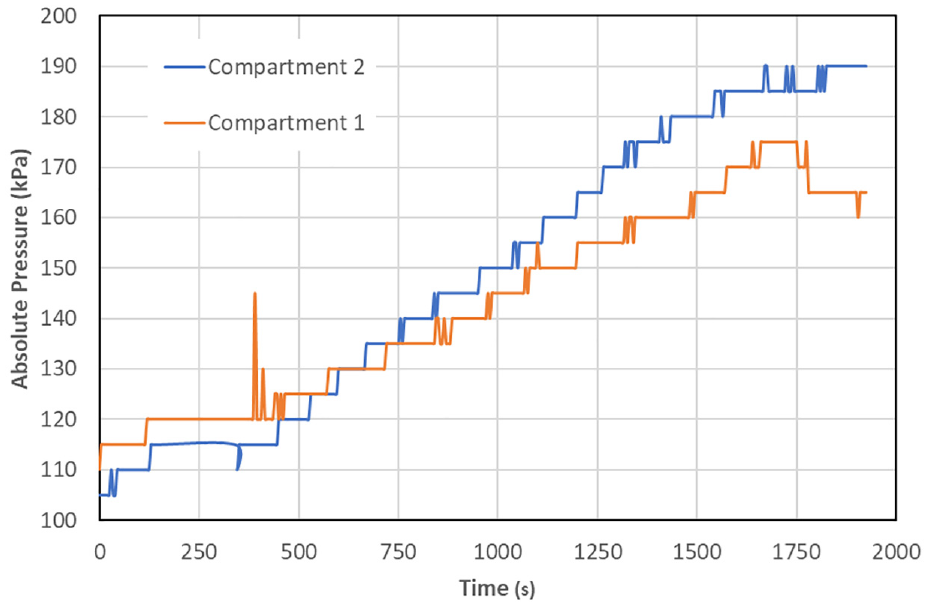
Pressure build up in compartments one and two over 30 min of testing – raw data representation.
The pressure output from compartment 3 was assessed through measurement of the height of the water inside the flexible hose attached to the final non-return valve, Figure 10. The 188 mm increase in water height shown in Figure 10 equates to a hydrostatic pressure of 1.84 kPa, which results in an absolute pressure of 103.17 kPa. The instance shown in Figure 10 was the result of an earlier round of testing than that illustrated in Figure 9, with fewer waves. Once the water in the flexible tube reached a height of 750 mm (a hydrostatic pressure of 7.36 kPa) the water was fed back into the collection reservoir of the tank.
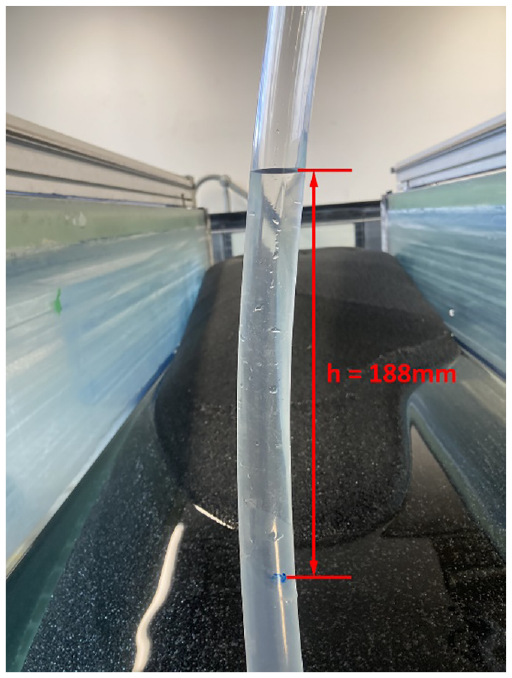
Pressure head in flexible hose attached to final non-return valve.
The testing was carried out over 2 days. When the assembly was left overnight, with some pressure in the compartments, a pressure drop in both compartments and the flexible hose was seen the following morning. This indicates that there was some pressure leakage in the assembly. Investigation into this leakage suggested that it was due to a combination of factors; the seals between tubes not being 100% pressure tight, and the pressure sensors themselves. Despite being advised that the pressure sensors were suitable for use in a submerged environment, measurements became erratic towards the end of the second day of testing and upon disassembly of the device the sensors were found to be flooded (including the wiring and connections). Future tests, with a larger budget, should use better quality sensors for more accurate results over a longer test period. It was also noticed that the angle of the device (front to back) affected the ability of the non-return valves to hold pressure. The door seals, on the first non-return valve in particular, were fairly heavy for the small volume of water moving through. While they opened satisfactorily with the device positioned vertically near the water surface, and thus in the main force of the waves, the small pressure increase once the first waves had passed was not enough to seal the valve. The device was therefore tilted longitudinally by a few degrees, to provide gravitational assistance to close the doors when the pressure in each compartment was lower. This may not need to be done at full scale, as the pressure in the compartments may be greater or the non-return valve design could be optimised.
The results of the testing indicated that the device did capture energy from the generated waves as evident from the recorded build-up of pressure in each compartment as well as the observed pressure head in the flexible tube attached to the final non-return valve. The maximum hydrostatic pressure measured in the flexible tube at the end of the assembly over the total course of testing was 9.78 kPa before overflow occurred.
Numerical modelling
The aim of the numerical model was to provide a basis of comparison with the physical test results, and to see if there was potential for use of a numerical model in future design optimisation of the WEC.
Figure 11 shows the WEC as modelled in ANSYS CFX, replicating the experimental setup, with the coloured contours showing the pressure build up under a wave. Higher pressure is indicated in red, through to lower pressure in blue. It should be noted that the dark blue region represents the air in this multiphase analysis. Pressures were monitored in both compartments one and two, as in the physical model, and outside the device in the tank.
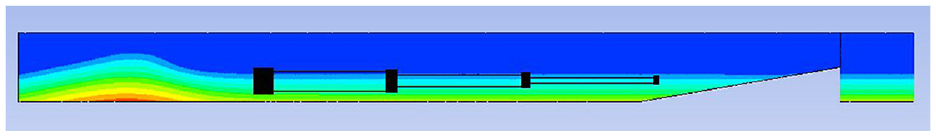
The experimental set up replicated in ANSYS CFX.
Figure 12 shows some initial results of the CFD analysis, monitoring the pressure both inside compartment one and outside the WEC. The method used to create the non-return valves was deemed to be effective, with pressure build up being captured inside the compartment. The initial wave generated with the moving wall had a height of 0.21 m, a length of 2.12 m and a speed of 1.22 m/s. The change in internal pressure in the compartment after one wave had passed was 0.7 kPa.
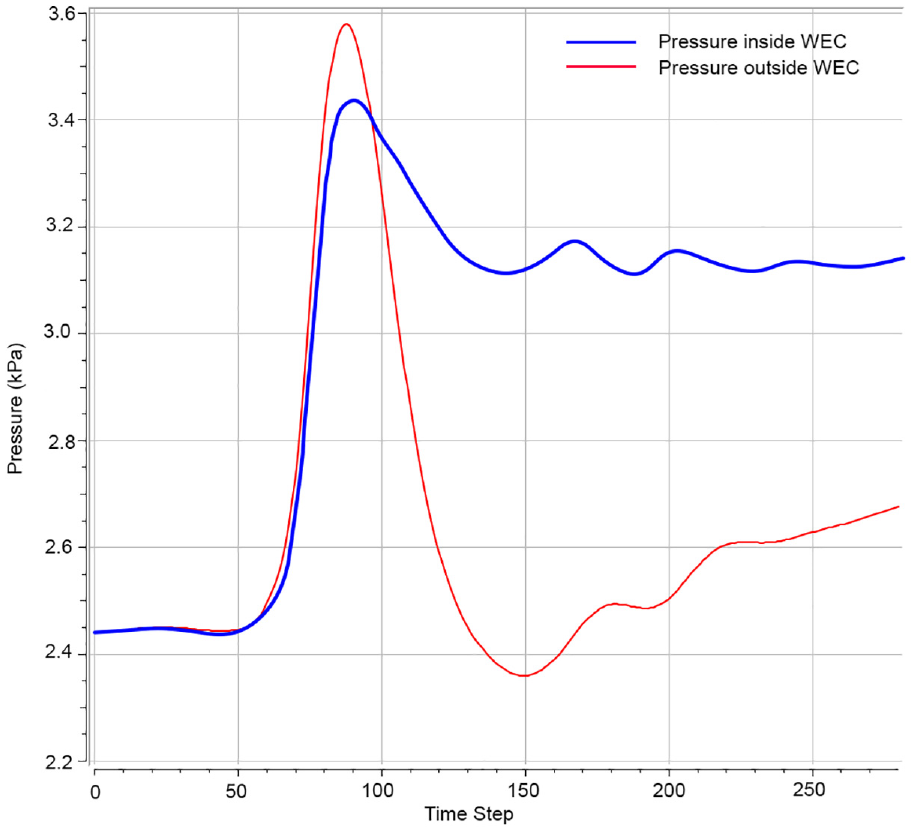
Initial results from the numerical model illustrating pressure captured, and held, inside the WEC.
The simulation was tuned so that the parameters of the generated wave were similar to those of the waves created in the physical tests.
Comparison of experimental and numerical results
A comparison of typical simulated results and experimental results is shown in Figure 13. The graph shows the pressure measured inside compartment one as a wave passes for the experimental test, and at the same location in the numerical model. It also shows the pressure measured outside the WEC in the numerical model. Due to limited budget and equipment, it was not possible to measure the open water pressure during the physical tests. While, at first glance, it seems that the numerical model underpredicted the pressure, it should be recalled that the pressure sensors had an accuracy of ±0.5 kPa. The corresponding error bars are shown on the experimental testing plot in red. Considering the potential for error, the results compare relatively well, with a similar increase in pressure as the wave enters the tube. There is a larger pressure drop seen in the physical tests once the wave has passed when compared to the numerical model. This is due to the numerical perfection of the CFD simulation; whereas, in reality, there was some pressure leakage around the pressure sensors and the tube joints. It can be noted, however, that some pressure increase was retained in both the experiment and the numerical simulation. This shows that the WEC concept does indeed capture energy that could be used to pump water/generate electricity.
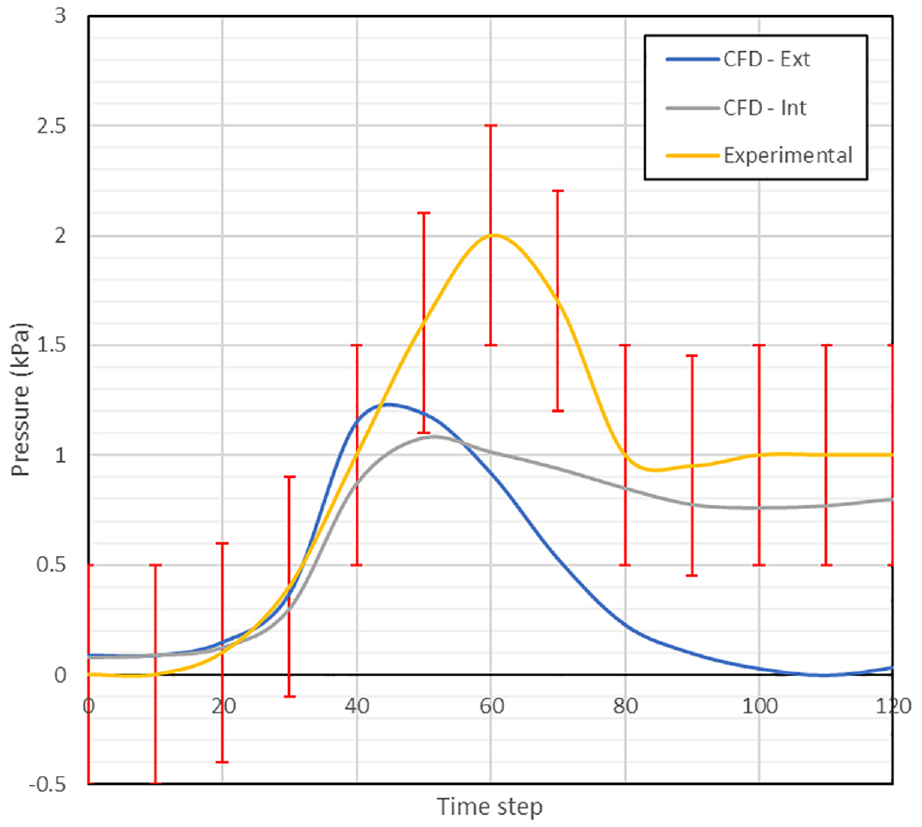
Comparison of typical results between the numerical model and experimental tests. Error bars for the pressures sensors in the experimental tests are shown in red.
In the numerical study, the viscous interactions between the seabed and the wave orbital velocities were not resolved. This would likely result in an underestimation of the energy lost due to friction, and the wave amplitudes of shallow water waves are likely to have been over-predicted. The WEC has been designed to be located in the very near-shore region, that is, on the beach (Figure 1) the effect of this could be significant. Future investigation may wish to incorporate slip wall conditions, to better understand this effect, using a Boussinesq system. The novel Boussinesq approach developed by Israwi et al. 26 for a shallow water wave system which uses asymptotic techniques under the assumption of small bathymetric variations, would be appropriate.
Discussion
Both the physical tests and numerical simulation indicated that the WEC concept does capture energy. It has been shown that the 10th scale device captures, in the region of, 0.7–1 kPa of pressure per wave once all compartments are up to pressure. Considering the flow rate through the final non-return valve, with a pressure differential of 0.7 kPa, the device captures around 2.39 W of power per wave. This proportion of captured power is related to the internal width of the first tube; that is, a wave width of 154 mm for the 1/10th scale device. The theoretical power in a wave of height 0.1 m, of unit width 1 m, and of period of 0.83 s is 8.11 W; however, this assumes deep water. Amrutha and Sanil Kumar 27 state that wave power estimated using a deep water assumption is around 10% more than shallow water wave power. The theoretical energy in the test wave therefore becomes 7.30 W. The efficiency of the scale device is therefore 32.7%.
In terms of a case study, Ushant Island has been used. Ushant is island is currently off grid and relies heavily on diesel generators to meet energy requirements. Ushant is planning to shift away from fossil fuels towards more secure, sustainable and less expensive sources of energy. The island already utilises solar and tidal power.28,29 The Island’s location off the North West tip of France, in the Atlantic Ocean, means it has a reasonable wave climate that could be utilised. The island has an average total power demand over the course of 1 year of 9312 kW, 29 with increased demand in winter (when waves are larger). The Joint Probability table for the wave data from a location to the west of the site (48.4630 N, 5.1509 W) is shown in Table 2. 30
Joint Probability table of wave data for the site west of Ushant Island.


A power matrix has been developed for the Ushant Island site for the full-scale WEC concept assessed in this work, Table 3. When generating the power matrix, the wave power was calculated as for a deep water wave, reduced by 10% to approximate a shallow water wave and then multiplied by the WEC device efficiency of 32.7%. The initial data was in terms of peak period, which was altered to produce wave energy period though use of a coefficient that depends on the wave spectrum shape. For this region, the JONSWAP spectrum is valid, with the associated coefficient being 0.9. 31 The wave height was also taken into account, with power from waves greater than the diameter of the device entrance (1.6 m) being reduced proportionally to the amount of wave that could physically enter the device.
Power matrix for the concept WEC at the Ushant Island site.
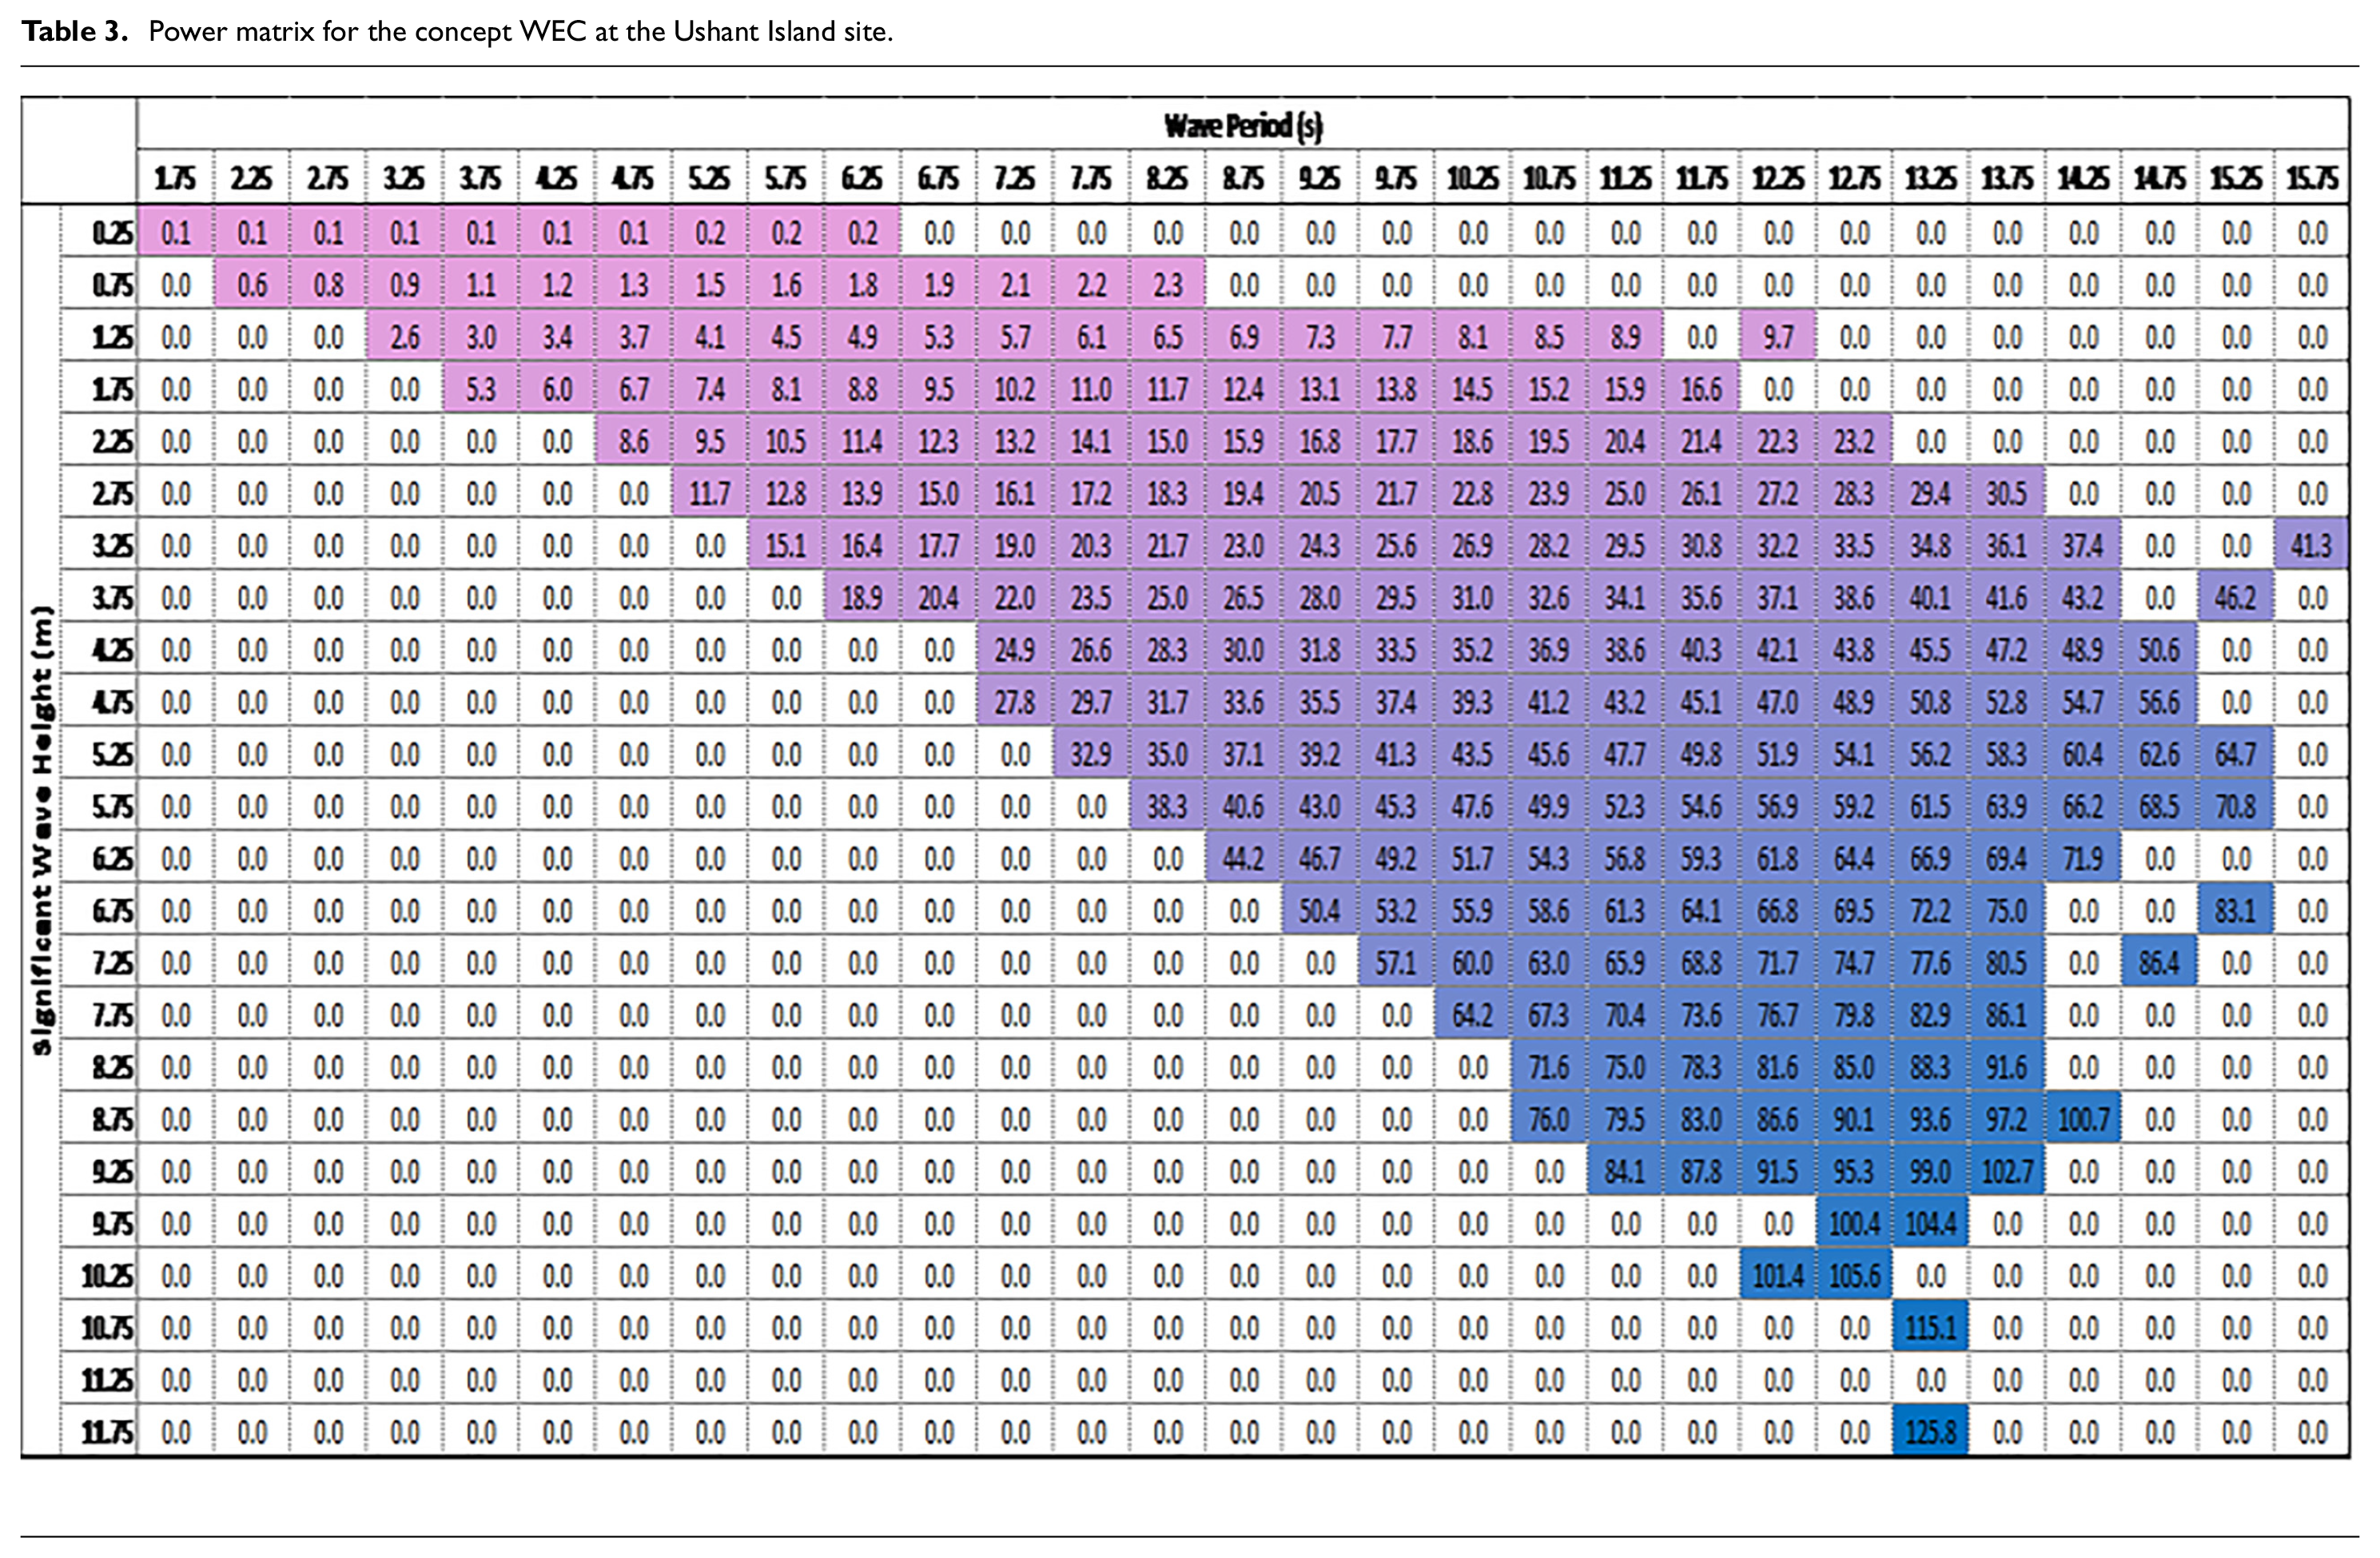
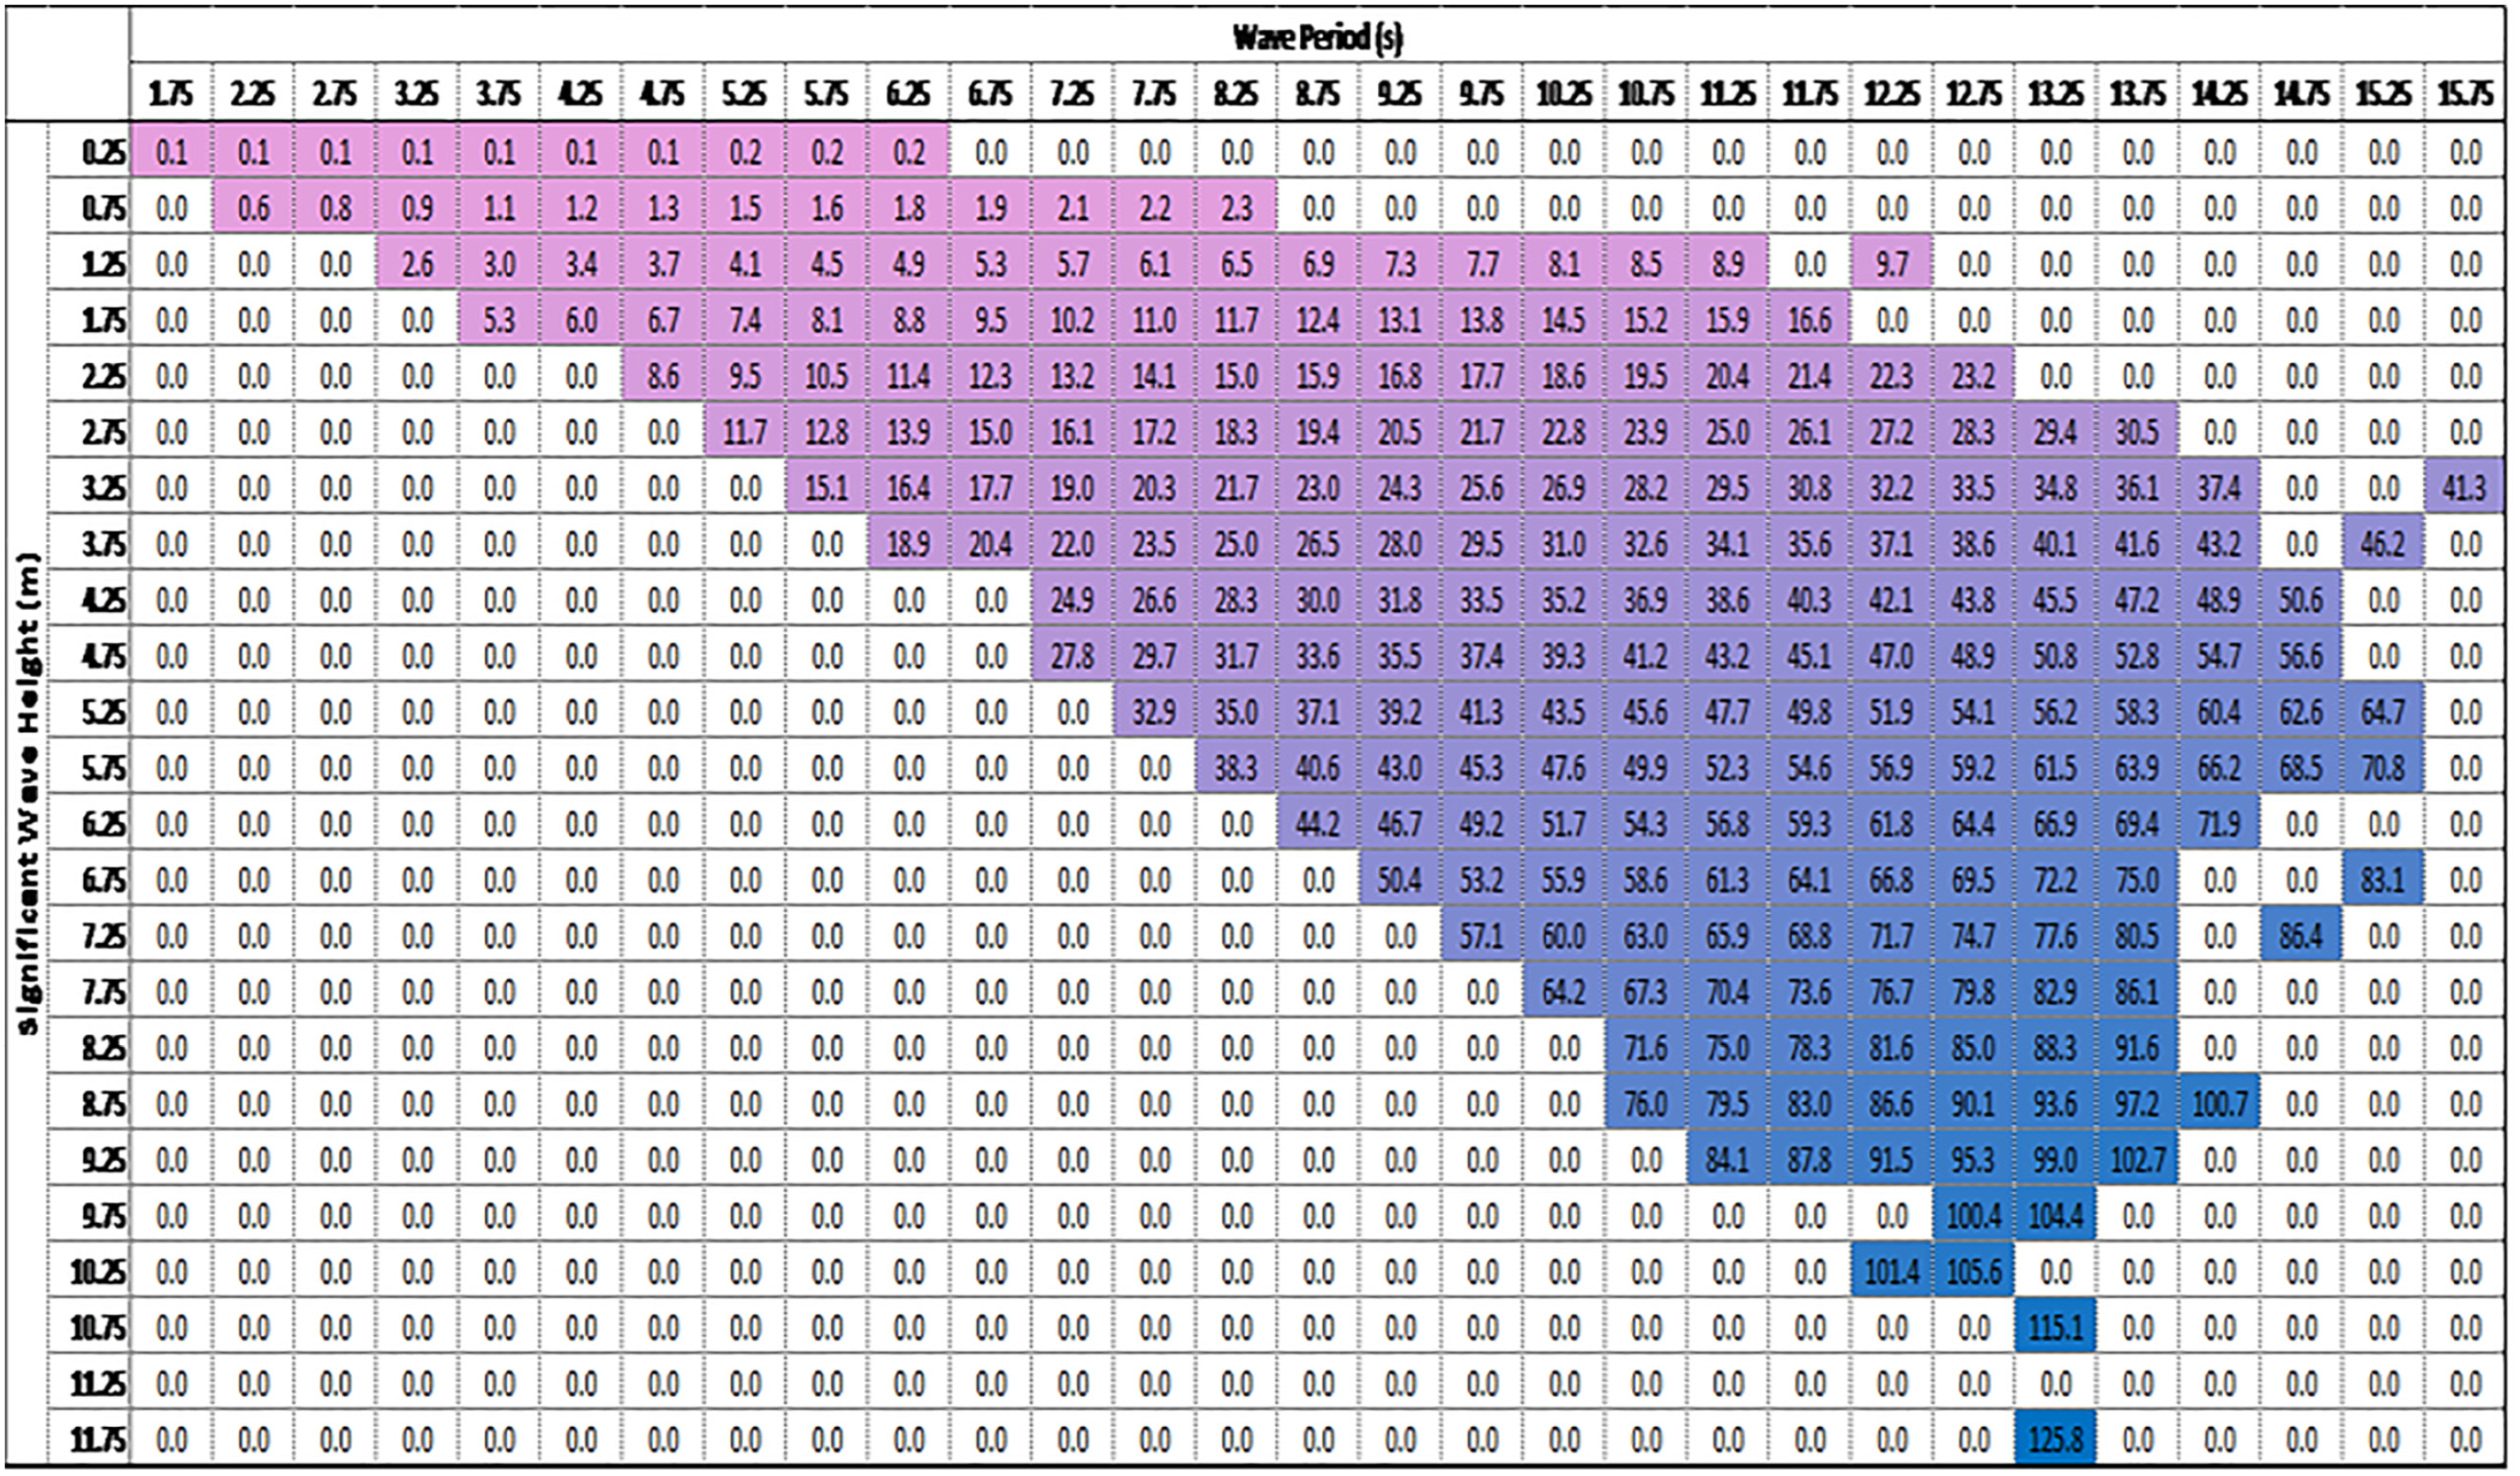
The full-scale device is capable of generating a total of just over 58.0 MWh of power per year in these conditions. The maximum power is generated by waves of Hs = 11.75 m and Te = 13.25 s; however, such waves are less common. The most frequently occurring wave is one of Hs = 1.75 m and Te = 5.75 s, where the full-scale device would generate a steady 6.1 kW. It should be noted that the energy capture is based on the test device, which was at a very early stage of development and not optimised.
Considering the improvements that could be achieved through the use of tapered pipes (as per the original design), to take advantage of the Venturi Effect, bespoke, tuneable non-return valves to ensure the pressure in the previous compartment reaches a higher value before being let through to the subsequent compartment. The smaller non-return valves would be tuned to tolerate higher pressures before opening to achieve this. Further research into the optimal type of non-return valve for the system should be undertaken. Improved physical testing, in a wave sediment tank (e.g.), alongside an optimised model with better suited pressure sensors, would provide greater understanding as to the actual performance of the device. The numerical model could then be enhanced and optimised, compared to the improved physical test results and ultimately used as a design tool for the overall development of the device to full scale trials. It is evident that some of these suggestions may involve components that are not readily available off-the-shelf. As such, one of the key aims of the simplistic device would not be met; however, economies of scale may negate this in future if the optimised device could provide enough power to assist energy security in remote communities. Another concern is that of scour, in regions where the seabed is comprised of sand/sediment. A device in such a location would experience shifts in the seabed topography around it which may also lead to modified performance or even to it becoming inoperative, depending on the local flow/wave conditions. One final matter is that of marine fouling, and whether this would cause a problem with sealing of the non-return valves. This would directly affect the performance of the device if it was not able to hold enough pressure to perform adequately, thereby further reducing the efficiency of the device. Consultation with experts indicated that there is currently no method to prevent this occurring. There is the possibility that a planned maintenance regime may be able to mitigate the issue of marine fouling and potential scour issues, although this would come at an additional cost.
The novel WEC assessed in this work has been shown to capture power through a series of tapered (or reduced diameter) pipes and non-return values through which pressure from the incoming waves builds up and can be used to power a variety of devices at the output. The device is located in the near-shore region; however, does not create an eyesore like many breakwater mounted devices, as the majority of it (if not all) is submerged. The location in the near-shore region is likely to reduce installation and O&M costs, even with the addition of a possible maintenance regime to mitigate marine fouling and scour. The concept device has been shown to capture energy, with more work required to optimise the design for larger scale testing, and improve the numerical model through the incorporation of slip wall conditions and a constant wave train.
Conclusions
A novel, near shore, WEC device which utilises off-the-shelf parts and is simple to maintain has been developed. The aim of the work was to undertake a feasibility study to assess the device and its suitability to provide energy security for remote communities. The device consists of a series of tapered tubes, connected with non-return valves, which create a pressure build up in the system as a result of the waves moving over the device. Experimental testing of a 1/10th scale device was carried out at the University of Exeter and the results compared to those generated through an initial numerical model developed in ANSYS CFX with reasonable agreement. It was found that the novel WEC concept did capture energy as a wave passed through the device, indicating the potential for use as a method of renewable energy generation. An initial case study indicated that the device has the ability to be part of the energy mix for remote island communities.
Problems were encountered in trying to source tuneable non-return valves and tapered pipe as off-the-shelf parts; neither were available. Other basic off-the-shelf equipment was used for the tests, but this resulted in a pressure drop over time as components were not ideally suited for the application. This negates the aim for ease of maintenance and could drive the cost of the device up, as bespoke parts would be required for operation, although economies of scale may help alleviate this issue. Another concern was around the build-up of marine fouling internally, although the possibility of a planned maintenance regime may mitigate it.
Future work should focus on improvements to the scale model, utilising bespoke parts if necessary, and optimised testing in a suitable facility. The numerical model can be enhanced alongside the testing, in particular including assessment of slip wall conditions, and again compared directly to the results. Should the optimised design prove more efficient, there is potential for the device to be used as a method of renewable energy generation in the future.
Footnotes
Declaration of conflicting interests
The author declared no potential conflicts of interest with respect to the research, authorship, and/or publication of this article.
Funding
The author disclosed receipt of the following financial support for the research, authorship, and/or publication of this article: The work was funded through the EPSRC Supergen Offshore Renewable Energy (ORE) Hub [EP/S000747/1].